

Flexural Capacity of the Normal Sections of Concrete Beams Strengthened with Corrugated Steel Plates
by
 , ,
, ,
Xianda Feng
1,
Dejun Liu
2,*,
Xiao Long
3,
Kang Duan
4,
Jianping Zuo
2,
Wei Liu
2 and
Haiyang Dong
2 1
School of Civil Engineering and Architecture, University of Jinan, Jinan 250024, China
2
School of Mechanics and Civil Engineering, China University of Mining and Technology, Beijing 100083, China
3
Sichuan Dujiangyan Water Conservancy Development Center, Dujiangyan 611830, China
4
School of Civil Engineering, Shandong University, Jinan 250101, China
*
Author to whom correspondence should be addressed.
Buildings 2024, 14(5), 1398; https://doi.org/10.3390/buildings14051398
Submission received: 29 March 2024
/
Revised: 26 April 2024
/
Accepted: 8 May 2024
/
Published: 13 May 2024
(This article belongs to the Section Building Structures)
Abstract
:To explore the law of load-carrying performance enhancement of concrete beams reinforced with corrugated steel plates (CSPs), three groups of controlled bending tests were conducted on five beam specimens. The load-bearing capacity of concrete members commensurately increased with the thickness of reinforcing flat and corrugated steel plates. Additionally, for the same amount of steel, the load-bearing capacity of concrete beams improved more with CSP reinforcement than with reinforcement with flat steel plates. Accordingly, a theoretical formula for the moment of inertia of the combined section of a CSP-reinforced concrete beam was derived. Comparison verification showed that the calculation results for the beams reinforced with CSPs of different thicknesses were highly accurate. Finally, based on the damage mode of the CSP-reinforced concrete beam specimens, a formula for calculating the flexural bearing capacity of the positive cross-section of the beam with corrugated steel reinforcement was established. The calculated values agreed with the experimental values, which validated the flexural load capacity theory pertaining to positive sections and the flexural capacity model for reinforced beams.
1. Introduction
Corrugated steel, a new type of structure with light density, high strength, and strong deformability, has been widely used in the fields of culverts, bridge reinforcements, tunnel supports, and comprehensive pipeline corridors [1,2,3,4]. The strengthening mechanism of corrugated steel lies in its waveform structure, which improves the bearing capacity while preventing stress concentration. Moreover, corrugated steel largely exhibits good coordination of longitudinal deformation and strong application prospects. Therefore, in recent years, considerable research has been conducted on the mechanical properties and reinforcement mechanisms of corrugated steel structures. For example, multiple studies explored the shear strength, ultimate bearing capacity, damage mode, and stress–strain distribution law of corrugated steel members using theoretical derivation, experimental analysis, and numerical simulation and offered a practical formula for the calculation of the load-carrying capacity of corrugated steel members [5,6,7,8,9,10,11,12,13,14]. Sun et al. [15] proposed a novel corrugated steel structure with square steel pipe reinforcement, and based on a dependent project, they studied the mechanical deformation performance of corrugated steel structures using scaled-down tests. Wang et al. [16] designed an axially tensile and compressive corrugated steel plate (CSP) damper based on the excellent mechanical properties of corrugated steel. According to a comparison with test results, the proposed equation can ensure safety and is not too conservative; hence, it is suitable for engineering applications. Ye et al. [17] constructed a reasonable corrugated steel evaluation system and a structural fuzzy evaluation model using orthogonal experimental design and fuzzy mathematical methods, respectively. Additionally, corrugated steel, as an assembled support structure, can greatly reduce the size of the initial support structure, which is convenient for on-site installation and improves the construction efficiency, and has achieved good application results in engineering applications [18,19,20,21,22,23].
Corrugated steel, whether used in isolation or combined with other materials, exhibits good reinforcing properties, and scholars have proposed the use of corrugated steel in beam reinforcement systems. For example, Zhang et al. [24] tested the bending performance and ductility of an H-beam with a corrugated web and concluded that the stress distribution of the combined structure complies with the assumption of a flat cross-section. He et al. [25] improved the structural performance of continuous beams under the action of arching moments, proposed a combination of beams with partially wrapped corrugated webs, and analyzed the bending behavior of beams under the action of symmetric loading at two points. Shahmohammadi et al. [13] used finite element analysis to conduct linear elastic buckling and nonlinear analyses of corrugated web steel link beams to investigate the strengthening effect of corrugated webs on the beam structure. Xie et al. [26] used the prestressing conditions, number of shear connectors, and effective width of the flange plate as parameters to investigate the bending performance of a new type of prestressed outsourced corrugated steel–concrete combination beam.
Corrugated steel structures can also play a strong synergistic bearing role in composite support structures formed with concrete materials. For example, Kang and Davidson [27] studied corrugated steel pipe concrete linings, used finite element analysis and a detailed soil model to evaluate the structural effect of corrugated steel pipe concrete lining, and proposed a design method for corrugated steel pipes lined with concrete. Liu et al. [28] proved that the commutative section method and elementary beam theory of material mechanics can be used to analyze the corrugated steel–concrete composite structure. Beam theory can be used to analyze corrugated steel–concrete composite structures. Song et al. [29] explored the bond-slip behavior between the interface of CSPs and concrete, and based on the concept of failure energy, they established the bond-slip intrinsic model of corrugated steel–concrete. Xia et al. [30] proposed a corrugated steel–concrete composite semicircular arch using indoor tests and concluded that increasing the number of studs and concrete strength can effectively strengthen the composite effect of corrugated steel and concrete. Zhong [31] proposed a new type of corrugated steel pipe–concrete–steel pipe member, performed damage form observations and analysis of the working mechanism, and investigated the influence of multiple factors on the axial compression and pure bending mechanical properties of the member.
Although scholars have conducted research on the mechanical properties and reinforcement effects of corrugated steel, few studies have been reported on the reinforcement of concrete beams using CSPs. Therefore, this study explored the load-carrying performance enhancement law and orthotropic bending capacity of beams with corrugated steel–concrete members. First, basic theoretical research was performed on corrugated steel–concrete beam structures by conducting a four-point bending test on CSP-reinforced concrete beams, and the load-carrying performance enhancement law of corrugated steel–concrete beams was explored. Second, a formula for calculating the moment of inertia of the CSP combined section was developed based on the test results. Finally, the CSP damage mode was established based on the cross-sectional analysis method using a specimen of corrugated steel–concrete beams and the damage mode of corrugated steel–concrete members. Finally, based on the cross-section analysis method and the damage mode of CSP-reinforced concrete beam specimens, a formula for calculating the flexural load capacity of CSP-reinforced beams in a normal section was established and theoretically verified.
2. Test Overview
2.1. Specimen Design and Fabrication
To investigate the mechanical properties of CSP-reinforced concrete beams and their bending capacity enhancement compared to those reinforced with flat steel plates, five concrete beam specimens with a length of 2000 mm, width of 200 mm, and height of 300 mm were fabricated. The unreinforced beams were labeled as RCBs; those reinforced with flat steel plates with thicknesses of 3.5 and 6 mm were labeled as SPCB-T3.5 and SPCB-T6.0, respectively; and those reinforced with CSPs with thicknesses of 3 and 5 mm were labeled as CSPCB-T3.0 and CSPCB-T5.0, respectively. Different thicknesses were used for the two control groups of specimens SPCB-T3.5 and CSPCB-T3.0 and specimens SPCB-T6.0 and CSPCB-T5.0 to ensure that the steel used for the two types of steel plates was different from that used for the other types of concrete beams. The amount of steel used in the two steel-plate materials remained constant.
The upper concrete structures of the five specimens were symmetrically reinforced, as shown in Figure 1. The longitudinal and hoop reinforcements of the specimens were all made of soomth steel bars with a yield strength of 300 MPa. The diameter of the longitudinal reinforcement was 10 mm, and the diameter of the hoop reinforcement was 8 mm, and both of them formed a reinforcement cage by tying. To prevent damage to the diagonal cross-section during the test, the hoop bars in the curved shear section of the specimen were encrypted to strengthen the diagonal cross-section shear capacity. In addition, to prevent the lower reinforcement from pulling out, it was designed with vertical bends, and the reinforcement cages of the five specimens were consistent, as shown in Figure 2. According to the literature [32], if the height of the peg is excessively low, it can easily pull out and become damaged; however, the specification clearly stipulates that the peg height-to-diameter ratio should not be less than 4 [33]. Therefore, to ensure a complete shear connection, ML15 pegs were selected with a diameter of 10 mm, a height of 100 mm, a tensile yield strength of 422 MPa, and an ultimate tensile yield strength of 525 MPa [34]. The flat and corrugated steel plates used in the tests were grade Q235, and the steel plates were connected to the concrete beams by monolithic casting after the pegs were welded. Davies [35] showed that the spacing of shear connectors has no effect on the load-carrying capacity of fully shear-connected, CSP-reinforced, and flat steel-plate-reinforced beams. Therefore, to prevent shear damage at the steel–concrete interface, the pegs of the entire interface were evenly spaced and placed in a uniformly encrypted arrangement. The interval length was 1950 mm, and the spacing of the bolts was 150 mm. Five specimens were commissioned by the specimen production company for the construction of different concrete forms in accordance with the specimen production drawings. The concrete used was C30, and it was delivered from the commercial concrete station and had an average compressive strength of 32.7 MPa.
2.2. Specimen Loading and Measurement Points
The five specimens were supported beam specimens loaded at two three-equivalent points by means of a manually controlled hydraulic jack through a distributor beam. Roller bearings were used at both ends of the distributor beams. Fixed and sliding hinge bearings were used at each end of the beam specimen. The specific specimen loading method and the arrangement of the measurement points are shown in Figure 3. Strain gauges C1–C7 were used to measure the concrete strains in the midspan section to verify that the normal section of the specimen conformed to the flat section assumption, whereas gauges C9 and C10 were used to measure the strains at the top and bottom of the specimen in the midspan section to determine whether the steel plate or concrete yielded or crushed. Strain gauges R1–R6 were used to measure the strain of the longitudinal reinforcement in the loaded and midspan sections (three sections in total) to determine the mechanical state of the reinforcement and validate the theoretical analysis. Displacement gauges L1, L2, and L3 were used to observe the deflection change along the longitudinal direction of the specimen, and gauges L4 and L5 were used to monitor the settlement of the specimen at the support. The test loading process is illustrated in Figure 4.
3. Test Results and Analysis
3.1. Test Phenomena
Crack initiation and propagation constantly appeared during the test loading process. Because crack evolution is a characteristic of structural damage, the crack morphology was traced with a black marker pen during the test, and the total load of the hydraulic jack was indicated next to the crack, as shown in Figure 5.
When the RCB specimen was loaded with a total load of approximately 20 kN, a slight tearing sound was heard, but no cracks were observed. With increased loading, cracks appeared in both loading sections of the beam. At 43 kN, a crack appeared in the pure bending section adjacent to the right loading section. At 48 kN, a shorter crack appeared in the right flexural shear section. At 55 kN, a crack appeared in the midspan section. Eventually, the specimen was damaged owing to the crushing of the concrete at the top of the beam in the right loading section.
When the SPCB-T3.5 specimen was loaded with a total load of approximately 28 kN, a slight tearing sound was heard, followed by cracks in the right loading section. At 60 kN, cracks appeared in the midspan section. At 72 kN, two cracks appeared in the left loading section. At 79 kN, cracks appeared in the right loading section. At 105 kN, cracks appeared in the left flexural shear section. At 141 kN, oblique cracks appeared in the right flexural shear section. At 143 kN, oblique cracks appeared in the left flexural shear section. Eventually, the beam was destroyed owing to the crushing of the right loading section.
When the SPCB-T6.0 specimen was loaded with a total load of approximately 33 kN, a slight tearing sound was heard, followed by cracks in the pure bending section against the left loading section; however, no crack development was observed. At 75 kN, the concrete fell slightly in the right loading section. At 79 kN, the concrete slightly fell in the left loading section. At 90 kN, cracks appeared near both loading sections. At 101 kN, cracks appeared in the left flexural shear section. At 136 kN, cracks appeared in the right section. At 166 kN, cracks appeared in the left flexural shear section. At 179 kN, oblique cracks appeared in the right flexural shear section. Eventually, the beam collapsed owing to the crushing of the left loading section, and damage occurred.
When the CSPCB-T3.0 specimen was loaded with a total load of approximately 70 kN, cracks appeared in the pure bending section against the left loading section. At 90 kN, oblique cracks appeared in the right flexural shear section. At 110 kN, cracks appeared in the midspan, left loading, and right loading sections, but they did not develop significantly. Finally, the specimen was damaged, as indicated by the crushing of the concrete in the right loading section.
When the total load of the CSPCB-T5.0 specimen was approximately 130 kN, cracks appeared in the midspan, right flexural shear, and two loading sections. At 220 kN, two cracks appeared in the pure bending section, and one crack appeared in the left flexural shear section. The cracks appeared earlier in the pure bending and right flexural shear sections of the beam and subsequently in the left flexural shear section. At a later stage of loading, multiple parallel oblique cracks appeared in the beam web, which was divided into several inclined compression columns. Eventually, the beam-column body was crushed, and the specimen was damaged.
During the test period, the timing of crack generation, degree of expansion, and characteristics of the cracks were different for the five specimens. By comparing the changes in the crack evolution of the five specimens in terms of their different characteristics during the loading process, the laws summarized in Table 1 can be drawn.
3.2. Load–Deflection Curve
The load–deflection curve at the midspan interface is plotted for half of the total load, as shown in Figure 6. In this study, concrete beams were selected to be close to the minimum reinforcement ratio of suitable reinforcement beams with good plastic deformation space. The deflection curves of the two types of reinforced beams exhibited essentially the same trend, and the stress process occurred in two stages. The first stage was the elastic stage, where the deflection exhibited linear growth, indicating good overall working performance. The second stage was the elastoplastic stage, where the internal stress was redistributed and the neutral axis of the composite section gradually moved upward with increasing load, thus reducing the stiffness of the composite section and accelerating the deflection. At the later stage of loading, when the bearing capacity of the reinforced beam specimen reached the ultimate state, the specimen was damaged, and the bearing capacity decreased rapidly. As shown in Figure 6, the steel-plate reinforcement effectively increased the bearing capacity of the concrete beam. When the concrete strain reached 0.0033, the load-bearing capacity of SPCB-T6.0 was 53% higher than that of SPCB-T3.5, and the load-bearing capacity of CSPCB-T5.0 was 40% higher than that of CSPCB-T3.0, indicating that the load-bearing capacity of the composite beam increased with steel-plate thickness. For the same amount of steel used, the load-bearing capacity of CSPCB-T3.0 was 16% higher than that of SPCB-T3.5, and the load-bearing capacity of CSPCB-T5.0 was 6% higher than that of SPCB-T6.0, indicating that the CSPs were more effective than the flat plates in improving the load-bearing performance of the concrete beam. This is mainly because the corrugation height existed in the height direction of the CSP, which shifted the plastic neutral axis of the reinforced beam downward, thereby increasing the plastic flexural capacity of the normal section of the reinforced beam. The CSPCB-T5.0 did not perform as well as the SPCB-T6.0, with the same amount of steel used in the early stage of loading, and returned to normal in the late stage of loading because the corrugated steel pier used in the test was customized according to the G-corrugated steel with a thickness of 3.0 mm. Thus, the CSPCB-T5.0 and corrugated steel pier contact surface did not completely fit in the early stage of loading, which affected the mechanical properties. However, with the deformation under force, the contact surfaces gradually fit together, and the mechanical properties returned to normal.
3.3. Load–Strain Curve
The distribution of concrete strains in the midspan section of the specimen along the beam height direction is shown in Figure 7. During the loading process, the concrete beam was severely cracked under tension, and the two strain gauges on the lower side were out of range and pulled out; thus, no strain data were obtained. According to the strain distribution in the cross-section, the strains in the midspan sections of the five beams were linearly distributed along the height direction, and they all satisfied the assumption of a flat section.
Figure 8a shows the load–strain curves of the lower reinforcement in the midspan section of each specimen. The maximum strain of the lower reinforcement in the RCB specimen was close to 0.02, and the entire loading process always maintained a tensile state until it reached yielding. A comparison of the strain magnitudes of the five specimens reveals that steel-plate reinforcement can effectively reduce the strain of the lower reinforcement. With increasing steel-plate thickness, the strain of the lower reinforcement continued to decrease; however, the lower reinforcement remained in the yield state, which indicates that an increase in the thickness of the steel plate can effectively reduce the deformation of the lower reinforcement and thus improve the load-carrying capacity of the combined beam. With the same amount of steel used, the strain reduction in the lower bars of CSP-reinforced concrete beams exceeded that of concrete beams strengthened with flat steel plates, which made the lower bars less likely to yield and increased the load-bearing capacity of the composite beam, indicating that the effect of the reinforcement with CSPs was better than that with flat steel plates.
Figure 8b shows the strain in the upper reinforcing bars in the midspan section of each specimen. At the beginning of the stress process, the upper reinforcing bars of the RCB specimen remained in the compressive state; however, they gradually transitioned to the tensile state as the plastic neutral axis shifted upward across the upper reinforcing bars. The upper reinforcing bars of the reinforced specimen were in a compressive state, and with an increase in the steel-plate thickness, the strain increased and transitioned from an unyielding to a yield state. With the same amount of steel used, the strain increases in the upper reinforcing bars of the concrete beams strengthened with CSPs exceeded those of the concrete beams strengthened with flat steel plates. This indicates that the CSPs shifted the neutral axis of the composite beam downward, increased the pressure height of the concrete, made full use of the load-bearing capacity of the upper compressed reinforcing bars, and increased the load-bearing capacity of the composite beam.
The load–strain curve at the midspan interface of the steel plate is shown in Figure 8c. For both flat and CSPs, with increasing steel plate thickness, the strain of the specimens decreased as the plate strength decreased, and the load-bearing capacity of the composite beam increased. For the same amount of steel, the strain of the CSP-reinforced specimen was smaller than that of the flat steel-plate-reinforced specimen, indicating that compared to a flat steel plate, a reinforcing CSP is difficult to yield in the full cross-section, and it is more effective in improving the load-carrying capacity of the reinforced beam.
4. Theory of Concrete Beams Strengthened with CSPs
4.1. Theory of Inertia Moment of Composite Section
Because the corrugated steel part comprises multiple circular arcs and oblique straight-line segments, mathematical analysis based on the real situation is difficult to conduct. Therefore, in this study, corrugated steel was described using a simple cosine function for theoretical analysis according to the principle of area consistency, as shown in Figure 9. According to Zhang [36], the concrete material can be modeled as a single medium (corrugated steel) material using the commutative section method, as shown in Figure 10. The moment of inertia of the combined section was determined based on the following assumptions:
- (1)
- The contact surfaces of the steel plate and concrete exhibited the same strain and deformation compatibility.
- (2)
- Before and after the transformation, the joint forces in the section acted at the same location.
- (3)
- Before and after the transformation, the centroid and inertia moments were the same.
The composite section inertia moment is equal to the sum of the inertia moments of the corrugated steel and concrete transformation section with respect to the centroid axis of the composite section. The moment of inertia of the concrete transformation sections with respect to the X-axis is determined via Equations (1)–(4); the composite section inertia moment with respect to its centroid axis is determined via Equations (5)–(7); and the composite section inertia moment with respect to its centroid axis is determined using Equations (8)–(10).
where is the height of the concrete compression zone (mm); is the corrugated steel upper side corrugation function (mm); is a function of the lower side of the concrete transition section (mm); is the corrugation function of the lower side of the corrugated steel (mm); is the wave height of corrugated steel (mm); is the thickness of the CSP after conversion (mm); is the moment of inertia of the corrugated steel with respect to the coordinate axis X (mm4); is the corrugated steel cross-section area (mm2); is the width of the beam (mm); is the moment of inertia of the corrugated steel with respect to its own shaped mandrel (mm4); is the moment of inertia of the blank region at the bottom of the concrete transition section with respect to the coordinate axis X (mm4); is the concrete conversion cross-section area (mm2); is the equivalent width of the beam (mm); is the height of the concrete beam (mm); is the combined cross-section conversion factor; is the cross-sectional area of the concrete (mm2); is the value of the center of gravity of the concrete section (mm); is the concrete area of the rectangular area (mm2); is the concrete section of the filling area (mm2); is the concrete area of the infill area (mm2); is the value of the center of the concrete form in the rectangular region (mm); is the center of gravity of the combined section (mm); and is the moment of inertia of the combined section with respect to its center of form (mm4).
The properties of the composite section of the beam strengthened with CSPs of different thicknesses were calculated using the theoretical equation of the inertia moment of the composite sections of the CSPs derived in this study, as presented in Table 2. The results obtained from the calculation theory for the inertia moment of the composite sections of CSPs were consistent with the computer-aided design (CAD) calculation results, with a maximum deviation of 0.269%, indicating that the calculation theory for the inertia moment of the composite sections of CSPs presented in this study is highly accurate. As the thickness of the CSP increased, the moment of inertia of the composite sections of concrete beams strengthened with CSPs increased, indicating that in practical engineering, the load-bearing capacity of the member can be increased by increasing the corrugated steel thickness. For the same amount of steel used, the composite section inertia moment of concrete beams strengthened with CSPs was approximately 23% higher than that of concrete beams strengthened with flat steel plates. This is mainly because the corrugation height of the CSP is in the height direction of the plate, which generates the composite section inertia moment of concrete beams strengthened with CSPs. The reinforcement effect of CSPs is better than that of flat steel plates; thus, CSPs are appropriate for use in practical applications where the project height restriction is relaxed.
4.2. Theory of Flexural Capacity of Normal Section
- (1)
- In this study, the analysis of the one-time stress plastic flexural capacity of concrete beams strengthened with CSPs was based on the subsequent assumptions.
- (2)
- The entire stress process in the composite structure conforms to the assumption of a flat section, as shown in Figure 11.
- (3)
- Spalling and slippage at corrugated steel and concrete material interfaces are not negligible.
- (4)
- The mechanical effects of concrete in the tensile area are negligible.
- (5)
- When the concrete is crushed, the concrete strain in the compressed area is uniformly distributed over a rectangular area.
- (6)
- The corrugation height is small compared to the height of the composite section; thus, the strain value at the horizontal centroid axis of the CSP can be used as the strain value of the full section of the CSP for calculation, and the strain value at the centroid is determined by the strain value.
Figure 11.
Schematic of flat section assumptions.

Engineering designs are generally conservative and commonly reduce the level of material performance to ensure safety. In this study, design values were not used without special instructions in accordance with the subject-to-practice principle. Constitutive relations were adopted for the concrete and steel calculations (CSPs and reinforcing bars) [26]. See Figure 12.
As shown in Equation (11), under normal conditions, the upper reinforcing bars of the reinforced beam are in tension, and the lower bars are in compression. The plastic neutral axis is located between the upper and lower bars.
From the perspective of material strength, our CSP was mainly made of Q235 mild steel with strong plasticity and high elongation to produce molding [37], and the yield strength of the lower reinforcement had to be higher than that of the CSP. From the spatial location, the CSP was located at the lowest side of the reinforced beam, and the distance from the plastic neutral axis was necessarily larger than that of the lower reinforcement. Therefore, the CSP should yield before the lower reinforcement, and the upper reinforcement should be in the yield state during normal design. To summarize, the CSP-reinforced beam should satisfy Equation (12).
When normal section bending damage occurs, the equilibrium equation and ultimate bending moment (normal section flexural capacity) can be obtained from the stress balance, as expressed in Equation (13).
When , the upper reinforcing bars yield, and the lower bars and CSP do not yield. The stress state is expressed as follows:
When , the upper reinforcing bars and CSP yield, and the lower bars do not yield. The stress state is expressed as follows:
When , the upper reinforcing bars, lower reinforcing bars, and CSP yield. The stress state is expressed as follows:
When , the lower reinforcing bars and CSP yield, and the upper reinforcing bars do not yield. The stress state is expressed as follows:
With the design principle of utilizing the material capacity to the greatest extent possible when the ultimate state is reached, the height of the pressure area should satisfy Equation (18).
At this point, the concrete in the tensile area should be neglected. In accordance with the ultimate state design of the bearing capacity, the design value should satisfy Equation (19).
where is the thickness of CSP (mm); is the distance from the center of the lower reinforcement to the lower edge of the concrete in the tension zone in the rectangular area (mm); is the distance from the center of the upper reinforcement to the upper edge of the concrete in the compression zone (mm); is the ultimate compressive strain of concrete; is the modulus of elasticity of the CSP (MPa); is the yield stress value of the steel plate (MPa); is the modulus of elasticity of the lower reinforcement (MPa); is the yield stress value of the lower reinforcement (MPa); is the value of yield stress of the upper reinforcement (MPa); is the modulus of elasticity of the upper reinforcement (MPa); is the equivalent rectangular stress adjustment factor, considered as 1.0 for C30; is the standard value of the axial compressive strength of concrete; is the height adjustment factor for an equivalent rectangular compression zone, considered as 0.8 for C30; is the value of stress in the upper reinforcement (MPa); is the cross-sectional area of the upper reinforcement (mm2); is the cross-sectional area of the lower reinforcement (mm2); is the value of the stress in the lower reinforcement (MPa); is the CSP stress value (MPa); is the bending moment limiting value, the orthotropic section plastic bending capacity (N·mm); is the design value of compressive strength of concrete (MPa); is the design value of the yield strength of the lower reinforcement (MPa); is the design value of yield strength of the lower reinforcement (MPa); is the design value of bending moment, orthotropic section bending capacity (N·mm); and T, , , , and have the same meaning as above.
4.3. Validation
The calculated results were compared with the mechanical test results to validate the theoretical analysis of the flexural capacity of the normal section. As shown in Table 3, the maximum error rate between the mechanical test values and the analytical theory values for the four steel-plate-reinforced beam specimens was 5.1%, and the remaining values were within 4.0%, which verifies that the analytical theory is reasonable and indicates that the cross-section analysis method can be used for the structural analysis of CSP and flat steel-plate-reinforced beams.
5. Conclusions
Four-point flexure experiments were performed on concrete beams strengthened with CSPs to analyze the law of load-bearing performance improvement of such beams. The calculation theory for the inertia moment of the composite section and that for the plastic flexural capacity of the normal section of corrugated steel composite beams were derived and verified. The following conclusions are drawn:
- (1)
- CSPs can significantly improve the flexural capacity of concrete beams, and their reinforcement effect is superior to that of flat steel plates.
- (2)
- CSPs can effectively increase the downward movement space of the plastic neutral axis of reinforced beams. The stress height of the concrete increases so that the load-bearing performance of the upper compression reinforcing bar can be fully utilized. Additionally, this makes the lower bars and CSP difficult to yield, or the CSP difficult to yield in the full section.
- (3)
- The theoretical calculation formula for the moment of inertia of a combined section of CSP-reinforced beams and the analytical, theoretical value of the formula for the flexural capacity of concrete beams with corrugated steel reinforcement in the positive section were both in good agreement with the value of the four-point bending test and exhibited high accuracy. This shows that the proposed analytical theory of CSP-reinforced beams is reasonable and can be applied in practical engineering.
Author Contributions
Conceptualization, D.L.; Methodology, X.F. and D.L.; Validation, W.L.; Formal analysis, K.D.; Investigation, X.L.; Data curation, H.D.; Writing—original draft, X.F.; Writing—review & editing, K.D.; Supervision, D.L. and J.Z.; Funding acquisition, D.L. and J.Z. All authors have read and agreed to the published version of the manuscript.
Funding
This study was substantially supported by The National Key R&D Program of China (No. 2023YFB2390300), the National Natural Science Foundation of China (Nos. 52379102 and 51878658), the Joint Fund of the State Key Laboratory of Coal Resources and Safe Mining and the Beijing Outstanding Young Scientist Program [grant numbers SKLCRSM20LH03, BJJWZYJH01201911413037], and The Fundamental Research Funds for the Central Universities [grant number 2024ZKPYLJ03].
Data Availability Statement
All data generated or analyzed during this study are included in this published article.
Conflicts of Interest
The authors declare that they have no known competing financial interests or personal relationships that could have appeared to influence the work reported in this paper.
References
- Beben, D. Field Performance of Corrugated Steel Plate Road Culvert under Normal Live-Load Conditions. J. Perform. Constr. Facil. 2013, 27, 807–817. [Google Scholar] [CrossRef]
- Chen, W.Q.; Liu, B.D.; Liu, R.; Jing, L.J. Analysis of working effect of corrugated steel lining on tunnel lining fall. Tunn. Constr. 2018, 38, 384–388. [Google Scholar]
- Liu, D.J.; Zhong, F.; Huang, H.W.; Zuo, J.P.; Xue, Y.D.; Zhang, D.M. Present status and development trend of diagnosis and treatment of tunnel lining diseases. China J. Highw. Transp. 2021, 34, 178–199. [Google Scholar]
- Sun, D.W.; Liu, C.Y.; Wang, Y.Y.; Xia, Q.L.; Liu, F.Q. Static performance of a new type of corrugated steel-concrete composite shell under mid-span loading. Structures 2022, 37, 109–124. [Google Scholar] [CrossRef]
- Cao, Q.; Huang, J. Experimental study and numerical simulation of corrugated steel plate shear walls subjected to cyclic loads. Thin-Walled Struct. 2018, 127, 306–317. [Google Scholar] [CrossRef]
- Emami, F.; Mofid, M.; Vafai, A. Experimental study on cyclic behavior of trapezoidally corrugated steel shear walls. Eng. Struct. 2013, 48, 750–762. [Google Scholar] [CrossRef]
- Farzampour, A.; Laman, J.A.; Mofid, M. Behavior prediction of corrugated steel plate shear walls with openings. J. Constr. Steel Res. 2015, 114, 258–268. [Google Scholar] [CrossRef]
- Huang, M.L.; Sun, T.; Zhang, Y.Q.; Song, Y. Experimental research on mechanical properties of corrugated steel structure joint of primary support. Tunn. Constr. 2021, 41, 43–49. [Google Scholar]
- Nie, J.-G.; Zhu, L.; Tao, M.-X.; Tang, L. Shear strength of trapezoidal corrugated steel webs. J. Constr. Steel Res. 2013, 85, 105–115. [Google Scholar] [CrossRef]
- Peng, S.Q.; Fan, L.; Jiang, C.-R.; Zhou, J. Calculation and sensitivity analysis of corrugated steel bridge and culvert structure. J. Tongji Univ. (Nat. Sci.) 2005, 33, 1571–1575. [Google Scholar]
- Qiu, J.; Zhao, Q.; Yu, C.; Li, Z. Experimental Studies on Cyclic Behavior of Corrugated Steel Plate Shear Walls. J. Struct. Eng. 2018, 144, 04018200. [Google Scholar] [CrossRef]
- Rauch, A.F.; Sargand, S.M.; Hazen, G.A. Behavior of deeply corrugated steel plate in culvert. J. Struct. Eng. 1994, 120, 1651–1655. [Google Scholar] [CrossRef]
- Shahmohammadi, A.; Mirghaderi, R.; Hajsadeghi, M.; Khanmohammadi, M. Application of corrugated plates as the web of steel coupling beams. J. Constr. Steel Res. 2013, 85, 178–190. [Google Scholar] [CrossRef]
- Wang, X.R. Theoretics Analysis and Computation for Ribbed Shell Structure of 3D Ribbed Shell Plate and Concrete. Ph.D. Dissertation, Northwestern Polytechnical University, Xi’an, China, 2004. [Google Scholar]
- Sun, X.B.; Liu, B.D.; Li, C.H.; Li, T.S.; Zuo, X. Model test and numerical simulation of primary tunnel support structure using corrugated steel. Tunn. Constr. 2021, 41, 2058–2065. [Google Scholar]
- Wang, W.; Song, J.-L.; Su, S.-Q.; Cai, H.-L.; Zhang, R.-F. Experimental and numerical studies of an axial tension-compression corrugated steel plate damper. Thin-Walled Struct. 2021, 163, 107498. [Google Scholar] [CrossRef]
- Ye, L.D.; Yu, C.S.; Wu, T.X.; Li, J.J. Optimization of the Initial Support Structure form of Corrugated Steel in Mountain Tunnel. Mod. Tunn. Technol. 2020, S1, 158–164. [Google Scholar]
- Che, H.; Tong, L.; Liu, S.; Yang, Q. Field investigation on the mechanical performance of corrugated steel utility tunnel (CSUT). J. Constr. Steel Res. 2021, 183, 106693. [Google Scholar] [CrossRef]
- Li, G.F.; Ding, W.Q.; Ye, H.; Zhang, Q.Z.; Wang, Z. Study on construction Technology of corrugated steel prefabricated support structure in tunnel. Chin. J. Undergr. Space Eng. 2020, 16, 178–184. [Google Scholar] [CrossRef]
- Sun, T. Experimental Research on the Supporting Mechanism of Corrugated Steel Initial Support and the Mechanical Performance of Joints in Mined Tunnels. Master’s Thesis, Beijing Jiaotong University, Beijing, China, 2023. [Google Scholar]
- Wang, Z.; Zhang, Q.Z.; Pan, Q.; Liu, W.T.; Luo, Z.J. Construction method and mechanical characteristics of prefabricated corrugated steel shed tunnel. Chin. J. Undergr. Space Eng. 2020, 16, 185–193+207. [Google Scholar]
- Wei, D.Q. Suitability Study of Corrugated Steel Primary Lining Structure for Soft Rock Tunnel. Master’s Thesis, Chengdu University of Technology, Chengdu, China, 2021. [Google Scholar]
- Xu, J.D.; Li, G.F.; Li, L.; Jiang, H.; Li, W.H. A Preliminary Study of Assembled Corrugated Steel Arch Shed Cavern Structure. Mod. Tunn. Technol. 2018, S2, 1091–1098. [Google Scholar]
- Zhang, Z.; Li, G.Q.; Sun, F.F. Flexural behavior of the composite beam with corrugated webs. China Civ. Eng. J. 2014, 5, 34–39. [Google Scholar]
- He, J.; Liu, Y.; Chen, A.; Wang, D.; Yoda, T. Bending Behavior of Concrete-Encased Composite I-Girder with Corrugated Steel Web. Thin-Walled Struct. 2014, 74, 70–84. [Google Scholar] [CrossRef]
- Xie, M.J.; Zou, Y.; Wang, C.Q.; Qian, H.C.; Cao, L.; Chen, M. Experiment study on bending behavior of novel prestressed steel-encased concrete composite beam with corrugated steel webs. Eng. Mech. 2021, 38, 64–74. [Google Scholar]
- Kang, J.S.; Davidson, J.S. Structural effects of concrete lining for concrete-lined corrugated steel pipes. Struct. Infrastruct. Eng. 2013, 9, 130–140. [Google Scholar] [CrossRef]
- Liu, B.; Zhang, Z.; Zhang, M.; Wang, X. Experimental Study of the Mechanical Performance of Corrugated Steel Plate-Concrete Composite Structures. Int. J. Steel Struct. 2019, 19, 733–746. [Google Scholar] [CrossRef]
- Song, J.; Wang, W.; Su, S.; Wang, B.; Li, Y.; Lu, Z. Experimental investigation of the bond-slip behaviour between corrugated steel plates and concrete in CSRC structures. Constr. Build. Mater. 2021, 299, 124315. [Google Scholar] [CrossRef]
- Xia, Q.; Wang, Y.; Jelovica, J.; Liu, C.; Sun, D. Experimental study on corrugated steel–concrete composite semicircular arches under midspan loading. Structures 2022, 38, 1137–1150. [Google Scholar] [CrossRef]
- Zhong, T. Study on Axial Compression and Bending Performance of Corrugated Steel Tube-Concrete Steel Tube Member. Master’s Thesis, China University of Mining and Technology, Beijing, China, 2021. [Google Scholar]
- Wang, B.; Huang, Q.; Rong, X.L. ABAQUS-based load capacity analysis and validation of bolted joints. Sino-Foreign Highw. 2017, 37, 126–131. [Google Scholar]
- GBT 10433-2002; Cheese Head Studs for Arc Stud Welding. General Administration of Quality Supervision, Inspection and Quarantine of the People’s Republic of China: Beijing, China, 2002.
- Li, W.X. Theoretical and Experimental Study of Steel-Concrete Primary Stressed Beams with Different Degrees of Connection. Unpublished Master’s Thesis, Southeast University, Nanjing, China, 2018. [Google Scholar]
- Davies, C. Tests on Half-Scale Steel-Concrete Primary Stressed Beams with Welded Stud Connectors. Struct. Eng. 1969, 47, 29–40. [Google Scholar]
- Zhang, Z.N. Experimental Study on Mechanical Performance of CSP-Concrete Composite Structure. Master’s Thesis, Beijing Jiaotong University (BJTU), Beijing, China, 2018. [Google Scholar]
- Liao, C.Y. Research on Mechanical Properties of Prefabricated Corrugated Plate Lining in Mined Tunnel. Master’s Thesis, China University of Geosciences, Beijing, China, 2022. [Google Scholar]
Figure 1.
Schematic of the reinforcing bar sections. (a) RCB; (b) SPCB; (c) CSPCB.

Figure 2.
Distribution diagram of hooping bars.

Figure 3.
Schematics of the specimen loading and measurement points. (a) Front view; (b) cross-section at mid-span.
Figure 3.
Schematics of the specimen loading and measurement points. (a) Front view; (b) cross-section at mid-span.


Figure 4.
Test loading process.
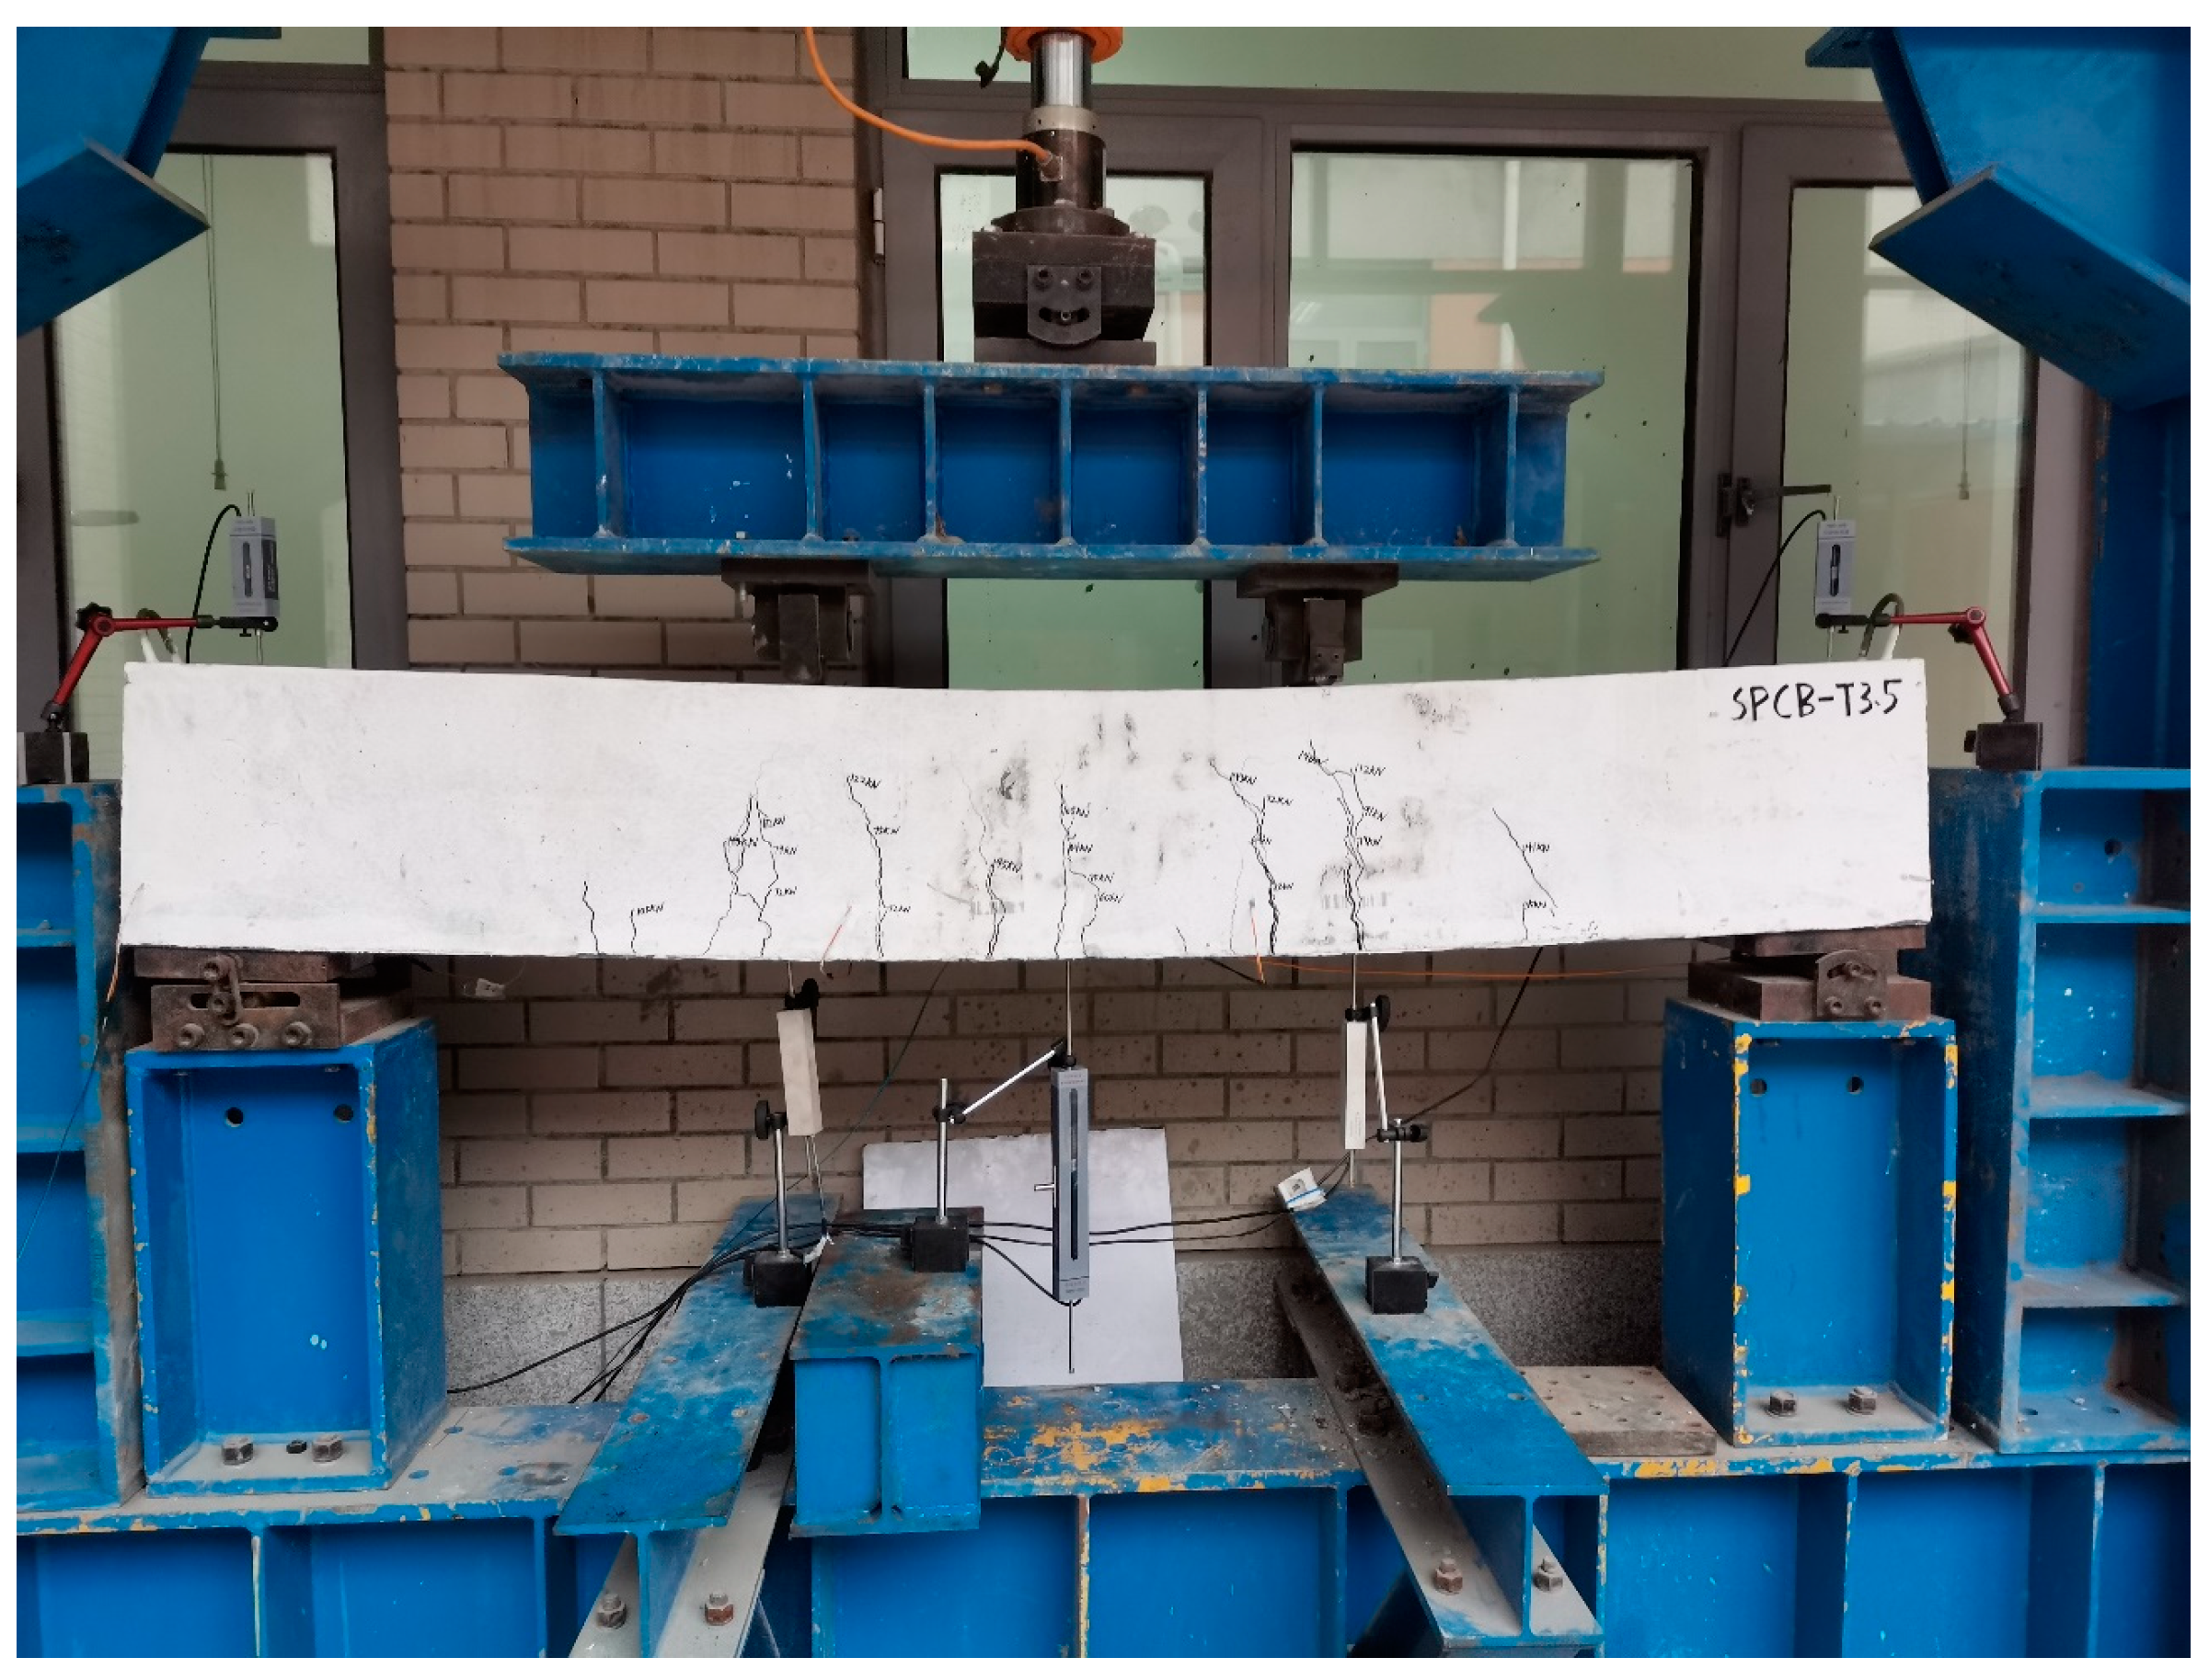
Figure 5.
Photograph of specimen damage.

Figure 6.
Beam load–deflection curve.
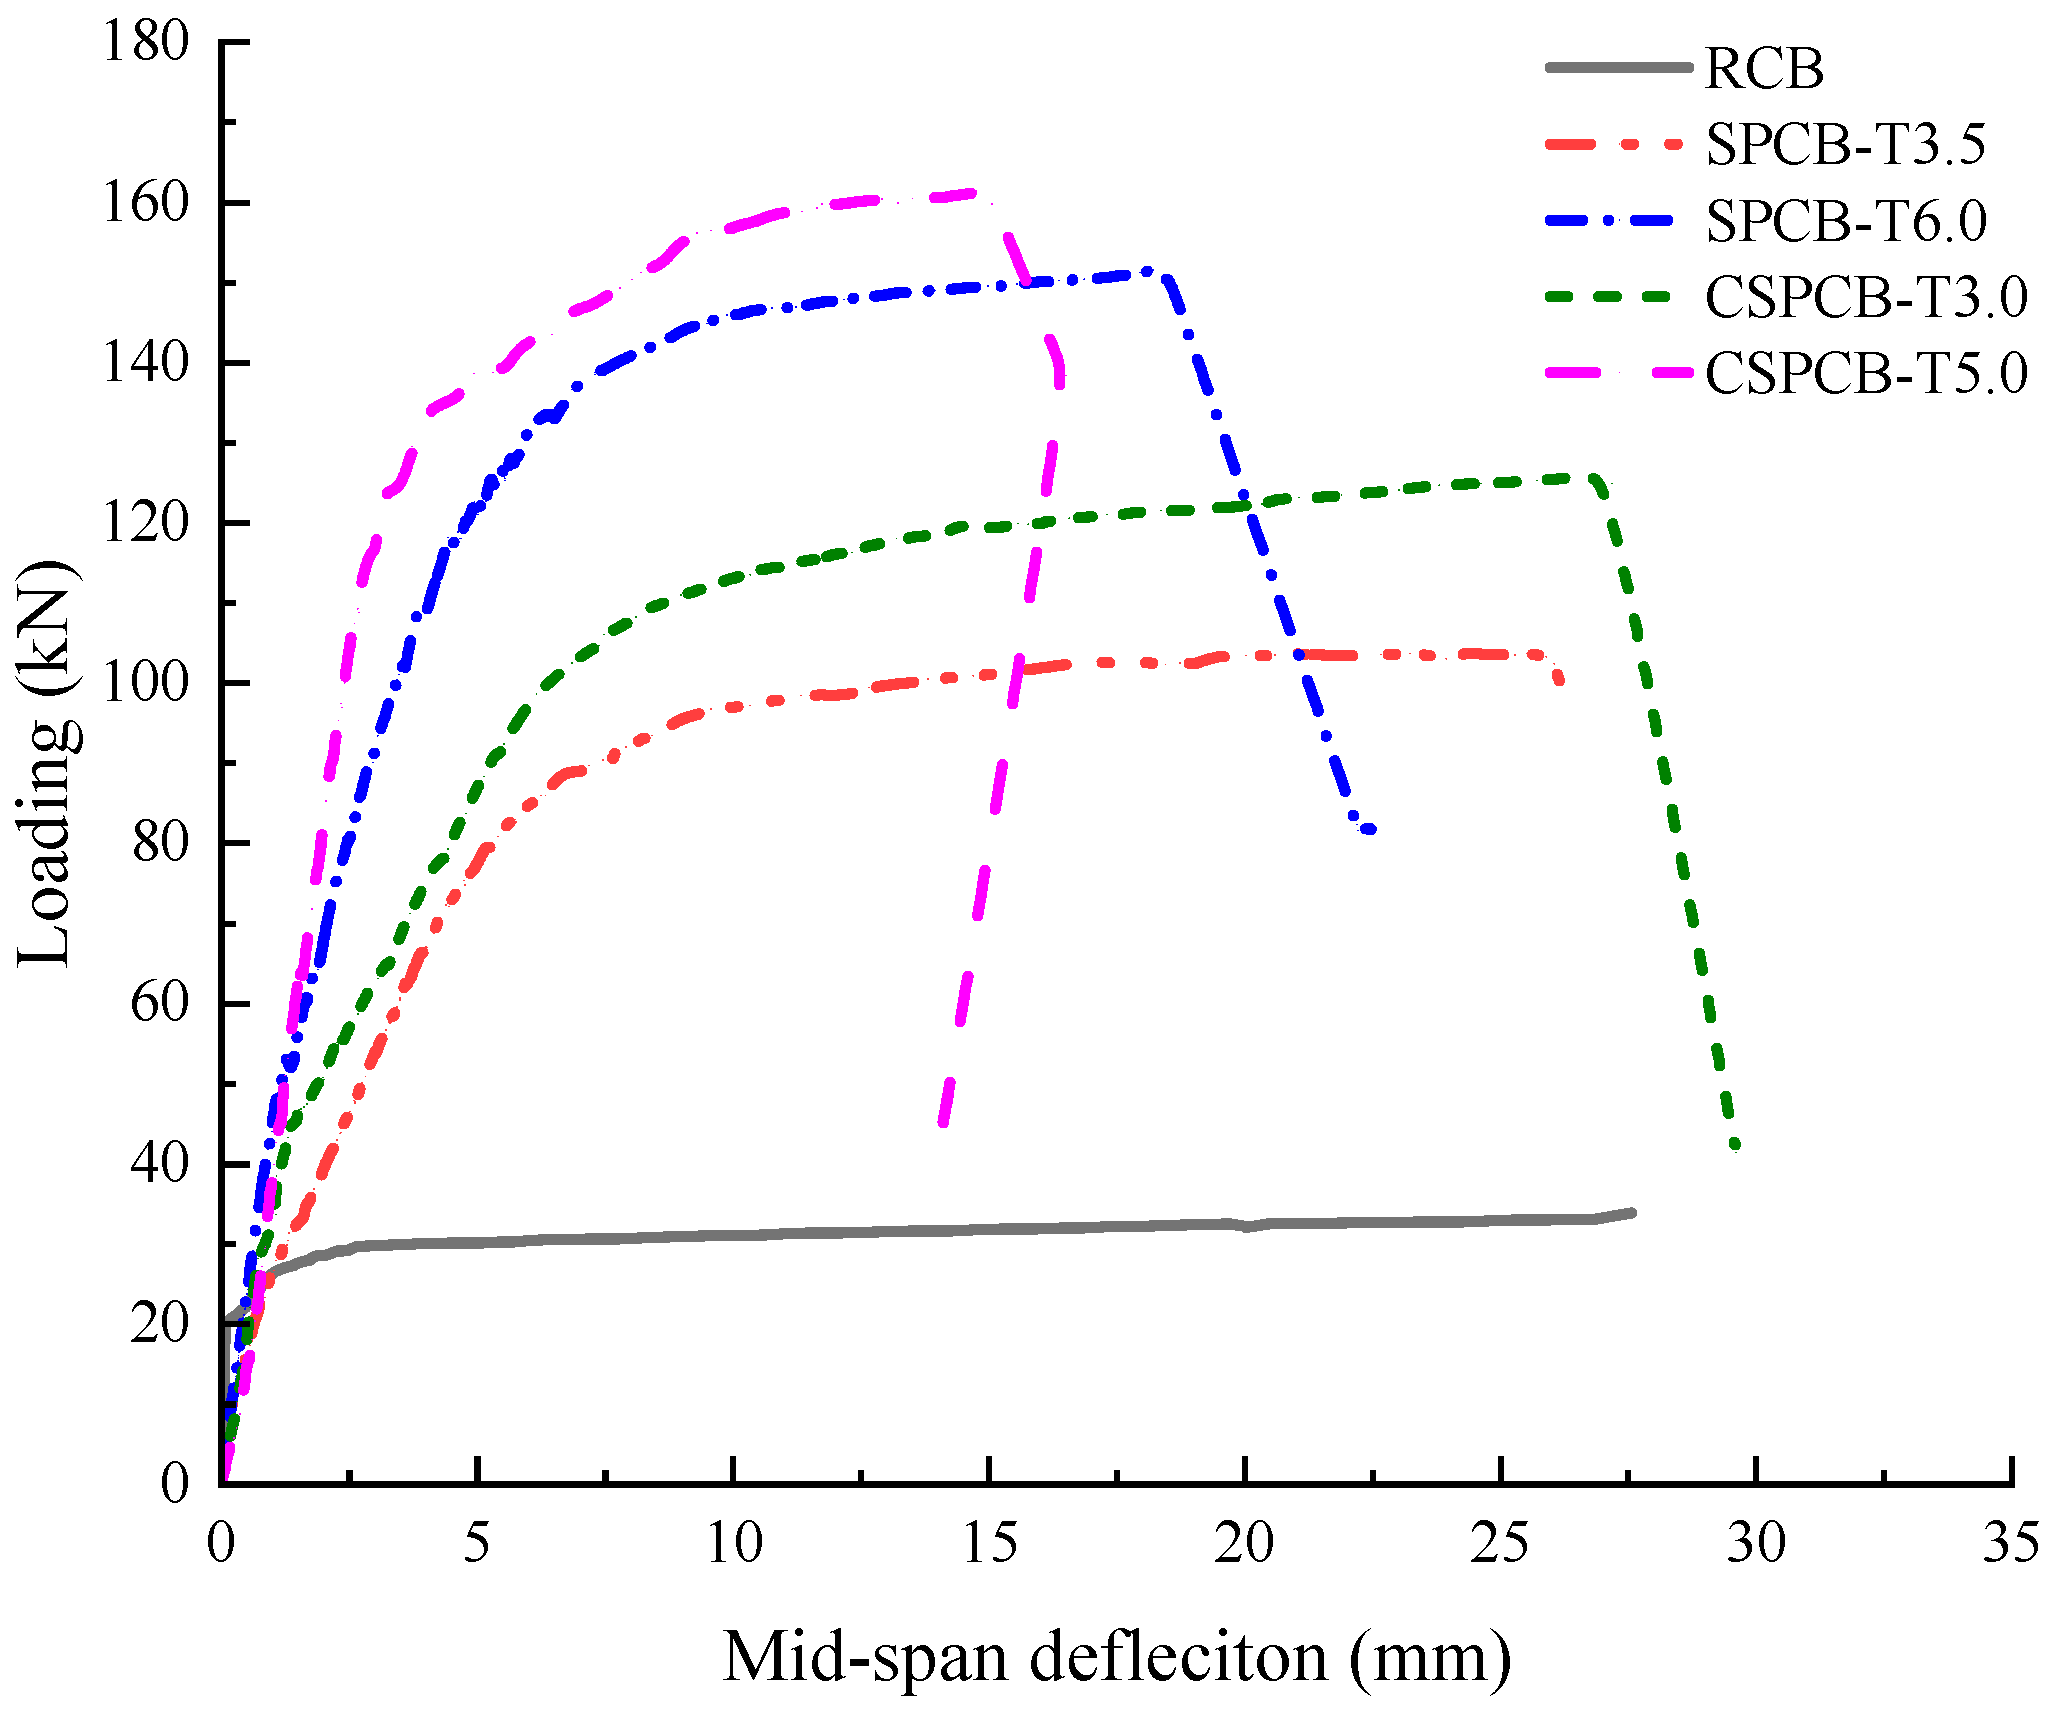
Figure 7.
Distribution of the cross-sectional strain.

Figure 8.
Load–strain curves. (a) Strains in the upper reinforcing bars; (b) strains in the lower reinforcing bars; (c) strains in the steel plate.
Figure 8.
Load–strain curves. (a) Strains in the upper reinforcing bars; (b) strains in the lower reinforcing bars; (c) strains in the steel plate.


Figure 9.
Simplified schematic of corrugated steel.

Figure 10.
Schematic of the corrugated steel–concrete composite section.

Figure 12.
Schematics of the material constitutive relations. (a) Constitutive relation of concrete; (b) constitutive relation of steel.
Figure 12.
Schematics of the material constitutive relations. (a) Constitutive relation of concrete; (b) constitutive relation of steel.


Table 1.
Summary of the characteristic patterns of cracks produced by different specimens.
| Crack Characterization | Regularity Summary |
|---|---|
| Timing of crack appearance | Cracks appeared later in steel-plate reinforced beams than in unreinforced concrete beams. For the same amount of steel used, cracks appeared later in corrugated steel-plate-reinforced beams than in flat steel-plate-reinforced beams. For the same steel-plate material, cracks appeared later in steel-plate-reinforced beams with large thicknesses than in those with small thicknesses. |
| Crack location | Cracks appeared at approximately the same locations in all five specimens, i.e., cracks were most likely to appear in and around the loaded sections. |
| Crack type | The cracks in the five specimens underwent similar changes, and with an increasing amount of steel used, the cracks gradually changed from bending to bending-shear cracks. |
| Crack length | The larger the amount of steel used in the five specimens, the shorter the vertical length of the cracks. |
| Number of cracks | The number of cracks was significantly lower in RCBs than in steel-plate-reinforced beams and was similar among the four types of steel-plate-reinforced beams. |
| Crack spacing | The crack spacing was more uniform in all five specimens. |
| Crack distribution | Cracks in RCBs were distributed in the pure bending section. With an increasing amount of steel, the crack distribution in steel-plate-reinforced beams tended to move from pure bending toward bending and shear sections. |
Table 2.
Section characteristics of beams strengthened with CSPs of different thicknesses.
| Corrugation Thickness (mm) | Theoretical Calculation Results (mm4) | CAD Calculation Results | Deviation (%) | Composite Section Inertia Moment of Concrete Beams Strengthened with Flat Steel Plates with the Same Amount of Steel Used (mm4) | Improvement Rate of Inertia Moment of Concrete Beams Strengthened with Corrugated Steel Plates (%) |
|---|---|---|---|---|---|
| 2 | 102,019,271 | 101,994,077 | 0.024701 | 77,765,606 | 23.77361 |
| 3 | 107,925,602 | 107,869,975 | 0.051569 | 82,139,723 | 23.89227 |
| 4 | 113,658,003 | 113,570,653 | 0.076912 | 86,696,520 | 23.72159 |
| 5 | 119,262,237 | 119,108,796 | 0.128824 | 91,398,600 | 23.36334 |
| 6 | 124,713,489 | 124,496,347 | 0.174416 | 95,199,596 | 23.66536 |
| 7 | 130,034,201 | 129,743,201 | 0.224289 | 99,174,510 | 23.73198 |
| 8 | 135,221,162 | 134,858,096 | 0.269221 | 102,980,529 | 23.84289 |
Table 3.
Comparison table for the flexural capacity of the normal section.
| Specimen | Material Status | Test Bearing Capacity (kN) | Theoretical Bearing Capacity (kN) | Deviation Rate | Reasonableness |
|---|---|---|---|---|---|
| CSPCB-T3.0 | Concrete crushed Upper bars did not yield Lower bars yielded Corrugated steel plate yielded | 104.64 | 103.06 | 1.5% | Reasonable |
| CSPCB-T5.0 | Concrete crushed Upper bars yielded Lower bars yielded Corrugated steel plate yielded | 147.01 | 154.47 | 5.1% | Reasonable |
| SPCB-T3.5 | Concrete crushed Upper bars did not yield Lower bars yielded Flat steel plate yielded | 90.58 | 94.12 | 3.9% | Reasonable |
| SPCB-T6.0 | Concrete crushed Upper bars yielded Lower bars yielded Flat steel plate yielded | 138.73 | 142.11 | 2.4% | Reasonable |
Disclaimer/Publisher’s Note: The statements, opinions and data contained in all publications are solely those of the individual author(s) and contributor(s) and not of MDPI and/or the editor(s). MDPI and/or the editor(s) disclaim responsibility for any injury to people or property resulting from any ideas, methods, instructions or products referred to in the content. |
© 2024 by the authors. Licensee MDPI, Basel, Switzerland. This article is an open access article distributed under the terms and conditions of the Creative Commons Attribution (CC BY) license (https://creativecommons.org/licenses/by/4.0/).
Share and Cite
MDPI and ACS Style
Feng, X.; Liu, D.; Long, X.; Duan, K.; Zuo, J.; Liu, W.; Dong, H. Flexural Capacity of the Normal Sections of Concrete Beams Strengthened with Corrugated Steel Plates. Buildings 2024, 14, 1398. https://doi.org/10.3390/buildings14051398
AMA Style
Feng X, Liu D, Long X, Duan K, Zuo J, Liu W, Dong H. Flexural Capacity of the Normal Sections of Concrete Beams Strengthened with Corrugated Steel Plates. Buildings. 2024; 14(5):1398. https://doi.org/10.3390/buildings14051398
Chicago/Turabian StyleFeng, Xianda, Dejun Liu, Xiao Long, Kang Duan, Jianping Zuo, Wei Liu, and Haiyang Dong. 2024. "Flexural Capacity of the Normal Sections of Concrete Beams Strengthened with Corrugated Steel Plates" Buildings 14, no. 5: 1398. https://doi.org/10.3390/buildings14051398
Note that from the first issue of 2016, this journal uses article numbers instead of page numbers. See further details here.