
Shaking Tables Test on Seismic Responses of a Long-Span Rigid-Framed Bridge Considering Traveling Wave Effect and Soil–Structure Interaction
1
School of Civil Engineering, The Open University of China, Beijing 100039, China
2
Key Laboratory of Coast Civil Structure Safety of China Ministry of Education, Tianjin University, Tianjin 300072, China
3
Key Laboratory of Urban Security and Disaster Engineering of China Ministry of Education, Beijing University of Technology, Beijing 100124, China
*
Author to whom correspondence should be addressed.
Buildings 2024, 14(5), 1432; https://doi.org/10.3390/buildings14051432
Submission received: 11 April 2024
/
Revised: 7 May 2024
/
Accepted: 14 May 2024
/
Published: 15 May 2024
(This article belongs to the Special Issue Structural Vibration Control Research)
Abstract
:The traveling wave effect and soil–structure interaction have significant influence on the seismic response of large-span bridges with complex site conditions. In this paper, a 1/10 scaled-down large-span rigid-framed bridge model was designed and fabricated, and a shaking tables test considering the traveling wave effect and soil–structure interaction was carried out on a large-scale continuous rigid bridge model by a real-time substructure hybrid test technique. Influences of the traveling wave effect and soil–structure interaction on the seismic responses of the rigid-framed bridge specimen were systematically analyzed with experimental data. The test results showed that when the apparent wave speed was small, the traveling wave effect increased the seismic responses of the rigid-framed bridge. With the increase in apparent wave speed, the structural response under traveling wave excitation and uniform excitation was basically the same. The SSI effect lead to a great change in the seismic input peaks and spectral characters at the bottom of the pier, and increased the seismic responses of the rigid-framed bridge. When both traveling wave and the SSI effect were considered, there was a phase difference in the seismic excitation. The dynamic responses of a continuous rigid-framed bridge could not be simply obtained by superposition of the separate traveling wave effect or SSI effect. Meanwhile, the real-time substructure test method in this paper solved the problems that the traditional soil box experiment cannot be applied to the test of a large-scale model, the soil and bridge structure find it difficult to meet the unified similarity ratio, and the boundary conditions are difficult to simulate accurately.
1. Introduction
The conclusion of papers and reports on bridge seismic research in the 17th World Conference on Earthquake Engineering were summarized and analyzed by Li Hongxu, Jia Junfeng et al. [1,2], who found that seismic response analysis and the experimental study of bridges, structure–soil interaction, and the assessment of damage to existing bridge structures and reinforcement methods [3,4] are still hot issues in the field of bridge seismic research.
As the piers of a large-span bridge are widely spaced apart, the site conditions for each pier are often different. Therefore, it is usually necessary to consider the influence of ground vibration spatial effects on the seismic response of the structure. At present, the mechanism of bridge structure–soil dynamic interaction and its spatial differential effect under multi-point multi-dimensional seismic action has not been clarified, and no universal conclusions have been formed that can be applied to practical engineering. Therefore, it is significant to study the effects of spatial differential effects of ground shaking and soil–structure interaction on the seismic response of high-pier, large-span bridges based on experimental loading.
The phenomenon that ground shaking has significant spatial variability in terms of intensity, time-holding and spectral characteristics is called the spatial differential effect of ground shaking, which mainly includes the travelling wave effect, partial coherence effect and local site effect.
Travelling wave effect refers to the difference in piers at the seismic wave time course that is caused by a large distance between piers.
Part of the coherence effect refers to the difference in piers at the seismic wave time course that is caused by differences in the refraction, reflection and scattering of seismic waves in different media in the soil layer and the superposition of seismic waves from the source to the piers.
The local site effect is refers to differences in seismic wave propagation from the source to the surface of the abutment, which is caused by a difference in soil distribution at different abutment sites.
A large number of studies have been carried out on the influence of ground vibration field effects on the seismic response of bridge structures [5,6,7,8,9,10,11,12]. For example, Bonganoff [5] firstly noted the effect of ground transfer time on the response of long structures in 1965. Zhao et al. [6] established a nonlinear finite element model of a curved beam bridge based on the ANSYS platform, and used MATLAB to de-couple the non-stationary seismic evolution power spectral density (EPSD) matrix. The absolute displacement method was used to analyze the multi-dimensional and multi-point nonlinear time history of the bridge. A comprehensive analysis was conducted to assess the sensitivity of curved beam bridges to the spatial variability of earthquake ground motion (SVEGM) by considering different apparent wave velocities, site conditions, and coherence types. Parvanehro P. et al. [7] recommended an alternative combination rule for bridge response estimation under multi-point excitation, and used random vibration analysis to calculate the correlation coefficient between the two responses. The longitudinal and transverse simplified mathematical models of the bridge were established. Then, a simple mathematical formula of the correlation coefficient were extracted, and its accuracy and performance were evaluated. Zhang et al. [8] recommended an alternative combination rule for bridge response estimation under multi-point excitation, and used random vibration analysis to calculate the correlation coefficient between the two responses. The longitudinal and transverse simplified mathematical models of the bridge were established. Then, a simple mathematical formula of the correlation coefficient was extracted, and its accuracy and performance were evaluated.
The results of a large number of studies have shown that the structural seismic response of large-span bridge structures is very complex, which is closely related to the characteristics of the input ground vibration field and the structural form of the bridge. However, fewer studies have been carried out on shaker table array tests of large-span bridge structures under multidimensional multipoint excitation due to the limitations of test equipment and test conditions. And there is no sufficiently effective experimental data to verify the conclusions of the existing studies.
The essence of the soil–structure interaction (SSI) is the study of the influence of foundations on the dynamic response of structures. The foundation, base and superstructure have usually been viewed as a whole working to solve the deformation and internal force of the whole system under the conditions of deformation coordination at the connection and contact points. Since the 20th century, a wealth of theoretical research results have been carried out by research on soil–structure interaction for more than 100 years. For example, Sung Y.C. et al. [13] investigated the effect of the soil–structure interaction on the inelastic displacement ratio of bridge structures subjected to near-fault pulse-like earthquake ground motions. Das S. et al. [14] conducted a comparative case study of seismically vulnerable surfaces of rail-bridge piers with and without soil–structure interaction. Roy et al. [15] studied the influence of SSPSI on the design response of a pile foundation-supported building structure embedded in soft clay through scaled model experiments using a shake table.
It has been shown that the mechanism of considering the effect of the soil–structure interaction on the seismic response of large-span bridge structures is very complex, and is closely related to the input ground vibration field characteristics [13,16,17], foundation soil properties [15,18,19,20], and the structural form of the bridge [14,17,21]. The effect of the interaction on the structure is dependent on their relative properties. In experimental studies, numerical simulations are used normally to study the seismic response of long-span bridges with the limitations of the test site and test equipment [13,14,16,21]. There are rarely experimental studies considering the effect of the soil–structure interaction on the seismic response of long-span bridges. Currently, the analysis methods of the soil–structure interaction mainly include prototype tests, theoretical analyses and indoor tests, whose experimental studies are dominated by soil box tests using the integral method [20,22,23]. This method is constrained by the bearing capacity of the shaking table, which cannot be applied to the testing of large-scale models. The medium and the bridge structure are difficult to satisfy a uniform similarity ratio, and the boundary conditions are difficult to simulate accurately with this method.
Therefore, it is necessary to break through the bottleneck of the existing test technology and carry out the shaking table test of large-span bridges considering the soil–structure interaction to test and verify the dynamic response calculation method and numerical simulation results of large-span bridge structures considering the soil–structure interaction, which can clarify the soil–structure interaction mechanism.
Hence, a 1/10 scaled-down large-span rigid-framed bridge model was designed and fabricated, and a shaking tables test considering the traveling wave effect and the soil–structure interaction was carried out on a large-scale continuous rigid bridge model using a real-time substructure hybrid test technique to systematically analyze the influences of the traveling wave effect and the soil–structure interaction on the seismic responses of the rigid-framed bridge specimen. With the real-time substructure test method in this paper, the traditional soil box experiment can be applied to the test of large-scale model, the soil and bridge structure can meet the unified similarity ratio, and the boundary conditions can be simulated accurately. It is hoped to provide a feasible experimental method for large-span bridges to consider the SSI effect.
2. Substructure Hybrid Test Method for Soil–Structure Interaction
Real-time dynamic substructures (RTDSs) divided the test object into two parts. Those requiring focused research or challenging to model accurately (such as structures or components) were physically tested in the laboratory, while the remaining aspects were numerically analyzed through mathematical modeling. Data from both segments interacted in real time to emulate the overall test, thus enhancing the test capabilities without hardware upgrades. The traditional shaking table test, depicted in Figure 1a, involved setting up the entire research object, fixing the specimen on the shaking table, and replicating actual or simulated ground motion to study the structure’s seismic performance. Building upon real-time substructure testing on the shaking table, the overall structure shown in Figure 1b comprised n + r degrees of freedom. The upper r degrees of freedom represented the physical substructure installed on the shaking table for physical testing, while the lower n degrees of freedom denoted the numerical substructure solved by the corresponding numerical model. Real-time data interaction through interface response ensured the integrity of the test objects. The numerical substructure was affected by both the ground motion d and the reaction force f of the physical substructure. The interface displacement yN was obtained through mathematical modeling and numerical solution, and the displacement was then applied to the physical substructure. The reaction force of the physical substructure acting on the numerical substructure was measured by force sensors and transmitted to the numerical substructure model in real time. The feedback loop between the two ensured the integrity of the test system, keeping the true dynamic response consistent with the overall structure.
To date, implementing interface reverse recourse based on the shaking table substructure experiment remains a technical challenge. The following are the four main methods commonly used for interface force testing in dynamic substructure tests based on shaking table experiments [24,25]:
- Measuring the relative velocity and displacement of the bottom layer of the physical substructure to calculate the sum of bottom layer damping force and elastic restoring force;
- Measuring the strain of the bottom components of the physical substructure to determine the interface force, leveraging the linear relationship between interface force and strain;
- Installing sensors between the physical substructure and the shaking table to directly measure the interface force;
- Utilizing acceleration measurements of the specimen to calculate the total inertial force and subsequently derive the interface force.
Method 1 involves the interface force in substructure testing related to the relative velocity, relative displacement, damping, and stiffness of the upper and lower layers of the interface. In terms of structural parameter identification, it is currently challenging to accurately obtain the structural stiffness and damping in real-time. Additionally, there are no available instruments to measure dynamic displacement directly, accurately, and with high precision, resulting in the introduction of phase lag through integral calculations. Therefore, it is difficult to accurately determine the interface force using this method.
Method 2 involves the strain-dependent interface force, which requires the absence of nonlinearity in the structure. This requirement is difficult to meet in complex structures, and when the interface force is small, the structural deformation is minimal, leading to low strain measurement accuracy.
Method 3 is considered to be the best measurement method, but currently, large-range and multi-directional force sensors are too expensive and not widely used in routine experiments.
Method 4 circumvents the necessity for linearity within the structure, and the accuracy of acceleration measurement surpasses that of velocity and displacement, meeting the required standards. However, since this method requires the summation of all inertial forces acting on the specimen, the structural mass distribution must not be excessively dispersed. Determining interface forces in shaking table substructure experiments remains a technical challenge.
Through the comparative analysis of the experimental equipment, experimental conditions, and experimental models, method 4 was selected as the approach to obtain the interface force in this experiment. The principles are as follows.
A two-degree-of-freedom system is utilized as an illustrative example to elucidate the principles underlying the real-time dynamic substructure testing technique. The mass, stiffness coefficient, and damping coefficient of the bridge structure are represented by m1, k1, and c1 (viscous damping), respectively. Meanwhile, the mass, stiffness coefficient, and damping coefficient of the soil are represented by m2, k2, and c2, respectively. Hence, the dynamic equation for the structure—foundation system can be written as
where üg is the acceleration of the bedrock, x1 is the displacement of the physical substructure relative to the bedrock, and x2 is the displacement of the numerical substructure relative to the bedrock. The interaction force between the physical substructure and the numerical substructure can be expressed as
However, it is difficult to calculate the interaction force between the physical and numerical substructures from the equation above by directly measuring the relative displacement and velocity. Combining the motion equation of the physical substructure expressed in Equations (1) and (2) yields
The interface force between the numerical and physical substructures can be obtained by the absolute accelerations of the physical substructure , which are collected by acceleration sensors in the experiment. It is evident that Equation (3) remains valid even when the physical substructure is assumed to be a multi-degree-of-freedom system. Therefore, this method can also be used in a multi-degree-of-freedom system, where the interface force is nearly equal to the sum of the inertia forces of particles, as illustrated in Figure 2. In the experiment, the dynamic response of the interface is accurately determined by the collected acceleration and seismic input of the specimen, and then precisely controlled by the substructure experiment controller and the shaker controller. This enables the shaker to truly reproduce the interface dynamic response.
In this paper, considering the dynamic response of the bridge based on the soil–structure interaction, a substructure test system focusing on bridge dynamic response was established, as shown in Figure 3. The soil–pile–structure system was modeled as a numerical substructure, with the dynamic equation solved using computer software. The continuous girder bridge was modeled as a physical substructure and tested using a shaking table. Real-time interaction between the two substructures was achieved through real-time interactive data transfer. The investigation into the seismic responses of long-span bridges considering soil–structure interaction was realized by using a Simulink Model embedded in Matlab and a shaking table test, as shown in Figure 3. The Simulink Model depicted in Figure 4, includes the following components: Analog Input as the input module, Analog Output as the output module, InVacc as the control module, Main System as the solution module, high-filter as the filter module, and Gain as the coefficient adjustment module.
3. Experiment Design
3.1. Model Design
3.1.1. Bridge Specimen
The prototype was a reinforced concrete rigid-framed bridge with high piers in northwest of China. In order to analyze the seismic response of the bridge in the condition of the traveling wave effect and soil–structure interaction, a 1/10 scaled rigid-framed bridge model was designed on the basis of the similarity theory for shaking tables test. In order to enable the model structure to truly reflect the dynamic characteristics of the prototype structure, the gravity, inertial force and restoring force of the prototype and model meet Cauchy conditions [26,27]:
Among them, SE is the elastic modulus similarity ratio. Sg is the gravitational acceleration similarity ratio. Sρ is the density similarity ratio and Sl is the geometric size similarity ratio. The acceleration similarity ratio was 5.5 and the time similarity ratio was 0.14. The additional mass, illustrated in Figure 5a, was uniformly distributed on the deck, which weighed approximately 5.5 tons. The superstructure had a box section. The bridge piers had a rectangular hollow section with external dimensions 0.3 m × 0.4 m, and the thickness was 0.1 m. As shown in Figure 5, the mid-span of the bridge was 6.0 m while the side ones were 3.5 m. Each of the bridge piers was anchored to the shaking tables by using four foundation bolts to model the fixed boundary condition.
3.1.2. Construction
Various stages of the specimen construction are shown in Figure 6. The model was composed of four reinforced concrete piers and one rigid-framed span, which were cast separately. The side-span was connected to the bridge piers by bearings. The girder and mid-pier should be cast together to form the fixed joints, but in fact each of they had an embedded steel and were connected by butt weld, which had the same strength as the components. The whole bridge specimen was anchored to the shaking tables by using foundation bolts.
3.1.3. Soil Model Used in the Test
After comparing various types of impedance functions used for the pile-foundation and considering factors such as data transmission speed and calculation accuracy of the numerical substructure, the pile–foundation model proposed by Penzien [28] was selected for the test, as depicted in Figure 7. The pile–foundation embedded in the layered soil was modeled as an elastic foundation beam and simplified into a pile mass–spring–damper system, which can account for the nonlinearity of soil. This model has been widely used in engineering applications.
3.1.4. Instrumentation
The model was instrumented with 62 channels of strain gauges, 26 channels of accelerometers, 15 channels of displacement transducer and 4 channels of force sensor. Strain gauges measured the strain at the bottom of bridge piers and clamped beam-pier joints where the plastic–hinge region was likely to appear. The accelerometers measured the acceleration of the superstructure, substructure and the shaking tables. Displacement transducers measured the relative displacement between the top and bottom of the bridge piers, the relative displacement of the bearings, and the deflection of the mid-span. The arrangement of the measurement points is shown in Figure 8.
3.1.5. Testing Schedule
Table 1 lists seven sets of shaking table tests carried out on the specimen. White noise with a PGA of 0.05 g was dispersed throughout testing to find dynamic characteristics of the bridge model. Then, the seismic responses of the structure involving the traveling wave effect and soil–structure interaction were studied. The prototype of the bridge was located on the Class II fields. The target response spectrum was generated according to the type of prototype bridge site and the relevant provisions of the Specifications for Seismic Design of Highway Bridges (JTG/T 2231-01-20) [29]. The calculation method of target response spectrum is shown in Formula (4):
where Tg is the characteristic period (s). T is the period (s). T0 is the maximum period of the ascending phase of the response spectrum. T0 is usually 0.1 s. Smax is the maximum value of the design acceleration response spectrum.
According to the target response spectrum, the El-Centro Wave, recorded in a California earthquake in 1940, the Wenchuan Wave, recorded in a Wenchuan earthquake in 2008 and the Beijing Wave, recorded in a Tangshan earthquake in 1976 were chosen for the experimental research, shown in Figure 9. In order to study the effects of the travelling wave effect and SSI effect on different site classes, three artificial waves, with characteristic period as 0.25 s, 0.4 s and 0.65 s, were fitted for the experimental research; the parameters formulated by China Seismic Design Code (GB50011-2016) are shown in Table 2 [30]. The traveling wave effect was realized by the phase difference method of seismic excitation. By the ratio of distance between piers and apparent wave velocity, the timing difference of seismic wave reaching each pier was obtained. The seismic excitations were applied along the longitudinal direction, and scaled down based on model similarity ratios.
4. Experimental Results and Discussion
The following section discusses the key results of the shaking table test. The fundamental frequency of the bridge specimen in the longitudinal direction was 8.17 Hz, obtained by white noise tests, and the vibration mode was longitudinal bending. For the purpose of evaluating the effect of traveling wave effect and soil–structure interaction on the seismic response of the bridge specimen, the dimensionless parameter D, defined as the increase ratio, was employed. In this, the displacement increase in the bridge was defined as
where Δt is the peak amplitude of displacement response considering the traveling wave effect or soil–structure interaction or both of them; Δ0 is the peak amplitude of the displacement response under uniform excitation, when the traveling wave effect and soil–structure interaction are ignored.
DΔ = (Δt − Δ0)/Δ0
The acceleration increase in the bridge is defined as
where At is the peak amplitude of acceleration response considering the traveling wave effect or soil–structure interaction or both of them; A0 is the peak amplitude of the acceleration response under uniform excitation, when the traveling wave effect and soil–structure interaction are ignored.
Dacc = (At − A0)/A0
The strain increase of the bridge was defined as
where εt is the peak amplitude of strain response considering the traveling wave effect or soil–structure interaction or both of them; ε0 is the peak amplitude of the strain response under uniform excitation, when the traveling wave effect and soil–structure interaction are ignored.
Dε = (εt − ε0)/ε0
4.1. Effect of Traveling Wave on Seismic Response
The maximum displacement response and maximum strain response of the bridge piers are illustrated in Table 3. The displacement time history and strain time history are shown in Figure 10. The displacement response refers to the relative value between the top and bottom of the bridge piers and the strain response refers to the one at the pier bottom.
As indicated in Table 3 and Figure 10, the travelling wave effect increased the strain response at the base of the pier when the apparent wave speed was small (200 m/s or 100 m/s) compared to the uniform excitation.
For Pier No. 1, under El-Centro waves, the strain at the base of the pier was 29.4 for uniform excitation, and 41.4, with an increase of 40.47%, for an apparent wave speed of 200 m/s. The strain was 60.9, with an increase of 107.06, for an apparent wave speed of 100 m/s. Under the action of the Wenchuan wave, the strain at the bottom of the pier was 67.9 at consistent excitation, 83.1, with an increase of 22.25%, for the apparent wave speed of 200 m/s, and 106.8, with an increase of 57.21%, for the apparent wave speed of 100 m/s. Under the action of the Beijing wave, the strain at the bottom of the pier was 66.9 at the same excitation, and 83.3, with an increase of 24.49%, for the apparent wave speed of 200 m/s. When the apparent wave speed was 100 m/s, the strain was 135.7, with an increase of 102.85%. It can be seen that under the action of Beijing wave, the peak value of the strain response at the bottom of Pier 1 was the largest, which was due to the Beijing wave mainly enriched in the low-frequency range and having a larger energy. Under the action of the El-Centro wave, the increase in the strain response at the bottom of Pier 1 was the largest, which indicates that, for the side piers, when considering the travelling wave effect, the El-Centro wave will cause drastic changes in the bottom strains of the side piers.
From Table 3 and Figure 10, it can also be seen that, for the No. 2 middle pier, among three strong seismic records, the No. 2 middle pier bottom strain response peak value was the largest under the Beijing wave, and the pier bottom strain increase was also the largest under the Beijing wave. This indicates that a drastic change in the bottom strain of the middle pier could be caused by the Beijing wave when the travelling wave effect is considered.
For the whole structure, the sensitivity zones of the side piers and the middle pier for the ground vibration frequency band were different.
As shown in Table 3 and Figure 10, the relative displacement response at the top of pier No. 2 and pier No. 3 increased with the increase in the phase difference, indicating that the travelling wave effect increased the mid-pier deformation when the apparent wave speed was small (200 m/s and 100 m/s) compared with the uniform excitation.
In summary, when the apparent wave velocity increased to 400 m/s and above, the seismic response of the piers under travelling wave excitation and uniform excitation remained basically constant, and the influence of travelling wave effect could be neglected in seismic analysis.
The maximum strain response of the joints is illustrated in Table 4. All of the strain response in this paper refers to the concrete strain.
As indicated in Table 4, the travelling wave effect increased the strain at the consolidation nodes of the pier and beam. However, the increase in the strain at the consolidation node was not as large as that at the bottom of the pier. Under the action of the El-Centro wave, the strain at the node of pier No. 2 was 31.6 at uniform excitation, and the strain was 32.9 at the apparent wave speed of 200 m/s, with an increase of 3.81%. When the apparent wave speed was 100 m/s, the strain was 38.2, with an increase of 20.79%. The dynamic response of the pier–beam consolidation node under the Beijing wave was the largest, but there was no obvious pattern in the increase in the node strain response.
4.2. Effect of Soil–Structure Interaction on Seismic Response
4.2.1. Input Ground Motion
Figure 11 presents the comparison between the experimental responses recorded considering and not considering the effect of soil–structure interaction-suffering artificial wave, with Td = 0.25 s (characteristic period of site). The acceleration time histories and Fourier spectrum of the shaking table with different shear velocities are indicated. The shear velocities were taken as three values, such as 400 m/s, 300 m/s and 200 m/s.
As shown in Figure 11, the intensity and spectral characteristics of the input acceleration of the shaking table changed because of the soil–structure interaction. The amplitude of the original wave was 0.15 g. While the shear velocity changed from 400 m/s to 100 m/s, the amplitude of the acceleration time history varied from 0.256 g to 0.338 g, with the increase ratio of 125%, where g is the acceleration of gravity. The peak of the acceleration increased as the shear velocity decreased. The original input motion, which does not consider the soil–structure interaction, had widely distributed frequency components. It is clearly illustrated in Figure 11e–h. The excellent frequency decreased as the shear wave velocity became smaller.
4.2.2. Displacement Response
Figure 12 presents the time histories of the bridge specimen, including the deformation of the bridge piers and the deflection of the main girder. The deformation refers to the relative value between the top and bottom of the bridge piers. The maximum seismic responses of the bridge specimen are illustrated in Table 5.
As shown in Table 5 and Figure 12, the displacement response of the bridge pier was augmented because of the soil–structure interaction. Under the artificial wave with Td = 0.25 s, the deformation of Pier 2 increased from 4.831 mm to 7.51 mm as the shear wave velocity decreased from 400 m/s to 200 m/s, with an increase ratio of 55.4% and a thickness of overburden 15 m. The deformation of Pier 2 increased from 5.112 mm to 7.51 mm as the thickness of the overburden decreased from 30 m to 15 m, with an increase ratio of 46.9% and a shear wave velocity of 200 m/s. The increase ratio of the strain response varied with different earthquake records and different bridge piers. The shear wave velocity and thickness of overburden were both the focus factors affecting soil–structure interaction. In a word, the soil–structure interaction is unfavorable to the displacement responses of the bridge piers, especially for a smaller shear wave velocity. When the shear wave velocity achieves 100 m/s, the soil–structure interaction may cause tremendous changes in displacement responses of the bridge piers.
The deflection of the main girder was augmented as well because of the soil–structure interaction. It increased from 1.006 mm to 1.405 mm as the shear wave velocity decreased from 400 m/s to 200 m/s, with a increase ratio of 15.4%, and from 1.19 mm to 1.405 mm as the thickness of the overburden decreased from 30 m to 15 m, with an increase ratio of 18.1%. The main girder had a smaller increase ratio and it was less sensitive to the soil–structure interaction than the bridge piers.
4.2.3. Strain Response
Figure 13 presents the strain time histories of the bridge specimen, including the strain of the bridge pier bottom and the joints. The maximum strain responses of the bridge specimen are illustrated in Table 6.
The strain response of the bridge pier was augmented because of the soil–structure interaction, which is clearly illustrated in Table 6 and Figure 13. Under an artificial wave with Td = 0.25 s, the strain at the bottom of Pier 2 was 142.572 με, and then increased from 205.474 με to 284.330 με as the shear wave velocity decreased from 400 m/s to 200 m/s, with an increase ratio of 99.43% and the thickness of overburden of 15 m; it increased from 216.350 με to 284.330 με as the thickness of the overburden decreased from 30 m to 15 m, with an increase ratio of 90.82% and a shear wave velocity of 200 m/s. The strain at the bottom of Pier 3 followed the same laws as Pier 2, but had a different increase ratio for the different constraints. The shear wave velocity and thickness of overburden were both focus factors affecting the soil–structure interaction. In a word, the soil–structure interaction is a disadvantage to the strain responses of the bridge piers, especially for the smaller shear wave velocity. When the shear wave velocity achieved 100 m/s, the soil–structure interaction may cause dramatic changes in the seismic responses of the bridge piers.
The strain at the mid-span of the main girder and the strain of joints were augmented as well because of the soil–structure interaction. When the shear wave velocity was consistent, the strain response increased as the thickness of overburden decreased. When the thickness of overburden was consistent, the strain response increased as the shear wave velocity decreased. In addition, it can be concluded that the shear wave velocity and thickness of overburden were both the focus factors affecting soil–structure interaction.
4.3. Effect of Traveling Wave and Soil–Structure Interaction on Seismic Response
The SIMULINK Model embedded in MATLAB is shown in Figure 14. It is the same as the one mentioned in the above part ‘2. Substructure hybrid test method for soil–structure interaction’. The difference is that time delay modules are necessary.
Considering the traveling wave effect and the soil–structure interaction, the maximum seismic responses of the bridge specimen, including the relative displacement of the bridge piers and the strain at the pier bottom and joints, are presented in Table 7.
As shown in Table 7, when the apparent velocity was consistent, the relative displacement of Pier 2 increased as the shear wave velocity decreased. When the shear wave velocity was consistent, the relative displacement of Pier 2 increased as the apparent velocity decreased. When the traveling wave effect was considered, respectively, the relative displacement of Pier 2 was 3.571 mm, with an apparent velocity of 100 m/s. When the soil–structure interaction was considered, respectively, the relative displacement of Pier 2 was 4.648 mm, with a shear wave velocity of 100 m/s. When the traveling wave effect and the soil–structure interaction were considered simultaneously, the relative displacement of Pier 2 was 7.297 mm. Hence, the dynamic responses of the bridge considering the traveling wave effect and the soil–structure interaction were nonlinear and could not be combined by superposition. This conclusion is also applicable for joints. When the apparent velocity was greater than 600 m/s, it was simplified to the case of considering the SSI effect, respectively; when the shear wave velocity was greater than 500 m/s, it was simplified to the case of considering the traveling wave effect, respectively.
In a word, the traveling wave effect and soil–structure interaction were unfavorable to the seismic response of the bridge specimen. The traveling wave effect makes the input ground motion have different phases. The seismic response of the bridge considering the traveling wave effect or the soil–structure interaction has different phases as well. Hence, different phases caused by the input ground motion and dynamic response make the analysis of seismic response, considering the traveling wave effect and the soil–structure interaction simultaneously, more complex.
5. Conclusions
In this paper, a 1/10-scaled-down large-span rigid-framed bridge model was designed and fabricated, and a shaking table test considering the traveling wave effect and the soil–structure interaction was carried out on a large-scale continuous rigid bridge model using a real-time substructure hybrid test technique to systematically analyze the influences of the traveling wave effect and the soil–structure interaction on the seismic responses of the rigid-framed bridge specimen. The following conclusions are the main findings:
- (1)
- The seismic responses of the rigid-framed bridge could be increased by the traveling wave effect, when the apparent wave speed was small. The deformation of the pier and the strain at the bridge pier bottom were reduced as the apparent velocity increased, and then become almost the same to the dynamic response under uniform excitation. The apparent velocity and the constraint condition types had an influence on the traveling wave effect, and the seismic responses of the bottom of the pier were more sensitive to the traveling wave effect than the seismic responses of the joints.
- (2)
- There are many changes in the peak and spectrum characters of seismic input at the pier bottoms after considering the SSI, which result in a decrease in the predominant frequency and an increase in the peak of inputting acceleration. The SSI effect increased the seismic responses of the rigid-framed bridge, such as the deformation of bridge piers and the loading of pier bottoms, as well as the loading of clamped beam-pier joints. The velocity of shear waves and the thickness of soil layers were two important factors affecting SSI effects.
- (3)
- There is phase difference in the dynamic response, and the maximum value does not occur at the same time considering the coupling effect, traveling wave effects and SSI in the dynamic response of the continuous rigid-framed bridges. Consequently, its dynamic response amplitude is not a simple superposition of the dynamic response amplitudes under the separate action of the traveling wave effect and SSI.
- (4)
- The real-time substructure test method solved three problems. The traditional soil box experiment can be applied to the test of the large-scale model, the soil and bridge structure can meet the unified similarity ratio, and the boundary conditions can be simulated accurately. This provides a feasible method for the study of the SSI effect on long-span bridges.
- (5)
- In this paper, the bridge structure was considered as a physical substructure and the soil as a numerical substructure. And a simplified soil model applied by many scholars was used. It is well known that soils are highly dispersive, which poses a challenge for accurate simulations. This factor has a large impact on the accuracy of experimental results. Therefore, future research will focus on improving the soil model for more accurate simulations.
- (6)
- The spatial effect of ground vibration has various influencing factors, including the travelling wave effect, local site effect and coherence effect. In this paper, only the influence of the travelling wave effect was considered separately, and the influence of local site effect and coherence effect as well as their coupling with SSI effect will be further considered in the future research.
Author Contributions
Conceptualization, X.-Y.Y. and Z.Z.; methodology, Z.Z.; validation, X.-Y.Y. and S.-S.C.; data curation, S.-S.C.; writing—original draft preparation, X.-Y.Y.; writing—review and editing, Z.Z.; funding acquisition, X.-Y.Y. and Z.Z. All authors have read and agreed to the published version of the manuscript.
Funding
This research was funded by the Natural Science Foundation of China under Grant no. 52178446 and the Open Research Fund of Key Laboratory of Beijing University of Technology under Grant no. 2022B02.
Data Availability Statement
All data generated or analyzed during this study are included in this article.
Conflicts of Interest
The authors declare no conflict of interest.
References
- Li, H.; Huang, Y.; Guo, E. Recent advances on bridge seismic research from the 17th World Conference on Earthquake Engineering. Earthq. Eng. Eng. Dyn. 2022, 45, 26–39. (In Chinese) [Google Scholar]
- Jia, J.-F.; Wei, B.; Du, X.-L.; Guo, B.-L.; Guo, H. Research progress of seismic resilient girder bridges at home and aborad from WCEE. J. Traffic Transp. Eng. 2022, 22, 25–46. (In Chinese) [Google Scholar]
- Crespi, P.; Zucca, M.; Valente, M. On the collapse evaluation of existing RC bridges exposed to corrosion under horizontal loads. Eng. Fail. Anal. 2020, 116, 104727. [Google Scholar] [CrossRef]
- Crespi, P.; Zucca, M.; Valente, M.; Longarini, N. Influence of corrosion effects on the seismic capacity of existing RC bridges. Eng. Fail. Anal. 2022, 140, 106546. [Google Scholar] [CrossRef]
- Bonganoff, J.L.; Goldberg, J.E.; Schiff, A.J. The effect of ground transmission time on the response of long structures. Bull. Seismol. Soc. Am. 1965, 55, 627–640. [Google Scholar]
- Zhao, T.L.; Li, X.M.; Du, Y.F. Nonstationary elastoplastic response analysis of curved beam bridges under spatial variability of earthquake ground motion using absolute displacement method. Soil Dyn. Earthq. Eng. 2024, 181, 108626. [Google Scholar] [CrossRef]
- Parvanehro, P.; Shiravand, M.R.; Safi, M. A method for linear response analysis of long bridges under multi-support seismic excitation. Bull. Earthq. Eng. 2022, 20, 8381–8410. [Google Scholar] [CrossRef]
- Zhang, Y.; Ma, J.; Chen, X.; Wang, Y. Seismic response of the long-span steel truss arch bridge with the thrust under multidimensional excitation. Railw. Sci. 2022, 1, 40–55. [Google Scholar] [CrossRef]
- Shi, Y.; Fan, S.; Liu, C.; Lu, L.; Zuo, C.; Sun, X. Study on multidimensional and multipoint seafloor spatial ground motion simulation under an ice-water layer and the dynamic response of a cross-sea bridge. Ocean Eng. 2023, 281, 114901. [Google Scholar] [CrossRef]
- Li, X.; Jia, H.; Li, Q. Experimental study on long-span curved rigid frame bridge under near-fault ground motion. Vib. Shock 2017, 36, 199–207, 237. [Google Scholar]
- Cheng, M.; Li, Q.; Yan, L. Experimental study on seismic response of irregular high-pier curved bridge under multi-point excitation. J. Vib. Eng. 2016, 29, 874–880. [Google Scholar]
- Sextos, A.G.; Taskari, O. Influence of seismic wave angle of incidence over the response of long curved bridges considering soil-structure interaction. Dyn. Response Infrastruct. Environ. Induc. Loads 2017, 2, 1–17. [Google Scholar]
- Sung, Y.C.; Chao, K.H.; Chen, C.C.; Liu, X.Q.; Su, C.K. Effect of Soil–Structure Interaction on Inelastic Displacement Ratios of Bridge Structures Subjected to Pulse-Like Ground Motions. Int. J. Struct. Stab. Dyn. 2024, 24, 2450059. [Google Scholar] [CrossRef]
- Das, S.; Sil, A.; Naveen, B.P. Effects of Soil-Structure Interaction on Seismic Fragility of Railway Concrete Bridge, in India. Iran. J. Sci. Technol. Trans. Civ. Eng. 2023, 47, 353–372. [Google Scholar] [CrossRef]
- Roy, S.D.; Pandey, A.; Saha, R. Shake table study on seismic soil-pile foundation-structure interaction in soft clay. Structures 2021, 29, 1229–1241. [Google Scholar]
- Abd-Elhamed, A.; Mahmoud, S. Simulation analysis of TMD controlled building subjected to far- and near-fault records considering soil-structure interaction. J. Build. Eng. 2019, 26, 100930. [Google Scholar] [CrossRef]
- Tochaei, E.N.; Taylor, T.; Ansari, F. Effects of near-field ground motions and soil-structure interaction on dynamic response of a cable-stayed bridge. Soil Dyn. Earthq. Eng. 2020, 133, 106115. [Google Scholar] [CrossRef]
- Zhao, Z.; Chen, Q.; Zhang, R.; Pan, C.; Jiang, Y. Optimal design of an inerter isolation system considering the soil condition. Eng. Struct. 2019, 196, 109324. [Google Scholar] [CrossRef]
- Xu, C.; Dou, P.; Du, X.; El Naggar, M.H.; Miyajima, M.; Chen, S. Seismic performance of pile group-structure system in liquefiable and non-liquefiable soil from large-scale shake table tests-ScienceDirect. Soil Dyn. Earthq. Eng. 2020, 138, 106299. [Google Scholar] [CrossRef]
- Xu, C.; Dou, P.; Du, X.; El Naggar, M.H.; Miyajima, M.; Chen, S. Large shaking table tests of pile-supported structures in different ground conditions. Soil Dyn. Earthq. Eng. 2020, 139, 106307. [Google Scholar] [CrossRef]
- Gallo, M.; Tomeo, R.; Nigro, E. The soil-structure interaction effect on the seismic vulnerability assessment and retrofitting of existing bridges. Procedia Struct. Integr. 2023, 44, 618–625. [Google Scholar] [CrossRef]
- Durante, M.G.; Di Sarno, L.; Mylonakis, G.; Taylor, C.A.; Simonelli, A.L. Soil-pile-structure interaction:Experimental outcomes from shaking table tests. Earthq. Eng. Struct. Dyn. 2016, 45, 1041–1047. [Google Scholar] [CrossRef]
- Yang, J.; Li, P.; Wu, W. Shaking Table Tests on Dynamic Characteristics of Pile-Soil-High Rise Structure System on Soft Soil Foundation. J. Tongji Univ. (Nat. Sci.) 2023, 51, 578–587. [Google Scholar]
- Tang, Z.; Dietz, M.; Hong, Y.; Li, Z. Performance extension of shaking table-based real-time dynamic hybrid testing through full state control via simulation. Struct. Control Health Monit. 2020, 27, e2611. [Google Scholar] [CrossRef]
- Tang, Z.; Dong, X.; Li, Z.; Du, X. Implementation of Real Time Hybrid Simulation Based on GPU Computing. Struct. Des. Tall Spec. Build. 2021, 31, e1942. [Google Scholar]
- Li, Z. Theory and Technology of Engineering Structure Testing; Tianjin University Press: Tianjin, China, 2004. [Google Scholar]
- Zhang, G. Structural Testing of Bridges; People’s Transportation Press: Beijing, China, 2002. [Google Scholar]
- Penzien, J.; Scheffey, C.F.; Parmelee, R.A. Seismic analysis of bridges on long piles. J. Eng. Mech. Div. 1964, 90, 223–254. [Google Scholar] [CrossRef]
- JTG/T 2231-01-20; Specifications for Seismic Design of Highway Bridges. Ministry of Transport of the People’s Republic of China: Beijing, China, 2020.
- GB50011-2016; Code for Seismic Design of Buildings. Ministry of Housing and Urban-Rural Development, People’s Republic of China: Beijing, China, 2016.
Figure 1.
Real-time dynamic substructure testing: (a) integrated system; (b) substructure system.
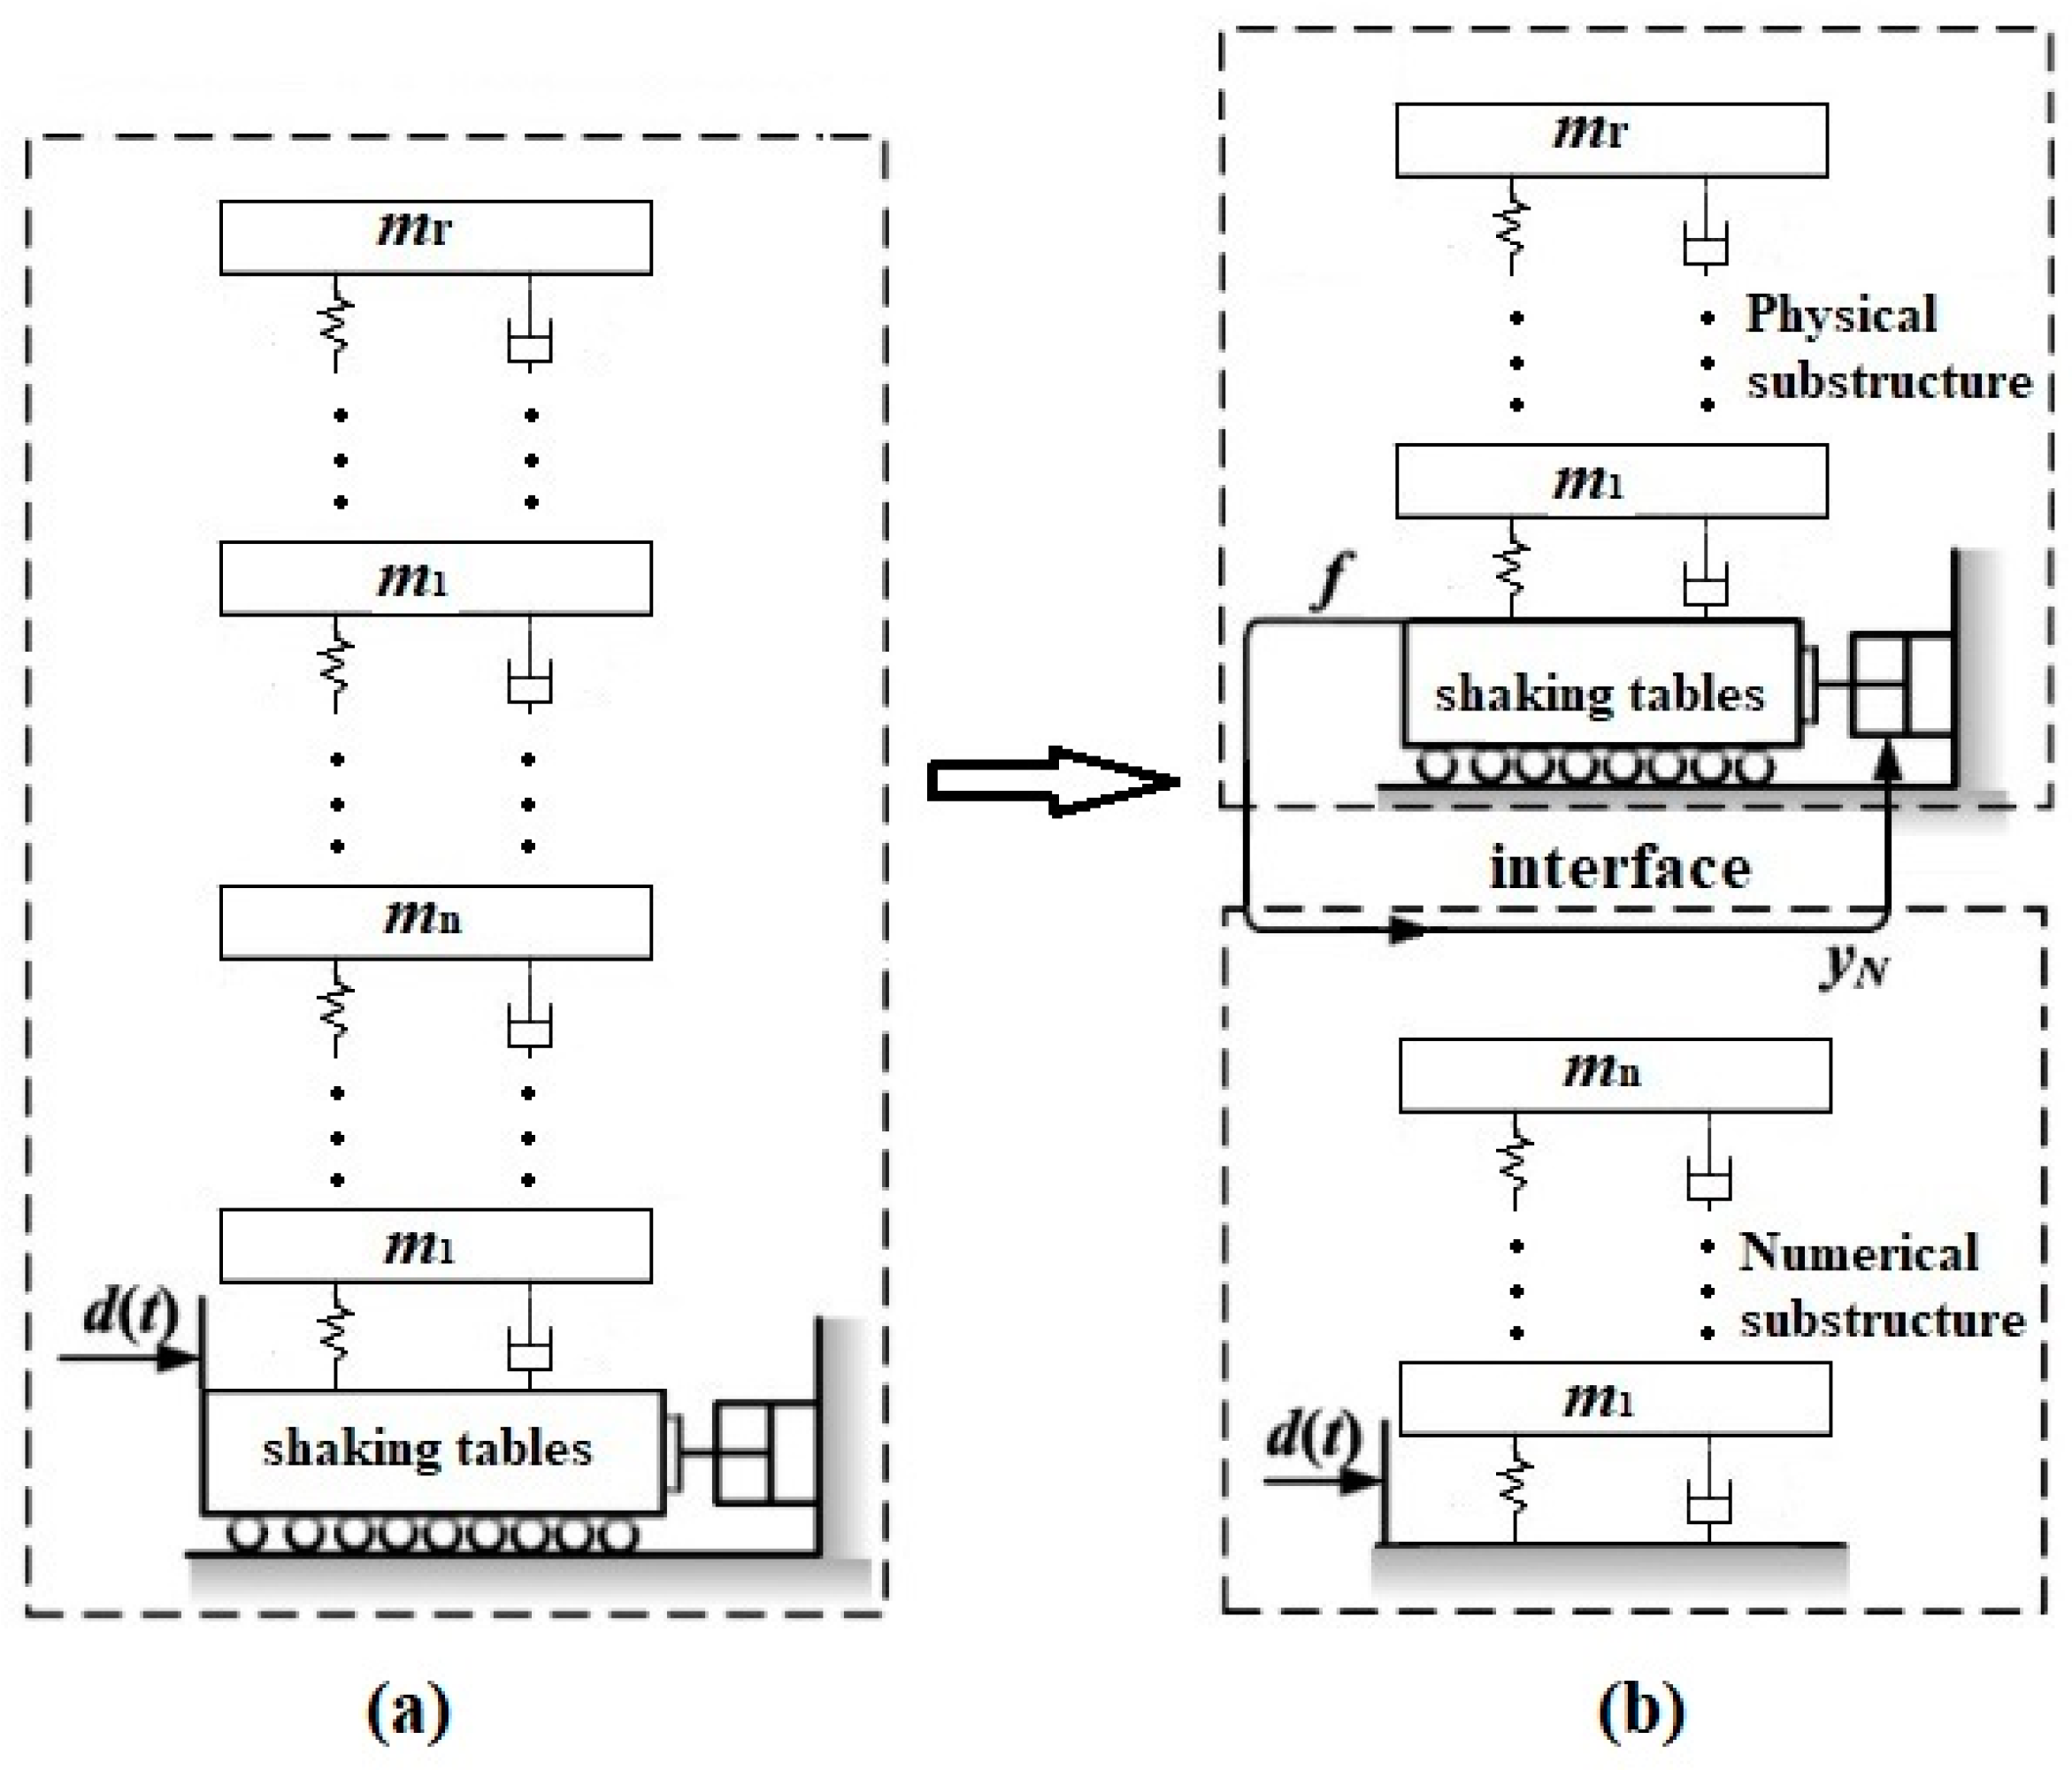
Figure 2.
Interface force solution diagram: (a) two-degree-of-freedom system; (b) multi-degree-of-freedom system.
Figure 2.
Interface force solution diagram: (a) two-degree-of-freedom system; (b) multi-degree-of-freedom system.

Figure 3.
Dynamic substructure testing for soil–structure interaction.

Figure 4.
Simulink model embedded in Matlab.
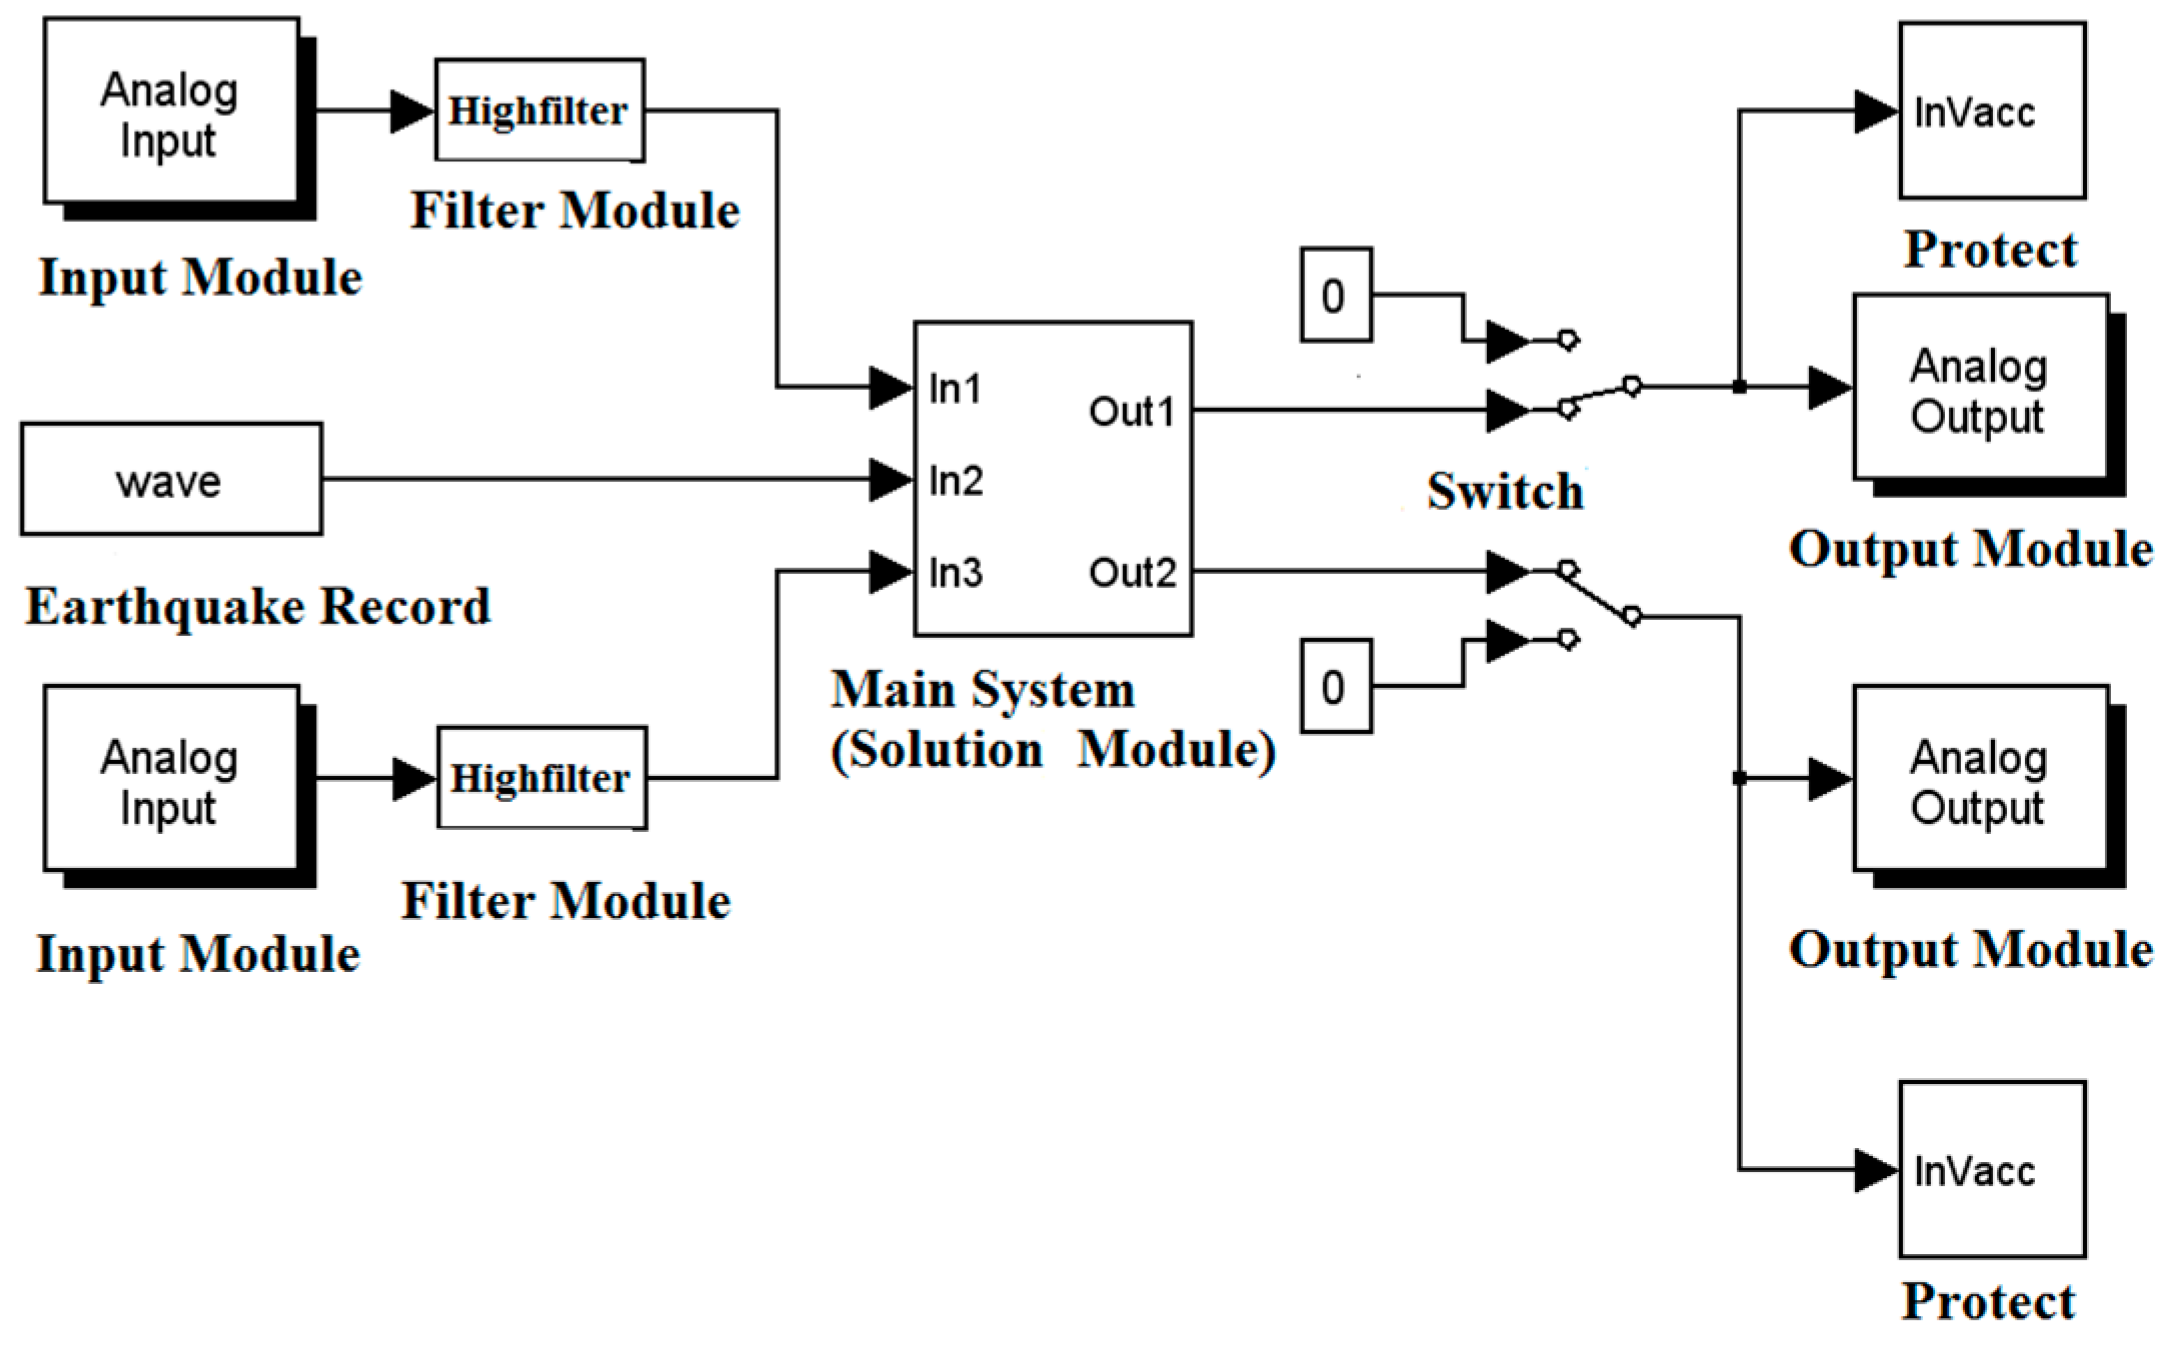
Figure 5.
Illustration of the specimen: (a) bridge specimen; (b) external dimension of the bridge specimen.
Figure 5.
Illustration of the specimen: (a) bridge specimen; (b) external dimension of the bridge specimen.

Figure 6.
Photographs of the construction phases of the shake table specimen: (a) rebar cage of pier; (b) rebar cage of beam; and (c) bridge model overview.
Figure 6.
Photographs of the construction phases of the shake table specimen: (a) rebar cage of pier; (b) rebar cage of beam; and (c) bridge model overview.

Figure 7.
Pile–foundation model proposed by Penzien (1964) [28].
Figure 7.
Pile–foundation model proposed by Penzien (1964) [28].
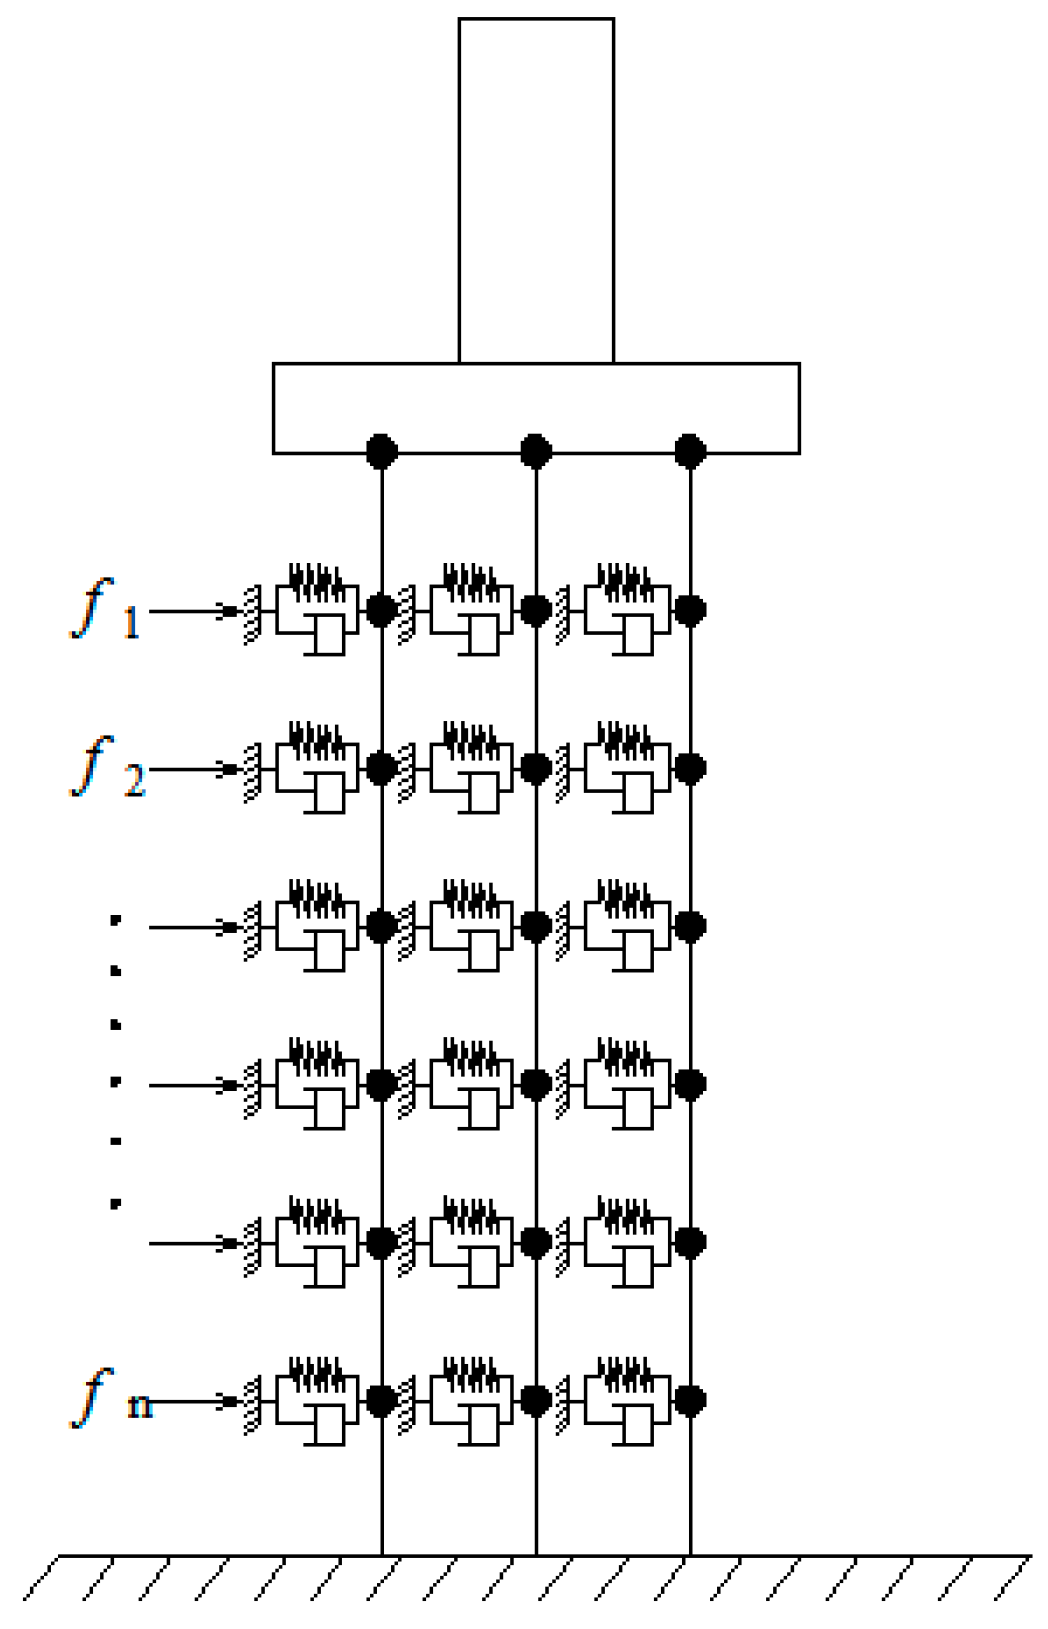
Figure 8.
Layout of the measuring point.

Figure 9.
Earthquake waves for test: (a) El-Centro Record; (b) Wenchuan Record; (c) Beijing Record; (d) Fourier spectrum of El-Centro; (e) Fourier spectrum of Wenchuan; (f) Fourier spectrum of Beijing Record; (g) Response spectrum of earthquake records.
Figure 9.
Earthquake waves for test: (a) El-Centro Record; (b) Wenchuan Record; (c) Beijing Record; (d) Fourier spectrum of El-Centro; (e) Fourier spectrum of Wenchuan; (f) Fourier spectrum of Beijing Record; (g) Response spectrum of earthquake records.

Figure 10.
Time history of the seismic responses under traveling wave excitation: (a) displacement time history of Pier 2 under earthquake records; (b) strain time history of Pier 2 under earthquake records.
Figure 10.
Time history of the seismic responses under traveling wave excitation: (a) displacement time history of Pier 2 under earthquake records; (b) strain time history of Pier 2 under earthquake records.

Figure 11.
Time history and Fourier spectrum of the shaking table with different shear velocities. (a) time history of artificial wave: (b) vs. = 400 m/s; (c) vs. = 300 m/s; and (d) vs. = 200 m/s. (e) Fourier spectrum of artificial wave: (f) vs. = 400 m/s; (g) vs. = 300 m/s; (h) vs. = 200 m/s.
Figure 11.
Time history and Fourier spectrum of the shaking table with different shear velocities. (a) time history of artificial wave: (b) vs. = 400 m/s; (c) vs. = 300 m/s; and (d) vs. = 200 m/s. (e) Fourier spectrum of artificial wave: (f) vs. = 400 m/s; (g) vs. = 300 m/s; (h) vs. = 200 m/s.
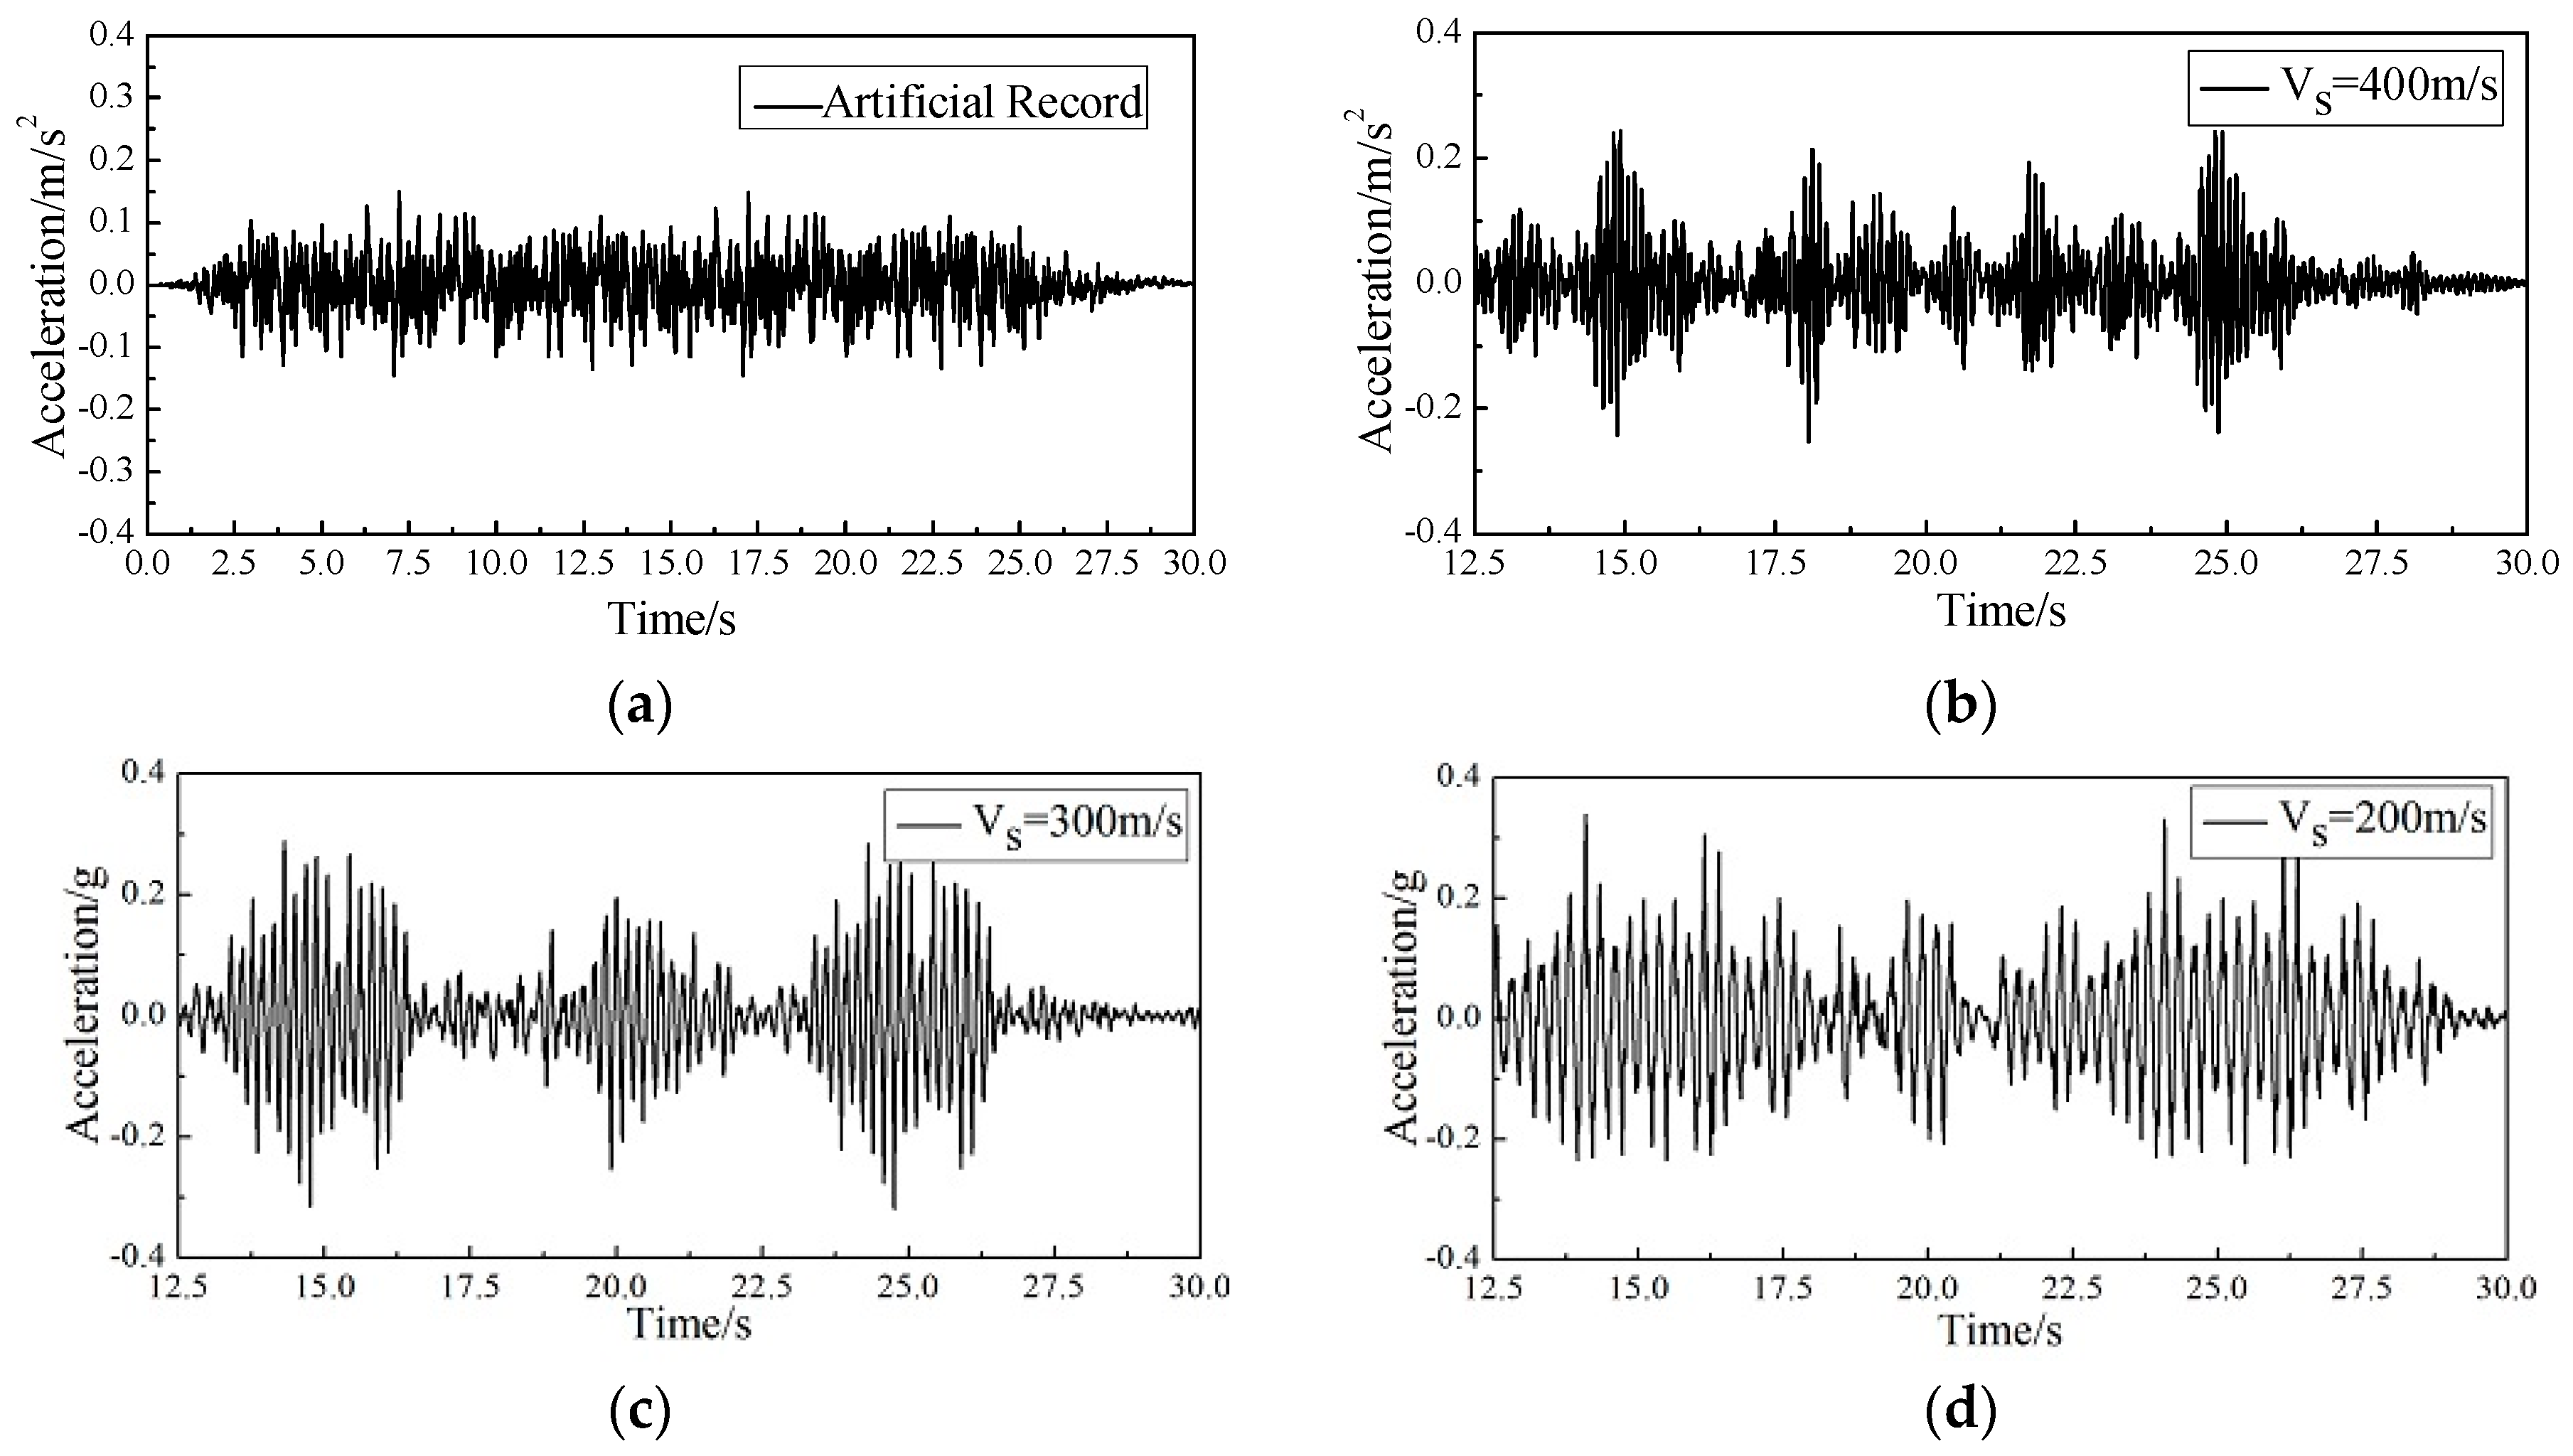

Figure 12.
Time history of the displacement of the bridge specimen: (a) displacement of bridge piers; (b) displacement of main girder.
Figure 12.
Time history of the displacement of the bridge specimen: (a) displacement of bridge piers; (b) displacement of main girder.
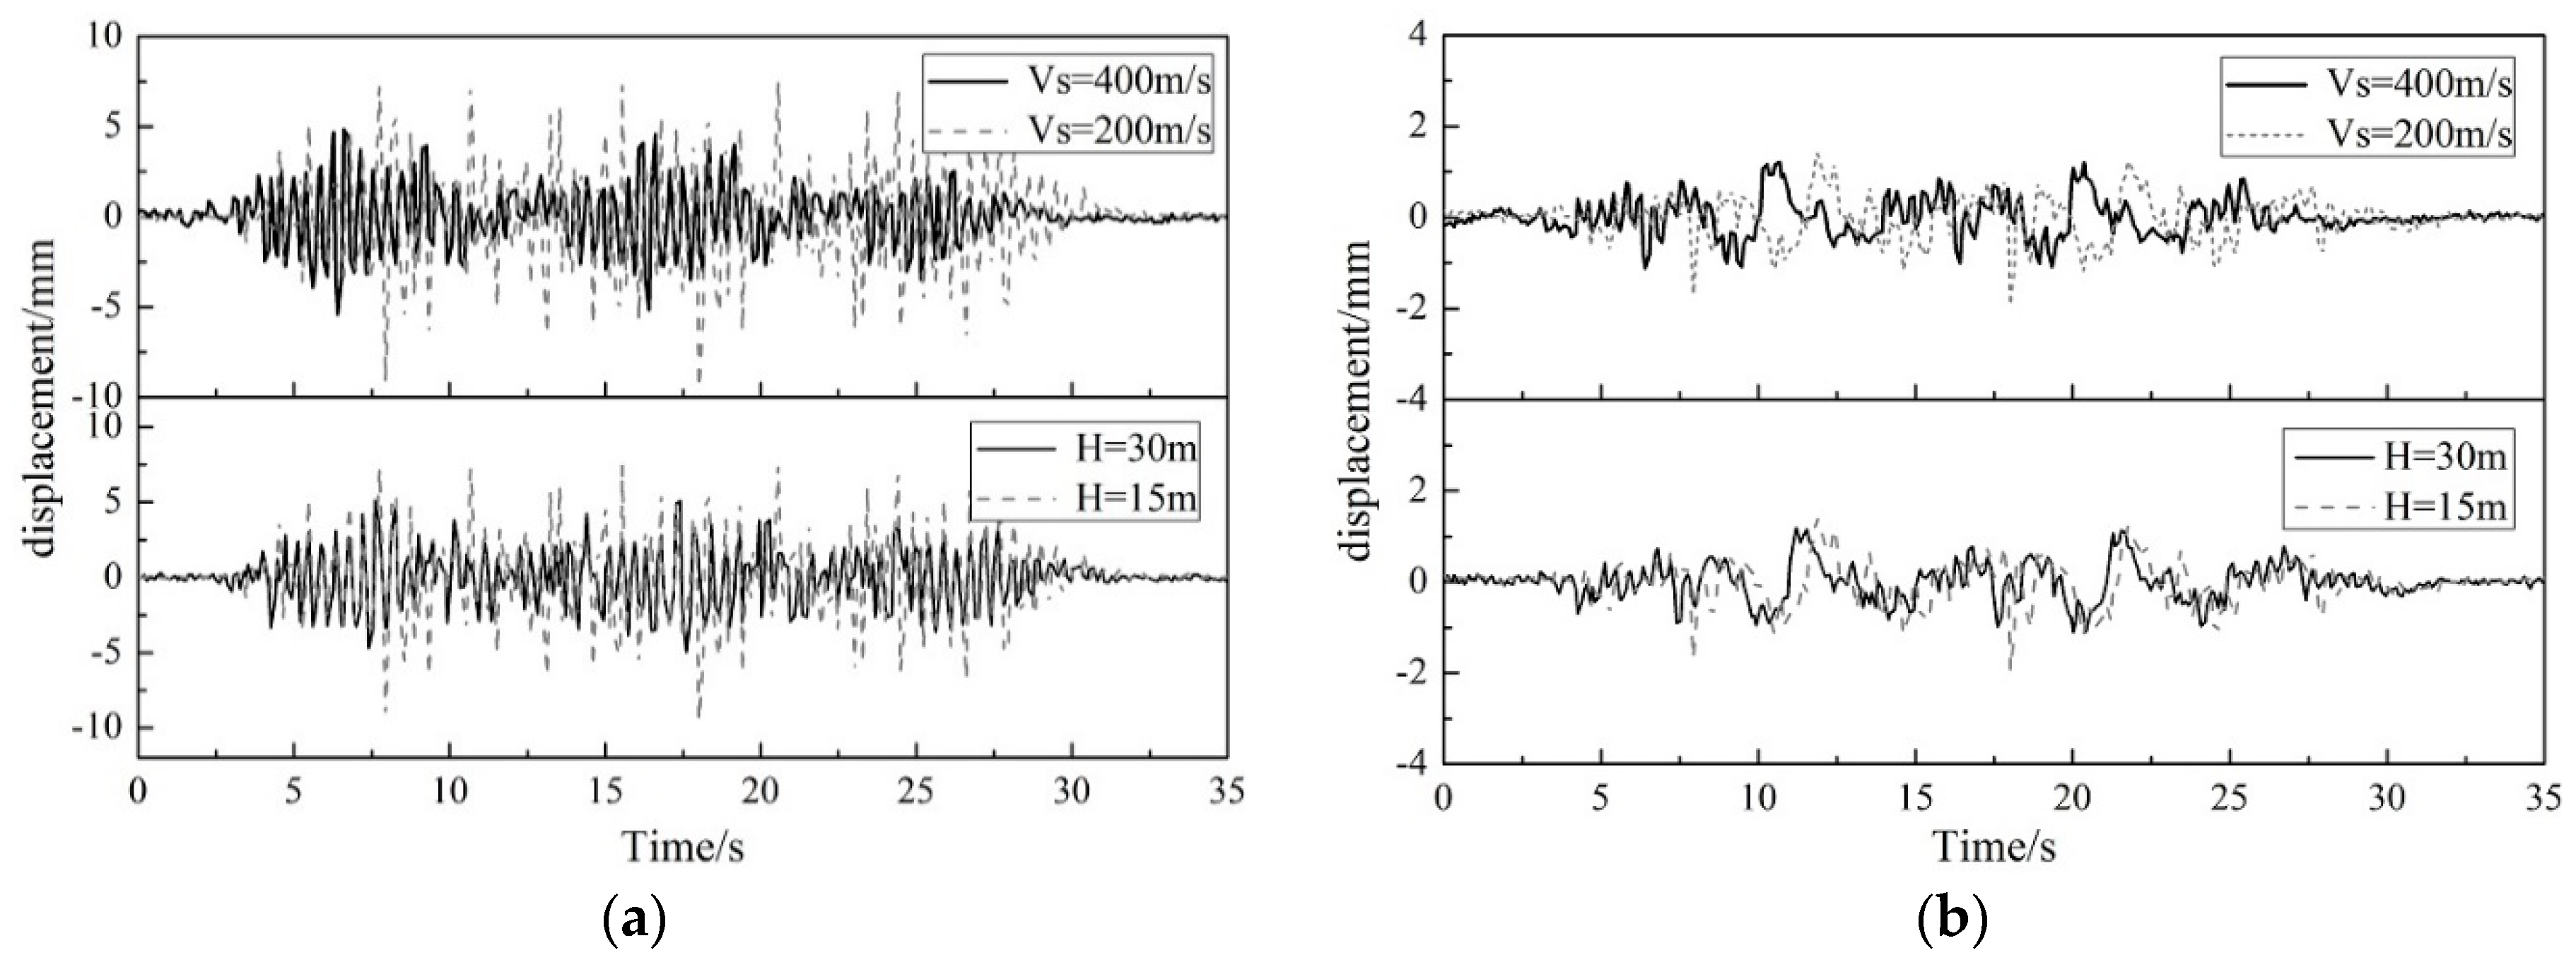
Figure 13.
Time history of the strain of the bridge specimen: (a) strain with different shear wave velocities; (b) strain with different thicknesses of overburden.
Figure 13.
Time history of the strain of the bridge specimen: (a) strain with different shear wave velocities; (b) strain with different thicknesses of overburden.
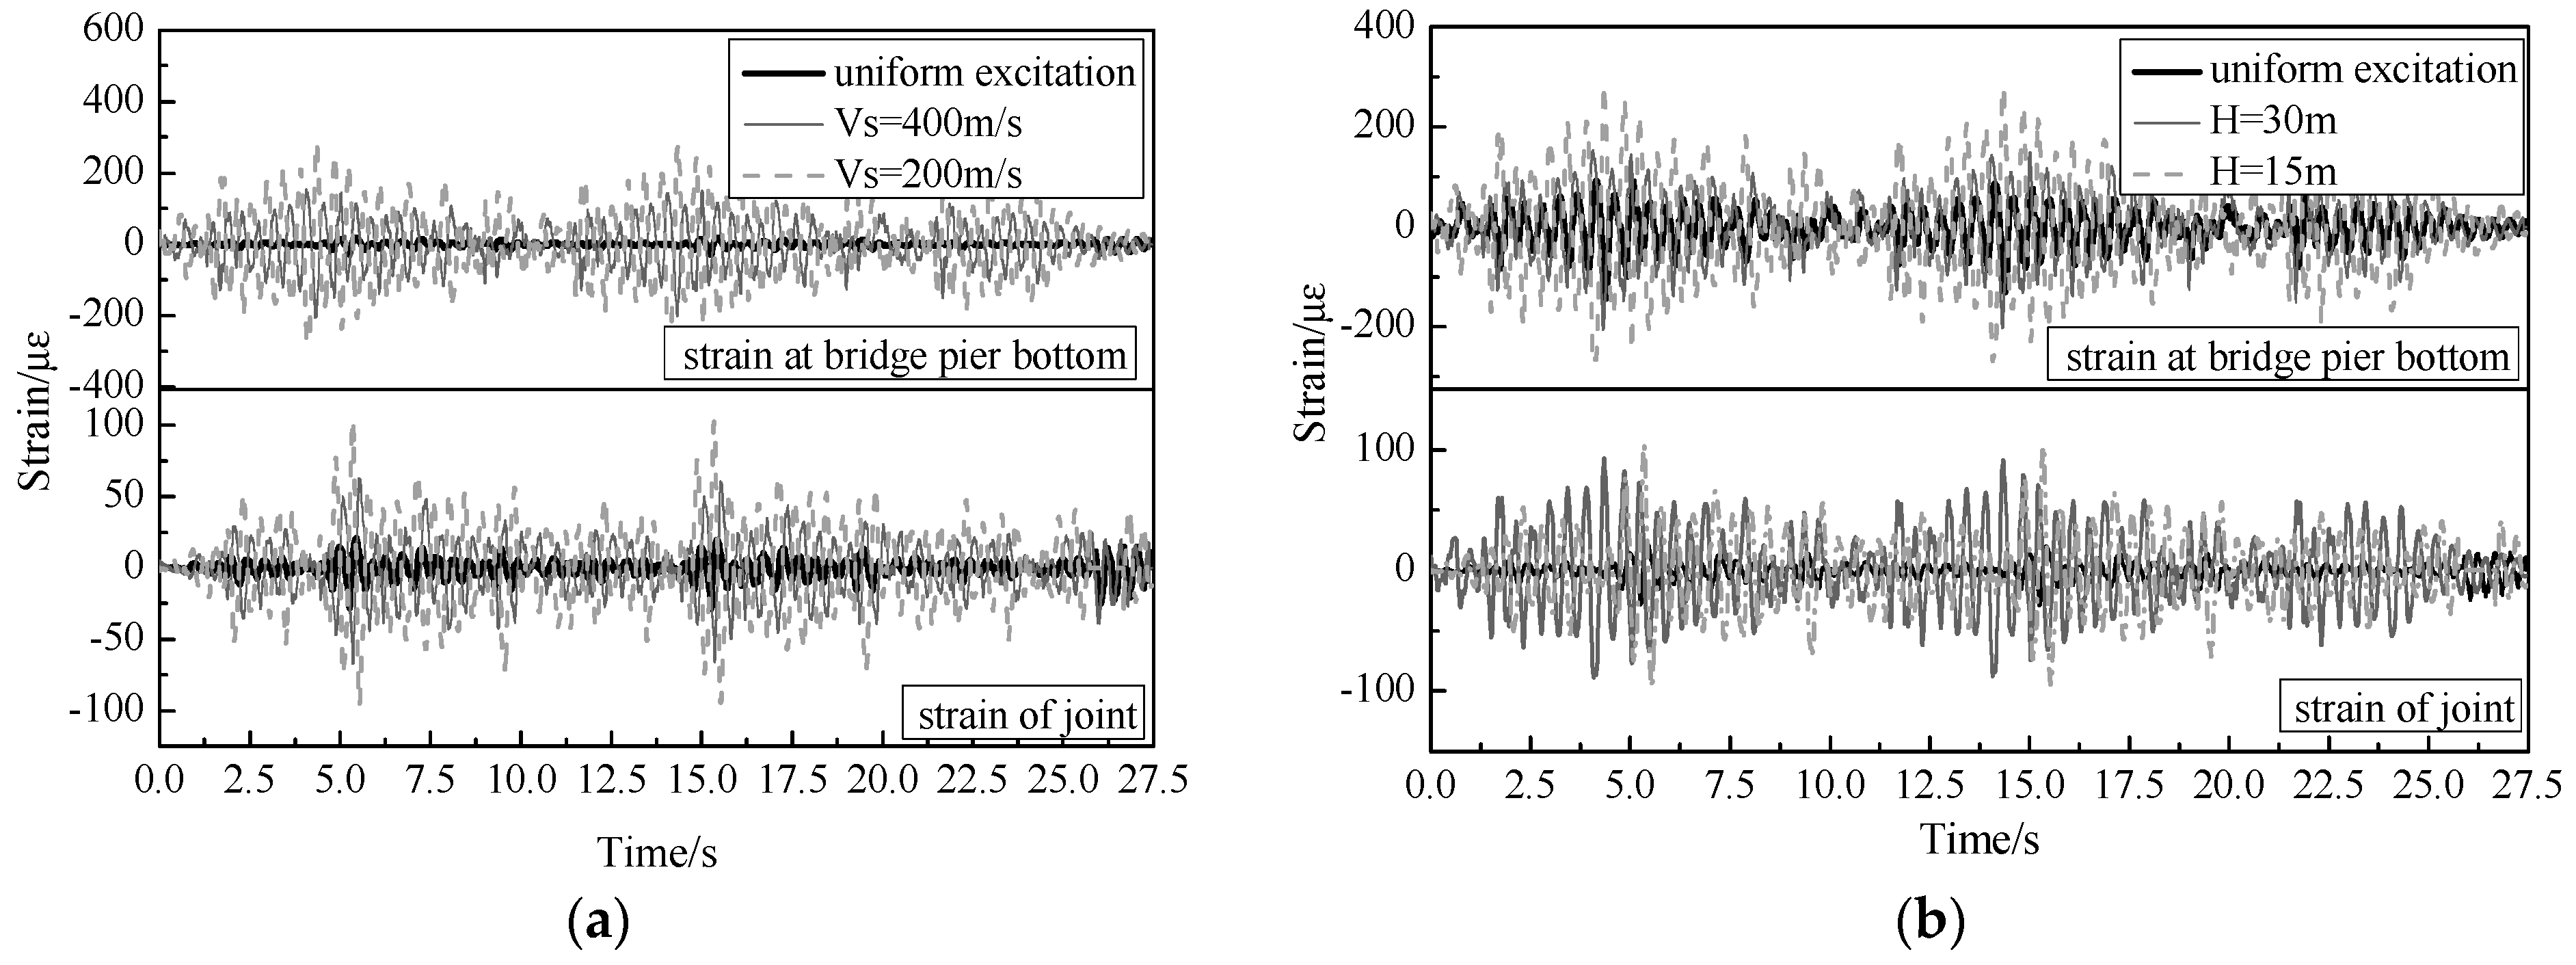
Figure 14.
SIMULINK Model for traveling wave effect and SSI effect.


Table 1.
Shaking table test program.
| Test ID | Wave Form | Peak Amplitude | Accessories Description |
|---|---|---|---|
| Case 1 | White noise | 0.05 g | |
| Case 2 | El-Centro Record | 0.385/1.1/1.5 g | Uniform excitation/Traveling wave excitation |
| Case 3 | Wenchuan Record | 0.385/1.1/1.5 g | Uniform excitation/Traveling wave excitation |
| Case 4 | Beijing Record | 0.385/1.1/1.5 g | Uniform excitation/Traveling wave excitation |
| Case 5 | Artificial wave I | 0.15 g | Shear wave velocity: 400 m/s, 300 m/s, 200 m/s |
| Case 6 | Artificial wave II | 0.15 g | Shear wave velocity: 400 m/s, 300 m/s, 200 m/s |
| Case 7 | Artificial wave III | 0.15 g | Shear wave velocity: 400 m/s, 300 m/s, 200 m/s |
Table 2.
Characteristic period for different site.
| Groups for Seismic Design | Site Category | ||||
|---|---|---|---|---|---|
| I0 | I1 | II | III | IV | |
| The first group | 0.20 | 0.25 | 0.35 | 0.45 | 0.65 |
| The second group | 0.25 | 0.30 | 0.40 | 0.55 | 0.75 |
| The third group | 0.30 | 0.35 | 0.45 | 0.65 | 0.90 |
Table 3.
Maximum responses of bridge piers under traveling wave excitation.
| Seismic Response | Pier 1 | Pier 2 | Pier 3 | Pier 4 | |||
|---|---|---|---|---|---|---|---|
Apparent Velocity | Stain at Pier Bottom/με | Stain at Pier Bottom/με | Displacement /mm | Stain at Pier Bottom/με | Displacement /mm | Stain at Pier Bottom/με | |
| Uniform excitation | El-Centro Record | 29.4 | 100.0 | 1.432 | 1.4 | 1.664 | 33.2 |
| Wenchuan Record | 67.9 | 155.0 | 3.864 | 165.0 | 4.183 | 73.8 | |
| Beijing Record | 66.9 | 163.7 | 6.732 | 209.0 | 6.656 | 78.8 | |
| 600 m/s | El-Centro Record | 30.8 | 104.4 | 1.498 | 133.2 | 1.692 | 34.5 |
| Wenchuan Record | 69.4 | 160.5 | 3.951 | 165.9 | 4.342 | 77.5 | |
| Beijing Record | 68.9 | 171.9 | 7.01 | 214.0 | 6.787 | 80.6 | |
| 400 m/s | El-Centro Record | 33.7 | 115.2 | 1.676 | 135.7 | 1.781 | 37.0 |
| Wenchuan Record | 74.0 | 172.2 | 4.232 | 171.0 | 4.838 | 79.1 | |
| Beijing Record | 74.7 | 191.7 | 7.228 | 226.1 | 7.197 | 86.6 | |
| 200 m/s | El-Centro Record | 41.3 | 139.9 | 1.829 | 141.4 | 1.847 | 46.3 |
| Wenchuan Record | 83.1 | 196.1 | 5.371 | 176.7 | 5.455 | 84.2 | |
| Beijing Record | 83.3 | 248.6 | 7.779 | 280.4 | 7.804 | 87.4 | |
| 100 m/s | El-Centro Record | 60.9 | 187.7 | 2.278 | 190.7 | 3.434 | 65.7 |
| Wenchuan Record | 106.8 | 225.7 | 6.253 | 226.6 | 6.229 | 110.5 | |
| Beijing Record | 135.7 | 341.0 | 8.501 | 344.6 | 8.761 | 143.3 | |
Table 4.
Maximum responses of joints under traveling wave excitation.
| Seismic Response | Strain of Joint 1 /με | Strain of Joint 2 /με | |
|---|---|---|---|
| Apparent Velocity | |||
| Uniform excitation | El-Centro Record | 31.6 | 18.1 |
| Wenchuan Record | 40.1 | 23.4 | |
| Beijing Record | 45.8 | 32.3 | |
| 400 m/s | El-Centro Record | 31.8 | 18.2 |
| Wenchuan Record | 40.3 | 23.6 | |
| Beijing Record | 46.1 | 33.2 | |
| 200 m/s | El-Centro Record | 32.9 | 20.3 |
| Wenchuan Record | 42.4 | 25.7 | |
| Beijing Record | 49.9 | 37.9 | |
| 100 m/s | El-Centro Record | 38.2 | 26.0 |
| Wenchuan Record | 58.5 | 35.7 | |
| Beijing Record | 74.2 | 52.8 |
Table 5.
Peak of the dynamic responses of the girder and bridge piers.
| Characteristic Period/s | Shear Wave Velocity/m/s | Thickness of the Overburden/m | Displacement of Pier 3/mm | Displacement of Pier 2/mm | Deflection of Girder/mm |
|---|---|---|---|---|---|
| 0.25 | 400 | 15 | 4.831 | 3.202 | 1.006 |
| 0.4 | 5.919 | 4.469 | 1.094 | ||
| 0.65 | 7.378 | 4.375 | 1.564 | ||
| 0.25 | 300 | 15 | 5.617 | 3.263 | 1.161 |
| 0.4 | 11.757 | 6.159 | 1.244 | ||
| 0.65 | 10.486 | 6.333 | 1.640 | ||
| 0.25 | 200 | 30 | 5.112 | 3.428 | 1.190 |
| 0.4 | 9.454 | 5.464 | 1.273 | ||
| 0.65 | 8.263 | 5.693 | 1.587 | ||
| 0.25 | 15 | 7.509 | 4.648 | 1.405 | |
| 0.4 | 11.481 | 7.539 | 1.306 | ||
| 0.65 | 11.448 | 8.449 | 1.772 |
Table 6.
Peak of the strain response of the girder and bridge piers.
| Characteristic Period/s | Shear Wave Velocity/m/s | Thickness of Overburden/m | Strain at Pier 2 Bottom/με | Strain at Pier 3 Bottom/με | Strain at Mid-Span of Girder/με | Strain of Joint 1/με | Strain of Joint 2/με |
|---|---|---|---|---|---|---|---|
| 0.25 | Uniform excitation | 142.6 | 138.1 | 9.1 | 28.6 | 28.3 | |
| 0.4 | 161.8 | 141.3 | 10.466 | 37.8 | 38.0 | ||
| 0.65 | 221.4 | 155.4 | 15.3 | 49.4 | 48.0 | ||
| 0.25 | 400 | 15 | 205.5 | 166.1 | 16.4 | 66.7 | 60.5 |
| 0.4 | 261.3 | 229.2 | 18.1 | 91.1 | 84.7 | ||
| 0.65 | 291.4 | 219.5 | 18.2 | 96.0 | 86.3 | ||
| 0.25 | 300 | 15 | 210.1 | 244.6 | 18.2 | 78.5 | 70.3 |
| 0.4 | 285.5 | 237.9 | 19.4 | 111.2 | 122.3 | ||
| 0.65 | 318.3 | 292.4 | 18.3 | 107.7 | 137.6 | ||
| 0.25 | 200 | 30 | 216.4 | 263.5 | 18.9 | 92.9 | 97.3 |
| 0.4 | 394.2 | 303.1 | 21.1 | 113.2 | 148.8 | ||
| 0.65 | 382.5 | 313.9 | 20.9 | 138.2 | 179.2 | ||
| 0.25 | 15 | 284.3 | 282.7 | 20.9 | 104.2 | 124.8 | |
| 0.4 | 410.1 | 401.0 | 22.6 | 163.5 | 174.4 | ||
| 0.65 | 442.1 | 443.9 | 21.4 | 157.7 | 204.8 | ||
Table 7.
Peak of the seismic response of the bridge specimen under an artificial wave (Td = 0.25 s).
Table 7.
Peak of the seismic response of the bridge specimen under an artificial wave (Td = 0.25 s).
| Seismic Response | Pier 2 | Pier 3 | Joint 1 | Joint 2 | ||||
|---|---|---|---|---|---|---|---|---|
| Test Schedule | Displacement /mm | Strain /με | Displacement /mm | Strain /με | Strain /με | Strain /με | ||
| Uniform excitation | 2.514 | 142.6 | 3.716 | 138.1 | 28.6 | 28.3 | ||
| Traveling wave effect | apparent velocity 200 m/s | 3.217 | 174.3 | 4.468 | 170.5 | 34.0 | 34.7 | |
| apparent velocity 100 m/s | 3.571 | 218.4 | 5.328 | 202.0 | 42.5 | 41.7 | ||
| SSI effect | Vs = 400 m/s | 3.202 | 205.5 | 4.831 | 166.1 | 66.7 | 60.5 | |
| Vs = 200 m/s | 4.648 | 284.3 | 7.509 | 282.7 | 104.2 | 124.8 | ||
| Both of them | apparent velocity 200 m/s | Vs = 400 m/s | 5.311 | 316.5 | 8.045 | 302.9 | 82.4 | 85.7 |
| Vs = 200 m/s | 6.812 | 352.8 | 10.542 | 377.7 | 123.1 | 134.0 | ||
| apparent velocity 100 m/s | Vs = 400 m/s | 6.213 | 381.5 | 8.579 | 331.3 | 115.3 | 99.2 | |
| Vs = 200 m/s | 7.297 | 419.0 | 10.654 | 445.5 | 143.8 | 149.1 | ||
Disclaimer/Publisher’s Note: The statements, opinions and data contained in all publications are solely those of the individual author(s) and contributor(s) and not of MDPI and/or the editor(s). MDPI and/or the editor(s) disclaim responsibility for any injury to people or property resulting from any ideas, methods, instructions or products referred to in the content. |
© 2024 by the authors. Licensee MDPI, Basel, Switzerland. This article is an open access article distributed under the terms and conditions of the Creative Commons Attribution (CC BY) license (https://creativecommons.org/licenses/by/4.0/).
Share and Cite
MDPI and ACS Style
Yan, X.-Y.; Cao, S.-S.; Zhao, Z. Shaking Tables Test on Seismic Responses of a Long-Span Rigid-Framed Bridge Considering Traveling Wave Effect and Soil–Structure Interaction. Buildings 2024, 14, 1432. https://doi.org/10.3390/buildings14051432
AMA Style
Yan X-Y, Cao S-S, Zhao Z. Shaking Tables Test on Seismic Responses of a Long-Span Rigid-Framed Bridge Considering Traveling Wave Effect and Soil–Structure Interaction. Buildings. 2024; 14(5):1432. https://doi.org/10.3390/buildings14051432
Chicago/Turabian StyleYan, Xiao-Yu, Shan-Shan Cao, and Zhuo Zhao. 2024. "Shaking Tables Test on Seismic Responses of a Long-Span Rigid-Framed Bridge Considering Traveling Wave Effect and Soil–Structure Interaction" Buildings 14, no. 5: 1432. https://doi.org/10.3390/buildings14051432
Note that from the first issue of 2016, this journal uses article numbers instead of page numbers. See further details here.