Article

Characterization of the Mitogenome of the Genus Dendrocerus Ratzeburg (Hymenoptera: Megaspilidae) with the Specific Designed Primers

1
Anhui Provincial Key Laboratory of the Conservation and Exploitation of Biological Resources, College of Life Sciences, Anhui Normal University, Wuhu 241000, China
2
Key Laboratory of Zoological Systematics and Evolution, Institute of Zoology, Chinese Academy of Sciences, Beijing 100000, China
3
Collaborative Innovation Center of Recovery and Reconstruction of Degraded Ecosystem in Wanjiang Basin Co-Founded by Anhui Province and Ministry of Education, School of Ecology and Environment, Anhui Normal University, Wuhu 241000, China
4
Key Laboratory of Plant Resources Conservation and Sustainable Utilization, Chinese Academy of Sciences, Guangzhou 510650, China
5
State Key Laboratory of Plant Diversity and Specialty Crops, South China Botanical Garden, Chinese Academy of Sciences, Guangzhou 510650, China
6
South China National Botanical Garden, Guangzhou 510650, China
*
Author to whom correspondence should be addressed.
Animals 2024, 14(10), 1454; https://doi.org/10.3390/ani14101454
Submission received: 11 April 2024 / Revised: 5 May 2024 / Accepted: 9 May 2024 / Published: 13 May 2024
(This article belongs to the Section Animal Genetics and Genomics)

Abstract

:

Simple Summary

In this study, we sequenced two mitochondrial genomes of Dendrocerus (Hymenoptera: Megaspilidae) to analyze the mitochondrial genomic features of Dendrocerus and provide new molecular data for phylogenetic studies of Evaniomorpha. The phylogenetic results revealed that Evaniomorpha is not a monophyletic group, which is also supported by the PBD (Pairwise breakpoint distances) values. Additionally, Ceraphronoidea is a monophyletic group and is a sister to Aulacidae + Gasteruptiidae. Furthermore, specific primers MegaF/MegaR were designed for Megaspilidae based on the “conserved regions” of COX1 sequences. They exhibited a good amplification efficiency of 60% for the genus Dendrocerus. This study provides new molecular data for phylogenetic studies of Evaniomorpha, further offering the possibility of solving a controversial problem in the phylogeny of Evaniomorpha and providing a solution to the problem of difficult amplification of the COX1 gene in Ceraphronoidea.

Abstract

In Hymenoptera, the monophyly of Evaniomorpha has been the focus of debate among different scholars. In this study, we sequenced two mitochondrial genomes of Dendrocerus (Hymenoptera: Megaspilidae) to analyze the mitochondrial genomic features of Dendrocerus and provide new molecular data for phylogenetic studies of Evaniomorpha. The mitogenome sizes of D. bellus and D. anisodontus were 15,445 bp and 15,373 bp, respectively, with the trnG of D. bellus missing. The nucleotide composition was significantly biased toward adenine and thymine, with A + T contents of 81.2% (D. bellus) and 82.4% (D. anisodontus). Using Ceraphron sp. (Ceraphronidae) as reference, the Ka/Ks values of NAD4L and NAD6 in D. anisodontus were both greater than one, indicating that non-synonymous mutations are favored by Darwinian selection, which is rare in other hymenopteran species. Compared with Ceraphon sp. gene order, nine operations were identified in D. anisodontus, including four reversals, four TDRLs (tandem duplication random losses) and one transposition, or four reversals and five TDRLs. Phylogenetic analysis of 40 mitochondrial genomes showed that Evaniomorpha was not a monophyletic group, which was also supported by the PBD values. Ceraphronoidea is a monophyletic group and is a sister to Aulacidae + Gasteruptiidae. Based on the conserved region of the newly sequenced mitochondrial genomes, a pair of specific primers MegaF/MegaR was designed for sequencing the COX1 genes in Megaspilidae and a 60% rate of success was achieved in the genus Dendrocerus.

1. Introduction

Megaspilidae is a small but widespread family of parasitoid wasps that contains approximately 450 species in 12 genera [1,2]. The monophyly of Evaniomorpha, to which the Megaspilidae belong, has been the focus of much scrutiny over the last decade, based on either morphological or molecular data, or both [3,4,5,6]. However, within Evaniomorpha, there is little consensus on the phylogenetic relationships among the superfamilies, due to the lack of reliable morphological characters to delimit the superfamilies and the limited molecular markers for constructing a robust phylogeny [7,8,9,10]. Mitochondrial (mt) genomes are one of the most highly studied genomic systems for species identification, molecular evolution, and phylogenetic inference [11,12,13,14]. In Hymenoptera, mitochondrial genomes have been extensively sequenced and provide useful genetic markers for phylogenetic inferences [13,14,15,16]. However, compared to other groups of Hymenoptera, the use of mitochondrial genomes for the phylogenetic analyses in Megaspilidae and Evaniomorpha is still scarce.
The taxonomy of Megaspilidae depends heavily on the morphology of the male genitalia [17]. Although effective in species delimitation, species identification by male genitalia has limitations, such as failure in matching the two sexes of the same species. Combining molecular identification can address this issue, but there are challenges in obtaining DNA barcodes (COX1) in Megaspilidae using universal primers due to the small size of the parasitoid, resulting in reduced amounts of extracted DNA and mixed DNA originating from the parasitioid and its host [18]. Vasilita et al. (2022) [18] developed an optimized barcoding protocol for Ceraphronoidea, but the success rate of barcoding dropped as more samples were tested, and its applicability in Megaspilidae is not clear. This suggests that new specific barcode primers designed with reference to complete mitochondrial genomes may be required.
Dendrocerus Ratzeburg, 1852, is the most representative and economically important genus of Megaspilidae [19]. It covers the range of all trophic levels from primary to quaternary parasitoids and has been used as a model system for understanding the ecology of parasitoidism [20]. In a previous study, we reported two species of Dendrocerus from China, Dendrocerus bellus Wang, Chen & Mikó, and Dendrocerus anisodontus Wang, Chen & Mikó [21]. Based on antennal characters, D. bellus and D. anisodontus belong to two representative species groups, halidayi and arpenter, respectively. Therefore, in this study, we sequenced two mitochondrial genomes of both species (Dendrocerus bellus Wang, Chen & Mikó and Dendrocerus anisodontus Wang, Chen & Mikó) and analyzed their characterizations. We then explored the phylogenetic relationships of Evaniomorpha based on the analyses of 38 hymenopteran mitogenomes downloaded from GenBank and the two newly generated sequences of Megaspilidae, with the aim of providing possibilities for solving controversial issues in the phylogeny of Evaniomorpha. Furthermore, based on the “conserved regions” of COX1 sequences, we designed specific primers for Megaspilidae, aiming to provide a solution to the difficult amplification of the COX1 gene in Ceraphronoidea.

2. Materials and Methods

2.1. Sample Preparation and DNA Extraction

All specimens of D. bellus and D. anisodontus were collected from the wild in Guangzhou, Guangdong, China, using sweep nets, Malaise traps, and yellow pan traps. All the specimens were stored at −20 °C in absolute ethanol prior to the selection of one sample of each species for DNA extraction and sequencing. Total genomic DNA was extracted using the cetyltrimethyl ammonium bromide (CTAB) method [22].

2.2. Sequencing and Assembly

Sequencing was performed using a whole genome shotgun (WGS) strategy on the Illumina Miseq platform. The quality of data was checked with FastQC [23,24]. The original data adapters were removed by AdapterRemoval version 2 [25]. SOAPec version 2.01 was used for quality correction with the K-mer set to 17 [24]. Reads with a length of less than 50 bp were excluded. A5-miseq version 2.0 was used to complete the assembly of the mitochondrial (mt) genome [24,26].

2.3. Mitochondrial Genome Annotation

The tRNA genes and protein-coding genes were identified using MITOS WebSever. The secondary structure was also predicted by the MITOS WebSever, with parameters set to the Invertebrate Mito genetic code [24,27]. Protein-coding genes (PCGs) were identified as open reading frames corresponding to the 13 PCGs in the metazoan mitogenomes and were checked manually. The mitogenome maps were produced using Organellar Genome DRAW (OGDRAW) [28].

2.4. Mitochondrial Genome Comparative Analysis

Base composition and relative synonymous codon usage (RSCU) were analyzed using MEGA X [29]. All the genes in the mitochondrial genome were checked using Geneious 10.0.5 (Biomatters, Auckland, New Zealand). Nucleotide composition, codon usage, comparative mitogenomic architecture for these two mitogenomes, and data used to plot RSCU (relative synonymous codon usage) were all calculated using PhyloSuite [27,30]. The predicted secondary structures of all tRNAs were drawn by Adobe Illustrator CC 2018 according to the MITOS predictions. Non-synonymous (Ka)/synonymous (Ks) mutation rate ratios among the 13 PCGs were calculated with DnaSP v5 [31,32]. AT/GC skewness was calculated as AT skew = (A − T)/(A + T) and GC skew = (G − C)/(G + C) [33]. A value of 0 means a balance between the bases in the two chains and no deviation in the base composition.

2.5. Phylogenetic Analysis

In this study, a dataset comprised 38 mitogenomes from GenBank, and two newly generated sequences were used for phylogenetic analysis. Labriocimbex sinicus (Cimbicidae) and Praia tianmunica (Cimbicidae) were used as the outgroups to reconstruct the phylogenetic tree of Apocrita. Each PCG was aligned individually based on codon optimized multiple alignments using MAFFT 7.3.1 with G-INS-I algorithms [34]. The aligned sequences were then concatenated and split into datasets (PCG12: including 13 PCGs without the third codon sites). Maximum likelihood (ML) analysis was conducted on the concatenated dataset for phylogeny reconstruction implemented in W-IQtree using the best-fit substitution model [35]. An ultrafast bootstrap (UFB) [36] of 1000 replications and the SH-aLRT test were used in this analysis to assess branch supports [37]. The resulting trees were visualized using FigTree v.1.3.1 and embellished with the Adobe Photoshop CS3 software.
Pairwise breakpoint distances (PBDs) between the mitochondrial genomes of each species were calculated using the web server CREx to analyze the proximity of species to each other, and heatmaps were constructed with eGPS 64 bit.

2.6. Specific Primer Design

Specific primers were designed based on the mitochondrial genome sequences of D. bellus and D. anisodontus, using the PrimerPremier 5 software to locate the “conserved regions”. The primer information was as follows: MegaF, 5′-ATAGAACTAATCACAAATTTATTGG-3′ (157 bp at the 5′ end position, Tm = 47.8 °C), and MegaR, 5′-TAAACTTCAGGGTGACCAAAGAATCA′ (389 bp at the 3′ end position, Tm = 54.8 °C). The primer amplification efficiency test included 15 samples of Megaspilidae, collected in Chongqing, China. Non-destructive DNA extraction was performed using the TIANamp Genomic DNA Kit. The DNA quantity in the eluate was checked prior to PCR reactions using an Implen NanoPhotometer N60. Amplification of the mitochondrial COX1 was conducted in a 20 µL PCR reaction with 2 µL DNA template. The cycling conditions were set as follows: pre-denaturation at 94 °C for 5 min, followed by 35 cycles of denaturation at 94 °C for 1 min, annealing at 51 °C for 1 min, and extension at 72 °C for 1 min. After the cycling, a final extension was performed at 72 °C for 5 min.

3. Results

3.1. Mitogenome Structure and Organization

The mitogenome lengths of D. bellus and D. anisodontus are 15,445 bp and 15,373 bp, respectively, with the trnG of D. bellus missing. D. anisodontus mainly contains 22 tRNA genes, 2 rRNA genes (rrnL and rrnS), and 13 PCGs (NAD1, NAD2, NAD3, NAD4, NAD5, NAD6, NAD4L, COX1–3, ATP8, ATP6, and CTYB). D. bellus mainly contains 21 tRNA genes, 2 rRNA genes (rrnL and rrnS), and 13 PCGs (NAD1, NAD2, NAD3, NAD4, NAD5, NAD6, NAD4L, COX1–3, ATP8, ATP6, and CTYB).
The transcription direction of the encoding genes in the genomes of these two species is generally consistent with that of other insects. Among the two species, 21 genes (trnM, trnI, COX2, trnK, trnD, ATP6, ATP8, COX3, trnS, trnN, COX1, trnL, NAD3, trnA, trnR, trnE, trnT, NAD6, CYTB, trnS, and NAD2) were located in the J chain, and 14 genes (trnC, trnV, trnQ, trnY, trnW, trnF, NAD5, trnH, NAD4, NAD4L, trnP, NAD1, trnL, and rrnL) were located in the N chain, While the rrnS of D. bellus is located on the N chain, and the trnG and rrnS of D. anisodontus are located on the J chain (Figure 1).

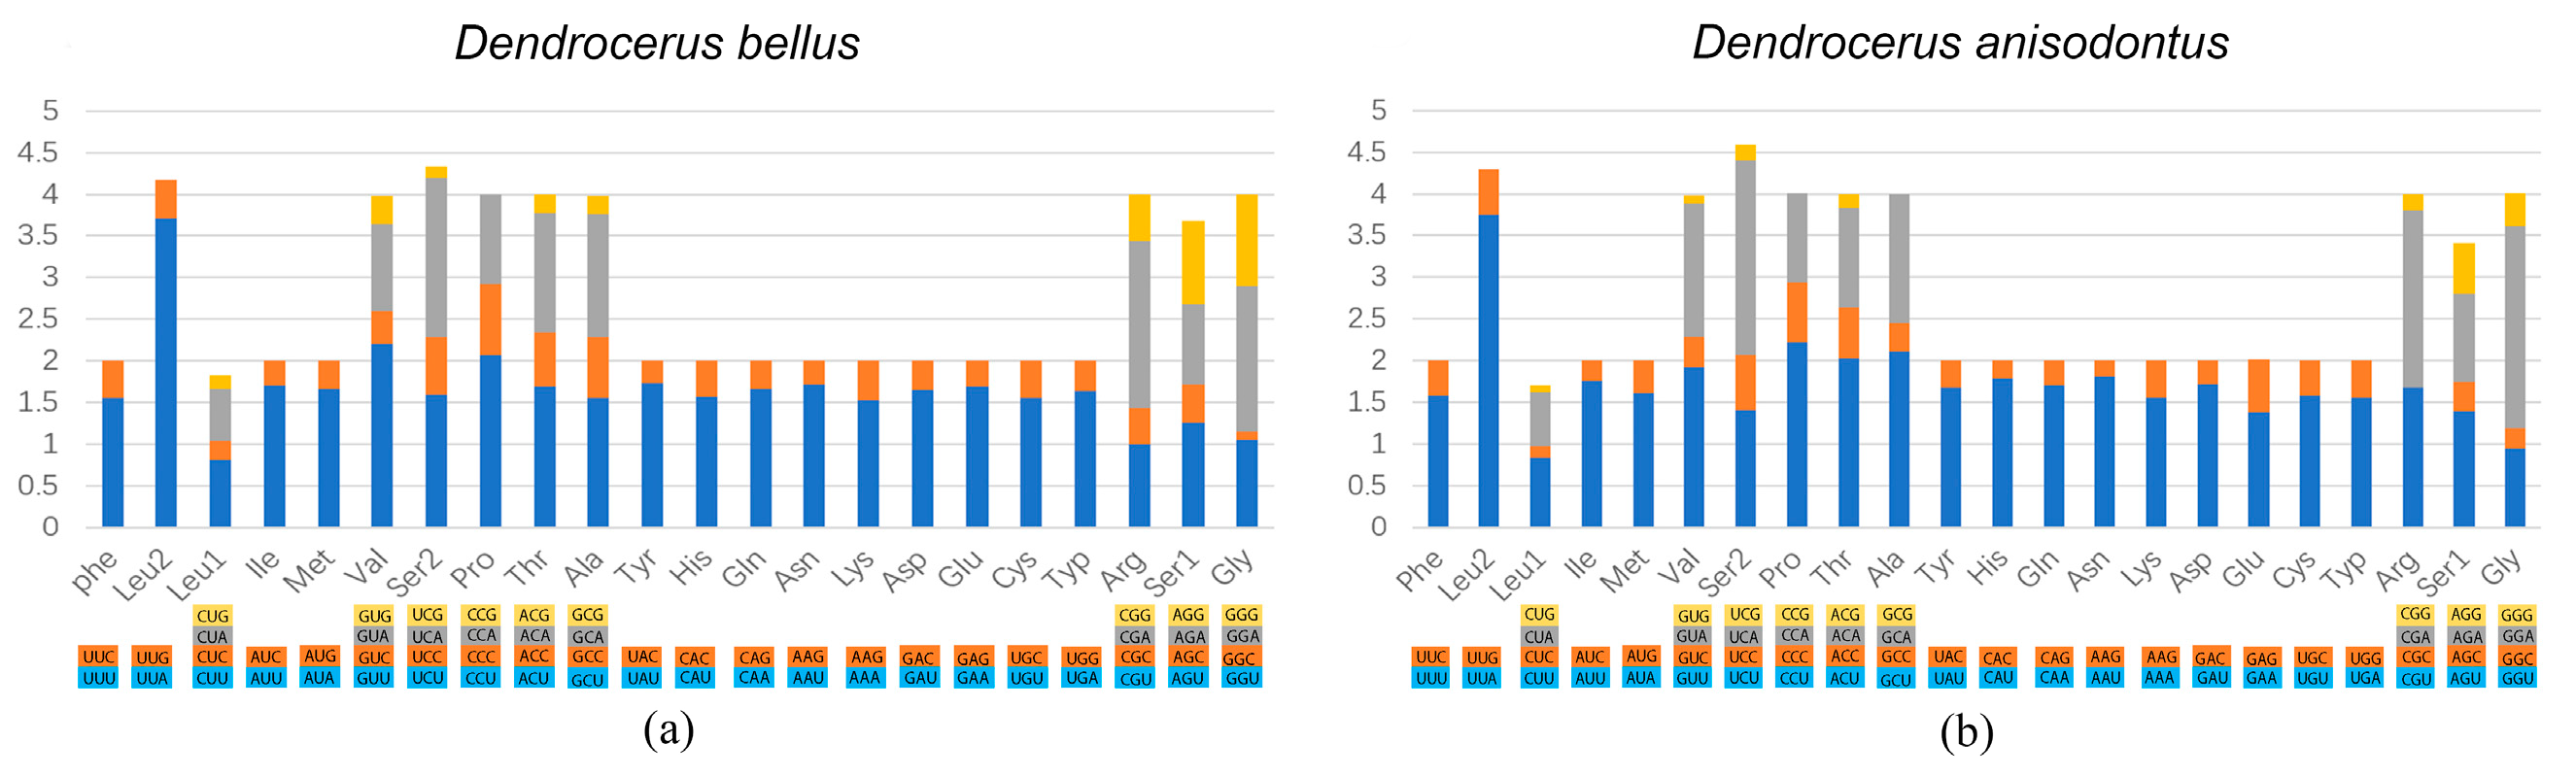
3.2. Protein-Coding Genes

The size of 13 PCGs were 11,173 bp and 11,214 bp, respectively (Table 1), accounting for 72.34% and 72.95% of the entire genome, respectively. The average AT content of the 13 protein-coding genes in D. anisodontus was 80.90% and 79.20% in D. bellus. The 13 PCGs with the lowest single AT content were all COX1, with 70.50% in D. bellus and 72.90% in D. anisodontus; the 13 PCGs with the highest single AT content were all NAD2, with 87.00% in D. bellus and 87.30% in D. anisodontus (Table 2).
All 13 protein-coding genes (PCGs) were initiated with the standard start codon of ATN. Four types of start codons—ATA, ATT, ATG, and ATC—were used (Table 2). Additionally, there were three types of stop codons: TAA, TAG, and T. The COX2, ATP8, ATP6, COX3, NAD3, NAD4L, and NAD2 genes were stopped with TAA in the two species. The COX1, NAD4, and NAD6 genes in D. bellus and the CYTB and NAD1 genes in D. anisodontus were also stopped with TAA. The CYTB and NAD1 genes in D. anisodontus were stopped with TAA and the other genes had an incomplete stop codon T (Table 2). Incomplete termination codons are common in animal mitochondrial DNA and are likely to be completed by post-transcriptional polyadenylation [38].
Codons with high A/T content were preferred in these two species, as in most insect mitochondrial genomes [39]. In the two studied species, Ala, Gly, Leu, Pro, Arg, Ser, Thr, and Val were the most frequently used amino acids, and UUA (Leu) had the highest relative synonymous codon usage (RSCU) (Figure 2). The third codon position of A/T occurred more frequently than that of G/C, reflecting AT nucleotide bias in the mitochondrial PCGs among Megaspilidae.

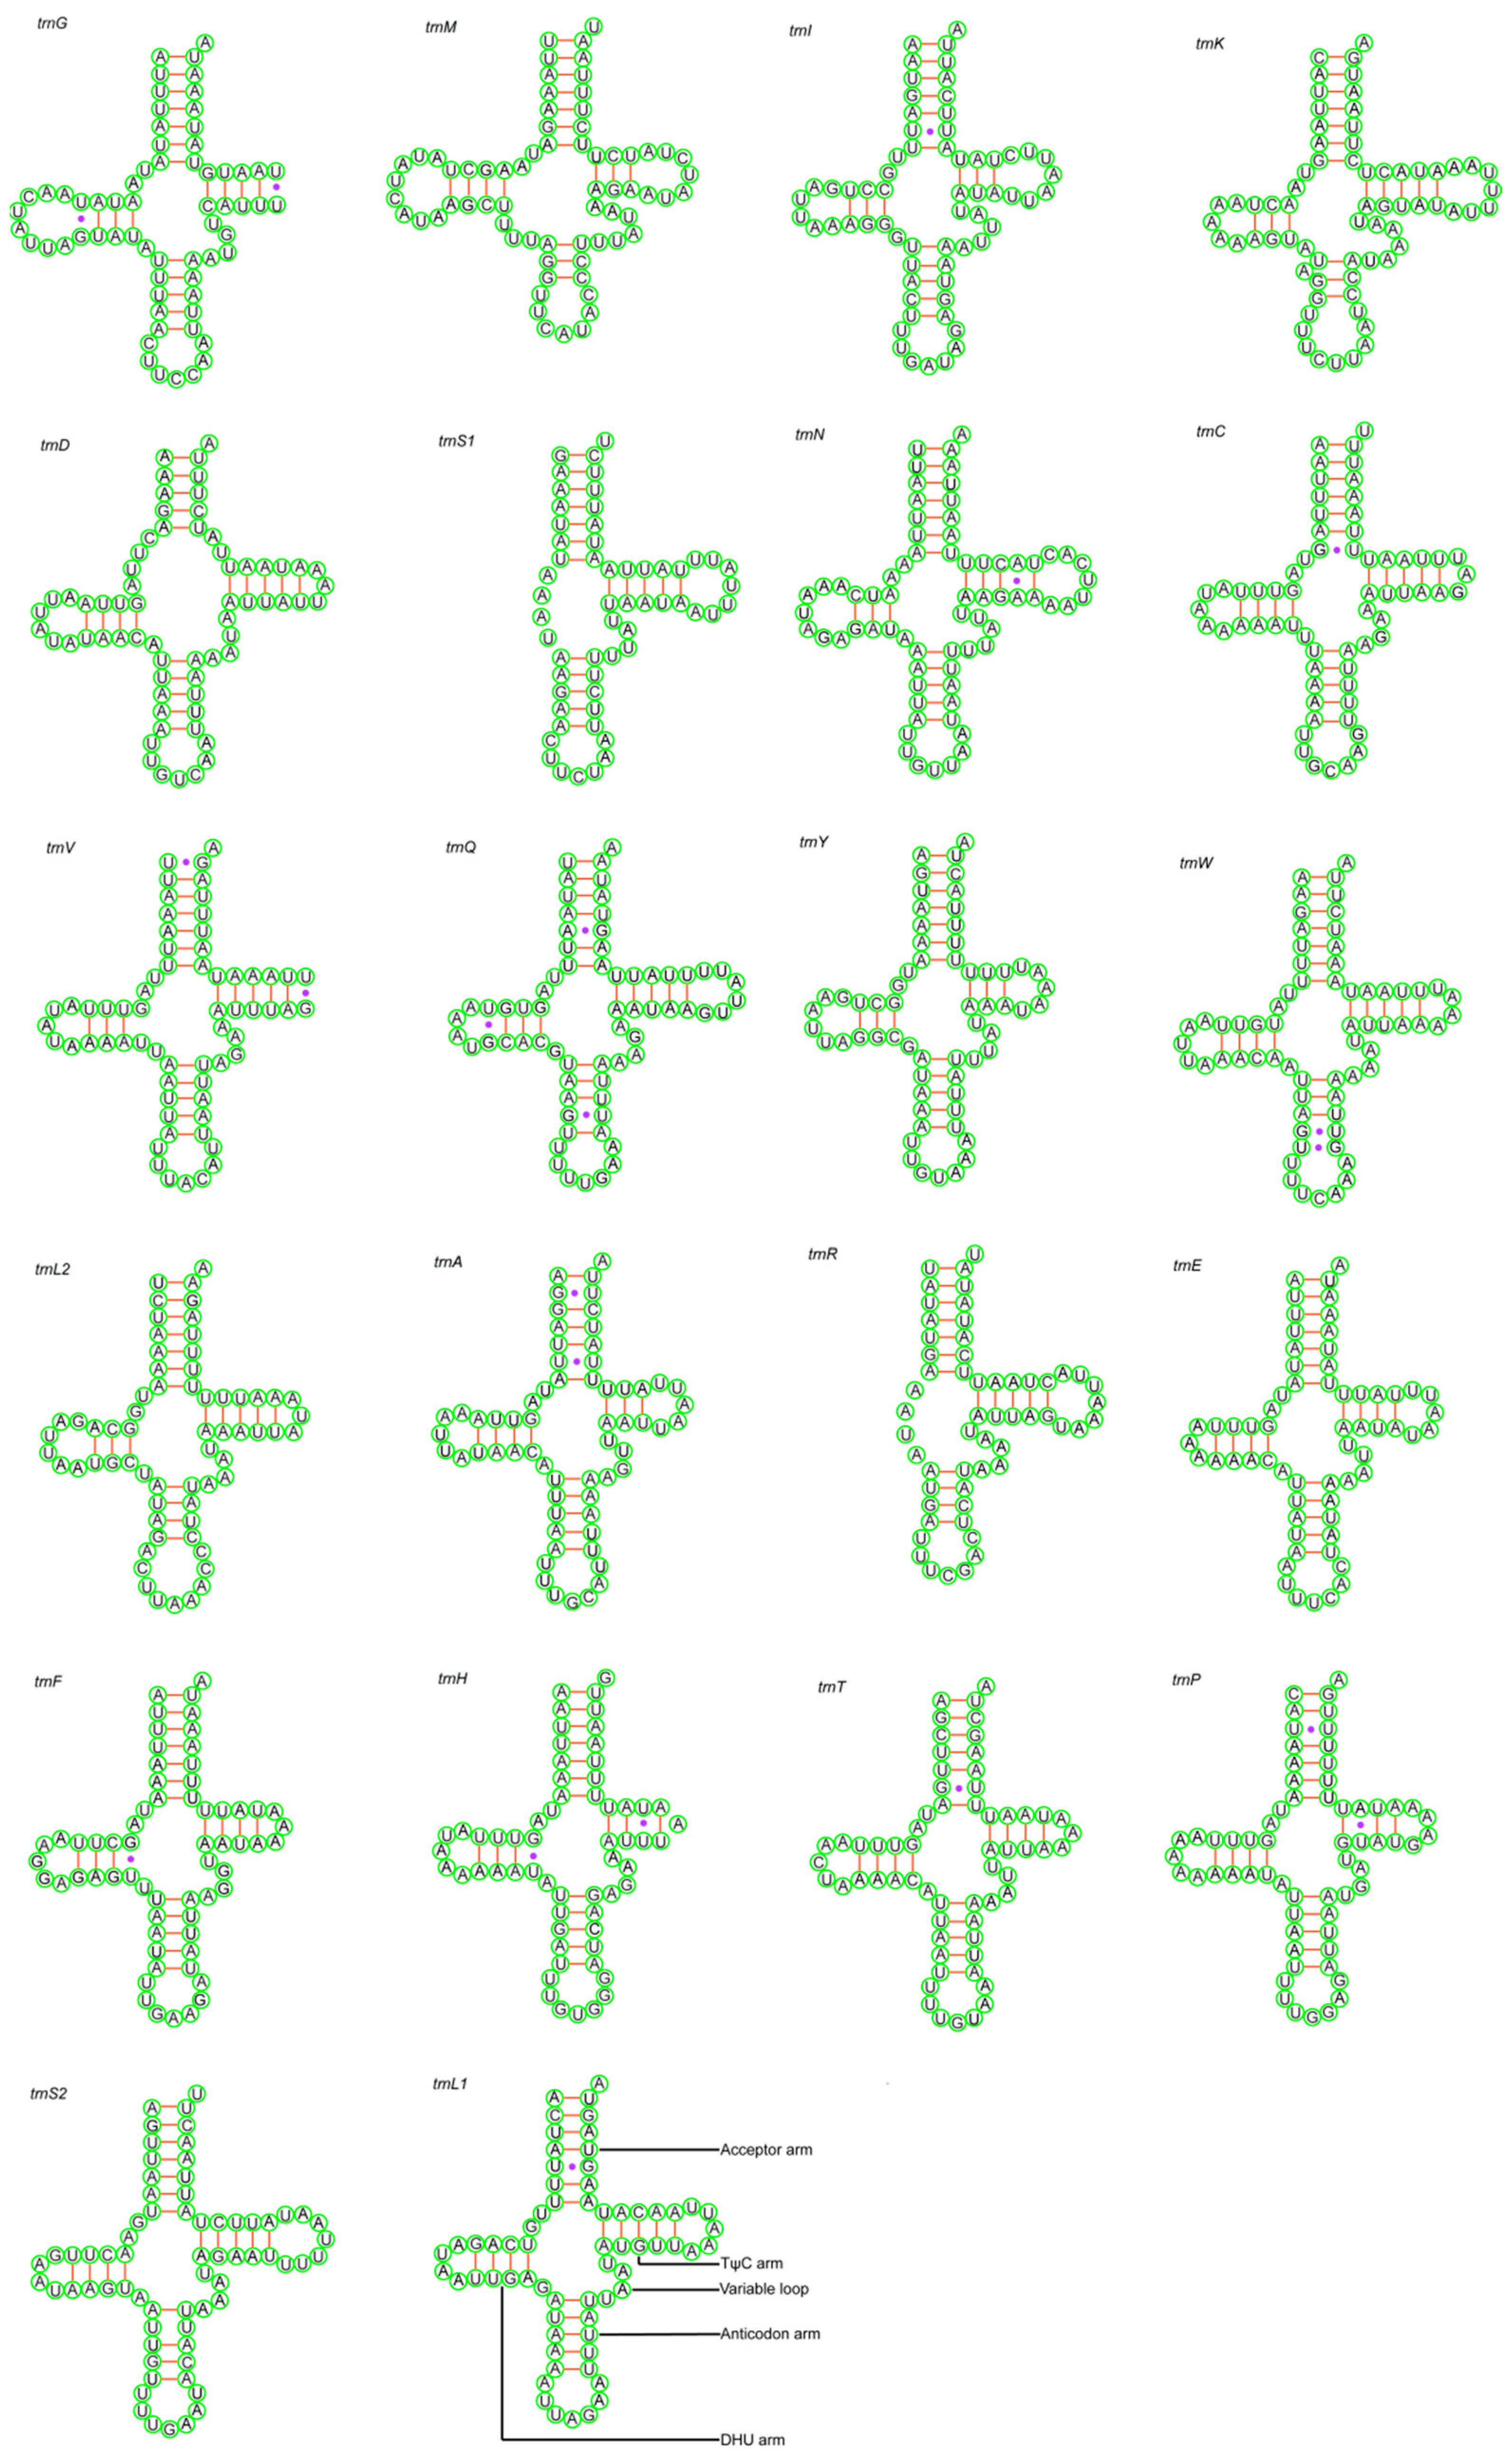
3.3. Transfer RNA and Ribosomal RNA Genes

In total, 21 tRNAs of D. bellus and 22 tRNAs of D. anisodontus genes were interspersed throughout the two Megaspilidae mitochondrial genomes. These two species had similar features in the tRNA and rRNA genes. The tRNA genes of the two mitogenomes were dispersed among the genes of rRNA and PCG. Most tRNAs could be folded into the clover-leaf secondary structures, while the trnS1 and trnR of both species lack the DHU arm (Figure 3 and Figure 4). The tRNAs of the two species range from 52 to 69 bp and 56 to 70 bp, respectively (Table 2). Their positions and sizes follow the typical organization for insect mtDNA.
In these two species, the length of rrnS is 785 bp; the length of rrnL of D. anisodontus is slightly longer than that of D. bellus, 1384 bp and 1336 bp, respectively. For the AT contents of rrnL, the content of D. anisodontus is slightly higher than that of D. bellus, with 86.9% and 86.7%, respectively. The AT content of rrnS is slightly higher in D. bellus than in D. anisodontus, at 87.4% and 86.5%, respectively.

3.4. Overlap and Gap

The number of gap sites and bases as well as the number of overlap sites and bases in D. bellus were all slightly higher than those in D. anisodontus. Among the 21 gap sites of D. bellus, there were a total of 343 bp intergenic nucleotides, ranging from 1 bp to 105 bp. The longest gap between trnK and trnD was 105 bp. The shortest gap was 1 bp, which was located between COX2 and trnK and NAD5 and trnH. D. anisodontus had 17 gap sites, and a total of 196 bp, ranging from 1 bp to 34 bp. The longest gap was 34 bp between trnE and trnF, and the shortest gap was 1 bp, located between trnV and trnQ and between trnP and trnT.
Among the 7 gaps of D. bellus, there were a total of 22 bp of overlapping nucleotides. D. anisodontus had 5 overlapping sites totaling 16 bp. The overlapping sites in both species ranged from 1 bp to 7 bp. The longest gap between NAD4 and NAD4L was 7 bp, and the shortest gap was 1 bp. They differed due to the fact that the shortest gap in D. bellus was between trnA and trnR or trnE and trnF, while the shortest gap in D. anisodontus was between trnK and trnD (Table 1).

3.5. Evolutionary Rate Analysis

The estimated evolutionary rates for non-synonymous and synonymous substitution across the 13 PCGs in the two mitochondrial genomes range from 0.1592 to 2.2323. In the two species, the largest Ka/Ks values are in NAD4, which are 2.2323 and 2.1057; the smallest Ka/Ks values are in COX1, which are 0.1838 and 0.1592, respectively (Figure 5).
In both species, the highest Ka/Ks values are NAD4, which are 2.2323 and 2.1057, respectively; the Ka/Ks values of NAD2 are both greater than 1, which are 1.3502 and 1.3417, respectively. In D.anisodontus, the Ka/Ks values of NAD4L and NAD6 are both greater than one, indicating that non-synonymous mutations are favored by Darwinian selection, and they will be retained at a rate greater than synonymous mutations, which is rare in other species. Otherwise, most of the 13 protein-coding genes in the two species were purified and selected.

3.6. Gene Arrangement

We inferred the evolution of gene arrangement in Megaspilidae using CREx by comparing the common intervals between Megaspilidae and Ceraphronidae gene order (Figure 6) [40]. Three operations were considered in CREx, i.e., transposition, reversal, and TDRL. From Megaspilidae D. anisodontus gene order to Ceraphronidae Ceraphon sp. gene order, the CREx identified nine operations, including four reversal (operations 1–2 and 5–6 in Figure 6), four TDRLs (operations 3 and 7–9 in Figure 6), and one transposition (operation 4 in Figure 6, referring to NAD6) or four reversals (operations 1′–2′ and 5′–6′ in Figure 6) and five TDRLs (operations 3′–4′ and 7′–9′).
There are two sets of alternative scenarios in operations 1–4. The first set of scenarios refers to two reversals of trnE and NAD6, followed by one TDRL and one transposition, while the other set refers to two reversal and two TDRLs. There are also two optional scenarios in operations 5–9. In the first scenario of operations 5–9, the first step is one reversal from COX2-trnK-trnD-ATP8-ATP6-COX3-trnS1-trnN to trnN-trnS1-COX3-ATP6-ATP8-trnD-trnK-COX2; the second step is one reversal of nine protein genes, 17 tRNA genes, and two rRNA genes; the remaining steps are three TDRLs. The second set of scenarios in operations five–nine also refers to two reversals and three TDRLs.

3.7. Phylogenetic Analysis

Based on the matrix of PCG12, a robust phylogenetic tree was achieved with high bootstrap values or posterior probabilities (Figure 7). Ceraphronoidea is clearly a monophyletic group and forms a sister group with (Aulacidae + Gasteruptiidae). Evanioidea (Evaniidae, Aulacidae and Gasteruptiidae) are also not a monophyletic group, as Evaniidae is a sister group of Mutiiidae. The relationship between Pteromalidae, Megalyridae, and Trigonalyidae is as follows: (Pteromalidae + (Megalyridae + Trigonalyidae)). Therefore, Evaniomorpha is not a monophyletic group.
The value of pairwise breakpoint distances between Aulacidae, Pristaulacus compressus, and Evaniidae, Evania appendigaster, was 12. For Aulacidae, Pristaulacus compressus, and Vespidae, Vespula flaviceps, the value was 13. Similarly, for Aulacidae, Pristaulacus compressus, and Apidae, Habropoda radoszkowskii, the value was 11 (Figure 8). Lower values of PBD indicated closer relationships which are not consistent with the topology among Aulacidae, Evaniidae, Vespidae, and Apidae on the phylogenetic tree. The PBD values of Pteromalidae, Pachyneuron aphidis, and other species were greater than 34, which are also inconsistent with the phylogenetic tree. Evaniomorpha is not a monophyletic group according to the phylogenetic relationships shown by the PBD values, which is consistent with the phylogenetic tree.

3.8. Specific Primer Design

Based on the conserved regions of Megaspilidae COX1 sequences, we designed a pair of specific primers. i.e., MegaF, 5′-ATAGAACTAATCACAAATTTATTGG-3′ (5′ end position 157 bp, Tm = 47. 8 °C); MegaR, 5′-TAAACTTCAGGGTGACCAAAGAATCA′ (3′ end position 389 bp, Tm = 54.8 °C), with the production size of 650 bp. The newly designed primers were tested for efficiency with 15 specimens of Dendrocerus, and the amplification success rate was 60% (Table 3 and Table 4).

4. Discussion

Currently, only two complete mitochondrial genomes of Megaspilidae are available, and no mitogenomes of Dendrocerus species have been reported in the NCBI database. In this study, we first sequenced and analyzed two mitochondrial genomes from Dendrocerus (D. bellus and D. anisodontus). Like other parasitic wasps, the Dendrocerus had a high A + T content and a negative GC skew. However, in the present study, D. bellus and D. anisodontus had opposite AT skew of −0.0025 and 0.0243, respectively, which might be due to the deletion of the trnG gene in D. bellus.
We estimated the average Ka/Ks values for each PCG to better understand the function of selection pressure and the development of the two mitochondrial genomes. Among the 13 PCGs of D. bellus and D. anisodontus, NAD4 had the highest average Ka/Ks of 2.2323 and 2.1057, and COX1 had the lowest average Ka/Ks of 0.1838 and 0.1592, respectively. In D. anisodontus, the Ka/Ks values of NAD4L and NAD6 were both greater than one, indicating that non-synonymous mutations are favored by Darwinian selection, and they will be retained at a rate greater than synonymous mutations, which is rare in other species.
Codon usage bias can be an indicator of the selective pressure operating at the molecular level [41]. The relative synonymous codon usage (RSCU) rates and codon distributions for the two mitochondrial genomes (Figure 2) showed that the most frequently used amino acids were Ala, Gly, Leu, Pro, Arg, Ser, Thr, and Val, and the highest relative synonymous codon usage was UAA. In addition, the codons were biased to utilize more A/U than G/C, which resulted in the AT content being higher than GC in the PCGs.
The mitogenome gene order of Dendrocerus is consistent with Conostigmus without gene rearrangement, indicating that the gene arrangement within Megaspilidae might be conserved. However, due to the lack of mitogenome data from other genera of Megaspilidae, this conclusion needs further investigation. A series of gene rearrangements are evident relative to the putative ancestral pancrustacean mitochondrial genome. Compared with the ancestor Drosophila yakuba (Diptera, Drosophilidae), 11 tRNA and two protein genes were rearranged in Megaspilidae [42]. The most striking gene rearrangement in the Megaspilidae resulted from the separation of two rRNA genes (rrnL, rrnS) by the protein-coding genes NAD2 (NAD6 in the Ceraphronidae), which was not observed in other Hymenoptera [8]. The mitogenomes gene order of Megasoplidae has changed considerably compared to Ceraphonidae. Therefore, we inferred the evolution of gene arrangement in Megaspilidae using CREx by comparing the common intervals between Megaspilidae and Ceraphronidae gene orders. From Megaspilidae gene order to Ceraphronidae gene order, there are two rearrangement pathway, including four reversal, four TDRLs, and one transposition or four reversals and five TDRLs.
To date, most molecular phylogenies involving Evaniomorpha were dependent on relatively short mt and nuclear gene fragments [8]. Few studies had used the entire mt genome and pairwise breakpoint distances (PBDs) to assess phylogenies of Evaniomorpha or higher-level taxa in Apocrita. Our study is the first attempt to use PBD to analyze the phylogeny of Evaniomorpha. The PBD value between Pristaulacus compressus (Aulacidae) and Habropoda radoszkowskii (Apidae) was 11, while the PBD value between Pristaulacus compressus (Aulacidae) and Diadegma semiclausum (Ichneumonidae) was also 11. The PBD value between Pristaulacus compressus (Aulacidae) and Megalyra sp. (Megalyridae) was 18, and the PBD value between Pristaulacus compressus (Aulacidae) and Taeniogonalos taihorina (Trigonalidae) was 18. Lower PBD values indicate that Aulacidae Pristaulacus compressus was more closely related to Habropoda radoszkowskii (Apidae) and Diadegma semiclausum (Ichneumonidae), which was not consistent with the phylogenetic tree, but indirectly suggests the non-monophyly of Evaniomorpha. Ceraphronoidea (Megaspilidae and Ceraphronoidae) are robustly monophyletic, which was confirmed in our study [17]. However, the phylogenetic placement of Ceraphronoidea within Apocrita remains unresolved, with current molecular studies indicating a position as a sister group to Ichneumonoidea or as sister group to Evaniidae, in a clade that is a sister group to Aculeata or as a sister group to (Evanioidea + Stephanoidea) [6,9]. In our study, the Ceraphronoidea was related to (Aulacidae + Gasteruptiidae) as a sister group, which was inconsistent with the conclusion of previous studies. Based on ultraconserved elements (UCEs) and mitochondrial genomes, respectively, Blaimer et al. (2023) and Mao et al. (2014) [8] considered Megalyridae and Trigonalidae form a sister group, which is further confirmed in our study.
Our study presents some hypotheses for the phylogenetic relationships of Evaniomorpha, but many questions remain unresolved. In particular, there is still considerable uncertainty regarding the relationships within Evaniomorpha and the nested relationships between Evaniomorpha and Aculeata. More mitochondrial genome data are required to provide sufficient evidence for understanding the phylogenetic relationships of Evaniomorpha in the future.
The newly designed primer pair MegaF/MegaR worked well for Dendrocerus. However, due to the limited diversity of samples tested so far, further studies on Megaspilidae specific primers are still needed to assess the amplification efficiency in other genera of Megaspilidae.

5. Conclusions

By sequencing two mitochondrial genomes of Dendrocerus (Hymenoptera: Megaspilidae) and comprehensively analyzing multiple mitochondrial groups, we have arrived at the following conclusions.
The mitogenome sizes of D. bellus and D. anisodontus which are 15,445 bp and 15,373 bp, respectively, display a nucleotide composition heavily biased towards adenine and thymine. Notably, the Ka/Ks values of NAD4L and NAD6 in D. anisodontus exceed one, suggesting a preference for non-synonymous mutations under Darwinian selection, which is uncommon in hymenopteran species. Moreover, D. anisodontus underwent nine rearrangements compared to Ceraphon sp., including four reversals, four tandem duplication random losses (TDRLs), and one transposition. Meanwhile, Ceraphronoidea is a monophyletic group that forms a sister group with (Aulacidae + Gasteruptiidae), while Evaniomorpha is not a monophyletic group, and this was further confirmed by congruence with PBD values. Additionally, utilizing the “conserved regions” of COX1 sequences, we designed specific primers MegaF/MegaR tailored for Megaspilidae. These primers exhibited a satisfactory amplification efficiency of 60% for the Dendrocerus genus.

Author Contributions

Conceptualization, Y.H. and H.C.; methodology, X.W., Y.H., and H.C.; software, W.Z., S.C., and B.S.; formal analysis, W.Z., S.C., and B.S.; resources, X.W.; data curation, W.Z. and B.S.; writing—original draft preparation, S.C.; writing—review and editing, X.W., Y.H., and H.C.; visualization, W.Z., S.C., and B.S.; supervision, X.W., Y.H., and H.C.; project administration, H.C.; funding acquisition, X.W. and Y.H. All authors have read and agreed to the published version of the manuscript.

Funding

This research was funded by the National Natural Science Foundation of China (grant numbers: 32100352 and 32100355), the National Science & Technology Fundamental Resources Investigation Program of China (grant number: 2019FY101800), and the University Synergy Innovation Program of Anhui Province (grant number: GXXT-2022-067).

Institutional Review Board Statement

Not applicable.

Informed Consent Statement

Not applicable.

Data Availability Statement

All sequences generated during this study have been deposited in the GenBank (https://www.ncbi.nlm.nih.gov/genbank/) (accessed on 21 September 2023).

Acknowledgments

We sincerely thank the Provincial Key Laboratory of Biological Environment and Ecological Safety of Anhui Province for its great support.

Conflicts of Interest

The authors declare no conflicts of interest. The funders had no role in the design of the study; in the collection, analyses, or interpretation of data; in the writing of the manuscript; or in the decision to publish the results.

References

  1. Iemma, L.G.R.; Tavares, M.T.; Sousa-Silva, C.R. First record of Dendrocerus carpenteri (Hymenoptera: Megaspilidae) on Aphidius ervi in alfalfa fields in Brazil. Braz. J. Biol. 2016, 76, 1066–1067. [Google Scholar] [CrossRef] [PubMed]
  2. Dessart, P. Familia Megaspilidae. In Hymenoptera de la Región Neotropical; Hanson, P.E., Gould, I.D., Eds.; Memoirs of the American Entomological Institute: Gainesville, FL, USA, 2006; Volume 77, pp. 232–236. [Google Scholar]
  3. Blaimer, B.B.; Santos, B.F.; Cruaud, A.; Gates, M.W.; Kula, R.R.; Mikó, I.; Rasplus, J.-Y.; Smith, D.R.; Talamas, E.J.; Brady, S.G.; et al. Key innovations and the diversification of Hymenoptera. Nat. Commun. 2023, 14, 1212. [Google Scholar] [CrossRef] [PubMed]
  4. Heraty, J.; Ronquist, F.; Carpenter, J.M.; Hawks, D.; Schulmeister, S.; Dowling, A.P.; Murray, D.; Munro, J.; Wheeler, W.C.; Schiff, N.; et al. Evolution of the hymenopteran megaradiation. Mol. Phylogenetics Evol. 2011, 60, 73–88. [Google Scholar] [CrossRef]
  5. Rasnttsyn, A.P.; Haichun, Z. Early Evolution of Apocrita (Insecta, Hymenoptera) as Indicated by New Findings in the Middle Jurassic of Daohugou, Northeast China. Acta Geol. Sin. -Engl. Ed. 2010, 84, 834–873. [Google Scholar] [CrossRef]
  6. Tang, P.; Zhu, J.-C.; Zheng, B.-Y.; Wei, S.-J.; Sharkey, M.; Chen, X.-X.; Vogler, A.P. Mitochondrial phylogenomics of the Hymenoptera. Mol. Phylogenetics Evol. 2019, 131, 8–18. [Google Scholar] [CrossRef]
  7. Klopfstein, S.; Vilhelmsen, L.; Heraty, J.M.; Sharkey, M.; Ronquist, F. The hymenopteran tree of life: Evidence from protein-coding genes and objectively aligned ribosomal data. PLoS ONE 2013, 8, e69344. [Google Scholar] [CrossRef] [PubMed]
  8. Mao, M.; Gibson, T.; Dowton, M. Evolutionary dynamics of the mitochondrial genome in the evaniomorpha (hymenoptera)—A group with an intermediate rate of gene rearrangement. Genome Biol. Evol. 2014, 6, 1862–1874. [Google Scholar] [CrossRef]
  9. Peters, R.S.; Krogmann, L.; Mayer, C.; Donath, A.; Gunkel, S.; Meusemann, K.; Kozlov, A.; Podsiadlowski, L.; Petersen, M.; Lanfear, R.; et al. Evolutionary History of the Hymenoptera. Curr. Biol. 2017, 27, 1013–1018. [Google Scholar] [CrossRef] [PubMed]
  10. Sharkey, M.J.; Carpenter, J.M.; Vilhelmsen, L.; Heraty, J.; Liljeblad, J.; Dowling, A.P.; Schulmeister, S.; Murray, D.; Deans, A.R.; Ronquist, F.; et al. Phylogenetic relationships among superfamilies of Hymenoptera. Cladistics 2012, 28, 80–112. [Google Scholar] [CrossRef]
  11. Boore, J.L.; Brown, W.M. Big trees from little genomes: Mitochondrial gene order as a phylogenetic tool. Curr. Opin. Genet. Dev. 1998, 8, 668–674. [Google Scholar] [CrossRef]
  12. Curole, J.P.; Kocher, T.D. Mitogenomics: Digging deeper with complete mitochondrial genomes. Trends Ecol. Evol. 1999, 14, 394–398. [Google Scholar] [CrossRef]
  13. Cameron, S.L. Insect mitochondrial genomics: Implications for evolution and phylogeny. Annu. Rev. Èntomol. 2014, 59, 95–117. [Google Scholar] [CrossRef]
  14. Huang, L.; Sun, H.-Q.; Li, C.-J.; Zhao, W.-X.; Yao, Y.-X. The complete mitochondrial genome of Platygaster robiniae (Hymenoptera: Platygastridae): A novel tRNA secondary structure, gene rearrangements and phylogenetic implications. Int. J. Parasitol. Parasites Wildl. 2022, 18, 249–259. [Google Scholar] [CrossRef]
  15. Huang, L.-S.; Liu, Z.; Chen, H.-Y.; Chen, X.-X. Two mitochondrial genomes of genus Megacampsomeris Betrem, 1928 (Hymenoptera: Scoliidae) with their phylogenetic implications. J. Asia-Pac. Entomol. 2023, 26, 102067. [Google Scholar] [CrossRef]
  16. Jasso-Martínez, J.M.; Quicke, D.L.J.; Belokobylskij, S.A.; Santos, B.F.; Fernández-Triana, J.L.; Kula, R.R.; Zaldívar-Riverón, A. Mitochondrial phylogenomics and mitogenome organization in the parasitoid wasp family Braconidae (Hymenoptera: Ichneumonoidea). BMC Ecol. Evol. 2022, 22, 46. [Google Scholar] [CrossRef]
  17. Mikó, I.; Masner, L.; Johannes, E.; Yoder, M.J.; Deans, A.R. Male terminalia of Ceraphronoidea: Morphological diversity in an otherwise monotonous taxon. Insect Syst. Evol. 2013, 44, 261–347. [Google Scholar] [CrossRef]
  18. Vasilita, C.; Moser, M.; Krogmann, L. Mission possible: An optimised protocol for the unbarcodable Ceraphronoidea (Hymenoptera). Biodivers. Data J. 2022, 10, e84860. [Google Scholar] [CrossRef]
  19. Fergusson, N.D.M. A revision of the British species of Dendrocerus Ratzeburg (Hymenoptera: Ceraphronoidea) with a review of their biology as aphid hyperparasites. Bull. Br. Mus. (Natural Hist.) 1980, 41, 255–314. [Google Scholar] [CrossRef]
  20. Miko, I.; Deans, A. Masner, a new genus of Ceraphronidae (Hymenoptera, Ceraphronoidea) described using controlled vocabularies. ZooKeys 2009, 20, 127–153. [Google Scholar] [CrossRef]
  21. Wang, X.; Chen, H.; Mikó, I.; Huang, Y.; Zhu, C. Notes on the genus Dendrocerus Ratzeburg (Hymenoptera, Megaspilidae) from China, with description of two new species. J. Hymenopt. Res. 2021, 86, 123–143. [Google Scholar] [CrossRef]
  22. Shahjahan, R.M.; Hughes, K.J.; Leopold, R.A.; DeVault, J.D. Lower incubation temperature increases yield of insect genomic DNA isolated by the CTAB method. Biotechniques 1995, 19, 332–334. [Google Scholar]
  23. Andrews, S. FastQC: A Quality Control Tool for High throughput Sequence Data. 2010. Available online: http://www.bioinformatics.babraham.ac.uk/projects/fastqc (accessed on 10 February 2020).
  24. Huang, Y.-X.; Ren, F.-J.; Bartlett, C.R.; Wei, Y.-S.; Qin, D.-Z. Contribution to the mitogenome diversity in Delphacinae: Phylogenetic and ecological implications. Genomics 2020, 112, 1363–1370. [Google Scholar] [CrossRef]
  25. Schubert, M.; Lindgreen, S.; Orlando, L. AdapterRemoval v2: Rapid adapter trimming, identification, and read merging. BMC Res. Notes 2016, 9, 88. [Google Scholar] [CrossRef]
  26. Coil, D.; Jospin, G.; Darling, A.E. A5-miseq: An updated pipeline to assemble microbial genomes from Illumina MiSeq data. Bioinformatics 2015, 31, 587–589. [Google Scholar] [CrossRef]
  27. Bernt, M.; Donath, A.; Jühling, F.; Externbrink, F.; Florentz, C.; Fritzsch, G.; Pütz, J.; Middendorf, M.; Stadler, P.F. MITOS: Improved de novo metazoan mitochondrial genome annotation. Mol. Phylogenetics Evol. 2013, 69, 313–319. [Google Scholar] [CrossRef]
  28. Lohse, M.; Drechsel, O.; Kahlau, S.; Bock, R. OrganellarGenomeDRAW—A suite of tools for generating physical maps of plastid and mitochondrial genomes and visualizing expression data sets. Nucleic Acids Res. 2013, 41, W575–W581. [Google Scholar] [CrossRef]
  29. Kumar, S.; Stecher, G.; Li, M.; Knyaz, C.; Tamura, K. MEGA X: Molecular Evolutionary Genetics Analysis across Computing Platforms. Mol. Biol. Evol. 2018, 35, 1547–1549. [Google Scholar] [CrossRef]
  30. Zhang, D.; Gao, F.; Jakovlic, I.; Zou, H.; Zhang, J.; Li, W.X.; Wang, G.T. PhyloSuite: An integrated and scalable desktop platform for streamlined molecular sequence data management and evolutionary phylogenetics studies. Mol. Ecol. Resour. 2020, 20, 348–355. [Google Scholar] [CrossRef]
  31. Librado, P.; Rozas, J. DnaSP v5: A software for comprehensive analysis of DNA polymorphism data. Bioinformatics 2009, 25, 1451–1452. [Google Scholar] [CrossRef]
  32. Ma, C.; Yang, P.; Jiang, F.; Chapuis, M.-P.; Shali, Y.; Sword, G.A.; Kang, L. Mitochondrial genomes reveal the global phylogeography and dispersal routes of the migratory locust. Mol. Ecol. 2012, 21, 4344–4358. [Google Scholar] [CrossRef]
  33. Perna, N.T.; Kocher, T.D. Patterns of nucleotide composition at fourfold degenerate sites of animal mitochondrial genomes. J. Mol. Evol. 1995, 41, 353–358. [Google Scholar] [CrossRef]
  34. Katoh, K.; Standley, D.M. A simple method to control over-alignment in the MAFFT multiple sequence alignment program. Bioinformatics 2016, 32, 1933–1942. [Google Scholar] [CrossRef]
  35. Trifinopoulos, J.; Nguyen, L.-T.; von Haeseler, A.; Minh, B.Q. W-IQ-TREE: A fast online phylogenetic tool for maximum likelihood analysis. Nucleic Acids Res. 2016, 44, W232–W235. [Google Scholar] [CrossRef]
  36. Minh, B.Q.; Nguyen, M.A.T.; Von Haeseler, A. Ultrafast approximation for phylogenetic bootstrap. Mol. Biol. Evol. 2013, 30, 1188–1195. [Google Scholar] [CrossRef]
  37. Guindon, S.; Dufayard, J.-F.; Lefort, V.; Anisimova, M.; Hordijk, W.; Gascuel, O. New algorithms and methods to estimate maximum-likelihood phylogenies: Assessing the performance of PhyML 3.0. Syst. Biol. 2010, 59, 307–321. [Google Scholar] [CrossRef]
  38. Ojala, D.; Montoya, J.; Attardi, G. tRNA punctuation model of RNA processing in human mitochondria. Nature 1981, 290, 470–474. [Google Scholar] [CrossRef]
  39. Foster, P.G.; Jermiin, L.S.; Hickey, D.A. Nucleotide composition bias affects amino acid content in proteins coded by animal mitochondria. J. Mol. Evol. 1997, 44, 282–288. [Google Scholar] [CrossRef]
  40. Bernt, M.; Merkle, D.; Ramsch, K.; Fritzsch, G.; Perseke, M.; Bernhard, D.; Schlegel, M.; Stadler, P.F.; Middendorf, M. CREx: Inferring genomic rearrangements based on common intervals. Bioinformatics 2007, 23, 2957–2958. [Google Scholar] [CrossRef]
  41. Galtier, N.; Roux, C.; Rousselle, M.; Romiguier, J.; Figuet, E.; Glémin, S.; Bierne, N.; Duret, L. Codon Usage Bias in Animals: Disentangling the Effects of Natural Selection, Effective Population Size, and GC-Biased Gene Conversion. Mol. Biol. Evol. 2018, 35, 1092–1103. [Google Scholar] [CrossRef]
  42. Mao, M.; Austin, A.D.; Johnson, N.F.; Dowton, M. Coexistence of minicircular and a highly rearranged mtDNA molecule suggests that recombination shapes mitochondrial genome organization. Mol. Biol. Evol. 2014, 31, 636–644. [Google Scholar] [CrossRef]
Figure 1. Circular maps of the mitochondrial genome: (a) Dendrocerus bellus and (b) Dendrocerus anisodontus. Protein-coding and ribosomal genes are indicated using standard abbreviations. The J-strand is shown on the outer circle and the N-strand on the inner circle.
Animals 14 01454 g001
Figure 2. Relative synonymous codon usage (RSCU) of the mitochondrial genomes of (a) Dendrocerus bellus and (b) Dendrocerus anisodontus.
Animals 14 01454 g002
Figure 3. Putative secondary structures of tRNAs from the Dendrocerus bellus mitogenome. Purple dots indicate base mismatches.
Animals 14 01454 g003
Figure 4. Putative secondary structures of tRNAs from the Dendrocerus anisodontus mitogenome. Purple dots indicate base mismatches.
Animals 14 01454 g004
Figure 5. Evolutionary rates of mitochondrial genomes. The numbers of non-synonymous substitutions per non-synonymous site (Ka), the number of substitutions per synonymous site (Ks), and the ratio of Ka/Ks for every mitochondrial gene are given, using Ceraphron sp. as the reference sequence. (a) Dendrocerus bellus and (b) Dendrocerus anisodontus.
Animals 14 01454 g005
Figure 6. Mitochondrial gene order rearrangement scenario inferred by CREx for the given phylogeny of Megaspilidae. Green color indicates: reversal. Red color indicates: move to right by a transposition or by a TDRL. Bule color indicates: move to left by a transposition or by a TDRL. From step one to step four there are two programs 1-4 and 1’-4’; from step five to step nine there are two programs 5-9 and 5’-9’.
Animals 14 01454 g006
Figure 7. ML phylogenetic trees of Apocrita based on PCG12 matrix.
Animals 14 01454 g007
Figure 8. The heat map of pairwise breakpoint distance of Apocrita.
Animals 14 01454 g008
Table 1. Nucleotide composition and skewness of mitogenomes.
RegionsSpeciesSize (bp)T%C%A%G%AT (%)GC (%)AT SkewGC Skew
Full genomeDendrocerus bellus15,44540.712.240.56.781.218.8−0.0025−0.2910
Dendrocerus anisodontus15,37340.211.742.25.982.417.60.0243−0.3295
PCGsDendrocerus bellus11,17339.513.339.77.679.220.80.0025−0.2727
Dendrocerus anisodontus11,21439.512.641.46.680.919.10.0235−0.3125
tRNAsDendrocerus bellus134943.59.341.65.685.114.9−0.0223−0.2483
Dendrocerus anisodontus141543.19.242.35.485.414.6−0.0094−0.2603
rRNAsDendrocerus bellus212143.89.143.13.986.913.1−0.0081−0.4000
Dendrocerus anisodontus216941.79.445.13.886.813.20.0392−0.4242
Table 2. Mitogenomic organization of D. bellus and D. anisodontus.
PositionSize (bp)Intergenic NucleotideCodonStrand
FromToStartStop
Dendrocerus bellus/Dendrocerus anisodontus
trnG−/173−/237−/65 /+
trnM264/253328/32065/68−/15 +/+
trnI326/318389/38264/65−3/−3 +/+
COX2410/4021114/1103705/70220/19ATT/ATTTAA/TAA+/+
trnK1116/11321184/120069/691/28 +/+
trnD1290/12001353/126564/66105/−1 +/+
ATP81407/12661568/1424162/15953/−ATC/ATATAA/TAA+/+
ATP61565/14252242/2096678/672−4/−ATA/ATGTAA/TAA+/+
COX32246/21003043/2897798/7983/3ATG/ATGTAA/TAA+/+
trnS13047/29073101/296355/573/9 +/+
trnN3102/29643168/303367/70−/− +/+
trnC3166/30313225/309560/65−3/−3 −/−
trnV3223/31083287/317165/64−3/11 −/−
trnQ3292/31733359/323968/674/1 −/−
trnY3365/32563426/331762/625/16 −/−
trnW3436/33303594/339569/669/12 −/−
COX13505/33965052/49381548/1543−/−ATG/ATGTAA/T+/+
trnL25055/49395119/500265/642/− +/+
NAD35147/50325509/5394363/36327/29ATT/ATTTAA/TAA+/+
trnA5517/53985582/546066/637/3 +/+
trnR5582/54635633/551852/56−1/2 +/+
trnE5655/55225719/558465/6321/3 +/+
trnF5719/56195781/568163/63−1/34 −/−
NAD55782/56827453/73501672/1669−/−ATT/ATTT/T−/−
trnH7455/73517518/741164/611/− −/−
NAD47531/74128868/87491338/133812/−ATG/ATGTAA/TAG−/−
NAD4L8862/87439143/9024282/282−7/−7ATG/ATATAA/TAA−/−
trnT9152/90299217/909166/638/4 +/+
trnP9244/90939307/915664/6426/1 −/−
NAD69317/91579844/9706528/5509/−ATC/ATATAA/T+/+
CYTB9860/970710,978/10,8401119/113415/−ATG/ATGTAG/TAA+/+
trnS210,986/10,84711,053/10,91468/687/6 +/+
NAD111,059/10,91312,015/11,872957/9605/−2ATA/ATATAG/TAA−/−
trnL112,016/11,87312,083/11,93868/66−/− −/−
rrnL12,084/11,93913,419/13,3221336/1384−/− −/−
NAD213,420/13,32314,442/14,3661023/1044−/−ATT/ATATAA/TAA+/+
rrnS14,443/14,36715,227/15,151785/785−/− −/+
Table 3. Detailed information of sequenced samples and accession numbers.
Sequencing Sample NumberSpeciesSexLocationGenBank Accession Number
A001D. sp.1femaleChongqing, Yintiaoling National Nature ReserveOR578603
A002D. sp.1femaleChongqing, Yintiaoling National Nature ReserveOR578604
A003D. sp.1maleChongqing, Yintiaoling National Nature ReserveOR578605
A004D. sp.1femaleChongqing, Yintiaoling National Nature ReserveOR578606
A005D. sp.1femaleChongqing, Yintiaoling National Nature ReserveOR578607
A006D. sp.1maleChongqing, Yintiaoling National Nature ReserveOR578608
A007D. sp.2maleChongqing, Yintiaoling National Nature ReserveOR578609
A008D. sp.3femaleChongqing, Yintiaoling National Nature ReserveOR578610
A009D. sp.4maleChongqing, Yintiaoling National Nature ReserveOR578611
Table 4. Genetic distance of COX1 of Dendrocerus species.
A001A002A003A004A005A006A007A008A009
A001
A0020.0000
A0030.00150.0015
A0040.01240.01240.0139
A0050.00000.00000.00150.0124
A0060.00000.00000.00150.01240.0000
A0070.17310.17310.17120.18490.17310.1731
A0080.15290.15290.15480.15460.15290.15290.1937
A0090.17520.17520.17720.18110.17520.17520.17150.2037
Disclaimer/Publisher’s Note: The statements, opinions and data contained in all publications are solely those of the individual author(s) and contributor(s) and not of MDPI and/or the editor(s). MDPI and/or the editor(s) disclaim responsibility for any injury to people or property resulting from any ideas, methods, instructions or products referred to in the content.

