
Pressure-Induced Modulation of Tin Selenide Properties: A Review
by
 , ,
, ,
Ziwei Cheng
1,
Jian Zhang
1,*,
Lin Lin
2,3,
Zhiwen Zhan
1,
Yibo Ma
1,
Jia Li
1,
Shenglong Yu
1 and
Hang Cui
4 1
College of Sciences, Beihua University, Jilin 132013, China
2
School of Agricultural Engineering and Food Science, Shandong University of Technology, Zibo 255000, China
3
Key Laboratory of Wooden Materials Science and Engineering of Jilin Province, Beihua University, Jilin 132013, China
4
State Key Laboratory of Superhard Materials, College of Physics, Jilin University, Changchun 130012, China
*
Author to whom correspondence should be addressed.
Molecules 2023, 28(24), 7971; https://doi.org/10.3390/molecules28247971
Submission received: 27 October 2023
/
Revised: 22 November 2023
/
Accepted: 30 November 2023
/
Published: 6 December 2023
(This article belongs to the Special Issue Structure, Spectroscopic Characterization and Application of Crystals)
Abstract
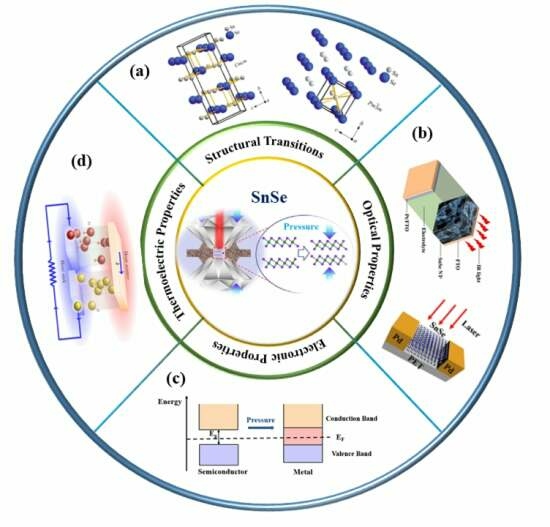
:Tin selenide (SnSe) holds great potential for abundant future applications, due to its exceptional properties and distinctive layered structure, which can be modified using a variety of techniques. One of the many tuning techniques is pressure manipulating using the diamond anvil cell (DAC), which is a very efficient in situ and reversible approach for modulating the structure and physical properties of SnSe. We briefly summarize the advantages and challenges of experimental study using DAC in this review, then introduce the recent progress and achievements of the pressure-induced structure and performance of SnSe, especially including the influence of pressure on its crystal structure and optical, electronic, and thermoelectric properties. The overall goal of the review is to better understand the mechanics underlying pressure-induced phase transitions and to offer suggestions for properly designing a structural pattern to achieve or enhanced novel properties.
1. Introduction
Tin selenide (SnSe) has attracted considerable attention owing to its layered structure, narrow bandgap, anisotropy, and other advantages such as chemical stability, low toxicity, and natural abundance [1,2,3,4,5,6,7,8]. The orthorhombic structure of SnSe exhibits beneficial properties for two-dimensional (2D) growth and possesses a direct gap of 1.3 eV and an indirect gap of 0.9 eV [9,10]. Moreover, SnSe also exhibits considerable potential in the fields of thermoelectricity, holographic recording, photocatalysis, memory switching, infrared electronics, and energy storage [9,10,11,12,13,14,15,16]. The interlayer degree of freedom can be manipulated to effectively control its properties and the interlayer interaction exhibits a significant correlation with external factors, including pressure, temperature, strain, and electromagnetic field. These disruptions offer a variety of methods for altering SnSe properties [17,18,19,20,21,22,23,24,25].
It is well known that the physical and chemical properties of materials are extraordinarily dependent on its crystal structure [26]. The applications of the high-temperature-phase β-SnSe are limited due to its phase transition temperature of up to 800 K, despite its thermoelectric performance resulting from its highly symmetric structure [27,28,29,30,31]. Pressure plays a distinctive and advantageous role due to its ability to alter the interlayer interaction, resulting in the exploration and production of novel materials and properties, while maintaining constant stoichiometry and temperature. However, the effect of pressure on the preparation and performance of SnSe is frequently underestimated or even overlooked.
This review aims to provide a comprehensive overview of the recent progress and achievements of pressure-induced structure and properties in SnSe. Section 2 provides a comprehensive explanation of high-pressure techniques, focusing on diamond anvil cells (DACs), and an exploration of diverse characterization tools that can be integrated with DACs to effectively monitor the in situ changes in the structure and properties of materials under high-pressure conditions. Section 3 analyzes the influence of pressure on the crystal structure of both bulk and nanoscaled SnSe and explains the distinctions and similarities in the phase transition behavior exhibited by these materials. Section 4 presents the effect of pressure on the performance of SnSe, including its optical, electronic, and thermoelectric properties. The overview and perspective are concluded in Section 5. This review attempts to improve understanding of the pressure-induced structural transition of SnSe and provide valuable insights for future investigations on the development of structurally planned patterns.
2. High-Pressure Techniques
The synthesis of materials is primarily governed by the concepts of kinetics and thermodynamics during the chemical synthesis process. Conversely, under high-pressure conditions, an intriguing opportunity arises to manipulate the phase or structure of materials. Pressure is an essential thermodynamic parameter that can be used to control the properties of materials. By decreasing interatomic distances and altering electronic orbitals and bonding structures, pressure serves as a versatile mechanism for generating unique materials that are typically impossible to generate at ambient conditions [32,33,34,35]. This arises due to the free-energy alteration within the material system, attributed to the PV (P is the pressure, V is the volume) term in the Gibbs free energy (G). Currently, high-pressure conditions or environments can be realized through several methods, including the high-pressure piston-cylinder [36,37,38,39], cubic anvil cell [40,41,42], and diamond anvil cell (DAC) [43,44,45]. Among these techniques, the DAC technology stands out as a potent and versatile tool for generating ultra-high pressure and facilitating the measurement of small samples.
2.1. DAC Technology
With well-configured installation, DAC demonstrates the remarkable capability to generate pressures as high as 550 GPa. It surpasses the pressure at the core of the Earth, indicating that DAC has the potential to replicate the majority of pressure-induced processes occurring on Earth. This exceptional tool has gained global popularity due to its compact size, ease of operation, and safety. As shown in Figure 1, DAC consists of a pair of diamond anvils along with external mechanical components [46]. The diamond possesses a unique combination of mechanical, thermal, electrical, optical, chemical, and other qualities, making it an outstanding choice for an anvil.
A sealing gasket is positioned between the two anvil faces. The gasket features a cylindrical hole at its center, serving as a dedicated sample chamber. The sealing gasket has two functions: it alters the stress distribution and seals the sample. Gasket materials include T301 steel, rhenium, titanium, and copper. To ensure a uniform compression of the sample within the DAC, pressure mediums are essential for transmitting pressure and maintaining a hydrostatic pressure field. Pressure transmitting mediums generally follow specific requirements, including no chemical reactivity with the sample, efficient pressure transmission, and good temperature stability. Table 1 provides a comprehensive overview of various pressure-transmitting materials, highlighting the unique characteristics related to each group. Monitoring and calibrating the applied pressure is a crucial step in high-pressure experiments. Ruby is widely regarded as the ideal choice due to it exhibiting strong fluorescence when subjected to laser excitation, and its luminescence spectrum exhibits a distinct peak that consistently varies in response to applied pressure.
2.2. In Situ High-Pressure Measurement
In situ high-pressure X-ray diffraction (XRD) is a valuable technique for investigating material structures under extreme pressure conditions, providing compelling evidence of phase transitions [52,53]. Compared to the XRD analysis at ambient conditions, in situ XRD presents many challenges, including the limited size of the sample chamber, the absorption of X-rays by the diamond anvils, and the constrained numerical aperture of the DAC. These problems have been effectively improved with the development of synchrotron radiation technology. Meanwhile, researchers have developed devices with specific geometries to overcome the numerical aperture limitations, although these mechanical changes reduce the maximum pressure which can be achieved.
Raman spectroscopy is particularly sensitive to various factors, including the polarization and orientation of the incident light, the crystal symmetry and orientation of the solid sample, and the direction and polarization of the scattered light. Under high-pressure conditions, the in situ Raman spectroscopy technique can provide valuable insights into the strength of chemical bonds, the coefficient of thermal expansion and compression, and the chemical processes or phase transitions. In particular, this method excels in monitoring the interlayer sliding phenomena due to its ability to effectively measure the impact of pressure on the covalent bonds within the material (high-frequency Raman vibrations) and the spacing between layers (low-frequency Raman vibrations). However, it is worth noting that Raman scattering often exhibits relatively low intensity. To enhance the signal-to-noise ratio, various strategies can be used, including extending the integration time, conducting multiple scans, refining the oscillator, and implementing additional signal filtering.
3. Pressure-Induced SnSe Structural Transitions
During the application of pressure to substances with constant composition and temperature, a variety of materials exhibit structural transition. Structural transitions, associated with phase transitions, cell volumes, lattice parameters, and orientations, can be induced by fundamental thermodynamic variables [54,55]. Two stable structures of SnSe have been reported: α-SnSe (T < 800 K) and β-SnSe (T > 800 K). The α-SnSe belongs to the orthorhombic structure with Pnma space group and the β-SnSe belongs to the orthorhombic structure with the Cmcm space group [56]. As shown in Figure 2, it is evident that α-SnSe possesses a double-layered structure, which can be regarded as a three-dimensional (3D) distortion of the NaCl structure [57]. β-SnSe is similar to α-SnSe but with a higher symmetry. Meanwhile, in light of prior researches, the high-pressure behavior of SnSe bulk materials is very different from that of nanomaterials.
3.1. Phase Transition of Bulk SnSe
Chattopadhyay et al. conducted a preliminary investigation via energy dispersive X-ray diffraction techniques to examine the behavior of SnSe, which revealed that the layered crystal structure exhibited stability up to a pressure of 34 GPa [59]. Peters and McNeil et al. observed structural modifications in SnSe under pressures ranging from 1.4 to 3 GPa using Mossbauer measurements [57]. These changes were attributed to the interlayer interactions, prompting the transition from a pseudo 2D structure to a 3D structure. Importantly, the structural characteristics of the Pnma space group were maintained during this transformation. In contrast, Alptekin et al. theoretically determined that a transition from the orthorhombic Pnma phase to the Cmcm phase occurs at 7 GPa [60]. Loa et al. utilized angle-dispersive synchrotron X-ray powder diffraction (ADXRD) to investigate the behavior of SnSe under pressure up to 10.5 GPa. They observed SnSe undergo a second-order phase transition from the orthorhombic Pnma structure to Bbmm, which is similar to Cmcm. This study represents the first instance of experimental evidence that supports the presence of a structural phase transition in bulk SnSe [61]. Pal et al. also observed the structural phase transition in bulk SnSe through Raman scattering. As shown in Figure 3, two new modes (M8, M9) at 81.2 and 144.6 cm−1 emerged in the Raman spectra at 6.2 GPa and persisted up to 21 GPa, which is associated with the phase transition [62].
In a larger pressure range (around 27 GPa), Chen and Lu et al. observed a new phase transition from the orthorhombic structure to the cubic structure in bulk SnSe [63]. Figure 4 provides evidence that the structural transitions occurring at low pressure and high pressure are classified as second-order and first-order, respectively. The second-order phase transition is caused by the displacive movement of Sn/Se atoms in the [010] direction, and the first-order phase transition was initiated by the bonding of Sn to Se from nearby bilayers. As shown in Figure 4d,e, theoretical calculations are in good agreement with experimental results. Subsequent findings by other researchers have further confirmed the existence of SnSe cubic structure at higher pressure [64,65,66].
3.2. Phase Transition of SnSe Nanomaterials
Nanomaterials possess distinct characteristics that largely depend on their crystal phase, surface area, morphology and architecture [30,67,68,69]. In contrast to bulk materials, nanomaterials exhibit size- and shape-dependent high-pressure phase transition behavior, including anomalous pressure responses and novel physical-chemical properties.
Zhang et al. synthesized SnSe single-crystalline nanosheets with an average thickness of 25 nm and a lateral dimension of 500 nm using the plasma assisted direct current arc discharge method [70]. As shown in Figure 5a,b, the second-order isostructural continuous phase transition from Pnma to Cmcm was observed at 6.8 GPa, which is much lower than the transition pressure of bulk SnSe [61]. The decreased transition pressure can be attributed to the volumetric expansion, with the softening of the Poisson ratio and shear modulus. This abnormal compressibility arises from the unique intrinsic geometry in the nanosheets. Meanwhile, all diffraction peaks and vibrational modes returned to the original structure when the pressure was released to the ambient pressure, indicating the pressure-induced structural transformation is reversible. Studies have found pressure-induced polymorphism in nanostructured SnSe produced by mechanical ball-milling [71,72]. Marques et al. performed mechanical ball-milling on nanostructured SnS1-xSex (x = 0.5), providing further insights into the role of disorder in the pressure-induced transformation of the Pnma structure [73]. A nanostructured SnSe0.5S0.5 was obtained through mechanical milling of high-purity Sn (99.995%), Se (99.999%) and S (99.999%) powders. The powders were sealed together with several steel balls into a cylindrical steel vial under argon atmosphere. The ball-to-powder ratio was 5:1; a SPEX type mill was used to perform mechanical alloying at room temperature. As shown in Figure 5c,d, SnS1-xSex (x = 0.5) exhibits consistent enhancement in symmetry with the Bbmm structure. The observed dynamics of the transition suggest an isotropic change in the lattice parameters when the critical pressure falls within the range of 10 to 14 GPa. Their theory suggests that this observed variation may be attributed to the degree of stacking defects, as layered structures prove to be highly sensitive to shear deformations.
In order to analyze the transformation process that applies to the high-pressure behavior of SnSe, the changes in cell volume and bulk modulus are listed in Table 2. It is worth noting that SnSe nanomaterials display a lower transition pressure compared to their bulk counterparts [74,75,76,77]. The reduction in transition pressure can be attributed to the volumetric expansion with the softening of the Poisson ratio and shear modulus. Meanwhile, the bulk modulus of SnSe nanomaterials under ambient pressure coincides with that of bulk SnSe. However, the bulk modulus of SnSe nanomaterials under high pressure is much higher than that of bulk SnSe. The enhanced bulk modulus can be attributed to the higher surface energy due to the pressure-induced morphology change [78,79,80].
4. Properties of SnSe under High Pressure
Pressure, along with temperature, is considered one of the fundamental thermodynamic variables. It serves as a powerful tool for manipulating the structures of material systems, combining the in situ techniques, and making it possible to establish the correlations between structure and properties [81,82]. Pressure is a clean tool for structure tuning compared with other methods. For instance, the distance between particles can be adjusted by high pressure [83,84,85]. In this section, the pressure-dependent optical, electronic, and thermoelectric properties of SnSe are reviewed.
4.1. Optical Properties of SnSe under High Pressure
The investigation of optical characteristics is crucial to understand the internal composition of materials and assessing their potential for practical application as optoelectronic devices. It is crucial for investigating the connections between structural transition and material properties, enhancing material properties, and potentially facilitating applications under ambient pressure conditions. The study on the optical constants and properties under pressure serves as a framework for investigating the optoelectronic characteristics of SnSe.
4.1.1. Optical Constants
Cubic phases of SnSe (π-SnSe) were first discovered in 2015–2016 [86,87,88]. Rehman et al. performed a detailed analysis of the structural and optical properties of cubic phase π-SnSe under pressure [89]. As shown in Figure 6a,b, the dielectric constant exhibits an increasing trend with the pressure at the range of 0–40 GPa. It is clear from Table 3 that optical absorption, the dielectric constant, optical conductivity and static refractive indices follow an increasing trend as the external pressure increases from 0 to 40 GPa, and combined with the tendency of reflection and loss function as pressure increases, it can be concluded that external pressure might be the key reason to enhance the near/mid infrared light activity. Xie et al. reported that the increased pressure leads to a shift of the absorbance edge towards lower photon energy, which suggests a reduction in bandgap width [90]. Luo et al. further investigated the optical properties of SnSe under high pressure up to 10 GPa [66]. As shown in Figure 6c,d, the absorption edge shifts towards longer wavelengths as pressure increases and exhibits blue shift with decompression, indicating the pressure-induced modulation of the optical bandgap is reversible. Moreover, Biesner et al. discussed the optical spectra of doped SnSe under pressure [91]. Both lightly and heavily doped SnSe exhibit a narrowing in bandgap and an increase in low-frequency optical conductivity. It is interesting that the bandgap is not fully closed, even under the highest pressure. It is suggested that the phase transition is primarily attributed to the band shift across the Fermi level, rather than the collapse of the optical gap.
4.1.2. In-Plane Anisotropy
Anisotropy refers to the phenomenon in which a substance exhibits directional dependence, resulting in variations in its chemical and physical properties along different axes. Understanding material anisotropy is valuable for optimizing device performance. The utilization of anisotropic features is important in the advancement of innovative technologies, including multi-channel sensors, anisotropic logic manipulation devices, and polarimetric photodetectors. The optical, vibrational, thermal, and electronic properties of layered SnSe are characterized by significant in-plane anisotropy along the orthorhombic directions, resulting from variations in bond lengths and angles [92,93,94,95,96].
Shi et al. observed a significant difference in the light absorption spectra between monolayer and few-layer SnSe, which is due to the in-plane anisotropy [93]. Zhang et al. investigated the anisotropic nonlinear optical properties of SnSe nanosheets [92]. The polarization of incident light at 800 nm had a significant impact on the linear absorption rate. As shown in Figure 7a,b, SnSe displayed anisotropy in its polarization-dependent saturable absorption and transient absorption. The analysis of transient absorption anisotropy indicates that the highest level of injected carrier density was observed when the pump polarization was aligned with the armchair direction, which can be attributed to the maximum absorption rate observed at this specific polarization. Xie et al. reported that the application of pressure leads to varying effects on optical absorption at different orientations or directions [90]. As shown in Figure 7c,d, in comparison to the b-axis, the absorbance peaks in the c-axis undergo a downward shift towards lower energy regions as pressure increases. The c-axis curve is similar to b-axis when the pressures up to 12 GPa, indicating that the anisotropy of the structure gradually decreases. In addition, the variation in the intensity of Ag(1) and B3g modes under pressure also demonstrated a similar tendency, which is clearly depicted by the rotation of the polarized plot. This change corresponded with alterations in the infrared absorption, indicating that the anisotropic optical properties of SnSe decrease with increasing pressure and disappear at 12 GPa. It also supports that SnSe undergoes a structural transition from low-symmetry Pnma phase to high-symmetry Bbmm structure at 12 GPa. The elucidation of anisotropic optical characteristics in SnSe offers valuable insights into its phase transition behavior, holding potential in the development of novel optical components, transistors, and photodetectors.
4.2. Electronic Properties of SnSe under High Pressure
High pressure has proven to be a powerful tool in the modulation of electronic properties, leading to alterations in the electronic structure and electrical transport characteristics of materials. The influence of pressure on the electronic properties of SnSe was discussed in terms of electronic structure and electrical transport.
4.2.1. Electronic Structure
In the 1990s, optical absorption measurements revealed that the optical bandgap for α-SnSe was 0.923 eV [97]. As computational science rapidly advances, theoretical simulations have reported the values for the bandgap of both α-SnSe and β-SnSe: the bandgap of β-SnSe is only half that of α-SnSe [98,99,100,101,102,103,104,105,106,107]. In addition to studying the electronic structures of SnSe under ambient conditions, the electronic properties of SnSe under high pressure have been investigated. Zhang et al. used the CASTEP software package for geometric optimization and band structure calculations on SnSe within a pressure range of 0–11 GPa. Their study offers a comprehensive analysis of the pressure-induced variations in the band structure of SnSe [108]. As shown in Figure 8, the increased pressure leads the extension and movement of valence band maximum (VBM) and conduction band minimum (CBM) closer to the Fermi level, resulting the bandgap in decreasing and even in close. With the increasing pressure, the electronic states near the Fermi surface approach the Fermi level and the values of the total Density of States (DOS) gradually decreased, corresponding to the changes in the band structure features. In addition, a transition of SnSe from the semiconductor to semimetallic state occurred at 10 GPa. It can be attributed to the increased hybridization of Sn-5s, Sn-5p, and Se-4p orbitals under pressure [109]. Yang et al. investigated the influence of pressure on the electronic properties of SnSe crystals combined the CALYPSO with first-principle calculations [110,111]. Above 22 GPa, new stable structures identified as Pmm-, C2/m-, and Cmmm-SnSe were found. As shown in Figure 9, the energy band structures and DOS revealed that only the Pnma-SnSe phase was a semiconductor with a bandgap of 0.79 eV. In contrast, the other phases exhibited metallic properties.
4.2.2. Electrical Transport
Electrical transport properties represent the macroscopic behaviors resulting from the intricate interactions of free electrons within materials. These interactions cause variations in the band and electronic structures, and then influence the Seebeck coefficient and electrical conductivity. Recent research has indicated that pressure presents a unique approach for optimizing the behavior of electrical transport properties in various thermoelectric materials [112,113,114].
Agarwal et al. observed an abrupt decrease in the electrical resistivity of SnSe monocrystals in the pressure range of 6 to 7 GPa [115]. As shown in Figure 10a,b, the decreased electrical resistivity is attributed to the change from a semiconductor to semimetal, which is primarily driven by a pressure-induced structural transition [116]. Yan et al. performed in situ high-pressure Hall effect measurements. As shown in Figure 10c–f, SnSe transfers into a semimetallic state at around 12 GPa. It is accompanied by the phase transition from orthorhombic to monoclinic, resulting in the alterations of carrier concentration and mobility [116].
Chen et al. and Marini et al. subsequently confirmed the presence of a superconducting (SC) phase [63,117]. Although most reports agree that the SC phase is the CsCl-type structure, some inconsistency regarding the pressure range at which superconductivity emerges and the transition temperature Tc(P). Timofeev et al. reported the SC phase of SnSe with a transition temperature Tc(P) of 4.5 K at 58 GPa [118]. In contrast, as shown in Figure 11a, Chen observed that the SC phase initiates at 27 GPa with Tc of 3 K, reaching its peak value of 3.2 K at a pressure of 39 GPa. Meanwhile, theoretical predictions revealed interesting topological features in the metallic CsCl-type phase. Marini et al. focused on the electronic features of the topological CsCl-type phase and analyzed its dynamical and SC properties. Their predictions indicated a decline in the SC transition temperature with the pressure increasing, which is in contrast with the experimental result (Figure 11b,c). It is attributed to the low value of Tc(P) and the differences between the onset and zero-resistance [63,119]. Furthermore, additional investigations into the impact of non-hydrostatic pressure conditions on the SC critical temperature revealed that structural deformation at 50 GPa influenced Tc(P) (Figure 11d). In addition, sulfur doping has proven effective in enhancing the SC properties of SnSe and extending the pressure range of SC over 70 GPa.
4.3. Thermoelectric Properties of SnSe under High Pressure
For decades, the primary strategies for enhancing the thermoelectric figure of merit (ZT) have been the adjustment of carrier concentration to improve the power factor and the reduction in thermal conductivity [120,121]. SnSe has demonstrated an exceptionally high ZT value of 2.6 ± 0.3 at 923 K [29]. However, ZT value remains low below 800 K, limiting practical efficiency. Significant progress has been achieved through the application of various external factors, such as pressure or stress, to enhance the ZT value in existing thermoelectric materials [122,123,124,125].
4.3.1. Anisotropic Thermoelectric Properties
In the early days, considerable attention was drawn to the remarkable thermoelectric properties of SnSe [58,126]. Zhao et al. reported remarkably elevated ZT values for single-crystalline SnSe at 923 K [29]. It was as high as 2.6 ± 0.3 along the b-axis, 2.3 ± 0.3 along the c-axis, and 0.8 ± 0.2 along the a-axis. Carrete et al. observed the lattice thermal conductivity (κl) with κlb > κlc > κla at all temperatures by theoretical calculation [127]. Ibrahim et al. reported that κl presents an expressive anisotropy among the three directions (κlc > κlb > κla) in undoped single-crystalline SnSe [128].
Zhang et al. predicted the ZT values of P-type SnSe along the b- and c-axis can reach 2.5 and 1.7 at 6 GPa and 700 K, respectively. However, the a-axis showed N-type SnSe with ZT value of 1.7 at 6 GPa and 600 K. The improvement in thermoelectric properties can be attributed to the alteration of electronic structures under pressure [129]. Gusãmo et al. investigated the impact of pressures (0–10 GPa) on the thermoelectric properties of Pnma-SnSe [130]. As shown in Figure 12a–e, the Seebeck coefficient exhibited a continuous decrease along the a-axis, which attributes this rapid decrease and signal modification to the increasing thermally excited negative electrons owing to the decrease in the energy band gap with P-type SnSe [131]. In Figure 12f–i, it is evident that the ZT decreases with increasing pressure, signifying that external pressure has a diminishing effect on the efficiency of the conversion of thermal energy to electrical energy. Yu et al. reported the anisotropy and thermoelectric parameters of the Pnma and Cmcm phases exhibit notable differences [132]. As shown in Figure 13, the overall effect of 4 GPa pressure on the power factor is small, but it does not significantly increase the lattice thermal conductivity, which is conducive to the enhancement of ZT value.
4.3.2. Doping-induced Enhancement of Thermoelectric Properties
Doping is a process that involves introducing small quantities of other elements or compounds into a material, in order to enhance their properties or to induce specific electrical, thermoelectric, and optical characteristics.
Qin et al. discovered that the thermoelectric performance of P-type SnSe single crystals can be significantly improved through Te alloying [133]. An exceptionally high ZT value of 2.1 at 793 K was reported. Zhang et al. successfully synthesized polycrystalline SnSe1-xTex (x = 0.02, 0.03, and 0.05) samples [108]. As shown in Figure 14a–c, the power factor initially increases with pressure, indicating a significant reduction in electrical resistivity. The maximum value of 1 × 10⁻⁴ Wm−1K−2 at 3 GPa surpasses other reported values at room temperature [134,135,136]. Su et al. evaluated the influence of pressure on the thermoelectric power factor of Na-doped SnSe crystals up to 2.2 GPa [137]. As shown in Figure 14d–f, the power factor of undoped SnSe and Na-doped SnSe enhancement appears in the low-pressure region. The Na-doped SnSe increases from 33.2 μW cm−1K−2 at 0.1 GPa to 43.9 μW cm−1K−2 at 1.925 GPa. The results confirmed that pressure can inherently enhance the thermoelectric properties of SnSe across a broad temperature range within the Pnma phase.
As shown in Figure 15a,b, Biesner et al. investigated the semiconductor-semimetal transition in lightly and heavily doped SnSe [91]. It is confirmed that self-doping has a considerable influence on SnSe by shifting the Fermi level, which is more pronounced under applied pressure. Lifshitz transition has been identified as a topological transition in condensed matter physics [138]. Previous investigations of SnSe also detected features at pressures corresponding to the Lifshitz transition [57,62,90,139,140,141]. Nishimura et al. have also reported a marked impact of the pressure-induced Lifshitz transition on thermoelectric performance for moderately hole-doped SnSe [142]. As shown in Figure 15c–e, the field-linear Hall resistivity remains almost unchanged up to 2.0 GPa, implying nearly constant carrier density with pressure. The magneto-resistivity markedly depends on pressure, the observed pressure variation in Shubnikov-de Haas (SdH) oscillations indicates a pressure-induced Lifshitz transition. Furthermore, a new Fermi pocket emerges at around 0.86 GPa, which further evolves in size with increasing pressure. The thermoelectric efficiency enhancement was explained by a multi-valley conductivity resulting from a Lifshitz transition above 1 GPa [91,142].
5. Conclusions and Perspectives
Pressure, as a crucial thermodynamic variable, has been employed to alter chemical and crystal structures, induce phase transitions, and thereby impact optical, electronic, and thermoelectric properties. Along with various in situ high-pressure techniques facilitated by DAC, this paper reviewed recent advancements in high-pressure studies of SnSe.
For SnSe bulk materials, two reversible structural transitions have been observed. The first is a second-order transition from Pnma-SnSe to Cmcm-SnSe, and the second is a first-order transition from Cmcm-SnSe to CsCl-SnSe. In SnSe nanomaterials, only the first structural transition has been observed, and it takes place at a lower pressure compared to bulk materials. The reduction in transition pressure may be attributed to the volumetric expansion, along with the softening of the Poisson ratio and shear modulus.
High pressure has the fundamental effect of reducing lattice parameters and interatomic distances, which leads to a smaller bandgap. Importantly, after decompression, the bandgap can return to its initial state, signifying that the pressure-induced modulation of the optical bandgap is reversible. Furthermore, pressure also influences the optical in-plane anisotropy of SnSe, which holds promise for the development of new anisotropic optical components, transistors, and photodetectors.
With increasing pressure, the resistivity will decrease significantly, which originates from a metalized phase transition from semiconductor to semi-metal, and the fundamental cause of the change is a structural transition induced by pressure. With further increasing pressure, CsCl-SnSe will appear to be a superconductivity phase, but there is disagreement over the pressure range at which superconductivity emerges and the transition temperature.
Pressure can significantly impact the anisotropy of the thermoelectric properties of SnSe. Enhancing the power factor through carrier concentration tuning and reducing thermal conductivity are key strategies to improve the ZT. Doping SnSe, due to its low electrical conductivity and the availability of multiple valence band extrema, can result in a higher power factor under high pressure compared to the undoped SnSe.
High pressure opens up avenues for exploring potentially high-performance thermoelectric materials and gaining a comprehensive understanding of the structure and properties of materials under extreme pressure conditions. While significant advancements have been made in this field, using DAC in studying SnSe samples still faces important challenges, and some scientific questions remain unexplored.
First, nanoscience has enabled the preparation of various well-controlled SnSe nanoscale morphologies, such as spherical/faceted nanoparticle, nanosheet, nanoflower, nanotube, and nanowire. Therefore, emerging research lines are expected to explore the influence of key morphological features of SnSe nanostructures, such as the geometry and size of nanocrystals and the facet at the interface between nanomaterials and the surrounding pressure transfer medium. This will involve phase transition behavior and how high pressure behavior affects material properties.
Second, the signal quality in in situ optical measurement using DAC needs to be further improved. Considering the geometry of the DAC and the resulting longer working distance and smaller numerical aperture, optical measurements using the DAC usually have lower signal intensity and signal-to-noise ratio than similar measurements without the DAC. This brings great challenges to some measurements, so the development and refinement of relevant technologies are important for further unleashing the capability of DAC.
Third, the utilization of DAC techniques allows for a more in-depth investigation into the pressure-induced formation of novel low-dimensional structures. Pressure is often used by researchers as a reversible tool to probe material properties; there are instances where the irreversibility of pressure effects can be harnessed to produce innovative structures. The in situ measurement capabilities provided by DAC offer a deeper insight into these processes, which can then be leveraged for designing new materials to create custom structures using pressure as a means to synthesize novel functional materials with unique properties.
Fourth, in addition to the above challenges, there is another problem that needs to be further solved, that is, the theoretical calculation data cannot accurately correspond to the experimental measurement data. This situation is mainly due to the fact that the ideal physical model is embedded in the software program, ignoring some real conditions in the experiments, which makes the high-pressure experiment process difficult to describe.
In summary, high-pressure applications in SnSe face new opportunities and great challenges. In order to clarify these issues, but not be limited to these issues, it would help to understand the physical mechanisms in the modulation of pressure on structure and performance, ultimately improving existing performance or creating higher-performance materials.
Author Contributions
Z.C. and J.Z. contributed equally to this work. Conceptualization, Z.C., J.Z. and L.L.; investigation, Z.C. and Z.Z.; writing-original draft preparation, Z.C. and Z.Z.; Writing-review and editing, J.Z., L.L., Y.M., J.L., S.Y. and H.C.; visualization, L.L., Y.M., J.L., S.Y. and H.C.; funding acquisition, J.Z. and Z.C. All authors have read and agreed to the published version of the manuscript.
Funding
This research was supported by Technology Innovation Project of Jilin Province Science and Technology Department (YDZJ202301ZYTS392, 20230203046SF, YDZJ202301ZYTS379 and YDZJ202301ZYTS267), National Natural Science Foundation of China (12104015, 32001260 and 32371804), Jilin Province Department of Education (JJKH20230057KJ, JJKH20230055KJ and JJKH20210032KJ), Special Construction Project Fund for Shandong Province Taishan Scholars, Youth Science and Technology Innovation Team of Beihua University (BHQNTD202206) and Graduate Innovation Program Project of Beihua University (2022004).
Institutional Review Board Statement
Not applicable.
Informed Consent Statement
Not applicable.
Data Availability Statement
Not applicable.
Conflicts of Interest
The authors declare no conflict of interest.
Correction Statement
This article has been republished with a minor correction to the Funding statement. This change does not affect the scientific content of the article.
References
- Wang, W.; Li, P.; Zheng, H.; Liu, Q.; Lv, F.; Wu, J.; Wang, H.; Guo, S. Ultrathin Layered SnSe Nanoplates for Low Voltage, High-Rate, and Long-Life Alkali–Ion Batteries. Small 2017, 13, 1702228. [Google Scholar] [CrossRef] [PubMed]
- Shi, H.; Guo, C.; Qin, B.; Wang, G.; Wang, D.; Zhao, L.-D. A promising thermoelectrics In4SnSe4 with a wide bandgap and cubic structure composited by layered SnSe and In4Se3. J. Mater. 2022, 8, 982–991. [Google Scholar] [CrossRef]
- Cheng, Y.; Yang, H.; Zhang, J.; Xiong, X.; Chen, C.; Zeng, J.; Xi, J.; Yuan, Y.-J.; Ji, Z. Novel 0D/2D ZnSe/SnSe heterojunction photocatalysts exhibiting enhanced photocatalytic and photoelectrochemical activities. J. Alloys Compd. 2022, 897, 163123. [Google Scholar] [CrossRef]
- Kumar, M.; Rani, S.; Kumar, A.; Tawale, J.; Srivastava, R.; Singh, B.P.; Pathak, S.; Wang, X.; Singh, V. Broadband (NIR-Vis-UV) photoresponse of annealed SnSe films and effective oxidation passivation using Si protective layer. Mater. Res. Bull. 2022, 153, 111913. [Google Scholar] [CrossRef]
- Pejjai, B.; Reddy, V.R.M.; Gedi, S.; Park, C. Status review on earth-abundant and environmentally green Sn-X (X = Se, S) nanoparticle synthesis by solution methods for photovoltaic applications. Int. J. Hydrogen Energy 2017, 42, 2790–2831. [Google Scholar] [CrossRef]
- Zhao, H.; Wang, C.; Liu, G.; Barba, D.; Vidal, F.; Han, G.; Rosei, F. Efficient and stable hydrogen evolution based on earth-abundant SnSe nanocrystals. Appl. Catal. B 2020, 264, 118526. [Google Scholar] [CrossRef]
- Li, X.-Z.; Xia, J.; Wang, L.; Gu, Y.-Y.; Cheng, H.-Q.; Meng, X.-M. Layered SnSe nano-plates with excellent in-plane anisotropic properties of Raman spectrum and photo-response. Nanoscale 2017, 9, 14558–14564. [Google Scholar] [CrossRef]
- Shao, G.; Xue, X.-X.; Yang, M.; Yang, J.; Liu, X.; Lu, H.; Jiang, Y.; Jin, Y.; Yuan, Q.; Sun, J. Modulated anisotropic growth of 2D SnSe based on the difference in a/b/c-axis edge atomic structures. Chem. Mater. 2021, 33, 4231–4239. [Google Scholar] [CrossRef]
- Shi, W.; Gao, M.; Wei, J.; Gao, J.; Fan, C.; Ashalley, E.; Li, H.; Wang, Z. Tin selenide (SnSe): Growth, properties, and applications. Adv. Sci. 2018, 5, 1700602. [Google Scholar] [CrossRef]
- Fernandes, P.; Sousa, M.; Salome, P.M.; Leitão, J.; Da Cunha, A.d. Thermodynamic pathway for the formation of SnSe and SnSe2 polycrystalline thin films by selenization of metal precursors. CrystEngComm 2013, 15, 10278–10286. [Google Scholar] [CrossRef]
- Zhao, L.D.; Chang, C.; Tan, G.; Kanatzidis, M. SnSe: A remarkable new thermoelectric material. Energy Environ. Sci. 2016, 9, 3044–3060. [Google Scholar] [CrossRef]
- Shiravizadeh, A.G.; Yousefi, R.; Elahi, S.M.; Sebt, S.A. Effects of annealing atmosphere and rGO concentration on the optical properties and enhanced photocatalytic performance of SnSe/rGO nanocomposites. Phys. Chem. Chem. Phys. 2017, 19, 18089–18098. [Google Scholar] [CrossRef] [PubMed]
- Mandal, P.; Show, B.; Ahmed, S.T.; Banerjee, D.; Mondal, A. Visible-light active electrochemically deposited tin selenide thin films: Synthesis, characterization and photocatalytic activity. J. Mater. Sci. Mater. Electron. 2020, 31, 4708–4718. [Google Scholar] [CrossRef]
- Ren, S.; Liu, S.; Gao, S.; Lu, H.; Li, L.; Rong, P.; Fu, Z.; Gao, L.; Sang, D. A facile solution synthesis of scaly-like hollow SnSe nanotubes for self-powered infrared sensor. J. Alloys Compd. 2021, 879, 160446. [Google Scholar] [CrossRef]
- Shen, Y.; Zhang, Y.; Huo, J.; Li, X.; Yan, Z.; Pan, Y.; Sun, W.; Deng, N.; Kang, W. Two-dimensional SnSe material for solar cells and rechargeable batteries. J. Energy Storage 2023, 69, 107958. [Google Scholar] [CrossRef]
- Nandihalli, N. Thermoelectric films and periodic structures and spin Seebeck effect systems: Facets of performance optimization. Mater. Today Energy 2022, 25, 100965. [Google Scholar] [CrossRef]
- Shirotani, I.; Mikami, J.; Adachi, T.; Katayama, Y.; Tsuji, K.; Kawamura, H.; Shimomura, O.; Nakajima, T. Phase transitions and superconductivity of black phosphorus and phosphorus-arsenic alloys at low temperatures and high pressures. Phys. Rev. B 1994, 50, 16274. [Google Scholar] [CrossRef]
- Yun, W.S.; Han, S.; Hong, S.C.; Kim, I.G.; Lee, J. Thickness and strain effects on electronic structures of transition metal dichalcogenides: 2H-MX2 semiconductors (M = Mo, W; X = S, Se, Te). Phys. Rev. B 2012, 85, 033305. [Google Scholar] [CrossRef]
- Smith, D.; Howie, R.T.; Crowe, I.F.; Simionescu, C.L.; Muryn, C.; Vishnyakov, V.; Novoselov, K.S.; Kim, Y.-J.; Halsall, M.P.; Gregoryanz, E. Hydrogenation of graphene by reaction at high pressure and high temperature. ACS Nano 2015, 9, 8279–8283. [Google Scholar] [CrossRef]
- Huang, G.-Q.; Xing, Z.-W. Superconductivity of bilayer phosphorene under interlayer compression*. Chin. Phys. B 2016, 25, 027402. [Google Scholar] [CrossRef]
- Liu, F.; Zhou, J.; Zhu, C.; Liu, Z. Electric field effect in two-dimensional transition metal dichalcogenides. Adv. Funct. Mater. 2017, 27, 1602404. [Google Scholar] [CrossRef]
- Huang, B.; Clark, G.; Navarro-Moratalla, E.; Klein, D.R.; Cheng, R.; Seyler, K.L.; Zhong, D.; Schmidgall, E.; McGuire, M.A.; Cobden, D.H. Layer-dependent ferromagnetism in a van der Waals crystal down to the monolayer limit. Nature 2017, 546, 270–273. [Google Scholar] [CrossRef] [PubMed]
- Lee, Y.K.; Ahn, K.; Cha, J.; Zhou, C.; Kim, H.S.; Choi, G.; Chae, S.I.; Park, J.-H.; Cho, S.-P.; Park, S.H. Enhancing p-type thermoelectric performances of polycrystalline SnSe via tuning phase transition temperature. J. Am. Chem. Soc. 2017, 139, 10887–10896. [Google Scholar] [CrossRef]
- Lou, X.; Li, S.; Chen, X.; Zhang, Q.; Deng, H.; Zhang, J.; Li, D.; Zhang, X.; Zhang, Y.; Zeng, H. Lattice strain leads to high thermoelectric performance in polycrystalline SnSe. ACS Nano 2021, 15, 8204–8215. [Google Scholar] [CrossRef] [PubMed]
- Luo, Y.; Mao, N.; Ding, D.; Chiu, M.-H.; Ji, X.; Watanabe, K.; Taniguchi, T.; Tung, V.; Park, H.; Kim, P. Electrically switchable anisotropic polariton propagation in a ferroelectric van der Waals semiconductor. Nat. Nanotechnol. 2023, 18, 350–356. [Google Scholar] [CrossRef] [PubMed]
- Li, H.; Hayashi, K.; Nagashima, Y.; Yoshioka, S.; Dong, J.; Li, J.-F.; Miyazaki, Y. Effects of disorder on the electronic structure and thermoelectric properties of an inverse full-heusler Mn2CoAl alloy. Chem. Mater. 2021, 33, 2543–2547. [Google Scholar] [CrossRef]
- Liu, D.; Qin, B.; Zhao, L.-D. SnSe/SnS: Multifunctions beyond thermoelectricity. Mater. Lab 2022, 1, 220006. [Google Scholar] [CrossRef]
- Shi, X.-L.; Chen, W.-Y.; Zhang, T.; Zou, J.; Chen, Z.-G. Fiber-based thermoelectrics for solid, portable, and wearable electronics. Energy Environ. Sci. 2021, 14, 729–764. [Google Scholar] [CrossRef]
- Zhao, L.-D.; Lo, S.-H.; Zhang, Y.; Sun, H.; Tan, G.; Uher, C.; Wolverton, C.; Dravid, V.P.; Kanatzidis, M.G. Ultralow thermal conductivity and high thermoelectric figure of merit in SnSe crystals. Nature 2014, 508, 373–377. [Google Scholar] [CrossRef]
- Li, F.; Wang, H.; Huang, R.; Chen, W.; Zhang, H. Recent advances in SnSe nanostructures beyond thermoelectricity. Adv. Funct. Mater. 2022, 32, 2200516. [Google Scholar] [CrossRef]
- Feng, D.; Ge, Z.-H.; Wu, D.; Chen, Y.-X.; Wu, T.; Li, J.; He, J. Enhanced thermoelectric properties of SnSe polycrystals via texture control. Phys. Chem. Chem. Phys. 2016, 18, 31821–31827. [Google Scholar] [CrossRef] [PubMed]
- Wang, X.; Liu, X. High pressure: A feasible tool for the synthesis of unprecedented inorganic compounds. Inorg. Chem. Front. 2020, 7, 2890–2908. [Google Scholar] [CrossRef]
- Zhang, L.; Wang, Y.; Lv, J.; Ma, Y. Materials discovery at high pressures. Nat. Rev. Mater. 2017, 2, 17005. [Google Scholar] [CrossRef]
- Li, Q.-J.; Liu, B.-B. High pressure structural phase transitions of TiO2 nanomaterials. Chin. Phys. B 2016, 25, 076107. [Google Scholar] [CrossRef]
- Mao, H.-K.; Chen, B.; Chen, J.; Li, K.; Lin, J.-F.; Yang, W.; Zheng, H. Recent advances in high-pressure science and technology. Matter Radiat. Extrem. 2016, 1, 59–75. [Google Scholar] [CrossRef]
- Yankowitz, M.; Jung, J.; Laksono, E.; Leconte, N.; Chittari, B.L.; Watanabe, K.; Taniguchi, T.; Adam, S.; Graf, D.; Dean, C.R. Dynamic band-structure tuning of graphene moiré superlattices with pressure. Nature 2018, 557, 404–408. [Google Scholar] [CrossRef] [PubMed]
- Cai, P.; Hu, J.; He, L.; Pan, J.; Hong, X.; Zhang, Z.; Zhang, J.; Wei, J.; Mao, Z.; Li, S. Drastic pressure effect on the extremely large magnetoresistance in WTe2: Quantum oscillation study. Phys. Rev. Lett. 2015, 115, 057202. [Google Scholar] [CrossRef]
- Yankowitz, M.; Chen, S.; Polshyn, H.; Zhang, Y.; Watanabe, K.; Taniguchi, T.; Graf, D.; Young, A.F.; Dean, C.R. Tuning superconductivity in twisted bilayer graphene. Science 2019, 363, 1059–1064. [Google Scholar] [CrossRef]
- Fülöp, B.; Márffy, A.; Zihlmann, S.; Gmitra, M.; Tóvári, E.; Szentpéteri, B.; Kedves, M.; Watanabe, K.; Taniguchi, T.; Fabian, J. Boosting proximity spin–orbit coupling in graphene/WSe2 heterostructures via hydrostatic pressure. NPJ 2D Mater. Appl. 2021, 5, 82. [Google Scholar] [CrossRef]
- Mori, N.; Takahashi, H.; Takeshita, N. Low-temperature and high-pressure apparatus developed at ISSP, University of Tokyo. High Press. Res. 2004, 24, 225–232. [Google Scholar] [CrossRef]
- Cheng, J.-G.; Wang, B.-S.; Sun, J.-P.; Uwatoko, Y. Cubic anvil cell apparatus for high-pressure and low-temperature physical property measurements. Chin. Phys. B 2018, 27, 077403. [Google Scholar] [CrossRef]
- Li, X.; Sun, J.; Shahi, P.; Gao, M.; MacDonald, A.H.; Uwatoko, Y.; Xiang, T.; Goodenough, J.B.; Cheng, J.; Zhou, J. Pressure-induced phase transitions and superconductivity in a black phosphorus single crystal. Proc. Natl. Acad. Sci. USA 2018, 115, 9935–9940. [Google Scholar] [CrossRef] [PubMed]
- Jayaraman, A. Diamond anvil cell and high-pressure physical investigations. Rev. Mod. Phys. 1983, 55, 65. [Google Scholar] [CrossRef]
- Shen, G.; Mao, H.K. High-pressure studies with X-rays using diamond anvil cells. Rep. Prog. Phys. 2016, 80, 016101. [Google Scholar] [CrossRef] [PubMed]
- Li, B.; Ji, C.; Yang, W.; Wang, J.; Yang, K.; Xu, R.; Liu, W.; Cai, Z.; Chen, J.; Mao, H.-k. Diamond anvil cell behavior up to 4 Mbar. Proc. Natl. Acad. Sci. USA 2018, 115, 1713–1717. [Google Scholar] [CrossRef]
- Pei, S.; Wang, Z.; Xia, J. High pressure studies of 2D materials and heterostructures: A review. Mater. Des. 2022, 213, 110363. [Google Scholar] [CrossRef]
- Klotz, S.; Chervin, J.; Munsch, P.; Le Marchand, G. Hydrostatic limits of 11 pressure transmitting media. J. Phys. D Appl. Phys. 2009, 42, 075413. [Google Scholar] [CrossRef]
- Wang, X.; Shen, Z.; Tang, S.; Kuok, M. Near infrared excited micro-Raman spectra of 4: 1 methanol–ethanol mixture and ruby fluorescence at high pressure. J. Appl. Phys. 1999, 85, 8011–8017. [Google Scholar] [CrossRef]
- Ragan, D.D.; Clarke, D.R.; Schiferl, D. Silicone fluid as a high-pressure medium in diamond anvil cells. Rev. Sci. Instrum. 1996, 67, 494–496. [Google Scholar] [CrossRef]
- Chen, X.; Lou, H.; Zeng, Z.; Cheng, B.; Zhang, X.; Liu, Y.; Xu, D.; Yang, K.; Zeng, Q. Structural transitions of 4: 1 methanol–ethanol mixture and silicone oil under high pressure. Matter Radiat. Extrem. 2021, 6, 038402. [Google Scholar] [CrossRef]
- Angel, R.J.; Bujak, M.; Zhao, J.; Gatta, G.D.; Jacobsen, S.D. Effective hydrostatic limits of pressure media for high-pressure crystallographic studies. J. Appl. Crystallogr. 2007, 40, 26–32. [Google Scholar] [CrossRef]
- Han, H.; Yao, Y.; Robinson, R.D. Interplay between chemical transformations and atomic structure in nanocrystals and nanoclusters. Acc. Chem. Res. 2021, 54, 509–519. [Google Scholar] [CrossRef] [PubMed]
- Wittenberg, J.S.; Miller, T.A.; Szilagyi, E.; Lutker, K.; Quirin, F.; Lu, W.; Lemke, H.; Zhu, D.; Chollet, M.; Robinson, J. Real-time visualization of nanocrystal solid–solid transformation pathways. Nano Lett. 2014, 14, 1995–1999. [Google Scholar] [CrossRef] [PubMed]
- Shekar, N.C.; Rajan, K.G. Kinetics of pressure induced structural phase transitions—A review. Bull. Mater. Sci. 2001, 24, 1–21. [Google Scholar] [CrossRef]
- Vishnoi, P.; Rao, C.N.R. Temperature and Pressure Induced Structural Transitions of Lead Iodide Perovskites. J. Mater. Chem. A 2023. [Google Scholar] [CrossRef]
- Chattopadhyay, T.; Pannetier, J.; Von Schnering, H.G. Neutron diffraction study of the structural phase transition in SnS and SnSe. J. Phys. Chem. Solids 1986, 47, 879–885. [Google Scholar] [CrossRef]
- Peters, M.; McNeil, L. High-pressure Mössbauer study of SnSe. Phys. Rev. B 1990, 41, 5893. [Google Scholar] [CrossRef]
- Chen, Z.-G.; Shi, X.; Zhao, L.-D.; Zou, J. High-performance SnSe thermoelectric materials: Progress and future challenge. Prog. Mater Sci. 2018, 97, 283–346. [Google Scholar] [CrossRef]
- Chattopadhyay, T.; Werner, A.; Von Schnering, H.; Pannetier, J. Temperature and pressure induced phase transition in IV-VI compounds. Rev. Phys. Appl. 1984, 19, 807–813. [Google Scholar] [CrossRef]
- Alptekin, S. Structural phase transition of SnSe under uniaxial stress and hydrostatic pressure: An ab initio study. J. Mol. Model. 2011, 17, 2989–2994. [Google Scholar] [CrossRef] [PubMed]
- Loa, I.; Husband, R.; Downie, R.; Popuri, S.; Bos, J.G. Structural changes in thermoelectric SnSe at high pressures. J. Phys. Condens. Matter 2015, 27, 072202. [Google Scholar] [CrossRef] [PubMed]
- Pal, S.; Arora, R.; Roychowdhury, S.; Harnagea, L.; Saurabh, K.; Shenoy, S.; Muthu, D.; Biswas, K.; Waghmare, U.; Sood, A. Pressure-induced phase transitions in the topological crystalline insulator SnTe and its comparison with semiconducting SnSe: Raman and first-principles studies. Phys. Rev. B 2020, 101, 155202. [Google Scholar] [CrossRef]
- Chen, X.; Lu, P.; Wang, X.; Zhou, Y.; An, C.; Zhou, Y.; Xian, C.; Gao, H.; Guo, Z.; Park, C. Topological Dirac line nodes and superconductivity coexist in SnSe at high pressure. Phys. Rev. B 2017, 96, 165123. [Google Scholar] [CrossRef]
- Nguyen-Cong, K.; Gonzalez, J.M.; Steele, B.A.; Oleynik, I.I. Tin–Selenium Compounds at Ambient and High Pressures. J. Phys. Chem. C 2018, 122, 18274–18281. [Google Scholar] [CrossRef]
- Ivanova, A.G.; Troyan, I.; Chareev, D.A.; Gavriliuk, A.G.e.; Starchikov, S.; Baskakov, A.O.; Frolov, K.V.; Mezouar, M.; Lyubutin, I.S.e. Structural phase transitions and the equation of state in SnSe at high pressures up to 2 Mbar. JETP Lett. 2018, 108, 414–418. [Google Scholar] [CrossRef]
- Luo, Y.; Shi, Y.; Wu, M.; Wu, Y.; Wang, K.; Tu, B.; Huang, H. Pressure-induced phase transitions and metallization in layered SnSe. Appl. Phys. Lett. 2023, 123, 094101. [Google Scholar] [CrossRef]
- Salerno, M.; Landoni, P.; Verganti, R. Designing foresight studies for Nanoscience and Nanotechnology (NST) future developments. Technol. Forecast. Soc. Change 2008, 75, 1202–1223. [Google Scholar] [CrossRef]
- Patel, K.; Chauhan, P.; Patel, A.B.; Solanki, G.K.; Patel, K.D.; Pathak, V.M. Orthorhombic SnSe nanocrystals for visible-light photodetectors. ACS Appl. Nano Mater. 2020, 3, 11143–11151. [Google Scholar] [CrossRef]
- Han, G.; Popuri, S.R.; Greer, H.F.; Llin, L.F.; Bos, J.W.G.; Zhou, W.; Paul, D.J.; Ménard, H.; Knox, A.R.; Montecucco, A. Chlorine-Enabled Electron Doping in Solution-Synthesized SnSe Thermoelectric Nanomaterials. Adv. Energy Mater. 2017, 7, 1602328. [Google Scholar] [CrossRef]
- Zhang, J.; Zhu, H.; Wu, X.; Cui, H.; Li, D.; Jiang, J.; Gao, C.; Wang, Q.; Cui, Q. Plasma-assisted synthesis and pressure-induced structural transition of single-crystalline SnSe nanosheets. Nanoscale 2015, 7, 10807–10816. [Google Scholar] [CrossRef]
- Michielon de Souza, S.; Ordozgoith da Frota, H.; Trichês, D.M.; Ghosh, A.; Chaudhuri, P.; Silva dos Santos Gusmao, M.; de Figueiredo Pereira, A.F.F.; Couto Siqueira, M.; Daum Machado, K.; Cardoso de Lima, J. Pressure-induced polymorphism in nanostructured SnSe. J. Appl. Crystallogr. 2016, 49, 213–221. [Google Scholar] [CrossRef]
- Ghosh, A.; Gusmão, M.; Chaudhuri, P.; de Souza, S.M.; Mota, C.; Trichês, D.; Frota, H. Electrical properties of SnSe under high-pressure. Comput. Condens. Matter 2016, 9, 77–81. [Google Scholar] [CrossRef]
- da Silva Marques, L.; de Oliveira Ferreira, J.M.; Rebelo, Q.H.F.; Ghosh, A.; Trichês, D.M.; de Souza, S.M. High-pressure study of a nanostructured SnSe1−xSx (x = 0.5) solid solution by in-situ X-ray diffraction and ab-initio calculations. J. Alloys Compd. 2019, 792, 536–542. [Google Scholar] [CrossRef]
- Yue, L.; Xu, D.; Wei, Z.; Zhao, T.; Lin, T.; Tenne, R.; Zak, A.; Li, Q.; Liu, B. Size and Shape’s Effects on the High-Pressure Behavior of WS2 Nanomaterials. Materials 2022, 15, 2838. [Google Scholar] [CrossRef] [PubMed]
- Ji, T.; Gao, Y.; Qin, T.; Yue, D.; Liu, H.; Han, Y.; Gao, C. Effect of Grain Size on Electrical Properties of Anatase TiO2 under High Pressure. J. Phys. Chem. C 2021, 125, 3314–3319. [Google Scholar] [CrossRef]
- Li, J.; Liu, B.; Dong, J.; Li, C.; Dong, Q.; Lin, T.; Liu, R.; Wang, P.; Shen, P.; Li, Q. Size and morphology effects on the high pressure behaviors of Mn3O4 nanorods. Nanoscale Adv. 2020, 2, 5841–5847. [Google Scholar] [CrossRef]
- Bai, F.; Bian, K.; Huang, X.; Wang, Z.; Fan, H. Pressure induced nanoparticle phase behavior, property, and applications. Chem. Rev. 2019, 119, 7673–7717. [Google Scholar] [CrossRef]
- Wang, Z.; Saxena, S.; Pischedda, V.; Liermann, H.; Zha, C. In situ x-ray diffraction study of the pressure-induced phase transformation in nanocrystalline CeO2. Phys. Rev. B 2001, 64, 012102. [Google Scholar] [CrossRef]
- Wang, C.-P.; Shieh, S.R.; Withers, A.C.; Liu, X.; Zhang, D.; Tkachev, S.N.; Djirar, A.-E.; Xie, T.; Rumney, J.D. Raman and X-ray diffraction study of pressure-induced phase transition in synthetic Mg2TiO4. Sci. Rep. 2020, 10, 6278. [Google Scholar] [CrossRef]
- Li, B.; Qian, G.; Oganov, A.R.; Boulfelfel, S.E.; Faller, R. Mechanism of the fcc-to-hcp phase transformation in solid Ar. J. Chem. Phys. 2017, 146, 214502. [Google Scholar] [CrossRef]
- Zhang, H.; Zhang, C.; Gregory, D.H.; Yin, Z.; Wang, Y.; He, P.; Guo, X. A review of pressure manipulating structure and performance in thermoelectrics. J. Phys. D Appl. Phys. 2023, 56, 183001. [Google Scholar] [CrossRef]
- Segura, A. Layered indium selenide under high pressure: A review. Crystals 2018, 8, 206. [Google Scholar] [CrossRef]
- Zhu, H.; Nagaoka, Y.; Hills-Kimball, K.; Tan, R.; Yu, L.; Fang, Y.; Wang, K.; Li, R.; Wang, Z.; Chen, O. Pressure-enabled synthesis of hetero-dimers and hetero-rods through intraparticle coalescence and interparticle fusion of quantum-dot-Au satellite nanocrystals. J. Am. Chem. Soc. 2017, 139, 8408–8411. [Google Scholar] [CrossRef] [PubMed]
- Wu, H.; Bai, F.; Sun, Z.; Haddad, R.E.; Boye, D.M.; Wang, Z.; Huang, J.Y.; Fan, H. Nanostructured gold architectures formed through high pressure-driven sintering of spherical nanoparticle arrays. J. Am. Chem. Soc. 2010, 132, 12826–12828. [Google Scholar] [CrossRef] [PubMed]
- Yin, T.; Fang, Y.; Chong, W.K.; Ming, K.T.; Jiang, S.; Li, X.; Kuo, J.L.; Fang, J.; Sum, T.C.; White, T.J. High-Pressure-Induced Comminution and Recrystallization of CH3NH3PbBr3 Nanocrystals as Large Thin Nanoplates. Adv. Mater. 2018, 30, 1705017. [Google Scholar] [CrossRef] [PubMed]
- Abutbul, R.E.; Segev, E.; Samuha, S.; Zeiri, L.; Ezersky, V.; Makov, G.; Golan, Y. A new nanocrystalline binary phase: Synthesis and properties of cubic tin monoselenide. CrystEngComm 2016, 18, 1918–1923. [Google Scholar] [CrossRef]
- Rabkin, A.; Samuha, S.; Abutbul, R.E.; Ezersky, V.; Meshi, L.; Golan, Y. New nanocrystalline materials: A previously unknown simple cubic phase in the SnS binary system. Nano Lett. 2015, 15, 2174–2179. [Google Scholar] [CrossRef] [PubMed]
- Abutbul, R.E.; Segev, E.; Zeiri, L.; Ezersky, V.; Makov, G.; Golan, Y. Synthesis and properties of nanocrystalline π-SnS–a new cubic phase of tin sulphide. RSC Adv. 2016, 6, 5848–5855. [Google Scholar] [CrossRef]
- ur Rehman, S.; Butt, F.K.; Tariq, Z.; Hayat, F.; Gilani, R.; Aleem, F. Pressure induced structural and optical properties of cubic phase SnSe: An investigation for the infrared/mid-infrared optoelectronic devices. J. Alloys Compd. 2017, 695, 194–201. [Google Scholar] [CrossRef]
- Xie, S.; Cheng, X.; Hu, C.; Tao, Y.; Liu, M.; Qi, Z. High pressure effect on the phase transition and in-plane anisotropy of SnSe. J. Alloys Compd. 2020, 849, 155915. [Google Scholar] [CrossRef]
- Biesner, T.; Li, W.; Tsirlin, A.A.; Roh, S.; Wei, P.-C.; Uykur, E.; Dressel, M. Spectroscopic trace of the Lifshitz transition and multivalley activation in thermoelectric SnSe under high pressure. NPG Asia Mater. 2021, 13, 12. [Google Scholar] [CrossRef]
- Zhang, C.; Ouyang, H.; Miao, R.; Sui, Y.; Hao, H.; Tang, Y.; You, J.; Zheng, X.; Xu, Z.; Cheng, X.a. Anisotropic nonlinear optical properties of a SnSe flake and a novel perspective for the application of all-optical switching. Adv. Opt. Mater. 2019, 7, 1900631. [Google Scholar] [CrossRef]
- Shi, G.; Kioupakis, E. Anisotropic spin transport and strong visible-light absorbance in few-layer SnSe and GeSe. Nano Lett. 2015, 15, 6926–6931. [Google Scholar] [CrossRef] [PubMed]
- Wang, C.; Xia, Y.; Tian, Z.; Jiang, J.; Li, B.; Cui, S.; Yang, H.; Liang, A.; Zhan, X.; Hong, G. Photoemission study of the electronic structure of valence band convergent SnSe. Phys. Rev. B 2017, 96, 165118. [Google Scholar] [CrossRef]
- Wang, H.; Qian, X. Giant optical second harmonic generation in two-dimensional multiferroics. Nano Lett. 2017, 17, 5027–5034. [Google Scholar] [CrossRef]
- Huang, L.; Wu, F.; Li, J. Structural anisotropy results in strain-tunable electronic and optical properties in monolayer GeX and SnX (X = S, Se, Te). J. Chem. Phys. 2016, 144, 114708. [Google Scholar] [CrossRef]
- Yu, J.; Yue, A.; Stafsudd, O., Jr. Growth and electronic properties of the SnSe semiconductor. J. Cryst. Growth 1981, 54, 248–252. [Google Scholar] [CrossRef]
- Zou, D.; Xie, S.; Liu, Y.; Lin, J.; Li, J. First-principles study of thermoelectric and lattice vibrational properties of chalcopyrite CuGaTe2. J. Alloys Compd. 2013, 570, 150–155. [Google Scholar] [CrossRef]
- Dos Santos, E.C.; Lourenço, M.P.; Pettersson, L.G.; Duarte, H.l.A. Stability, structure, and electronic properties of the pyrite/arsenopyrite solid–solid interface–A DFT study. J. Phys. Chem. C 2017, 121, 8042–8051. [Google Scholar] [CrossRef]
- Joshi, H.; Ram, M.; Limbu, N.; Rai, D.; Thapa, B.; Labar, K.; Laref, A.; Thapa, R.; Shankar, A. Modulation of optical absorption in m-Fe1− xRuxS2 and exploring stability in new m-RuS2. Sci. Rep. 2021, 11, 6601. [Google Scholar] [CrossRef]
- Kutorasinski, K.; Wiendlocha, B.; Kaprzyk, S.; Tobola, J. Electronic structure and thermoelectric properties of n- and p-type SnSe from first-principles calculations. Phys. Rev. B 2015, 91, 205201. [Google Scholar] [CrossRef]
- Guo, S.-D.; Wang, Y.-H. Thermoelectric properties of orthorhombic group IV–VI monolayers from the first-principles calculations. J. Appl. Phys. 2017, 121, 034302. [Google Scholar] [CrossRef]
- Xu, B.; Zhang, J.; Yu, G.; Ma, S.; Wang, Y.; Yi, L. Comparative study of electronic structure and thermoelectric properties of SnSe for Pnma and Cmcm phase. J. Electron. Mater. 2016, 45, 5232–5237. [Google Scholar] [CrossRef]
- Lee, C.-H.; Ma, M.-H.; Li, W.-H.; Wei, P.-C.; Chen, Y.-Y.; Zhao, Y.; Lynn, J. Extremely space and time restricted thermal transport in the high temperature Cmcm phase of thermoelectric SnSe. Mater. Today Phys. 2019, 11, 100171. [Google Scholar] [CrossRef]
- Hong, J.; Delaire, O. Phase transition and anharmonicity in SnSe. Mater. Today Phys. 2019, 10, 100093. [Google Scholar] [CrossRef]
- Li, C.; Guo, D.; Li, K.; Shao, B.; Chen, D.; Ma, Y.; Sun, J. Excellent thermoelectricity performance of p-type SnSe along b axis. Phys. B Condens. Matter 2018, 530, 264–269. [Google Scholar] [CrossRef]
- Shi, G.; Kioupakis, E. Quasiparticle band structures and thermoelectric transport properties of p-type SnSe. J. Appl. Phys. 2015, 117, 065103. [Google Scholar] [CrossRef]
- Zhang, Y.; Jia, X.; Sun, H.; Sun, B.; Liu, B.; Liu, H.; Kong, L.; Ma, H. Effect of high pressure on thermoelectric performance and electronic structure of SnSe via HPHT. J. Alloys Compd. 2016, 667, 123–129. [Google Scholar] [CrossRef]
- Peng, J.; Li, W.; Wang, Y.; Yu, X.; Liu, J.; He, Q. Pressure-induced improvement in symmetry and change in electronic properties of SnSe. J. Mol. Model. 2017, 23, 319. [Google Scholar] [CrossRef]
- Yang, L.T.; Ding, L.-P.; Shao, P.; Tiandong, Y.H.; Zhao, Z.L.; Zhang, F.-H.; Lu, C. Influence of pressure on phase transition, electronic and thermoelectric properties of SnSe. J. Alloys Compd. 2021, 853, 157362. [Google Scholar] [CrossRef]
- Wang, Y.; Lv, J.; Zhu, L.; Ma, Y. CALYPSO: A method for crystal structure prediction. Comput. Phys. Commun. 2012, 183, 2063–2070. [Google Scholar] [CrossRef]
- Doak, J.W.; Michel, K.J.; Wolverton, C. Determining dilute-limit solvus boundaries in multi-component systems using defect energetics: Na in PbTe and PbS. J. Mater. Chem. C 2015, 3, 10630–10649. [Google Scholar] [CrossRef]
- Zhao, J.; Yu, Z.; Hu, Q.; Wang, Y.; Schneeloch, J.; Li, C.; Zhong, R.; Wang, Y.; Liu, Z.; Gu, G. Structural phase transitions of (Bi 1−xSbx)2(Te1− ySey)3 compounds under high pressure and the influence of the atomic radius on the compression processes of tetradymites. Phys. Chem. Chem. Phys. 2017, 19, 2207–2216. [Google Scholar] [CrossRef] [PubMed]
- Yin, Z.; Liu, Z.; Yu, Y.; Zhang, C.; Chen, P.; Zhao, J.; He, P.; Guo, X. Synergistically optimized electron and phonon transport of polycrystalline BiCuSeO via Pb and Yb Co-doping. ACS Appl. Mater. Interfaces 2021, 13, 57638–57645. [Google Scholar] [CrossRef]
- Agarwal, A.; Trivedi, P.; Lakshminarayana, D. Impact of electrical resistance and TEP in layered SnSe crystals under high pressure. Cryst. Res. Technol. 2005, 40, 789–790. [Google Scholar] [CrossRef]
- Yan, J.; Ke, F.; Liu, C.; Wang, L.; Wang, Q.; Zhang, J.; Li, G.; Han, Y.; Ma, Y.; Gao, C. Pressure-driven semiconducting-semimetallic transition in SnSe. Phys. Chem. Chem. Phys. 2016, 18, 5012–5018. [Google Scholar] [CrossRef]
- Marini, G.; Barone, P.; Sanna, A.; Tresca, C.; Benfatto, L.; Profeta, G. Superconductivity in tin selenide under pressure. Phys. Rev. Mater. 2019, 3, 114803. [Google Scholar] [CrossRef]
- Timofeev, Y.A.; Vinogradov, B.; Begoulev, V. Superconductivity of tin selenide at pressures up to 70 GPa. Phys. Solid State 1997, 39, 207. [Google Scholar] [CrossRef]
- Matsumoto, R.; Hara, H.; Tanaka, H.; Nakamura, K.; Kataoka, N.; Yamamoto, S.; Yamashita, A.; Adachi, S.; Irifune, T.; Takeya, H. Pressure-induced superconductivity in sulfur-doped SnSe single crystal using boron-doped diamond electrode-prefabricated diamond anvil cell. J. Phys. Soc. Jpn. 2018, 87, 124706. [Google Scholar] [CrossRef]
- Moshwan, R.; Yang, L.; Zou, J.; Chen, Z.G. Eco-friendly SnTe thermoelectric materials: Progress and future challenges. Adv. Funct. Mater. 2017, 27, 1703278. [Google Scholar] [CrossRef]
- Gayner, C.; Kar, K.K. Recent advances in thermoelectric materials. Prog. Mater. Sci. 2016, 83, 330–382. [Google Scholar] [CrossRef]
- Alsaleh, N.M.; Shoko, E.; Arsalan, M.; Schwingenschlögl, U. Thermoelectric materials under pressure. Phys. Status Solidi Rapid Res. Lett. 2018, 12, 1800083. [Google Scholar] [CrossRef]
- Alsaleh, N.M.; Shoko, E.; Schwingenschlögl, U. Pressure-induced conduction band convergence in the thermoelectric ternary chalcogenide CuBiS2. Phys. Chem. Chem. Phys. 2019, 21, 662–673. [Google Scholar] [CrossRef]
- Yaseen, M.; Butt, M.K.; Ashfaq, A.; Iqbal, J.; Almoneef, M.M.; Iqbal, M.; Murtaza, A.; Laref, A. Phase transition and thermoelectric properties of cubic KNbO3 under pressure: DFT approach. J. Mater. Res. Technol. 2021, 11, 2106–2113. [Google Scholar] [CrossRef]
- Gaul, A.; Peng, Q.; Singh, D.J.; Ramanath, G.; Borca-Tasciuc, T. Pressure-induced insulator-to-metal transitions for enhancing thermoelectric power factor in bismuth telluride-based alloys. Phys. Chem. Chem. Phys. 2017, 19, 12784–12793. [Google Scholar] [CrossRef] [PubMed]
- Nandihalli, N.; Gregory, D.H.; Mori, T. Energy-Saving Pathways for Thermoelectric Nanomaterial Synthesis: Hydrothermal/Solvothermal, Microwave-Assisted, Solution-Based, and Powder Processing. Adv. Sci. 2022, 9, 2106052. [Google Scholar] [CrossRef] [PubMed]
- Carrete, J.; Mingo, N.; Curtarolo, S. Low thermal conductivity and triaxial phononic anisotropy of SnSe. Appl. Phys. Lett. 2014, 105, 101907. [Google Scholar] [CrossRef]
- Ibrahim, D.; Vaney, J.-B.; Sassi, S.; Candolfi, C.; Ohorodniichuk, V.; Levinsky, P.; Semprimoschnig, C.; Dauscher, A.; Lenoir, B. Reinvestigation of the thermal properties of single-crystalline SnSe. Appl. Phys. Lett. 2017, 110, 032103. [Google Scholar] [CrossRef]
- Zhang, Y.; Hao, S.; Zhao, L.-D.; Wolverton, C.; Zeng, Z. Pressure induced thermoelectric enhancement in SnSe crystals. J. Mater. Chem. A 2016, 4, 12073–12079. [Google Scholar] [CrossRef]
- Gusmao, M.; Mota, C.; Ghosh, A.; Frota, H. Thermoelectric properties of SnSe (Pnma) under hydrostatic pressure. Comput. Mater. Sci. 2018, 152, 243–247. [Google Scholar] [CrossRef]
- Ding, G.; Gao, G.; Yao, K. High-efficient thermoelectric materials: The case of orthorhombic IV-VI compounds. Sci. Rep. 2015, 5, 9567. [Google Scholar] [CrossRef] [PubMed]
- Yu, H.; Dai, S.; Chen, Y. Enhanced power factor via the control of structural phase transition in SnSe. Sci. Rep. 2016, 6, 26193. [Google Scholar] [CrossRef] [PubMed]
- Qin, B.; Wang, D.; He, W.; Zhang, Y.; Wu, H.; Pennycook, S.J.; Zhao, L.-D. Realizing high thermoelectric performance in p-type SnSe through crystal structure modification. J. Am. Chem. Soc. 2018, 141, 1141–1149. [Google Scholar] [CrossRef]
- Serrano-Sánchez, F.; Gharsallah, M.; Nemes, N.; Mompean, F.; Martínez, J.; Alonso, J. Record Seebeck coefficient and extremely low thermal conductivity in nanostructured SnSe. Appl. Phys. Lett. 2015, 106, 083902. [Google Scholar] [CrossRef]
- Li, Y.; Shi, X.; Ren, D.; Chen, J.; Chen, L. Investigation of the anisotropic thermoelectric properties of oriented polycrystalline SnSe. Energies 2015, 8, 6275–6285. [Google Scholar] [CrossRef]
- Zhang, Q.; Chere, E.K.; Sun, J.; Cao, F.; Dahal, K.; Chen, S.; Chen, G.; Ren, Z. Studies on thermoelectric properties of n-type polycrystalline SnSe1-xSxby iodine doping. Adv. Energy Mater. 2015, 5, 1500360. [Google Scholar] [CrossRef]
- Su, N.; Qin, B.; Zhu, K.; Liu, Z.; Shahi, P.; Sun, J.; Wang, B.; Sui, Y.; Shi, Y.; Zhao, L. Pressure-induced enhancement of thermoelectric power factor in pristine and hole-doped SnSe crystals. RSC Adv. 2019, 9, 26831–26837. [Google Scholar] [CrossRef]
- Volovik, G. Topological lifshitz transitions. Low Temp. Phys. 2017, 43, 47–55. [Google Scholar] [CrossRef]
- Bellin, C.; Pawbake, A.; Paulatto, L.; Béneut, K.; Biscaras, J.; Narayana, C.; Polian, A.; Late, D.J.; Shukla, A. Functional monochalcogenides: Raman evidence linking properties, structure, and metavalent bonding. Phys. Rev. Lett. 2020, 125, 145301. [Google Scholar] [CrossRef]
- Kim, Y.; Choi, I.-H. Optical and electrical properties of GeSe and SnSe single crystals. J. Korean Phys. Soc. 2018, 72, 238–242. [Google Scholar] [CrossRef]
- Efthimiopoulos, I.; Berg, M.; Bande, A.; Puskar, L.; Ritter, E.; Xu, W.; Marcelli, A.; Ortolani, M.; Harms, M.; Müller, J. Effects of temperature and pressure on the optical and vibrational properties of thermoelectric SnSe. Phys. Chem. Chem. Phys. 2019, 21, 8663–8678. [Google Scholar] [CrossRef] [PubMed]
- Nishimura, T.; Sakai, H.; Mori, H.; Akiba, K.; Usui, H.; Ochi, M.; Kuroki, K.; Miyake, A.; Tokunaga, M.; Uwatoko, Y. Large enhancement of thermoelectric efficiency due to a pressure-induced lifshitz transition in SnSe. Phys. Rev. Lett. 2019, 122, 226601. [Google Scholar] [CrossRef] [PubMed]
Figure 1.
Schematic diagrams (a,b) and images (c,d) of a typical DAC. Reprinted with permission from Ref. [46]. Copyright 2022, Elsevier.
Figure 1.
Schematic diagrams (a,b) and images (c,d) of a typical DAC. Reprinted with permission from Ref. [46]. Copyright 2022, Elsevier.

Figure 2.
Crystal structure of (a) α-SnSe and (b) β-SnSe. Reprinted with permission from Ref. [58]. Copyright 2018, Elsevier.
Figure 2.
Crystal structure of (a) α-SnSe and (b) β-SnSe. Reprinted with permission from Ref. [58]. Copyright 2018, Elsevier.

Figure 3.
(a) Raman spectra of SnSe under high pressure; (b) the Raman shift of SnSe under high pressure. Reprinted with permission from Ref. [62]. Copyright 2020, American Physical Society.
Figure 3.
(a) Raman spectra of SnSe under high pressure; (b) the Raman shift of SnSe under high pressure. Reprinted with permission from Ref. [62]. Copyright 2020, American Physical Society.

Figure 4.
(a) High-pressure ADXRD of SnSe; (b) lattice parameters as a function of pressure; (c) cell volume as a function of pressure; (d) calculated enthalpy relative to that of the β-SnSe; (e) unit cell volume vs. pressure; and (f) crystal structures of α-SnSe, β-SnSe and CsCl-type SnSe. Reprinted with permission from Ref. [63]. Copyright 2017, American Physical Society.

Figure 5.
(a) ADXRD patterns of SnSe nanosheets; (b) selected Raman spectra of SnSe nanosheets under high pressure. Reprinted with permission from Ref. [70]. Copyright 2015, The Royal Society of Chemistry. (c) ADXRD patterns of SnS0.5Se0.5; (d) (111) peak shift in the function of the pressure. Reprinted with permission from Ref. [73]. Copyright 2019, Elsevier.

Figure 6.
(a,b) Frequency-dependent dielectric function of π-SnSe at 0–40 GPa. Reprinted with permission from Ref. [89]. Copyright 2017 Elsevier. (c,d) NIR absorption spectra of SnSe during compression and decompression at room temperature. Reprinted with permission from Ref. [66]. Copyright 2023, AIP Publishing.

Figure 7.
In-plane anisotropy in SnSe. Polarization-dependent (a) saturable absorption and (b) transient absorption in SnSe. Reprinted with permission from Ref. [92]. Copyright 2019, Wiley-VCH. (c) Pressure dependence of absorbance spectra of SnSe in directions of b-axis and c-axis; (d) intensity of Ag(1) and B3g modes as a function of the excitation polarization direction. Reprinted with permission from Ref. [90]. Copyright 2020, Elsevier.

Figure 8.
(a–c) Band structures and (d–f) DOS of SnSe under pressure. Reprinted with permission from Ref. [108]. Copyright 2016, Elsevier.
Figure 8.
(a–c) Band structures and (d–f) DOS of SnSe under pressure. Reprinted with permission from Ref. [108]. Copyright 2016, Elsevier.

Figure 9.
Electronic band structure of SnSe at (a) 0, (b) 22, (c) 78.5, (d) 89 and (e) 220 GPa, respectively; DOS of (f) Pnma, (g) Cmcm, (h) Pmm, (i) C2/m, and (j) Cmmm phases of SnSe. Reprinted with permission from Ref. [110]. Copyright 2021, Elsevier..
Figure 9.
Electronic band structure of SnSe at (a) 0, (b) 22, (c) 78.5, (d) 89 and (e) 220 GPa, respectively; DOS of (f) Pnma, (g) Cmcm, (h) Pmm, (i) C2/m, and (j) Cmmm phases of SnSe. Reprinted with permission from Ref. [110]. Copyright 2021, Elsevier..

Figure 10.
(a) Resistivity of SnSe at various pressures; (b) temperature–pressure contour plot of resistivity; (c) electrical resistivity, (d) carrier concentration, (e) carrier mobility, and (f) hall coefficient of SnSe as a function of pressure at room temperature. Reprinted with permission from Ref. [116]. Copyright 2016, The Royal Society of Chemistry.

Figure 11.
(a) Temperature versus pressure phase diagram. Reprinted with permission from Ref. [63]. Copyright 2017, American Physical Society. (b) Superconducting gap (△SC) as a function of the temperature at various pressures; (c) critical temperature of the CsCl-type phase as a function of the pressure; (d) superconducting critical temperature as a function of the angle at 50 GPa. Reprinted with permission from Ref. [117]. Copyright 2019, American Physical Society.

Figure 12.
(a) The Seebeck coefficient at ambient pressure; (b) the Seebeck coefficient for the a-axis taking into account the dependence of the carrier concentration n(T) on temperature, for constant carrier concentration n0 (solid circle); in (c–e) the Seebeck coefficient for P = 4, 7 and 10 GPa are shown. ZT as a function of temperature for pressures (f) P = 0, (g) P = 4, (h) P = 7, and (i) P = 10 GPa. Reprinted with permission from Ref. [130]. Copyright 2018, Elsevier.

Figure 13.
(a,b) Seebeck coefficient, (c,d) electrical conductivity and (e,f) power factor of SnSe under different pressures; (g) theoretical lattice thermal conductivity of Pnma at different pressures; electronic thermal conductivity of the Pnma phase as functions of temperature at (h) 0 GPa and (i) 4 GPa. Reprinted with permission from Ref. [132]. Copyright 2016, Springer Nature.

Figure 14.
Pressure dependence of thermoelectric properties of SnSe, (a–c) electrical resistivity, Seebeck coefficient, power factor. Reprinted with permission from Ref. [108]. Copyright 2016, Elsevier. Pressure dependence of (d) electrical conductivity, (e) Seebeck coefficient, (f) power factor at 290 K for pristine SnSe (left) and Na-doped SnSe (right). Reprinted with permission from Ref. [137]. Copyright 2019, The Royal Society of Chemistry.

Figure 15.
(a,b) Color maps of the optical conductivity, σ1(ω), as a function of pressure. Reprinted with permission from Ref. [91]. Copyright 2021, Springer Nature. Field (B) dependence of (c) magneto-resistivity and (d) Hall resistivity along the bc plane at various pressures at 2 K; (e) plots of the fast Fourier transform of the oscillatory part of ρ at 2 K at various pressures. Reprinted with permission from Ref. [142]. Copyright 2019, American Physical Society.


Table 1.
Properties of different pressure-transmitting mediums.
| Pressure Transmitting Mediums | Advantages | Limitations | Solidification Pressure (GPa) | Hydrostatic Limit (GPa) | Refs |
|---|---|---|---|---|---|
| Methanol/ethanol (4:1) (ME) | Cheap; easy to use | Raman peaks at 432,882 cm−1 | 10.5 | 20 | [47,48] |
| Methanol/ethanol/water (16:3:1) | Cheap; easy filling | Raman peaks in the range of 0–1000 cm−1 | 14.4 | 20 | [47] |
| Silicone oil | Cheap; easy to use | Raman peaks at 153,190,490, 687 cm−1 | 0.9 | 15 | [49,50] |
| Argon | Low Raman background | Difficult to use | 1.9 | 10 | [47] |
| Nitrogen | Low Raman background | Difficult to use | 3.0 | 13 | [51] |
| Helium | Low Raman background; high hydrostatic limit | Difficult to use | 12.1 | >60 | [43] |
Table 2.
Pressure phase transition, volume, bulk modulus, and PTM in SnSe (PTM = Pressure-transmitting media, ME = methanol/ethanol).
Table 2.
Pressure phase transition, volume, bulk modulus, and PTM in SnSe (PTM = Pressure-transmitting media, ME = methanol/ethanol).
| Shape | Phase Transition | Pressure (GPa) | Volume (Å3) | Bulk Modulus (GPa) | PTM | Ref |
|---|---|---|---|---|---|---|
| bulk | α-SnSe to β-SnSe | 7 | α-SnSe: 31.48 β-SnSe: 40.9 | [60] | ||
| bulk | α-SnSe to β-SnSe | 10.5 | α-SnSe: 212.23(5) | α-SnSe: 31.1(2) | helium | [61] |
| nanosheets | α-SnSe to β-SnSe | 6.8 | α-SnSe: 214.52 | α-SnSe: 34.4(21) β-SnSe: 80.1(11) | 4:1 ME | [70] |
Table 3.
Summary of all optical properties of cubic phase π-SnSe at (0, 5, 10, 15, 20, 25, 30, 35 and 40) GPa. Reprinted with permission from Ref. [89]. Copyright 2017 Elsevier.
Table 3.
Summary of all optical properties of cubic phase π-SnSe at (0, 5, 10, 15, 20, 25, 30, 35 and 40) GPa. Reprinted with permission from Ref. [89]. Copyright 2017 Elsevier.
| Property | Pressure Value | ||||||||
|---|---|---|---|---|---|---|---|---|---|
| 0 GPa | 5 GPa | 10 GPa | 15 GPa | 20 GPa | 25 GPa | 30 GPa | 35 GPa | 40 GPa | |
| Static dielectric ε1(0) | 10.10 | 17.00 | 28.20 | 33.00 | 42.30 | 51.10 | 58.70 | 67.20 | 76.20 |
| Screen plasma frequency | 8.50 eV | 8.84 eV | 10.60 eV | 10.90 eV | 11.40 eV | 11.70 eV | 12.00 eV | 12.30 eV | 12.60 eV |
| Dielectric imaginary part ε2(ω) peaks | 2.32 eV | 1.82 eV | 1.78 eV | 1.75 eV | 1.64 eV | 1.54 eV | 1.49 eV | 1.41 eV | 1.35 eV |
| Refractive index n(0) | 3.18 | 4.12 | 5.31 | 5.75 | 6.51 | 7.15 | 7.66 | 8.20 | 8.74 |
| Absorption intense peak energy | 4.17 eV | 4.06 eV | 4.35 eV | 4.25 eV | 4.38 eV | 4.45 eV | 4.54 eV | 4.55 eV | 4.58 eV |
| Absorption peak | 1.67 × 10⁵ | 1.60 × 10⁵ | 1.97 × 10⁵ | 2.01 × 10⁵ | 2.08 × 10⁵ | 2.13 × 10⁵ | 2.17 × 10⁵ | 2.20 × 10⁵ | 2.24 × 10⁵ |
| Conductivity intense peak energy | 2.75 eV | 2.54 eV | 2.08 eV | 2.00 eV | 1.97 eV | 1.90 eV | 1.88 eV | 1.78 eV | 1.75 eV |
| Conductivity peak (1/fs) | 4.63 | 4.70 | 7.68 | 8.14 | 8.82 | 9.34 | 9.81 | 10.30 | 10.80 |
| Reflectivity intense peak energy | 6.62 eV | 6.97 eV | 7.29 eV | 7.59 eV | 8.03 eV | 8.20 eV | 8.57 eV | 8.95 eV | 9.73 eV |
| Zero frequency coefficient of reflectivity | 0.27 | 0.39 | 0.46 | 0.49 | 0.53 | 0.57 | 0.59 | 0.61 | 0.63 |
| Loss function | 8.49 eV | 9.52 eV | 10.60 eV | 10.90 eV | 11.30 eV | 11.70 eV | 12.00 eV | 12.30 eV | 12.60 eV |
Disclaimer/Publisher’s Note: The statements, opinions and data contained in all publications are solely those of the individual author(s) and contributor(s) and not of MDPI and/or the editor(s). MDPI and/or the editor(s) disclaim responsibility for any injury to people or property resulting from any ideas, methods, instructions or products referred to in the content. |
© 2023 by the authors. Licensee MDPI, Basel, Switzerland. This article is an open access article distributed under the terms and conditions of the Creative Commons Attribution (CC BY) license (https://creativecommons.org/licenses/by/4.0/).
Share and Cite
MDPI and ACS Style
Cheng, Z.; Zhang, J.; Lin, L.; Zhan, Z.; Ma, Y.; Li, J.; Yu, S.; Cui, H. Pressure-Induced Modulation of Tin Selenide Properties: A Review. Molecules 2023, 28, 7971. https://doi.org/10.3390/molecules28247971
AMA Style
Cheng Z, Zhang J, Lin L, Zhan Z, Ma Y, Li J, Yu S, Cui H. Pressure-Induced Modulation of Tin Selenide Properties: A Review. Molecules. 2023; 28(24):7971. https://doi.org/10.3390/molecules28247971
Chicago/Turabian StyleCheng, Ziwei, Jian Zhang, Lin Lin, Zhiwen Zhan, Yibo Ma, Jia Li, Shenglong Yu, and Hang Cui. 2023. "Pressure-Induced Modulation of Tin Selenide Properties: A Review" Molecules 28, no. 24: 7971. https://doi.org/10.3390/molecules28247971