
UVC Stokes and Anti-Stokes Emission of Ca9Y(PO4)7 Polycrystals Doped with Pr3+ Ions
by
 , , , , and
Karol Lemański
1,*,
Olha Bezkrovna
1,2,
Nadiia Rebrova
1,
Radosław Lisiecki
1,
Patrycja Zdeb
1 and
Przemysław Jacek Dereń
1,* 1
Institute of Low Temperature and Structure Research, Polish Academy of Sciences, ul. Okólna 2, 50-422 Wrocław, Poland
2
Institute for Single Crystals, NAS of Ukraine, Nauky Ave. 60, 61001 Kharkiv, Ukraine
*
Authors to whom correspondence should be addressed.
Molecules 2024, 29(9), 2084; https://doi.org/10.3390/molecules29092084
Submission received: 29 February 2024
/
Revised: 2 April 2024
/
Accepted: 25 April 2024
/
Published: 1 May 2024
(This article belongs to the Section Physical Chemistry)
Abstract
:The recent COVID-19 pandemic has made everyone aware of the threat of viruses and the growing number of antibiotic-resistant bacteria. It has become necessary to find new methods to combat these hazards. One tool that could be used is UVC radiation, i.e., 100–280 nm. Currently, the available sources of this light are mercury vapor lamps. However, the modern world requires more compact, mercury-free, and less energy-consuming light sources. This work presents the results of our research on a new material in which efficient UVC radiation was obtained. Here, we present the results of research on Ca9Y(PO4)7 polycrystals doped with Pr3+ ions prepared using the solid-state method. The absorption, excitation, emission, and emission decay profiles of praseodymium(III) ions were measured and analyzed. The upconversion emission in the UVC region excited by blue light was observed. Parameters such as energy bandgap, refractive index, and thermal stability of luminescence were determined. The studied phosphate-based phosphor possesses promising characteristics that show its potential in luminescent applications in future use in medicine or for surface disinfection.
1. Introduction
UVC radiation (100–280 nm) can successfully inactivate microbes and viruses [1], better than UVB (280–315 nm) or UVA (315–400 nm) light. Phosphors capable of emitting light in the UVC range could have a wide range of medical applications, from self-cleaning surfaces to various medical procedures [2,3,4,5], e.g., to sterilize surgical equipment, room disinfection as well as air and water, which is due to the fact that UV sterilization helps to eliminate dangerous pathogens in many public places, e.g., hospitals, workplaces, schools, or airports.
An important issue for obtaining UVC radiation is the choice of host matrix and activator. Rare-earth elements are most often used as an activator. Among them, Pr3+ has attracted much attention. Praseodymium(III) has two electrons in the 4f subshell, well shielded by other subshells from the influence of the crystal field, which is characteristic of all lanthanides (Ln). Because of this, the lanthanides in various crystalline compounds possess stable spectroscopic properties. The luminescence of Pr3+ ions can be characterized by many colors from near-ultraviolet and blue to infrared range [6,7,8,9,10,11,12,13,14]. Most often, blue or red emissions dominate, which mainly occurs, respectively, from the 3P0 or 1D2 energy levels to the ground state 3H4. Also, in some hosts doped with Pr3+ ions, a strong 5d→4f emission in the UVC range is observed [1,15,16,17].
In recent years, the accommodation of rare-earth elements in phosphate-based hosts has been widely studied in connection with the luminescent properties they exhibit. The crystallographic properties of phosphates favor this doping. Phosphates have a lot of applications [18,19,20]. They are also widely used in the healthcare industry. These compounds are present naturally in human teeth and bones, and they are used in the manufacturing of medicines for these organs [21,22,23]. They are also used in toothpaste as a polishing agent and to enable the free flow of the paste through a tube. Another important characteristic of phosphates is their prevalence in living organisms. Calcium phosphates are also added to animal feed [20,24,25]. Therefore, we hope that future biocompatibility testing of our best phosphate material will demonstrate its potential for medical applications [19,26].
Calcium phosphate Ca9Y(PO4)7 is also a potentially good matrix for doping lanthanide ions in it to obtain efficient luminescence [27,28,29,30,31]; however, the available scientific literature on this matrix is still quite modest. This material is well suited for doping with lanthanide ions, e.g., because the trivalent lanthanide ions are well matched in structure to yttrium ions in terms of good ionic size and valence match. Ca9Y(PO4)7 also has a sufficiently large energy gap and an appropriate position of the 5d level that allows Stokes and anti-Stokes emission of Pr3+ ions to occur.
In the context of the UVC upconversion, phosphates, despite their high phonon energies [32], which increase the nonradiative multi-phonon relaxation (MPR) rate, can be chosen for the study due to two main advantages. First of all, they possess a wide bandgap that allows for UVC emissions to be observed. Second, some rare-earth doped phosphates also exhibit a significant UV/VIS branching ratio, which can be attributed to small shifts of the parabolas of the 5d vs.4f electronic configuration [17].
The objective of our work was to test the ability of Pr3+-doped Ca9Y(PO4)7 phosphate (CYPO) to demonstrate UVC upconversion emission when excited by a blue light. The structure of Ca9Y(PO4)7 is a derivative of the structure of Ca3(PO4)2. The prevalence of calcium phosphates in the human body makes the derivatives of Ca3(PO4)2 highly biocompatible. The undoped CYPO matrix does not exhibit intrinsic luminescence, which could interfere with the luminescence of possible rare-earth activator ions. Thus, Ca9Y(PO4)7 doped with Pr3+ ions is a promising candidate to obtain the emission in the UVC range induced by the upconversion processes. This feature can later be used in the production of UVC LEDs to destroy viruses and bacteria. The obtained phosphors possess remarkable luminescent properties and high chemical stability and are relatively cheap.
Similar matrices of calcium phosphates were investigated with several doped lanthanides like Eu3+, Dy3+, Pr3+, and Gd3+ ions [16,17,27,31,33,34,35,36,37]. These compounds possess interesting crystal structures and, thus, are often investigated by doping lanthanide ions, which exhibit various spectroscopic properties, which mainly depend on the different dopants and other factors, like crystal symmetry, temperature, or pressure. Among the suggested applications, Ca9Y(PO4)7 doped with Eu3+, Tm3+, and Dy3+ may be promising candidates for light-emitting diodes [27,29]. Additionally, the Ca9Y(PO4)7:Tm3+,Yb3+ phosphor has potential application as an efficient luminescent thermometer in the temperature range of 323–823 K [30]. Based on the structure of Ca3(PO4)2, the structure of these phosphates was also studied with the direct entry of doped rare-earth ions into the structure as Ca9RE(PO4)7 (where RE is a rare-earth ion, in this case, Nd, Gd, or Dy) [38].
F. Piccinelli et al. investigated a similar whitlockite-like crystal structure of Ca9Lu(PO4)7 phosphate, also doped with Pr3+ ions. In this case, four crystal sites can be occupied by RE3+ ions, but, e.g., Eu3+ or Pr3+ doped ions prefer to occupy two and three sites, respectively [35]. Camardello et al. studied Ca9R3+(PO4)7 (R3+ = Al, Ga, Sc, Lu, Y, Gd, La) phosphates doped with Ce3+ and Pr3+ ions [17]. They discovered that the optical properties are independent of the RE3+ cations, which was connected with the preferential occupation of the eight-coordinated calcium site. Chien-Hao Huang et al. showed the UV luminescence of Ca9Y(PO4)7, while doped with 0.2% Pr3+, under excitation at 172 nm. In this work, the authors claim that Pr3+ ions are expected to occupy the Y3+ ions sites [28].
Despite several works describing the properties of Ca9Y(PO4)7:Pr3+, none of them present the luminescent analysis of Ca9Y(PO4)7 for various concentrations of doped praseodymium in such a broad way. In this work, we present the spectroscopic study of Ca9Y(PO4)7 polycrystals doped with Pr3+ ions, with the results of the UVC upconversion emission discovered for the first time in this crystal host.
The investigated phosphors are suitable as materials that are more compact and less energy-consuming light sources because they are polycrystalline powder materials; thus, a small amount of them is enough to obtain the appropriate effect. Moreover, the fact that these materials exhibit luminescence in the UVC range, not only through Stokes emission but also through anti-Stokes emission, significantly reduces the potential costs of such a device, as this emission could be excited by radiation in the visible range matched to the wavelength of commonly used blue LEDs.
2. Results and Discussion
2.1. Structure Analysis
Calcium yttrium heptaphosphate Ca9Y(PO4)7 (ICSD: 236034) possesses a crystallographic structure in which there are as many as seven crystallographic positions (sites) for cations, four for Ca2+ ions and three for Y3+. The space group is trigonal R3c (161). The cell parameters are a = 10.4400(5) Å c = 37.3646(4) Å, a/b = 1.0000 b/c = 0.2794 c/a = 3.5790; V = 3526.89(34) Å3 and Z = 6 [39]. Due to the presence of yttrium (Y3+) ions, which both in terms of charge matching and ionic size are similar to doped lanthanide ions, they are located in the crystal structure without creating defects compensating for the electric charge. The visualization of the unit cell of the measured crystal is shown in Figure 1.
Calcium(II) ions in the CYPO crystal structure can be found in four sites, while yttrium(III) ions, and praseodymium ions, can be found in three crystallographic positions. These positions are shared with calcium ions. Detailed metal–ligand distance data can be found in Table S1. There are four crystallographic positions for calcium in the investigated structure, three of which are related to the positions of yttrium. Large Pr3+ ions should preferentially occupy the eight-coordinated site in this structure [17]. Y3+ ions are located in three crystallographic positions, two with eight coordinations, which have metal–oxygen distances very close to each other, and one position with a coordination of six. Therefore, the doped Pr3+ ions would mainly occupy the Y1 and Y2 sites which are coordinated by eight oxygen ligands.
Figure 2 shows the XRD spectra of pure and Pr3+ doped CYPO. All patterns could be indexed based on the trigonal structure SG: R3cH (ICSD No. 236034). Some reflections in the XRD patterns belong to the Y2O3 (ICSD 96-720-5918) impurity and are marked in Figure 2 by asterisks. The calculated lattice parameters of the samples are presented in Table 1. The results showed that the host lattice slightly expands with increasing activator concentration in the nanoparticles (see Table 1) because the ionic radii of Pr3+ are larger than that of Y3+ [40].
According to the diffraction data, the size of the crystallites (D) was estimated using the Scherrer equation [41]:
where K is the shape constant equal to 0.9, λ is the wavelength of the incident X-ray (1.54056 Å), θ is the Bragg angle, and β is the Full Width at Half Maximum (FWHM) of the diffraction peak. The crystallite size of the Ca9Y1-xPrx(PO4)7 samples, estimated by the Scherrer formula, does not depend on the concentration of the activator (Table 1). Since the crystallite size can be affected by lattice deformation and lattice defects, the size and the strain were estimated using the Williamson–Hall (W–H) plot method [42,43] according to the following formula:
where ε is the strain. Linear fitting of dates obtained by plotting βcosθ (x-axis) and 4εsinθ (y-axis) was used to estimate crystallite size from y-axis intersections and strain from slope (Figure S1). The strains and the crystallite size values are included in Table 1. Measurements by the W–H methods revealed that the crystallite size of the powders increases continuously with increasing Pr3+ concentration. It should be noted that the crystallite sizes calculated using the Scherrer method are somewhat smaller than those calculated from the W–H plot method. This can be explained by the fact that the Scherrer method does not take into account any particle agglomerations.
D = Kλ/β cosθ
2.2. Optical Characterization
The refractive index of CYPO crystal together with the energy bandgap Eg, was estimated using the method based on the chemical formula [44,45]. Calculated results are as follows: the refractive index n = 1.67 and Eg between 6.22 and 6.55 eV. The obtained relatively high value of Eg makes this crystal suitable for applications, especially as a phosphor in the UV range.
Absorption spectra of the investigated polycrystals doped with Pr3+ ions show the absorption peaks characteristic of the used dopants. Figure S2 shows transitions from the ground 3H4 energy level to the next excited states of the praseodymium(III). The center of gravity of the 1D2 absorption level is at 596 nm (16,779 cm−1), with the whole band ranging from about 570 to 620 nm, with a maximum observed at 591 nm (16,920 cm−1).
2.3. Phonon Properties
The primitive unit cell of the Ca9Y(PO4)7 R3c structure is composed of 90 atoms having 270 degrees of freedom (45A1 + 45A2 + 90E). According to the factor group analysis, 267 of them (45A1 + 45A2 + 90E) are optical modes, whereas 3 are acoustic ones (A1 + E). Because the 45A2 modes are silent and the structure is polar, the remaining 44A1 and 89E symmetry modes are both IR- and Raman-active. As a result, 133 IR and Raman bands are expected.
Figure 3 demonstrates the IR transmittance and Raman spectra measured for the representative sample containing 1 mol% of Pr3+ ions. The registered spectra are very similar to previously reported data for the Ca9Y(PO4)7 R3c structure and other similar compounds, i.e., Ca9Bi(PO4)7 [46], Ca9RE(PO4)7 (RE = La, Pr, Nd, Eu, Gd, Dy, Tm, Yb) [47], and Ca9Y(PO4)7(1−x)(VO4)7x [48]. The Raman spectrum of undoped Ca9Y(PO4)7, previously reported by Zhang et al., shows the presence of Raman bands at 404, 440, 610, 945, and 971 cm−1 [48]. Our studies indicate that the corresponding Raman bands are upshifted by 1–3 cm−1, which can be attributed to different methods of synthesis and/or the presence of heavier Pr3+ ions. The IR spectrum of Ca9Y(PO4)7, to the best of our knowledge, has not been reported so far.
All the observed IR and Raman bands can be divided into internal vibrations associated with phosphate ions and lattice modes. Based on the literature data [47,49,50], they were assigned as follows: 377–557 cm−1 to the symmetric bending modes (δa), 590–636 cm−1 to the antisymmetric bending modes (δas), 925–973 cm−1 to the symmetric stretching modes (νs), and 1001–1125 cm−1 to the antisymmetric stretching modes (δas) of the deformed tetrahedral phosphate ions. All Raman bands below 332 cm−1 were assigned to the lattice modes, which included the translational and vibrational modes of orthophosphate ions, as well as translations of Ca2+ and Y3+/Pr3+.
2.4. Emission in the UVC Range
Measurements in the UVC range were carried out using a deuterium lamp and the McPherson spectrometer. Figure 4 and Figure S3 present the excitation and emission spectra of CYPO:0.5%Pr3+ polycrystals, which correspond to the 4f2↔4f15d1 interconfigurational optical transitions.
The excitation band monitored at 275 nm decomposed into the sum of Gaussian bands centered at 54,146 cm−1, 50,473 cm−1, 47,103 cm−1, and 44,782 cm−1 (Figure 4a). The emission spectra excited at 196 nm were deconvoluted into Gaussian components centered at 42,221 cm−1, 40,532 cm−1, and 36,331 cm−1 (Figure 4b). Based on the excitation and emission spectra, the Stokes shift (ΔS) was estimated by comparing the position of the lowest energy absorption maxima and the position of the highest energy emission maxima. The Stokes shift calculated for CYPO:0.5% Pr3+ polycrystals is 2561 cm−1. Notably, this value is nearly 1000 cm−1 larger than the Stokes shift reported for the Ca9Y(PO4)7:1% Pr3+ sample in the work of [17]. This is mainly caused by differences in the excitation spectrum, which for that publication is slightly wider in the lower energy range. The observed difference may be due to the differences in the sample synthesis and spectrophotometer sensitivity. Another explanation may be due to different crystallite sizes, given the difference in annealing temperatures between samples. According to this [17] work, efficient Pr3+ interconfigurational emission transitions of this compound may also be due to the fact that the Stokes shift is (like in our case) less than about 3300 cm−1, the 4f15d1-4f2 radiative transition dominates over the nonradiative relaxation from the 4f15d1 to the 4f2 levels of Pr3+ ions [16,17].
Interconfigurational transitions are allowed by Laporte’s selection rule [51,52,53] and in this case, in the comparison to the result of the luminescence decay times, the luminescence intensity increases with the addition of Pr3+, so that the number of emission centers responsible for this luminescence increases. The obtained emission in the UVC range is well matched to the radiation, which is characterized by disinfecting properties, eliminating viruses and bacteria.
Figure 5 reveals the presence of at least two distinct Pr3+ sites. Excitation of Ca9Y0.995 Pr0.005(PO4)7 at shorter wavelengths, specifically 196 nm, activates all Pr3+ ions in the host, while excitation of Ca9Y0.99 Pr0.01(PO4)7 at 230 nm selectively activates only one class of Pr3+ ions located at the site with a stronger crystal field. The spectrum obtained with the former excitation demonstrates not only strong 4f15d1 → 3HJ + 3F2,3 transitions observed between 220 and 320 nm, but also relatively strong 4f15d1 → 3PJ transition with the peak at 403 nm. Since the 3PJ term is radiatively excited, transitions to 3H4 from 3P0 and 3P1 are also observed. However, under 230 nm excitation, the 4f→4f emission is notably weak, indicating minimal energy transfer from the 5d to 4f electronic configuration. This characteristic is attributed to the low value of the Stokes shift [17], which in our case amounts to 2561 cm−1.
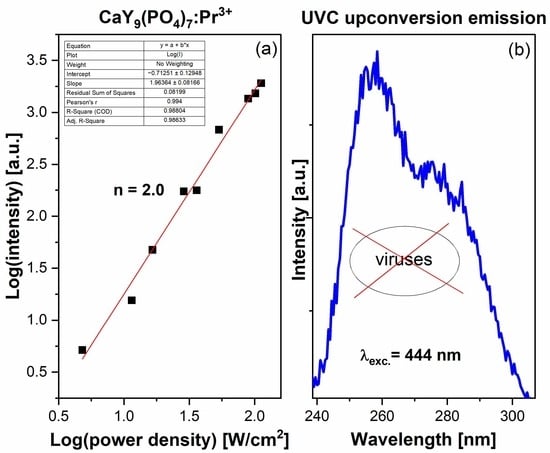
Since the 5d bands are within the range of blue light excitation, upconversion into ultraviolet radiation was observed. The influence of the excitation power “P” of the diode laser (444 nm) on the luminescence intensity “I” of the 5d-4f band in the UVC range was investigated. Detailed data are marked in Figure 6a. The characteristic in the log/log scale is linear and is proportional to I ~ Pn, where n is the number of pump photons required to excite the emitting level [54]. The obtained result of n = 2 suggests that two photons are involved in the upconversion process. Figure 6b presents this anti-Stokes emission spectrum, with laser excitation at 444 nm. The results obtained after integrating the emission area show that most (about 72%) of the obtained UV upconversion emission is in the UVC range. The UVB part, which is less harmful to the viruses, possesses only 28% of the area in the emission spectrum.
For the CYPO powders studied, measurements of luminescence intensity “I” of upconversion and Stokes emissions were performed as a function of Pr3+ concentration “X” (see Figure 7). The intensity of emission could be approximated with such a function I ~Xa, where “a” is the value of an exponent. For initial Pr3+ concentrations (for which so-called concentration quenching does not occur), the UVC upconversion emission was fitted with a quadratic function, while the Stokes emission depends linearly on the Pr3+ concentration there (see inset in Figure 7). The quadratic dependence of UVC emission intensity on Pr3+ concentration indicates the process of energy transfer upconversion (ETU) [54], which occurs in pairs of Pr3+ ions. Please note that for low concentrations, e.g., 0.5% Pr3+ the intensity of upconversion emission is relatively low compared to Stokes luminescence. On the other hand, a sample with a praseodymium ion concentration of 2% has a much weaker Stokes emission (about 20% compared to the most intense sample), while the anti-Stokes emission in the UVC region, although weaker, possesses a 60% intensity of the best CYPO sample (see Figure 7).
2.5. Spectroscopic Properties in the Visible Range
Figure 8 shows both, the excitation and luminescence spectra of CYPO polycrystals doped with Pr3+ ions. The most intense emission comes from the transition from level 1D2. The excitation spectrum in the UVC range, when monitoring the 1D2 → 3H4 transition, was very weak. Three peaks from the transition 3P0 → 3H4 are observed. The most intense is the red luminescence 1D2 → 3H4 and for it, the greatest influence of temperature change is observed. A small emission peak at 530 nm comes from a transition from the 3P1 level, because this level can be populated at room temperature with electrons from the neighboring 3P0 emitting level. The shape of the excitation and luminescence bands is like the emission of Pr3+ ions in similar calcium phosphates, where instead of yttrium (as in this case), aluminum and lutetium ions were present in the crystal matrix [34].
The mechanisms of excitation, luminescence, as well as concentration quenching by cross-relaxation (CR) are as follows. When excitation by a laser diode or xenon lamp by energy matched to the 3P2 praseodymium level, non-radiative transfer of the excitation energy to the 3P0 and 1D2 emitting levels occurs. Then, the emission from these levels to the ground state 3H4 and higher excited states take place. The observed luminescence is also quenched by a non-radiative cross-relaxation process that occurs in ion pairs when ions are close enough to each other according to the following schemes: [1D2, 3H4] → [1G4, 3F4]. When excited in the 3P2 band, the energy is transferred non-radiatively to the nearby 3P0 level, from which luminescence occurs. On the other hand, the emission from the 1D2 level can be populated from the 3P0 level by multi-phonon relaxation due to the high energy of the phonons in the phosphate matrices of around 1200 cm−1 [32].
The energy bandgap law states that if the difference between two energy levels is greater than five times the value of the highest energy phonon in the host medium, the probability of multiphonon relaxation will be negligible. The multiphonon non-radiative transition rates “WNR” can be written using the formula [55,56]:
where p = /hvmax is the number of phonons needed to overcome the ∆E gap, h is the Plank constant, vmax is the highest phonon frequency in the host, and t0 and a are the empirically fitted parameters. The absorption spectrum shows that the energy distance between the 3P0 and 1D2 levels is less than 4000 cm−1; therefore, in the case of this host as well as other phosphates, since p ≈ 3, the probability of multiphonon relaxation will be significant. The cross-relaxation process [3P0, 3H4] → [3H6, 1D2] could also populate the 1D2 level but is much weaker than those from 1D2 because, according to the selection rule, they are spin-forbidden.
WNR = (1/t0)exp(-ap),
The luminescence intensity of the 4f emission decreases with increasing temperature, but it is a slow decrease and stable in the range of temperatures measured up to 540 °C. For the temperature of 150 °C, this intensity is almost 80%, while 50% of the room temperature intensity is visible for the sample only at the temperature of 420 °C, i.e., 693 K (see Figures S4 and S5 in the Supplementary Materials). This proves the very good temperature stability of the measured sample.
The luminescence decay times of the 4f emission are not monoexponential. However, the luminescence decay curve has a similar structure to a single-exponential function, which may indicate, on the one hand, the dominant influence of one of the sites (crystallographic positions), as well as the fact that the doped ions, located mainly in three different crystallographic positions, possess similar luminescence lifetimes (see Figure 9). The integral equation:
was used to calculate the mean value of the luminescence lifetime; thus, all components of the decay curve were averaged. The decay times of the luminescence from the 1D2 level to the 3H4 state are spin-forbidden; therefore, they are much longer than the decay times from the 3P0 level (see results in Table 2).
Concentration quenching is observed quite quickly for Pr3+ ions. A slight reduction in the luminescence decay time from the 3P0 level is visible from the concentration of 0.5% Pr3+, while a slight decrease in the length of the emission decay time for the 1D2 level begins quicker, where this effect is visible also for concentration lower than 0.5%, and it is very clear for the 1% of Pr3+. For the measured calcium phosphate polycrystals, the cross-relaxation process, as mentioned above, quenches the luminescence, and the multiphonon relaxation from the 1D2 level is less effective since the energy distance the lower 1G4 is above 7000 cm−1 and overt than five phonons must be involved.
3. Experimental
3.1. Synthesis
Ca9Y1-xPrx(PO4)7 polycrystals with the concentration of Pr3+ (0.01; 0.1; 0.5; 1.0; 1.5; 2.0 mol%) were synthesized by solid-state reaction technique. The reagents CaCO3 (99.95%, Alfa Aesar, Haverhill, MA, USA), Y2O3 (99.99%, Acroc Organics, Geel, Belgium), Pr2O3 (99.9%, Chem PUR, Karlsruhe, Germany), NH4H2PO4 (99.999%, Acros Organics) were used as precursors. All precursors were weighed in the required proportion, placed in an agate mortar, and thoroughly ground. Then, annealing was carried out at a temperature of 700 °C for 2 h and then at a temperature of 1100 °C for 4 h. After each stage of annealing, the sample was ground again in an agate mortar.
3.2. Measurements
The X-ray powder diffraction (XRD) measurements were performed using an X’Pert PRO X-ray diffractometer (Panalytical, Malvern, UK). The reflectance absorption spectra were recorded using a Cary 5000 UV-VIS-NIR spectrophotometer. Pure Al2O3 powder was used as the baseline for spectrum correction. The excitation and emission spectra were measured using an FLS1000 fluorescence spectrometer from Edinburgh Instruments (Livingston, UK) equipped with a 450 W xenon lamp.
For the measurement of emission spectra, while using a xenon lamp with an excitation wavelength at 230 nm, the CYPO:Pr3+ polycrystalline powder was placed in a special holder with lithium fluoride (LiF) glass, which has high transparency in this area, and is better suited for measurements in the UVC range than a quartz tube, which may interfere with the measurement results of samples. The spectra taken using an FLS1000 spectrometer were automatically corrected to avoid the influence of the monochromator efficiency and the spectral response of the detector. For the temperature-dependent emission spectra, the Hamamatsu PMA-12 detector with Linkam THMS 600 Heating/Freezing Stage and laser diode at 450 nm were used. Decay time profiles were provided by using a Continuum Surelite I Optical Parametric Oscillator (OPO) pumped with a Nd:YAG laser. The UVC measurements were performed using a VUV McPherson spectrometer (McPherson, Chelmsford, MA, USA) equipped with a Czerny–Turner monochromator and a 150 W deuterium lamp. The upconversion emission was recorded on the McPherson spectrometer, using the excitation laser line at 444 nm focused on the area of 0.75 mm2 and corrected for the used filter characteristics.
The Raman spectrum was collected with a Renishaw inVia Raman spectrometer (Renishaw, Wotton-under-Edge, UK) equipped with a confocal DM2500 Leica optical microscope and an Ar-ion laser operating at 514.5 nm. The mid-IR ATR (attenuated total reflection) spectrum was measured using a Nicolet iS50 FT-IR spectrometer (Thermo Fisher Scientific, Waltham, MA, USA) equipped with an ATR accessory with a diamond crystal.
4. Conclusions
Ca9Y(PO4)7 has proven to be an excellent UVC phosphor when excited via the 5d bands, but it was also shown that despite the relatively short lifetime of the 3P0 level. It is likewise possible to obtain UVC emission when excited with blue light. According to our knowledge, this is the first paper describing the results of the UVC upconversion emission for this compound doped with the praseodymium(III) ions. The crystalline structures have been confirmed with the XRD measurement. The average crystallite sizes are in the nanoscale. Investigation in absorption, excitation, IR transmittance, Raman, and emission spectra, as well as the emission decay time profiles, were presented. Spectroscopic properties depend on the percent of doped rare-earth ions. The Pr3+ main luminescence of the 4f electronic configuration comes from the 1D2 multiplets. A shortening of luminescence decay times with increasing concentrations of Pr3+ doped ions was noticed. The emission wavelength range, predominantly falling within the UVC limit, coupled with the minimal emission intensity in the visible range upon direct excitation of the 4f15d1 Pr3+ levels, renders this material a promising UVC phosphor. Consequently, further investigation into CYPO: Pr3+ as a scintillator for combating X-ray-resistant tumors is warranted. The future paths of our investigation will be focused on X-ray excitation of the modified CYPO host by exchange of Y with a heavier element like Lu, which will ensure a higher absorption cross-section.
However, the observed anti-Stokes emission in CYPO: Pr3+ appears to be less efficient compared to other established upconverters such as Y2SiO5: Pr3+, for example. It is possible that additional modifications to the synthesis and sample composition by exchange of the host cations may enhance the upconversion effect.
Supplementary Materials
The following supporting information can be downloaded at: https://www.mdpi.com/article/10.3390/molecules29092084/s1, Table S1: Distances between yttrium sites and oxygen ligands in Ca9Y(PO4)7; Figure S1: Plots of βcosθ versus 4sinθ for Ca9Y1-xPrx(PO4)7 (0 ≤ x ≤ 0.02) nanoparticles; Figure S2: Absorption spectra of Ca9Y0.085Pr0.015(PO4)7; Figure S3: Excitation and emission spectra of Ca9Y0.995Pr0.005(PO4)7 polycrystals in the UVC range; Figure S4: Visualization of the temperature dependence luminescence intensity of Ca9Y0.995Pr0.005(PO4)7 for the selected temperatures; Figure S5: Quenching of the luminescence intensity of Ca9Y0.995Pr0.005(PO4)7 in a function of temperature.
Author Contributions
Conceptualization, P.J.D. and K.L.; methodology, K.L., N.R., O.B., R.L. and P.Z.; validation, P.J.D., K.L. and N.R.; formal analysis, K.L., P.J.D. and N.R.; investigation, K.L., N.R., R.L., P.Z. and P.J.D.; resources, O.B., N.R. and P.J.D.; data curation, P.J.D. and K.L.; writing—original draft preparation, K.L., N.R. and P.J.D.; writing—review and editing, K.L., P.J.D., N.R., O.B. and P.Z; visualization, K.L., N.R. and P.Z.; supervision, P.J.D. and K.L.; project administration, P.J.D. and K.L.; funding acquisition, P.J.D. All authors have read and agreed to the published version of the manuscript.
Funding
This research was funded by the National Science Centre (Poland), project OPUS number: 2021/41/B/ST5/03792.
Institutional Review Board Statement
Not applicable.
Informed Consent Statement
Not applicable.
Data Availability Statement
Data are contained within the article.
Conflicts of Interest
The authors declare no conflicts of interest.
References
- Cates, E.L.; Wilkinson, A.P.; Kim, J.-H. Visible-to-UVC upconversion efficiency and mechanisms of Lu7O6F9:Pr3+ and Y2SiO5:Pr3+ ceramics. J. Lumin. 2015, 160, 202–209. [Google Scholar] [CrossRef]
- Kowalski, W. UV Surface Disinfection. In Ultraviolet Germicidal Irradiation Handbook: UVGI for Air and Surface Disinfection; Kowalski, W., Ed.; Springer: Berlin/Heidelberg, Germany, 2009; pp. 233–254. [Google Scholar] [CrossRef]
- Yang, J.-H.; Wu, U.-I.; Tai, H.-M.; Sheng, W.-H. Effectiveness of an ultraviolet-C disinfection system for reduction of healthcare-associated pathogens. J. Microbiol. Immunol. Infect. 2019, 52, 487–493. [Google Scholar] [CrossRef]
- Browne, K. Brought to Light: How Ultraviolet Disinfection Can Prevent the Nosocomial Transmission of COVID-19 and Other Infectious Diseases. Appl. Microbiol. 2021, 1, 537–556. [Google Scholar] [CrossRef]
- Rutala, W.A.; Donskey, C.J.; Weber, D.J. Disinfection and sterilization: New technologies. Am. J. Infect. Control 2023, 51, A13–A21. [Google Scholar] [CrossRef]
- Ramakrishna, G.; Nagabhushana, H.; Basavaraj, R.B.; Naik, R.; Sharma, S.C.; Prasad, B.D.; Premkumar, H.B.; Anantharaju, K.S.; Prashantha, S.C. Calotropis gigantean-assisted YSO:Pr3+ nanophosphors: Near-ultraviolet (NUV) photoluminescence and J-O analysis for solid-state lighting solutions. Inorg. Nano-Met. Chem. 2017, 47, 1234–1242. [Google Scholar] [CrossRef]
- Drozdowski, W.; Dorenbos, P.; Drozdowska, R.; Bos, A.J.J.; Poolton, N.R.J.; Tonelli, M.; Alshourbagy, M. Effect of Electron Traps on Scintillation of Praseodymium Activated Lu3Al5O12. IEEE Trans. Nucl. Sci. 2009, 56, 320–327. [Google Scholar] [CrossRef]
- Srivastava, A.M. Aspects of Pr3+ luminescence in solids. J. Lumin. 2016, 169, 445–449. [Google Scholar] [CrossRef]
- Ozen, G.; Collins, J.; Bettinelli, M.; Di Bartolo, B. Luminescence of Y3AL5O12 nano-particles doped with praseodymium ions. Opt. Mater. 2013, 35, 1360–1365. [Google Scholar] [CrossRef]
- Manzani, D.; Pabœuf, D.; Ribeiro, S.J.L.; Goldner, P.; Bretenaker, F. Orange emission in Pr3+-doped fluoroindate glasses. Opt. Mater. 2013, 35, 383–386. [Google Scholar] [CrossRef]
- Runowski, M.; Woźny, P.; Martín, I.R.; Lavín, V.; Lis, S. Praseodymium doped YF3:Pr3+ nanoparticles as optical thermometer based on luminescence intensity ratio (LIR)—Studies in visible and NIR range. J. Lumin. 2019, 214, 116571. [Google Scholar] [CrossRef]
- Dereń, P.J.; Lemański, K. On tuning the spectroscopic properties of LaAlO3:Pr3+ nanocrystallites. J. Lumin. 2011, 131, 445–448. [Google Scholar] [CrossRef]
- Lemański, K.; Dereń, P.J. Luminescent properties of LaAlO3 nanocrystals, doped with Pr3+ and Yb3+ ions. J. Lumin. 2014, 146, 239–242. [Google Scholar] [CrossRef]
- Lemański, K.; Bondzior, B.; Szymański, D.; Dereń, P.J. Spectroscopic properties of GdxLa1−xAlO3 nanocrystals doped with Pr3+ ions. New J. Chem. 2019, 43, 6242–6248. [Google Scholar] [CrossRef]
- Srivastava, A.M.; Setlur, A.A.; Comanzo, H.A.; Hannah, M.E.; Schmidt, P.A.; Happek, U. Luminescence from the Pr3+ 4f15d1 and 1S0 states in LiLaP4O12. J. Lumin. 2009, 129, 126–129. [Google Scholar] [CrossRef]
- Srivastava, A.M.; Jennings, M.; Collins, J. The interconfigurational (4f15d1→4f2) luminescence of Pr3+ in LuPO4, K3Lu(PO4)2 and LiLuSiO4. Opt. Mater. 2012, 34, 1347–1352. [Google Scholar] [CrossRef]
- Camardello, S.J.; Toscano, P.J.; Srivastava, A.M. ON the interconfigurational 4fn↔4fn−1 5d1 optical transitions of Ce3+ and Pr3+ in Ca9R3+(PO4)7[R3+ = Al, Ga, Sc, Lu, Y, Gd, La]. J. Lumin. 2016, 176, 363–366. [Google Scholar] [CrossRef]
- Acton, Q.A. Phosphates—Advances in Research and Application: 2013 Edition; ScholarlyEditions: Atlanta, GA, USA, 2013; Available online: https://books.google.pl/books?id=1EudM1a_RJkC (accessed on 8 January 2024).
- Dorozhkin, S.V.; Epple, M. Biological and Medical Significance of Calcium Phosphates. Angew. Chem. Int. Ed. 2002, 41, 3130–3146. [Google Scholar] [CrossRef]
- Woyengo, T.A.; Nørgaard, J.V.; van der Heide, M.E.; Nielsen, T.S. Calcium and phosphorus digestibility in rock- and bone-derived calcium phosphates for pigs and poultry: A review. Anim. Feed Sci. Technol. 2022, 294, 115509. [Google Scholar] [CrossRef]
- Eliaz, N.; Metoki, N. Calcium Phosphate Bioceramics: A Review of Their History, Structure, Properties, Coating Technologies and Biomedical Applications. Materials 2017, 10, 334. [Google Scholar] [CrossRef]
- Canillas, M.; Pena, P.; de Aza, A.H.; Rodríguez, M.A. Calcium phosphates for biomedical applications. Boletín Soc. Española Cerámica Vidr. 2017, 56, 91–112. [Google Scholar] [CrossRef]
- Kalbarczyk, M.; Szcześ, A. Potential biomedical application of calcium phosphates obtained using eggshells as a biosource of calcium at different initial pH values. Ceram. Int. 2021, 47, 33687–33696. [Google Scholar] [CrossRef]
- Lima, F.; Fernandes, J.; Oliveira, E.; Fronzaglia, G.; Kahn, H. Laboratory evaluations of feed-grade and agricultural-grade phosphates. Poult. Sci. 1999, 78, 1717–1728. [Google Scholar] [CrossRef]
- Lima, F.R.; Mendonça, C.X.; Alvarez, J.C.; Ratti, G.; Lenharo, S.L.R.; Kahn, H.; Garzillo, J.M.F. Chemical and Physical Evaluations of Commercial Dicalcium Phosphates as Sources of Phosphorus in Animal Nutrition. Poult. Sci. 1995, 74, 1659–1670. [Google Scholar] [CrossRef]
- Habraken, W.; Habibovic, P.; Epple, M.; Bohner, M. Calcium phosphates in biomedical applications: Materials for the future? Mater. Today 2016, 19, 69–87. [Google Scholar] [CrossRef]
- Dahiya, H.; Dalal, M.; Singh, A.; Siwach, A.; Dahiya, M.; Nain, S.; Taxak, V.B.; Khatkar, S.P.; Kumar, D. Spectroscopic characteristics of Eu3+-activated Ca9Y(PO4)7 nanophosphors in Judd–Ofelt framework. Solid State Sci. 2020, 108, 106341. [Google Scholar] [CrossRef]
- Huang, C.-H.; Chen, T.-M.; Cheng, B.-M. Luminescence Investigation on Ultraviolet-Emitting Rare-Earth-Doped Phosphors Using Synchrotron Radiation. Inorg. Chem. 2011, 50, 6552–6556. [Google Scholar] [CrossRef]
- Wu, X.; Liang, Y.; Chen, R.; Liu, M.; Cheng, Z. Photoluminescence properties of emission-tunable Ca9Y(PO4)7: Tm3+, Dy3+ phosphor for white light emitting diodes. Mater. Chem. Phys. 2011, 129, 1058–1062. [Google Scholar] [CrossRef]
- Zhuang, Y.; Wang, D.; Yang, Z. Upconversion luminescence and optical thermometry based on non-thermally-coupled levels of Ca9Y(PO4)7: Tm3+, Yb3+ phosphor. Opt. Mater. 2022, 126, 112167. [Google Scholar] [CrossRef]
- Górecka, N.; Szczodrowski, K.; Lazarowska, A.; Barzowska, J.; Michalik, D.; Grinberg, M. The influence of charge compensation defects on the spectroscopic properties of europium doped Ca9Y(PO4)7. RSC Adv. 2017, 7, 40549–40557. [Google Scholar] [CrossRef]
- Gao, G.; Turshatov, A.; Howard, I.A.; Busko, D.; Joseph, R.; Hudry, D.; Richards, B.S. Up-Conversion Fluorescent Labels for Plastic Recycling: A Review. Adv. Sustain. Syst. 2017, 1, 1600033. [Google Scholar] [CrossRef]
- Ueda, K.; Oya, A.; Nagashima, S.; Ogata, T.; Honma, T.; Omata, T. Site-Dependent Luminescence from Pr3+ in Double-Perovskite-Type Alkaline Earth Lanthanum Tantalates. J. Phys. Chem. C 2023, 127, 8833–8839. [Google Scholar] [CrossRef]
- Watras, A.; Carrasco, I.; Pazik, R.; Wiglusz, R.J.; Piccinelli, F.; Bettinelli, M.; Deren, P.J. Structural and spectroscopic features of Ca9M(PO4)7 (M = Al3+, Lu3+) whitlockites doped with Pr3+ ions. J. Alloys Compd. 2016, 672, 45–51. [Google Scholar] [CrossRef]
- Piccinelli, F.; Trevisani, M.; Plaisier, J.R.; Bettinelli, M. Structural study of Yb3+, Eu3+ and Pr3+ doped Ca9Lu(PO4)7. J. Rare Earths 2015, 33, 977–982. [Google Scholar] [CrossRef]
- Sahu, M.K.; Mula, J. White light emitting thermally stable bismuth phosphate phosphor Ca3Bi(PO4)3:Dy3+ for solid-state lighting applications. J. Am. Ceram. Soc. 2019, 102, 6087–6099. [Google Scholar] [CrossRef]
- Pązik, R.; Zawisza, K.; Watras, A.; Maleszka-Bagińska, K.; Boutinaud, P.; Mahiou, R.; Dereń, P.J. Thermal quenching mechanisms of the Eu3+ luminescence in Ca9Al(PO4)7 obtained by citric route. Mater. Res. Bull. 2013, 48, 337–342. [Google Scholar] [CrossRef]
- Paterlini, V.; El Khouri, A.; Bettinelli, M.; Trucchi, D.M.; Capitelli, F. Spectroscopic and Structural Properties of β-Tricalcium Phosphates Ca9RE(PO4)7 (RE = Nd, Gd, Dy). Crystals 2021, 11, 1269. [Google Scholar] [CrossRef]
- Liu, S.; Liang, Y.; Zhu, Y.; Li, H.; Cai, Y.; Tu, D. Full visible spectra emission introduced by crystal-site engineering in β-Ca3(PO4)2-type solid solution phosphors for high quality white light emitting diodes application. Chem. Eng. J. 2019, 375, 121976. [Google Scholar] [CrossRef]
- Shannon, R.D. Revised Effective Ionic Radii and Systematic Studies of Interatomie Distances in Halides and Chaleogenides. Acta Cryst. 1976, 32, 751–767. [Google Scholar] [CrossRef]
- Scherrer, P. Bestimmung der Grösse und der inneren Struktur von Kolloidteilchen mittels Röntgenstrahlen, Nachrichten von Der Gesellschaft Der Wissenschaften Zu Göttingen. Math.-Phys. Kl. 1918, 1918, 98–100. [Google Scholar]
- Williamson, G.K.; Hall, W.H. X-ray line broadening from filed aluminium and wolfram. Acta Metall. 1953, 1, 22–31. [Google Scholar] [CrossRef]
- Rebrova, N.; Zdeb, P.; Lemański, K.; Macalik, B.; Bezkrovnyi, O.; Dereń, P.J. Upconversion Luminescence Proper-ties of Pr3+-Doped BaYF 5 Nanoparticles Prepared by Microwave Hydrothermal Method. Inorg. Chem. 2024, 63, 3028–3036. [Google Scholar] [CrossRef]
- Lemański, K.; Walerczyk, W.; Dereń, P.J. Luminescent properties of europium ions in CaAl2SiO6. J. Alloys Compd. 2016, 672, 595–599. [Google Scholar] [CrossRef]
- Watras, A.; Boutinaud, P.; Pązik, R.; Dereń, P.J. Luminescence—Structure relationships in MYP2O7:Eu3+ (M=K, Rb, Cs). J. Lumin. 2016, 175, 249–254. [Google Scholar] [CrossRef]
- Li, K.; Shang, M.; Zhang, Y.; Fan, J.; Lian, H.; Lin, J. Photoluminescence properties of single-component white-emitting Ca9Bi(PO4)7: Ce3+, Tb3+, Mn2+ phosphors for UV LEDs. J. Mater. Chem. C Mater. 2015, 3, 7096–7104. [Google Scholar] [CrossRef]
- Asmaa, E.K.; Mohammed, E.; Giancarlo, D.V.; Armida, S.; Rosanna, R.; Rossi, M.; Francesco, C. Synthesis, structure reTnement and vibrational spectroscopy of new rare-earth tricalcium phosphates Ca9RE(PO4)7 (RE = La, Pr, Nd, Eu, Gd, Dy, Tm, Yb). Ceram. Int. 2017, 43, 15645–15653. [Google Scholar]
- Zhang, Z.Z.; Zhang, F.; Li, G.Q.; Zhang, J.; Zhang, W.F. Red-emitting phosphor series: Ca9Y(PO4)7(1-x)(VO4)7x: Eu3+(x = 0− 1) with improved luminescence thermal stability by anionic polyhedron substitution. J. Mater. Sci. Mater. Electron. 2019, 30, 8838–8846. [Google Scholar] [CrossRef]
- Godlewska, P.; Matraszek, A.; Macalik, L.; Hermanowicz, K.; Ptak, M.; Tomaszewski, P.E.; Hanuza, J.; Szczygieł, I. Spectroscopic and structural properties of Na3RE(PO4)2:Yb orthophosphates synthesised by hydrothermal method (RE = Y, Gd). J. Alloys Compd. 2015, 628, 199–207. [Google Scholar] [CrossRef]
- Kizalaite, A.; Grigoraviciute-Puroniene, I.; Asuigui, D.R.C.; Stoll, S.L.; Cho, S.H.; Sekino, T.; Kareiva, A.; Zarkov, A. Dissolution–precipitation synthesis and characterization of zinc whitlockite with variable metal content. ACS Biomater. Sci. Eng. 2021, 7, 3586–3593. [Google Scholar] [CrossRef] [PubMed]
- Laporte, O.; Meggers, W.F. Some Rules of Spectral Structure*. J. Opt. Soc. Am. 1925, 11, 459–463. [Google Scholar] [CrossRef]
- Walsh, B.M. Judd-Ofelt theory: Principles and practices. In Advances in Spectroscopy for Lasers and Sensing; Springer: Berlin/Heidelberg, Germany, 2006; pp. 403–433. [Google Scholar]
- Bünzli, J.G. Rising Stars in Science and Technology: Luminescent Lanthanide Materials. Eur. J. Inorg. Chem. 2017, 2017, 5058–5063. [Google Scholar] [CrossRef]
- Pollnau, M.; Gamelin, D.R.; Lüthi, S.R.; Güdel, H.U.; Hehlen, M.P. Power dependence of upconversion luminescence in lanthanide and transition-metal-ion systems. Phys. Rev. B 2000, 61, 3337–3346. [Google Scholar] [CrossRef]
- Weber, M.J. Multiphonon Relaxation of Rare-Earth Ions in Yttrium Orthoaluminate. Phys. Rev. B 1973, 8, 54–64. [Google Scholar] [CrossRef]
- Payne, S.A.; Bibeau, C. Picosecond nonradiative processes in neodymium-doped crystals and glasses. J. Lumin. 1998, 79, 143–159. [Google Scholar] [CrossRef]
Figure 1.
Visualization of the Ca9Y(PO4)7 crystal structure.

Figure 2.
X-ray diffraction patterns of Ca9Y1-xPrx(PO4)7:Pr3+ particles and standard reference of Ca9Y(PO4)7. Y2O3 impurity reflections are shown by asterisks.
Figure 2.
X-ray diffraction patterns of Ca9Y1-xPrx(PO4)7:Pr3+ particles and standard reference of Ca9Y(PO4)7. Y2O3 impurity reflections are shown by asterisks.

Figure 3.
Raman (a) and IR (b) spectra of the Ca9Y(PO4)7 sample doped with 1 mol% of Pr3+ ions.

Figure 4.
The room temperature excitation (a) and emission (b) spectra of CYPO:0.5% Pr3+ polycrystals. The spectra are fitted to a sum of Gaussian bands.
Figure 4.
The room temperature excitation (a) and emission (b) spectra of CYPO:0.5% Pr3+ polycrystals. The spectra are fitted to a sum of Gaussian bands.

Figure 5.
The UVC emission spectrum of Ca9Y1-xPrx(PO4)7 polycrystals, at 300 K.

Figure 6.
(a) Power density (per unit area) dependence of the upconversion emission of Ca9Y0.99Pr0.01(PO4)7 polycrystals; (b) The anti-Stokes emission spectra of Ca9Y0.99Pr0.01(PO4)7 polycrystals in the UVC range.
Figure 6.
(a) Power density (per unit area) dependence of the upconversion emission of Ca9Y0.99Pr0.01(PO4)7 polycrystals; (b) The anti-Stokes emission spectra of Ca9Y0.99Pr0.01(PO4)7 polycrystals in the UVC range.

Figure 7.
Relative intensities of the UVC upconversion and Stokes emissions of Ca9Y(PO4)7 polycrystals, for different concentrations of the doped Pr3+ ions. Inset shows the fitted intensity of these emissions.
Figure 7.
Relative intensities of the UVC upconversion and Stokes emissions of Ca9Y(PO4)7 polycrystals, for different concentrations of the doped Pr3+ ions. Inset shows the fitted intensity of these emissions.

Figure 8.
Excitation and emission spectra of Ca9Y0.995Pr0.005(PO4)7 polycrystals.

Figure 9.
The luminescence decay curves of the emitting levels of Pr3+ ions in Ca9Y(PO4)7 polycrystals.
Figure 9.
The luminescence decay curves of the emitting levels of Pr3+ ions in Ca9Y(PO4)7 polycrystals.


Table 1.
Lattice parameters, unit cell volume, and crystallite size of Ca9Y1-xPrx(PO4)7 (0 ≤ x ≤ 0.02) phosphors calculated from XRD data.
Table 1.
Lattice parameters, unit cell volume, and crystallite size of Ca9Y1-xPrx(PO4)7 (0 ≤ x ≤ 0.02) phosphors calculated from XRD data.
| a (Å) | c (Å) | V (Å3) | Scherrer Method Size (nm) | W–H Plot Method | ||
|---|---|---|---|---|---|---|
| Size (nm) | Strain ×10−3 | |||||
| Ca9Y(PO4)7 | 10.4377 | 37.2636 | 3516.16 | 70 | 91 | 6.5 |
| Ca9Y(PO4)7:0.01%Pr3+ | 10.4393 | 37.3020 | 3520.50 | 68 | 94 | 7.8 |
| Ca9Y(PO4)7:0.1%Pr3+ | 10.4415 | 37.3116 | 3522.88 | 67 | 99 | 7.3 |
| Ca9Y(PO4)7:0.5%Pr3+ | 10.4462 | 37.3248 | 3527.30 | 66 | 100 | 7.4 |
| Ca9Y(PO4)7:1%Pr3+ | 10.4472 | 37.3656 | 3531.82 | 72 | 103 | 7.1 |
| Ca9Y(PO4)7:1.5%Pr3+ | 10.4483 | 37.3706 | 3533.06 | 74 | 105 | 5.9 |
| Ca9Y(PO4)7:2%Pr3+ | 10.4553 | 37.381 | 3538.76 | 77 | 106 | 5.4 |
Table 2.
Luminescence lifetimes for Pr3+ ions in Ca9Y(PO4)7 matrices.
| Sample | Lifetime [µs] | |
|---|---|---|
| 3P0 (Pr3+) | 1D2 (Pr3+) | |
| Ca9Y(PO4)7:0.01% Pr3+ | 1 | 211 |
| Ca9Y(PO4)7:0.1% Pr3+ | 1 | 197 |
| Ca9Y(PO4)7:0.5% Pr3+ | 0.9 | 187 |
| Ca9Y(PO4)7:1% Pr3+ | 0.6 | 151 |
Disclaimer/Publisher’s Note: The statements, opinions and data contained in all publications are solely those of the individual author(s) and contributor(s) and not of MDPI and/or the editor(s). MDPI and/or the editor(s) disclaim responsibility for any injury to people or property resulting from any ideas, methods, instructions or products referred to in the content. |
© 2024 by the authors. Licensee MDPI, Basel, Switzerland. This article is an open access article distributed under the terms and conditions of the Creative Commons Attribution (CC BY) license (https://creativecommons.org/licenses/by/4.0/).
Share and Cite
MDPI and ACS Style
Lemański, K.; Bezkrovna, O.; Rebrova, N.; Lisiecki, R.; Zdeb, P.; Dereń, P.J. UVC Stokes and Anti-Stokes Emission of Ca9Y(PO4)7 Polycrystals Doped with Pr3+ Ions. Molecules 2024, 29, 2084. https://doi.org/10.3390/molecules29092084
AMA Style
Lemański K, Bezkrovna O, Rebrova N, Lisiecki R, Zdeb P, Dereń PJ. UVC Stokes and Anti-Stokes Emission of Ca9Y(PO4)7 Polycrystals Doped with Pr3+ Ions. Molecules. 2024; 29(9):2084. https://doi.org/10.3390/molecules29092084
Chicago/Turabian StyleLemański, Karol, Olha Bezkrovna, Nadiia Rebrova, Radosław Lisiecki, Patrycja Zdeb, and Przemysław Jacek Dereń. 2024. "UVC Stokes and Anti-Stokes Emission of Ca9Y(PO4)7 Polycrystals Doped with Pr3+ Ions" Molecules 29, no. 9: 2084. https://doi.org/10.3390/molecules29092084