
Islands’ Tourism Seasonality: A Data Analysis of Mediterranean Islands’ Tourism Comparing Seasonality Indicators (2008–2018)


1
Department of Economics Business and Statistics, University of Palermo Viale delle Scienze, 90128 Palermo, Italy
2
Department of Economics and Business, University of Catania, Palazzo delle Scienze, Corso Italia, 55, 95129 Catania, Italy
*
Author to whom correspondence should be addressed.
Sustainability 2024, 16(9), 3674; https://doi.org/10.3390/su16093674
Submission received: 29 January 2024
/
Revised: 16 April 2024
/
Accepted: 24 April 2024
/
Published: 27 April 2024
(This article belongs to the Special Issue Tourism Sustainability on Islands and the 2030 UN Goals)
Abstract
:Tourism seasonality as a tourist demand concentration in specific seasons is still a big challenge for Mediterranean islands’ tourism policies. Overtourism occurs during high tourist seasons, and undertourism occurs during low tourist seasons, creating undesirable economic, social, and environmental effects on sustainability. However, the imbalance of tourism demand, specifically in fragile territories such as islands, needs specific policies based on scientific evidence. This article examines tourism seasonality dynamics in the Mediterranean islands, thoroughly analysing tourist overnights on island destinations. The adopted methodology uses a set of statistical indicators, such as peak factor intensity, calculated in a time series analysis from 2008 to 2018. The results of this article allow us to understand the importance for the Mediterranean islands to plan a resilient, sustainable, and harmonious tourism policy, using strategies to contain seasonal peaks and creating new tourist demand in the low season months.
1. Introduction
In the European Union, islands have very different geographical, demographic, structural, and economic characteristics. Despite these distinctions, they encounter challenges encompassing the tourism, transport, culture, and environment sectors. While playing a fundamental role in the islands’ economies [1], tourism records a deficient tourist demand in some months [2]. This situation has unavoidable consequences for prices, the labour market, corporate returns [3], the local population, and the environment.
Therefore, the seasonality of tourist demand emerges as a central concern for island destinations, presenting constant challenges for both business and local government [4,5,6,7]. This article aims to deepen an understanding of the complexity of the seasonality of tourism in the Mediterranean islands, examining the trends of the irregular distribution of tourist demand [8]. This article summarises empirical and secondary data to analyse tourist demands in nine island destinations. Through a comparative analysis of critical variables such as population, establishment types, employment, and tourist demand, this research strives to understand trends in tourist demand for the islands.
This study uses statistical indices to facilitate and compare changes in the seasonality of tourist demand from 2008 to 2018. The methodology uses indicators such as the intensity, concentration, peak factor, and utilisation of tourism infrastructure.
By analysing these indicators, this study aims to fully understand tourism dynamics and evaluate trends in different islands to offer insights for strategic planning and decision-making in tourism management in the coming years.
2. Literature Review
Hylleberg [9] defines seasonality as the systematic, though not necessarily regular, change in tourism demand throughout the year. Additionally, the term pertains to variations in overnight stays and arrivals over the year, with significant implications for tourism firms and destinations [10,11,12].
Different researchers have focused on understanding seasonality as a distinct field, aiming to delineate primary dimensions. The Coefficient of Variation [13], Theil index [14,15,16], Atkinson index, and the Gini coefficient [17,18,19] are among the indicators borrowed from inequality literature. Some studies utilise different indices based on maximum and minimum values to assess the robustness of results.
Since Baron’s work in 1975 [20], various sophisticated methods have become available. Tsiotas et al. [21] employed a quantitative approach when studying Cyprus, defining geographical seasonality indicators in sub-regional areas. Butler [10] uses other dimensions to study island seasonality, such as transportation, employment, and entrances to major attractions. Contributions from some authors [7,11] have explored seasonality and its dimensions, employing methodologies that scrutinise both effects and primary causes. Temporary population movements, driven by climatic conditions and public and school holidays, can induce fluctuations in demand or supply within the tourism sector [20]. Climate, as a pivotal attraction factor during specific times of the year, introduces irregularities and fluctuations. Ruggieri [6] shows that seasonality correlates with planning and development decisions. Agius and Briguglio [22] show the causes and impacts of seasonality and its policies in achieving financial, social, and environmental benefits by improving the well-being of local communities. Krabokoukis and Polyzos [23] analyse tourist demand in Mediterranean countries, highlighting a concentration during the summer, mainly due to the closure of school activities and hot temperatures. Significant differences are noted in the tourism seasonality index, tourism patterns, pattern stability, and tourism trends across countries. Countries such as Montenegro, Greece, and Croatia show a high index of tourism seasonality, with Greece having the greatest stability in the tourism distribution model over the years. In contrast, France, Italy, and Spain have lower tourism seasonality, partly due to a strong domestic demand for tourism.
In addition, Martín [24,25] emphasises the need to consider houses owned for rent, as they can affect seasonality values by increasing tourist pressure on territories.
It is crucial to differentiate seasonality from long-term economic cycles and short-term alterations in weekly and daily travel patterns, as emphasised by Kuznets [26]. The annual recurrence and limited duration of oscillations, such as tourist peak seasons, distinguish seasonal variations from other temporal changes in a series.
Seasonality manifests across two macro dimensions: natural forces, such as weather, temperature, and humidity, and institutional factors [27], such as festivals, holiday periods, regular events, and traditional family holidays. According to Butler’s rationale [10], the primary triggers for seasonal peaks, especially in summer, are favourable weather conditions and school holidays. However, the concentration of tourism demand during specific seasons can adversely affect destinations, inducing high tourism pressure, congestion, erosion, and consequences for the local environment, ultimately diminishing service quality, a phenomenon recognised as seasonality loss [28]. The persistence of these dynamics, despite their labour market disadvantages, contributes to the development of a dual local labour market, impacting high- and low-skilled workers differently.
High-skilled workers often secure full-time contracts, acquiring diverse skills throughout their careers. In contrast, low-skilled workers face seasonal contracts, limiting their opportunities for skill enhancement and professional development [29].
This duality poses challenges in recruiting and motivating workers throughout the season, particularly in destinations experiencing significant labour demand spikes in the summer. The potential creation of a labour market equilibrium with high turnover and low productivity, as highlighted by Belau [30], may compromise the long-term competitiveness of the industry.
Baum and Lundtorp [11] underscore the need to measure seasonal variations in economic activities, advocating for the examination of empirical patterns to quantify and compare them. The literature reveals diverse approaches for studying seasonal variation in tourism demand, including the ‘Seasonal Range’, ‘Seasonality Ratio’, and ‘Peak Seasonal Factor’ derived through the moving average approach. Studies also employ metrics like ‘Coefficients of Variability’, ‘Coefficient of Variation’, ‘Concentration Indices’, ‘Amplitude Ratios’, and ‘Similarity Indices’ to assess seasonality acuteness across different regions. At the national level, studies by Wall and Yan [31] utilise monthly ratios and the seasonal index to examine seasonal variations, while others explore hotel capacity utilisation levels [32,33].
This dearth of a unified methodological framework for studying demand fluctuations in territories like islands underscores a crucial gap in the existing literature [34]. With their unique geographical and socio-economic characteristics, islands present distinct challenges and opportunities regarding tourism seasonality [35]. Few studies have comprehensively analysed seasonality performance specific to islands, leaving a critical need for research that delves into their nuanced dynamics [36,37].
Addressing this research gap is essential for several reasons. First and foremost, understanding the intricacies of seasonality on islands is vital for the sustainable development of their tourism industries. Islands often rely heavily on tourism as a primary economic driver, and the adverse effects of seasonality, such as seasonality loss, can have profound and lasting impacts on local economies and communities [38].
Moreover, islands’ distinct features, including limited resources, unique ecosystems, and cultural sensitivity, necessitate a tailored approach to managing seasonality. Sustainability practices that balance economic growth with environmental and cultural preservation are paramount. A well-informed methodological framework for studying seasonality on islands can provide valuable insights for policymakers, businesses, and local communities, guiding them toward strategies that mitigate the negative impacts while maximising the benefits of tourism [39].
In conclusion, this study proposes a comprehensive methodological framework tailored to the unique characteristics of islands, fostering a more nuanced understanding of tourism seasonality, and promoting sustainable development in these distinctive destinations.
3. Mediterranean Islands
Enveloped by the Mediterranean basin [23], the islands constitute a captivating assemblage characterised by diverse landscapes, histories, and dynamic cultures [40]. Every island group introduces distinctive nuances, from Sicily’s extensive coastal expanses to the Greek archipelago. Within this scientific exploration, Table 1 shows the main geographical and demographic characteristics of remarkable entities in the context of the Mediterranean milieu. The selected islands analysed consider the population dimensions, and each island belongs to a specific group (high, medium, and low population), as explained in the methodology. Islands also exhibit differences in administrative categorisation, including island states such as Cyprus.
Even though the European Union does not officially classify Cyprus as an island due to the presence of a European capital, we include it in the study because of its performance and challenges related to its island status, similar to the officially recognised islands. The Mediterranean islands vary in area, population, geography, and climate.
Sicily and Sardinia experience a Mediterranean climate characterised by mild winters, scorching summers with southerly winds from Africa along the coasts, and quasi-continental inland climates featuring cold winters and frequent rainfall. Cyprus, the third-largest Mediterranean island, also boasts a Mediterranean climate with sunny summers, mild winters, and limited rainfall. Inland areas receive heavy rainfall between November and February. Other islands, including Crete, the Balearic Islands, the Northern Aegean Islands, the Ionian Islands, and the Southern Aegean Islands, all share a Mediterranean climate characterised by warm and dry summers with temperatures around 30 °C (86 °F) in July and August. Winters are milder than in mainland Greece, with temperatures rarely dropping below ten °C (50 °F).
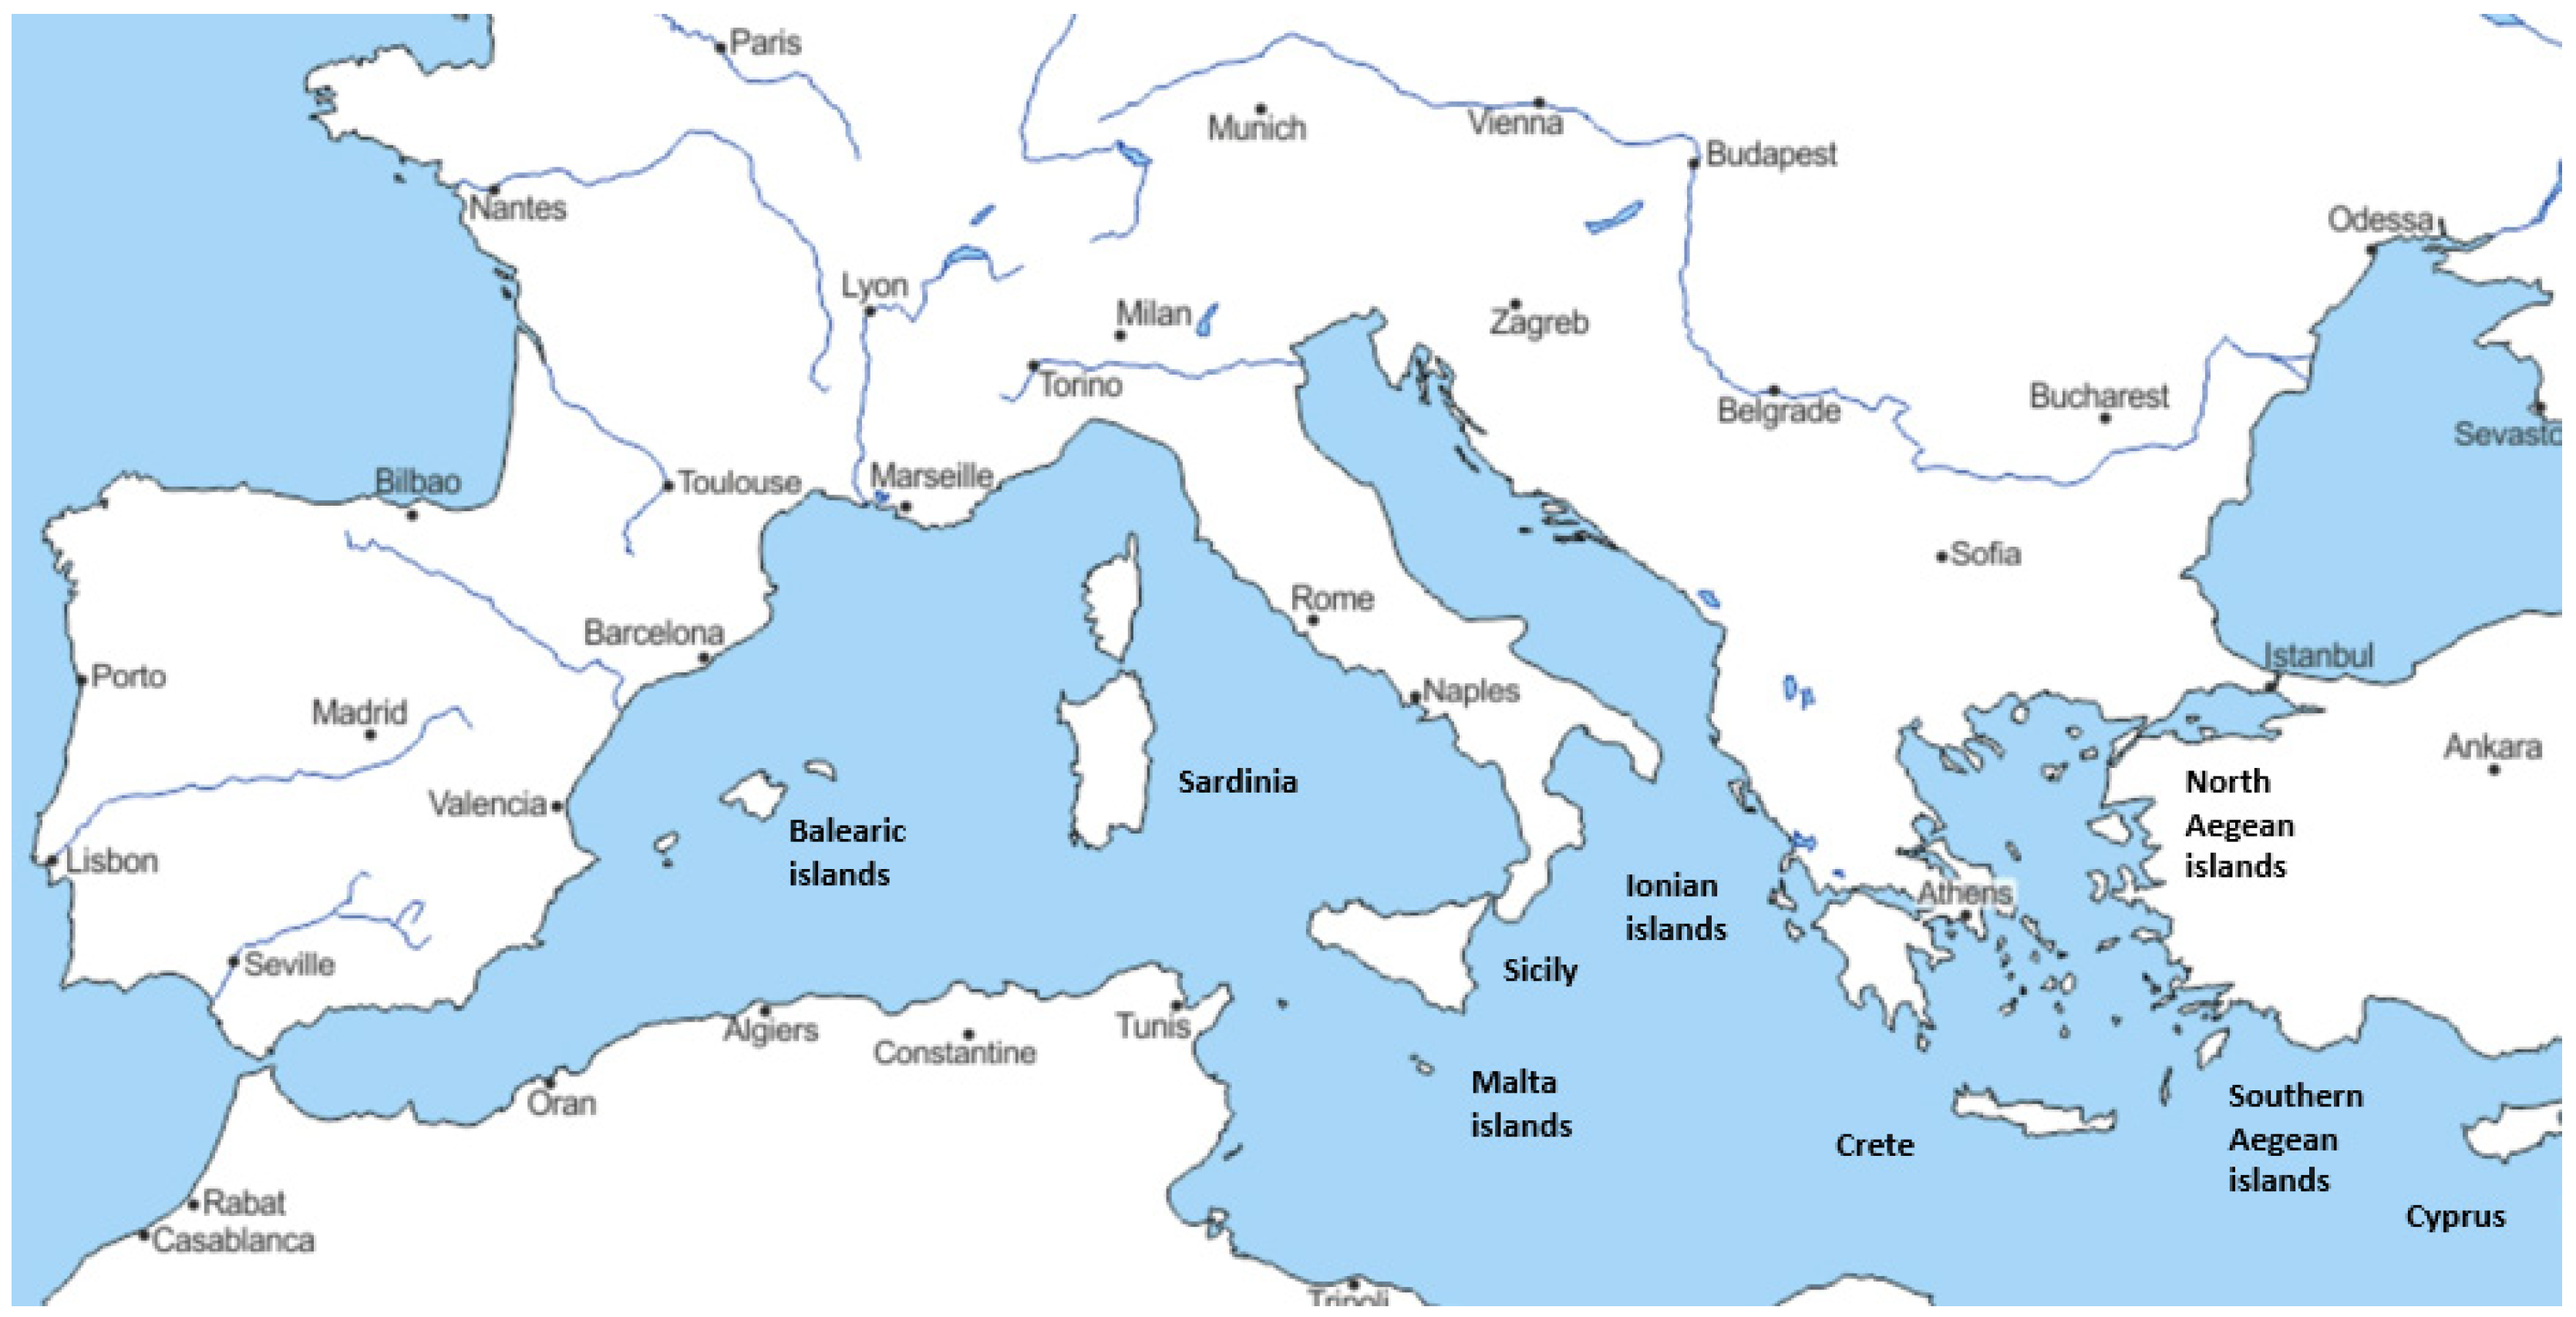
Malta, located in the central Mediterranean (see Figure 1), also experiences a Mediterranean climate, with hot summers, temperatures often exceeding 30 °C (86 °F) in July and August, and mild, wet winters, with temperatures rarely falling below ten °C (50 °F). Grouping these islands based on their Mediterranean climate is possible, considering slight temperature and rainfall pattern variations.
The islands’ diverse characteristics and unique climatic conditions form a complex landscape that significantly influences tourism dynamics and seasonality patterns.
4. Methodology
In the islands analysis, the Observatory of Tourism for European Islands categorises islands into groups based on the population dimensions. Less populated islands are characterised by a population of less than 500,000 inhabitants. Medium-populated islands have slightly larger areas, with populations from 500,000 to 1,000,000 inhabitants, and highly populated islands with more than 1,000,000.
For the seasonality analysis, this study selected three islands from each group. Sicily, Sardinia, and the Balearic Islands (Mallorca, Menorca, Ibiza, Formentera) are in the group of the most-populated islands; Cyprus, Crete, and Malta (with the two off-islands Gozo and Comino) for the medium-populated islands; Northern Aegean Islands (Lesbos, Chios, Samos, Lemnos, Thasos, Ikaria, Samothrace, Skyros, Psara, Oinousses), Southern Aegean Islands (Rhodes, Kos, Santorini, Mykonos, Naxos, Paros, Milos, Symi, Karpathos, Patmos), and the Ionian Islands (Corfu, Kefalonia, Zante, Lefkada, Ithaca, Paxos, Kythiraas) in the less-populated islands.
The islands analysed for each of the three groups are limited due to the lack of monthly data for some European islands from 2008 to 2018. Although some European islands are relevant in terms of tourism, some data are not generally available from some national statistical institutes.
This selection process acknowledges the varying tourist volumes experienced by islands throughout the year, emphasising the significance of distributing tourism activities across multiple months. To explore this, despite numerous measurement models available in the literature (see for example [42,43,44,45,46,47], this study opts for statistical indices applied to the minimum, maximum, and average number of tourist nights on each island.
There are several motivations for using indicators to understand seasonal phenomena. First, they simplify the decision-maker’s understanding of tourism data, making it easier to interpret and make decisions and enabling easy comparison of tourism performance between different destinations. Finally, they offer valuable data for tourism planning and development, aiding in identifying the areas where resources and efforts can focus to enhance the sector’s overall performance.
These selected indicators facilitate the examination of the distribution of tourist flows throughout the year, including seasonality, relative intensity, peak, and indices reflecting excessive use and under-utilisation of infrastructure.
Using carefully selected statistical indicators from the existing literature highlights the impact of seasonality on tourist flows.
A mixture of statistical indicators [12,20] are used, with the first focusing on the extremes of distribution attendance monthly and the second considering the entire distribution. Table 2 presents summarised indicators that consider the tourist overnights.
The seasonal rate per year (S) ebbs and flows of tourist overnights throughout the year. Comparing the maximum and minimum recorded tourist figures every month provides insights into the extent of fluctuation in tourist overnights. Essentially, S helps us gauge how much overnights vary between peak and off-peak seasons.
Relative intensity per year (I) focuses on the intensity of tourist activity over a year. It calculates the difference between monthly maximum and minimum tourist overnights. This value signifies the proportion of tourists between the peak and low seasons, offering valuable information on the overall intensity of tourist inflow.
Seasonality average peak per year (S′) sheds light on the concentration of tourists during specific periods within a year. By comparing the maximum number of tourists overnights recorded monthly to the average number recorded monthly, this indicator helps identify peak tourism periods. It tells us when the highest concentration of tourists occurs, offering valuable insights for planning and resource allocation.
The MUS index, or over-utilisation per year (MUS), evaluates the degree to which tourist infrastructure operates at its maximum capacity throughout the year. A high MUS of 1 indicates that tourists occupy the hospitality infrastructure throughout the year with the same volumes as the month of high season. Higher MUS values indicate maximum capacity utilisation, signalling potential challenges in managing tourism.
Applying these indicators will be instrumental in comprehensively understanding the tourism dynamics (2008–2018) and assessing trends across different islands. Firstly, descriptive statistics will be employed to analyse the seasonality rate per year (S), relative intensity per year (I), seasonality average peak per year (S′), and over-utilisation per year (MUS).
These statistics will provide a snapshot of each indicator’s central tendency and variability over the given timeframe, allowing for a detailed examination of seasonal patterns and their implications. This approach aims to understand the distribution dynamics better, capturing variations from the average that may signify specific challenges or opportunities tied to seasonality.
Furthermore, the trend analysis identifies significant changes in these indicators across various islands, tracking the progression of each indicator over the specified period and identifying potential patterns or shifts in tourism dynamics. By applying statistical techniques to the data, we aim to uncover insights into the evolving nature of tourism, understanding whether certain islands exhibit consistent patterns or experience significant changes in seasonality, intensity, peak concentration, and infrastructure utilisation.
Descriptive statistics and trend analyses will enhance our ability to conclude the indicators, facilitating a comprehensive assessment of tourism seasonality from 2008 to 2018. This approach ensures an exploration of trends and patterns, offering valuable insights for strategic planning and decision-making in tourism management across different islands.
5. Data Analysis
In island destinations, a particular concentration of tourist overnights during summer causes significant imbalances [48]. Seasonality poses complex political and social challenges to tourism enterprises, requiring organisational solutions and considerations regarding tourism management [41,49]. The first question is whether the monthly distribution of tourist flows on the islands is uniform. Hence, we compare tourist flows, especially tourist overnights, between groups of islands. Distinctive seasonality profiles emerge by meticulously examining monthly tourist overnight time series.
Analysing the seasonality of tourism demand across various Mediterranean islands (Table 3) from 2008 to 2018 reveals interesting patterns and variations. The presented monthly percentage distribution illustrates the tourist overnights, shedding light on the temporal dynamics that shape each island group. Considering the Northern Aegean Islands, there is a discernible surge in demand during the summer months, with August taking the lead at 24.46% of the total annual demand. This peak aligns with the broader trend observed in many Mediterranean islands, highlighting the significance of the warm season in attracting visitors.
Moving to the Ionian Islands, a more evenly distributed pattern emerges. July and August are still peak months, contributing 22.41% and 24.10%, respectively, but the overall distribution reflects a steadier flow of tourism throughout the year. This balanced pattern suggests a more consistent appeal, potentially influenced by factors beyond the traditional summer period. Crete, Greece’s largest island, presents a distinctive bell-shaped curve, with a notable peak in August, emphasising the summer season’s centrality in drawing tourists, aligning with the broader Mediterranean trend. The Southern Aegean Islands also confirm this trend, with July and August contributing significantly to the overall demand, showcasing a seasonal concentration during the warmer months.
Sardinia, Sicily, and the Balearic Islands exhibit a pronounced peak in August, in line with the Mediterranean’s peak tourist season (see Figure 2). This concentration emphasises the allure of these destinations during summer, with each island group contributing its unique cultural and natural attractions to the overall appeal.
Cyprus and Malta, however, demonstrate a more evenly spread distribution of tourist demand. Cyprus experiences a peak in May, perhaps benefiting from a slightly earlier start to the tourist season, while Malta sees its highest percentages in August. This diversified pattern suggests a less pronounced reliance on the peak summer months, allowing for a more extended tourism season. This comprehensive analysis of monthly tourism percentages provides invaluable insights into the temporal dynamics shaping tourism demand in the Mediterranean islands. From the pronounced summer peaks in the Northern Aegean and other major destinations to the more evenly distributed patterns in the Ionian Islands, Cyprus, and Malta, understanding these fluctuations is essential for effective strategic planning and resource allocation within the tourism industry.
To further analyse the concentration of tourist demand in the months of the year during the 2008–2018 period, let us look at the previously described statistical indices in Table 2. Each index indicates the range, the minimum and maximum, the mean, and the standard deviation. Table 4 provides a statistical description of the Mediterranean islands’ seasonality rate (S) from 2008 to 2018. The presented metrics offer insights into the variability, central trend, and dispersion of seasonality rates, shedding light on the dynamics of tourism demand over the years.
In the Northern Aegean, the seasonality rate changes from 10.38 to 39.74, with an average of 29.29 and a standard deviation of 9.18; this indicates a considerable fluctuation in demand for tourism, with a considerable spread around the average.
The Ionian Islands have a wider range, from 72.1 to 229.3, reflecting a higher variability in seasonal rates. The average is 154.27, with a remarkable standard deviation of 57.23, suggesting a significant dispersion around the average.
Crete, with a seasonality rate ranging from 68.53 to 115.65, shows a more moderate variability than the Ionian Islands. The average is 95.07, with a relatively lower standard deviation of 18.46, indicating a relatively more stable pattern of tourist demand. The seasonality rate in the Southern Aegean Sea extends from 106.55 to 204.06, showing a substantial range. The average is 154.75, with a standard deviation of 28.68, showing considerable variability in seasonal patterns of tourism.
The seasonality rate of Sardinia varies from 40.51 to 53.55, showing a narrower range than other destinations. The average is 45.85, and the standard deviation is relatively low at 4.12, indicating a more consistent pattern in tourism demand. Sicily has the smallest seasonal range, from 7.92 to 11.09. The average is 9.32, and the standard deviation is 0.94, suggesting a relatively stable and predictable seasonal pattern of tourist overnights.
The Balearic Islands show moderate variability with a seasonality rate between 27.63 and 59.14. The average is 45.87, and the standard deviation is 9.95, indicating a discernible spread around the average. Cyprus and Malta, with seasonality rates ranging from 6.24 to 11.29 and 2.3 to 3.31, respectively, show relatively low variability.
The average seasonality rates for Cyprus and Malta are 8.64 and 2.87, with standard deviations of 1.91 and 0.3, respectively. Table 5 shows a statistical description of the seasonality index (I) intensity.
The Northern Aegean Islands have a seasonal intensity from 102,983.00 to 409,638.00, with an average of 375,707.36 and a standard deviation of 36,041.02. Maximum and minimum overnight stays in a year differ significantly, with a noticeable deviation from the average. Moving towards the Ionian Islands, the intensity of seasonality shows a wider range, from 594,041.00 to 2,298,202.00, reflecting substantial variability in maximum–minimum nights. The average intensity is 1,942,725.82, but a significant standard deviation of 205,080.69 indicates a considerable variation between the averages.
Crete has a seasonal intensity ranging from 1,377,470.00 to 4.804.365,00, with an average of 4,127,184.09 and a standard deviation of 514,071.65.
Significant variables influence accommodation patterns, emphasising the dynamic nature of tourist overnights, as indicated by the substantial range and standard deviation.
In the Southern Aegean, the intensity of seasonality varies from 1,208,411.00 to 4,651,130.00, with an average of 4,006,458.91 and a standard deviation of 382,495.93. The difference between maximum and minimum nights has considerable variability, showing seasonal fluctuations in tourism.
The seasonal intensity of Sardinia ranges from 845,236.00 to 3,819,012.00, with an average of 3,418,956.27 and a standard deviation of 286,873.04. The narrower range, compared with other destinations, suggests a more consistent pattern in the variation of overnight stays throughout the year.
With a seasonal intensity ranging from 255,243.00 to 2,677,701.00, Sicily detonates a relatively stable trend between maximum and minimum nights, with less variability than other islands.
The Balearic Islands reach a wide range of seasonal intensity, from 2,324,255.00 to 10,697,659.00. The average is 10,105,043.45, with a substantial standard deviation of 745,234.80, suggesting a significant dispersion around the average and highlighting the marked seasonal variations in overnight stays.
Moving on to Cyprus, the intensity of seasonality varies from 542,734.00 to 2,289,282.00, with an average of 2,062,482.64 and a standard deviation of 167,857.73. Cyprus has a moderate variability between maximum and minimum nights, underlining the seasonal nature of tourist overnights. Finally, the intensity of Malta’s seasonality varies from 105,508.00 to 746,926.00, with an average of 694,305.27 and a standard deviation of 37,394.75. The narrower range and the lower standard deviation suggest a more consistent pattern in the variation of overnight stays.
Regarding the Seasonal Peak Factor index (Table 6), which indicates the distance between the maximum and the average peak, the temporal analysis from 2010 to 2018 reveals significant variability in some islands.
For the Northern Aegean, the Seasonal Peak Factor ranges indicate a substantial variation in the magnitude of seasonal peaks, with a consistent and high average demand during peak months. Moving to the Ionian Islands, the Seasonal Peak Factor showcases a similar pattern with a mean of 2.89 and a slightly lower standard deviation of 0.11, suggesting a relatively stable intensity of seasonal peaks, highlighting the consistency in demand patterns.
Crete exhibits a Seasonal Peak Factor ranging from 0.36 to 2.69, with a mean of 2.55 and a standard deviation of 0.12. The moderate variability and a slightly lower mean compared with the Northern Aegean and Ionian Islands suggest a nuanced pattern of seasonal intensity on this island.
The Southern Aegean Sea displays a comparable intensity of seasonal peaks to the Ionian Islands, with a slightly lower mean and slightly higher variability.
Sardinia’s Seasonal Peak Factor indicates a considerable fluctuation in seasonal peaks, with notably high average demand during peak months.
Sicily showcases a Seasonal Peak Factor ranging from 0.19 to 2.54, with a mean of 2.42 and a standard deviation of 0.06. While exhibiting a lower mean, Sicily demonstrates a stable and consistent pattern in the intensity of seasonal peaks.
The Balearic Islands suggest a moderate and stable intensity of seasonal peaks, contributing to a more predictable tourist demand pattern. Moving to Cyprus, the Seasonal Peak Factor ranges from 0.22 to 2.03, with a mean of 1.93 and a standard deviation of 0.06. Cyprus demonstrates a relatively stable intensity of seasonal peaks, with a consistent average demand during peak months. Malta’s Seasonal Peak Factor ranges indicate a moderate and stable pattern in the intensity of seasonal peaks, indicative of a consistent demand profile throughout the year.
The maximum utilization constrained by seasonality (MUS) from 2008 to 2018 (Table 7) aids in comprehending the extent to which these islands encounter constraints arising from seasonal variations, encompassing weather, tourism, and economic activities.
Beginning with the Northern Aegean, the MUS index ranges from 5.42 to 37.59, with a mean of 34.14 and a standard deviation of 1.66. It has a considerable range in maximum utilisation, showcasing the destination’s capacity to handle varying demand levels throughout the seasons.
Moving to the Ionian Islands, the MUS index suggests a robust capacity to manage seasonality with consistent and high maximum utilisation levels.
Crete exhibits an MUS index ranging from 5.73 to 42.88, with a mean of 39.36 and a standard deviation of 1.90, indicating a relatively high and consistent capacity to accommodate peak demands, reflecting the island’s adaptability to seasonality constraints.
In the Southern Aegean Sea, the MUS index varies from 6.02 to 40.01, with a mean of 36.27 and a standard deviation of 2.00. This region displays a notable capacity to handle varying levels of demand, with a consistent and relatively high maximum utilisation constrained by seasonality.
Sardinia’s MUS index suggests a stable and efficient capacity to manage peak demands, with a relatively lower maximum utilisation than other destinations.
Sicily showcases an MUS index of 3.19 to 42.62, indicating a high and consistent capacity to accommodate peak demands and the destination’s adaptability to seasonality constraints.
The Balearic Islands exhibit an MUS index of 4.68 to 45.65, with a mean of 43.26 and a standard deviation of 1.57, which indicates a robust capacity to handle varying demand levels, with consistent and high levels of maximum utilisation constrained by seasonality. Cyprus demonstrates a high and consistent capacity to handle peak demands, reflecting its adaptability to seasonality constraints. Malta’s MUS index shows a very high average value, showing that tourism infrastructure, even compared with all other islands, is overused in high season.
6. Discussion
The analysis of seasonality and its impact on various Mediterranean islands unveils distinct patterns and challenges, necessitating tailored policy considerations for each region. The Northern and Southern Aegean Sea and Ionian islands record a marked seasonal variation in tourist overnights and experience a remarkable peak (S) during the peak months, emphasising the mono-seasonality in their tourism patterns. This result is coherent with [42].
The island of Crete has a moderate seasonality index with a significant increase during the peak months.
Large islands such as Sardinia and Sicily have a more pronounced seasonality index, contributing to a higher degree of seasonality than other Mediterranean destinations. Also, the Balearic Islands, Cyprus, and Malta have similar trends. In all the Mediterranean islands, the seasonal intensity (I) and the peak seasonal factor (S′) reveal varying degrees of fluctuation in tourist overnights. Islands generally experience greater intensity during peak months, reflecting the influence of seasonality on tourism patterns.
While there are nuanced differences, all island groups show a steady trend of greater intensity during peak seasons, emphasising the dependence on periods of high demand for their tourist economies. However, some islands, such as Sardinia and Crete, show increased seasonal intensity, indicating a more pronounced fluctuation in tourist demand during peak periods. By contrast, others, such as Cyprus, offer a more moderate intensity, reflecting a relatively more fluid distribution of visitors throughout the year.
Regarding maximum usage constrained by seasonality (MUS), Crete, the Southern Aegean Islands, and Cyprus show high MUS indices, suggesting a robust ability to efficiently use resources during peak seasons, reflecting well-adapted tourist infrastructure. The Islands with a moderate MUS (Northern Aegean, Ionian Islands, Sardinia, Sicily, Balearic Islands, and Malta) indicate an efficient use of resources. Although their capacity seems slightly lower than that of high MUS islands, they demonstrate a balanced approach to managing different demand levels.
The results show that the Mediterranean islands have different seasonality patterns, intensities, seasonality peak factors, and maximum use levels bound by seasonality. The variations reflect each destination’s unique characteristics, adaptability, and tourist infrastructure. Islands such as Crete, the Southern Aegean, and Cyprus show strong capacity and adaptability, while others, such as Malta, show high seasonal intensity. This result is consistent with Ferrante et al. [5] who state that seasonality patterns differ from country to country concerning the tourism practices of residents and non-residents.
To mitigate seasonal challenges, the Ionian Islands can diversify their attractions by promoting off-season events; investment in infrastructure and accommodation should align with peak-season demand while avoiding overcapacity during low-season periods. The Northern Aegean Islands could incentivise shoulder-season visits through promotions, discounts, and cultural events, exploiting the advantages of being in the archipelagos and thus developing a hub and spoke transport model (see [49], for an example), while for Crete, investing in initiatives to extend the tourism season is imperative. Leveraging Crete’s rich cultural heritage can attract tourists interested in historical and archaeological experiences year-round.
In response to high seasonality intensity, the Southern Aegean Islands can implement sustainable tourism practices to protect the environment. Developing infrastructure and transportation options for peak-season tourist overnights is crucial for a smooth travel experience. Stimulating year-round attractions, such as water sports, cultural events, and hiking trails, are essential for the Balearic Islands, providing activities that complement traditional sun and sand tourism as specified by Alcover et al. [51].
Optimising infrastructure use to avoid overcapacity during peak seasons and improving overall visitor satisfaction should be a priority. Exploring opportunities for cruise tourism during the off-season can provide unique island-hopping experiences. The Malta Islands can maintain sustainable growth by focusing on eco-friendly tourism practices and minimising environmental impacts. Attracting adventure seekers and nature enthusiasts during the off-season through activities like hiking, birdwatching, and stargazing is a viable strategy.
The seasonality and intensity of seasonality measurements in each island group can help maximise the benefits of tourism while minimising its negative impacts.
Sustainable development, tourist product diversification, and planning are critical components for the long-term success of Mediterranean island tourism.
7. Policy Implications
Seasonality and its ramifications for various Mediterranean islands unveil distinctive patterns and multifaceted challenges (EUROISLANDS, Interim Report 2013). Beyond the conventional concerns outlined in the literature—such as the strain on services, infrastructure, and the delicate balance between resident and tourist use—the positive dimensions of seasonality become evident when viewed through the lens of environmental and sociocultural considerations [32].
The intensity of seasonality intricately ties to a destination’s sustainability and socio-economic well-being. This connection becomes particularly pronounced when a destination predominantly depends on a specific type of tourism, leading to a more confined range in average tourist overnights.
Even considering the limitations of this study, linked to the availability of data, the subjective choice of indicators, and the field of observation, the analysis of the dynamics of tourist seasonality over the period 2008–2018 has direct implications for the economic landscape of the islands studied. The marked seasonality observed in tourist demand significantly affects the island’s GDP, with peak months driving substantial economic activity. Policymakers can use this information to formulate targeted strategies for economic diversification and sustainable growth beyond the tourism sector.
The employment sector [52], closely linked to tourism, is subject to significant fluctuations in peak and off-season seasons [51]. Policymakers may consider implementing policies to address seasonal unemployment by promoting alternative employment opportunities during off-season tourism. Investing in vocational training programmes to improve the adaptability of the workforce could help create more stable employment patterns [53].
8. Conclusions
The cyclical nature of tourist demand also influences population dynamics, leading to temporary migrations during peak seasons for job opportunities. Policymakers can use strategies to manage and balance population growth and mobility, ensuring the sustainable development of local communities. Key policy recommendations include diversification, identity building, sustainability, economic growth with local support, and the delicate balance of growth with community welfare [54,55].
By strategically addressing diversification, identity strengthening, sustainability, economic growth with local support, and the delicate balance of community growth and well-being, the Mediterranean islands can arrange a way for a resilient, sustainable, and harmonious tourism industry to respect and preserve each destination’s unique identity and heritage. Considering the results of this article and the policy implications for sustainability and seasonality, future studies could compare the regional seasonality data and broader national data of the countries to which these regions belong. This comparison would provide a clearer understanding of the regional impact of seasonality in the wider national context, potentially revealing significant disparities or trends.
9. Patents
Patents have resulted from the work reported in this manuscript.
Author Contributions
G.R.: Conceptualisation; formal analysis; resources data curation, writing; M.P.; methodology, software, validation. All authors have read and agreed to the published version of the manuscript.
Funding
This research received no external funding.
Data Availability Statement
Data are available at www.eurostat.eu accessed on 10 October 2023.
Conflicts of Interest
The authors declare no conflicts of interest.
References
- Mazzola, F.; Cirà, A.; Ruggieri, G.; Butler, R. Air transport and tourism flows to islands: A panel analysis for southern European countries. Int. J. Tour. Res. 2022, 24, 639–652. [Google Scholar] [CrossRef]
- Butler, R. Chapter 17 Seasonality and Overtourism; Goulding, P., Ed.; Goodfellow Publishers: Oxford, UK, 2023. [Google Scholar] [CrossRef]
- Krakover, S. Partitioning seasonal employment in the hospitality industry. Tour. Manag. 2000, 21, 461–471. [Google Scholar] [CrossRef]
- Donatos, G.; Zairis, P. Seasonality of foreign tourism in the Greek island of Crete. Ann. Tour. Res. 1991, 18, 515–519. [Google Scholar] [CrossRef]
- Ferrante, M.; Magno, G.L.L.; De Cantis, S. Measuring tourism seasonality across European countries. Tour. Manag. 2018, 68, 220–235. [Google Scholar] [CrossRef]
- Ruggieri, G. Islands tourism seasonality. In Tourism and Leisure: Current Issues and Perspectives of Development; Springer Fachmedien: Wiesbaden, Germany, 2014; pp. 371–383. [Google Scholar]
- Baum, T.; Hagen, L. Seasonality in Tourism: Understanding the challenges—Introduction. Tour. Econ. 1999, 5, 5–8. [Google Scholar] [CrossRef]
- Suštar, N.; Ažić, M.L. Measuring tourism seasonality across selected Mediterranean countries. KnE Soc. Sci. 2020, 4, 216–229. [Google Scholar] [CrossRef]
- Hylleberg, S. (Ed.) Modelling Seasonality; OUP Catalogue; Oxford University Press: Oxford, UK, 1992. [Google Scholar]
- Becker, C. The Small Island States in the Pacific: The Tyranny of Distance; Technical Report; International Monetary Fund: Washington, DC, USA, 2012. [Google Scholar]
- Butler, R.W. Seasonality in Tourism: Issues and problems. In Tourism: The State of the Art; Seaton, A.V., Ed.; Wiley: Chichester, UK, 1994; pp. 332–339. [Google Scholar]
- Baum, T.; Lundtorp, S. (Eds.) Seasonality in Tourism; Pergamon: Oxford, UK, 2001. [Google Scholar]
- Candela, G.; Castellani, M. Stagionalità e destagionalizzazione. In L’Italia. Il Declino Economico e la Forza del Turismo. Fattori di Vulnerabilità e Potenziale Competitivo di un Settore Strategico; Celant, A., Ed.; Marchesi: Roma, Italy, 2009. [Google Scholar]
- Duro, J.A.; Turrion-Prats, J. Tourism seasonality worldwide. Tour. Manag. Perspect. 2019, 31, 38–53. [Google Scholar] [CrossRef]
- Duro, J.A. Seasonality of hotel demand in the main Spanish provinces: Measurements and decomposition exercises. Tour. Manag. 2016, 52, 52–63. [Google Scholar] [CrossRef]
- Duro, J.A. Seasonality of tourism: A new decomposition. Tour. Econ. 2018, 23, 615–621. [Google Scholar] [CrossRef]
- Rosselló, J.; Sansó, A. Yearly, monthly and weekly seasonality of tourism demand: A decomposition analysis. Tour. Manag. 2017, 60, 379–389. [Google Scholar] [CrossRef]
- Fernández-Morales, A.; Cisneros-Martínez, J.D.; McCabe, S. Seasonal concentration of tourism demand: Decomposition analysis and marketing implications. Tour. Manag. 2016, 56, 172–190. [Google Scholar] [CrossRef]
- Vergori, A.S. Patterns of seasonality and tourism demand forecasting. Tour. Econ. 2017, 23, 1011–1027. [Google Scholar] [CrossRef]
- Fernandes, P.O.; Nunes, A.M.; Veloso, C.M.; Santos, E.; Ferreira, F.A.; Fonseca, M.J.S. Outdoor solutions for the seasonal concentration of tourism demand in Northern Portugal: An integrated approach based on the Gini Index. In Handbook of Research on the Impacts, Challenges, and Policy Responses to Overtourism; IGI Global: Hershey, PA, USA, 2020; pp. 364–379. [Google Scholar]
- Baron, R.V. Seasonality in Tourism—A Guide to the Analysis of Seasonality and Trends for Policy Making; Technical Series No. 2; The Economist Intelligence Unit Ltd.: London, UK, 1975. [Google Scholar]
- Tsiotas, D.; Krabokoukis, T.; Polyzos, S. Detecting interregional patterns in tourism seasonality of Greece: A principal components analysis approach. Reg. Sci. Inq. 2020, 12, 91–112. [Google Scholar]
- Agius, K.; Briguglio, M. Mitigating seasonality patterns in an archipelago: The role of ecotourism. Marit. Stud. 2021, 20, 409–421. [Google Scholar] [CrossRef] [PubMed]
- Krabokoukis, T.; Polyzos, S. Analysing the Tourism Seasonality for the Mediterranean Countries. J. Knowl. Econ. 2023, 1–24. [Google Scholar] [CrossRef]
- Martín, J.M.M.; Fernández, J.A.S. The effects of technological improvements in the train network on tourism sustainability. An approach focused on seasonality. Sustain. Technol. Entrep. 2022, 1, 100005. [Google Scholar] [CrossRef]
- Martín, J.M.M.; Fernández, J.A.S.; Martín, J.A.R. A comprehensive evaluation of the tourism seasonality using a synthetic DP2 indicator. Tour. Geogr. 2018, 21, 284–305. [Google Scholar] [CrossRef]
- Kuznets, S. Seasonal pattern, and seasonal amplitude: Measurement of their short-time variations. J. Am. Stat. Assoc. 1932, 27, 9–20. [Google Scholar] [CrossRef]
- Hartmann, R. Tourism seasonality and social change. Leis. Stud. 1986, 5, 25–33. [Google Scholar] [CrossRef]
- Khamzaeva, D.S. The problem of seasonality in tourism. Theor. Appl. Sci. 2020, 11, 337–340. [Google Scholar] [CrossRef]
- Koenig, N.; Bischoff, E. Seasonality Research: The State of the Art. Int. J. Tour. Res. 2005, 7, 201–219. [Google Scholar] [CrossRef]
- Ainsworth, S.; Purss, A. Same time next year? Human resource management and seasonal workers. Pers. Rev. 2009, 38, 217–235. [Google Scholar] [CrossRef]
- Manning, R.E.; Powers, L.A. Peak and off-peak use: Redistributing the outdoor recreation/tourism load. J. Travel Res. 1984, 23, 25–31. [Google Scholar] [CrossRef]
- Wall, G.; Yan, M. Disaggregating visitor flows—The example of China. Tour. Anal. 2003, 7, 191–205. [Google Scholar]
- Jeffrey, D.; Barden, R.R.D. An analysis of the natural causes and marketing implications of seasonality in the occupancy performance of English hotels. Tour. Econ. 1999, 5, 69–91. [Google Scholar] [CrossRef]
- Campbell, R. Managing Seasonality: Hotels in the Highlands and Islands of Scotland, Working Papers N. 82; University of Paisley: Paisley, UK, 1995.
- Stojčić, N.; Mikulić, J.; Vizek, M. High season, low growth: The impact of tourism seasonality and vulnerability to tourism on the emergence of high-growth firms. Tour. Manag. 2022, 89, 104455. [Google Scholar] [CrossRef]
- Cocco, L.; Deidda, M.; Marchesi, M.; Pigliaru, F. Insularity and economies of density: Analysing the efficiency of a logistic network using an econometric simulation-based approach. Reg. Stud. 2019, 53, 900–911. [Google Scholar] [CrossRef]
- Cannonier, C.; Burke, M.G. The economic growth impact of tourism in Small Island Developing States—Evidence from the Caribbean. Tour. Econ. 2019, 25, 85–108. [Google Scholar] [CrossRef]
- Vandarakis, D.; Malliouri, D.; Petrakis, S.; Kapsimalis, V.; Moraitis, V.; Hatiris, G.A.; Panagiotopoulos, I. Carrying Capacity and Assessment of the Tourism Sector in the South Aegean Region, Greece. Water 2023, 15, 2616. [Google Scholar] [CrossRef]
- Croes, R.R. A paradigm shift to a new strategy for small island economies: Embracing demand-side economics for value enhancement and long-term economic stability. Tour. Manag. 2006, 27, 453–465. [Google Scholar] [CrossRef]
- Xie, J. The economic determinants of tourism seasonality: A case study of the Norwegian tourism industry. Cogent Bus. Manag. 2020, 7, 1732111. [Google Scholar] [CrossRef]
- Briguglio, L.; Cordina, G.; Farrugia, N.; Vella, S. Economic Vulnerability and Resilience: Concepts and Measurements. Oxf. Dev. Stud. 2009, 37, 229–247. [Google Scholar] [CrossRef]
- Boadas, A.R. Islas e insularidad geográfica. Terra 2011, 27, 147–154. [Google Scholar]
- Bampatsou, C.; Halkos, G.; Astara, O.H. Composite indicators in evaluating tourism performance and seasonality. Oper. Res. 2020, 22, 2373–2396. [Google Scholar] [CrossRef]
- Cuccia, T.; Rizzo, I. Tourism seasonality in cultural destinations: Empirical evidence from Sicily. Tour. Manag. 2011, 32, 589–595. [Google Scholar] [CrossRef]
- Fernández-Morales, A. Tourism seasonality across markets. In Regional Science Perspectives on Tourism and Hospitality; Springer: Cham, Switzerland, 2021; pp. 125–141. [Google Scholar]
- Karamustafa, K.; Ulama, S. Measuring the seasonality in tourism with the comparison of different methods. EuroMed J. Bus. 2010, 5, 191–214. [Google Scholar] [CrossRef]
- Ridderstaat, J.; Croes, R. A framework for classifying causal factors of tourism demand seasonality: An interseason and intraseasonal approach. J. Hosp. Tour. Res. 2020, 44, 733–760. [Google Scholar] [CrossRef]
- Ruggieri, G.; Platania, M.; Zarb, J. Island Development Model Specialisation: A Panel Data Analysis Comparing Evolutionary Tourism Model, Industrial to Community-Based (2010–2019). Economies 2022, 10, 208. [Google Scholar] [CrossRef]
- Observatory of Tourism for European Islands—OTIE. Islands Database; OTIE: Palermo, Italy, 2023. [Google Scholar]
- Alcover, A.; Alemany, M.; Jacob, M.; Payeras, M.; García, A.; Martínez-Ribes, L. The economic impact of yacht charter tourism on the Balearic economy. Tour. Econ. 2011, 17, 625–638. [Google Scholar] [CrossRef]
- Karampela, S.; Kizos, T.; Papatheodorou, A. Patterns of transportation for tourists and residents in the Aegean archipelago, Greece. In Archipelago Tourism; Routledge: London, UK, 2016; pp. 34–49. [Google Scholar]
- Guidetti, G.; Pedrini, G.; Zamparini, L. Assessing perceived job quality among seasonal tourism workers: The case of Rimini, Italy. Tour. Econ. 2021, 27, 1629–1649. [Google Scholar] [CrossRef]
- Belau, D. Providing decent employment in the hospitality and tourism industry: The role of the ILO. Tour. Econ. 1999, 5, 415–423. [Google Scholar] [CrossRef]
- Olimovich, D.I.; Khabibovna, K.M.; Alimovich, F.E. Innovative ways of reducing the tourism seasonality of tourist areas. Дoстижения науки и oбразoвания 2020, 1, 12–13. [Google Scholar]
Figure 1.
Study map of sample Mediterranean islands.

Figure 2.
Monthly concentration of overnights in island sample (2008–2018).


Table 1.
Geographical and demographic characteristics of the islands sample (2018).
| Island Groups | State | Surface (km²) | Population |
|---|---|---|---|
| Sicily | Italy | 25,832 | 4,806,738 |
| Sardinia | Italy | 24,100 | 1,571,194 |
| Balearic Islands | Spain | 4992 | 1,188,000 |
| Cyprus | Cyprus | 9250 | 989,000 |
| Crete | Greece | 8450 | 623,065 |
| Malta Islands | Malta | 316 | 514,564 |
| Southern Aegean Sea | Greece | 5286 | 325,000 |
| Ionian Islands | Greece | 2307 | 207,855 |
| Northern Aegean | Greece | 3836 | 194,136 |
Source: [41].
Table 2.
Statistical Indicators Calculated on Minimum and Maximum Tourist Overnights.
| Indicators | Index | Formula | Calculation (Monthly Data) | Range |
|---|---|---|---|---|
| Seasonality Rate per year | S | Pmax/Pmin | maximum value of overnights recorded in a year /minimum value of overnights recorded in a year | |
| Relative intensity per year | I | Pmax − Pmin | maximum value of overnights recorded in a year − minimum value of the tourist overnights recorded in a year | |
| Seasonality average peak per year | S′ | Pmax/Pmed | maximum value of overnights in a year /average value of overnights recorded in a year (monthly data) | |
| Over-utilisation per year | MUS | 100/S′ | 100 on seasonality average peak per year |
Source: [12].
Table 3.
Monthly distribution of overnights in islands sample grouped by country (2008–2018).
| Islands Group | Jan | Feb | Mar | Apr | May | Jun | Jul | Aug | Sep | Oct | Nov | Dec | Total |
|---|---|---|---|---|---|---|---|---|---|---|---|---|---|
| Northern Aegean | 1.06 | 1.11 | 1.40 | 2.37 | 9.04 | 15.98 | 21.88 | 24.46 | 16.55 | 3.67 | 1.35 | 1.13 | 100.00 |
| Ionian Islands | 0.21 | 0.24 | 0.41 | 1.48 | 10.54 | 17.91 | 22.41 | 24.10 | 17.04 | 5.20 | 0.26 | 0.19 | 100.00 |
| Crete | 0.25 | 0.29 | 0.50 | 3.33 | 11.94 | 16.75 | 20.69 | 21.16 | 16.13 | 8.27 | 0.43 | 0.27 | 100.00 |
| Southern Aegean Sea | 0.19 | 0.20 | 0.35 | 2.03 | 10.98 | 17.04 | 21.72 | 23.04 | 16.92 | 7.13 | 0.24 | 0.15 | 100.00 |
| Sardinia | 0.62 | 0.69 | 1.03 | 2.61 | 6.41 | 15.47 | 24.35 | 28.32 | 14.90 | 3.98 | 0.89 | 0.73 | 100.00 |
| Sicily | 2.19 | 2.34 | 3.80 | 6.95 | 9.58 | 12.13 | 15.82 | 20.15 | 13.61 | 7.70 | 3.08 | 2.65 | 100.00 |
| Balearic Islands | 0.55 | 1.19 | 2.52 | 4.74 | 11.47 | 15.54 | 18.57 | 19.29 | 15.57 | 9.33 | 0.78 | 0.46 | 100.00 |
| Cyprus | 1.99 | 2.33 | 3.68 | 5.95 | 10.81 | 13.15 | 15.03 | 16.11 | 13.44 | 11.42 | 4.01 | 2.08 | 100.00 |
| Malta Islands | 4.59 | 5.34 | 6.04 | 8.19 | 9.16 | 10.08 | 12.44 | 12.90 | 10.43 | 9.63 | 6.31 | 4.89 | 100.00 |
Source: [50].
Table 4.
Statistic description of seasonality rate (S) (calculated on overnights 2008–2018).
| Islands Group | Range | Minimum | Maximum | Mean | Std. Dev. |
|---|---|---|---|---|---|
| Northern Aegean | 29.36 | 10.38 | 39.74 | 29.29 | 9.18 |
| Ionian Islands | 157.2 | 72.1 | 229.3 | 154.27 | 57.23 |
| Crete | 47.12 | 68.53 | 115.65 | 95.07 | 18.46 |
| Southern Aegean Sea | 97.51 | 106.55 | 204.06 | 154.75 | 28.68 |
| Sardinia | 13.04 | 40.51 | 53.55 | 45.85 | 4.12 |
| Sicily | 3.17 | 7.92 | 11.09 | 9.32 | 0.94 |
| Balearic Islands | 31.51 | 27.63 | 59.14 | 45.87 | 9.95 |
| Cyprus | 5.05 | 6.24 | 11.29 | 8.64 | 1.91 |
| Malta | 1.01 | 2.3 | 3.31 | 2.87 | 0.3 |
Source: [50].
Table 5.
Statistic description of the intensity of seasonality (I) (calculated on overnights 2008–2018).
Table 5.
Statistic description of the intensity of seasonality (I) (calculated on overnights 2008–2018).
| Islands Group | Range | Minimum | Maximum | Mean | Std. Dev. |
|---|---|---|---|---|---|
| Northern Aegean | 102,983.00 | 306,655.00 | 409,638.00 | 375,707.36 | 36,041.02 |
| Ionian Islands | 594,041.00 | 1,704,161.00 | 2,298,202.00 | 1,942,725.82 | 205,080.69 |
| Crete | 1,377,470.00 | 3,426,895.00 | 4,804,365.00 | 4,127,184.09 | 514,071.65 |
| Southern Aegean Sea | 1,208,411.00 | 3,442,719.00 | 4,651,130.00 | 4,006,458.91 | 382,495.93 |
| Sardinia | 845,236.00 | 2,973,776.00 | 3,819,012.00 | 3,418,956.27 | 286,873.04 |
| Sicily | 255,243.00 | 2,422,458.00 | 2,677,701.00 | 2,562,930.91 | 79,657.09 |
| Balearic Islands | 2,324,255.00 | 8,373,404.00 | 10,697,659.00 | 10,105,043.45 | 745,234.80 |
| Cyprus | 542,734.00 | 1,746,548.00 | 2,289,282.00 | 2,062,482.64 | 167,857.73 |
| Malta Islands | 105,508.00 | 641,418.00 | 746,926.00 | 694,305.27 | 37,394.75 |
Source: [50].
Table 6.
Statistic description of Seasonal Peak Factor (S′) (calculated on overnights 2008–2018).
| Islands Group | Range | Minimum | Maximum | Mean | Std. Dev. |
|---|---|---|---|---|---|
| Northern Aegean | 0.45 | 2.66 | 3.11 | 2.94 | 0.14 |
| Ionian Islands | 0.32 | 2.71 | 3.03 | 2.89 | 0.11 |
| Crete | 0.36 | 2.33 | 2.69 | 2.55 | 0.12 |
| Southern Aegean Sea | 0.44 | 2.5 | 2.94 | 2.76 | 0.15 |
| Sardinia | 0.39 | 3.14 | 3.53 | 3.4 | 0.12 |
| Sicily | 0.19 | 2.35 | 2.54 | 2,42 | 0.06 |
| Balearic Islands | 0.25 | 2.19 | 2.44 | 2.31 | 0.08 |
| Cyprus | 0.22 | 1.81 | 2.03 | 1.93 | 0.06 |
| Malta Islands | 0.3 | 1.38 | 1.68 | 1.54 | 0.1 |
Source: [50].
Table 7.
Statistic description of MUS (calculated on overnights 2008–2018).
| Islands Group | Range | Minimum | Maximum | Mean | Std. Dev. |
|---|---|---|---|---|---|
| Northern Aegean | 5.42 | 32.17 | 37.59 | 34.14 | 1.66 |
| Ionian Islands | 3.95 | 32.98 | 36.93 | 34.63 | 1.36 |
| Crete | 5.73 | 37.15 | 42.88 | 39.36 | 1.9 |
| Southern Aegean Sea | 6.02 | 33.99 | 40.01 | 36.27 | 2 |
| Sardinia | 3.54 | 28.34 | 31.88 | 29.46 | 1.07 |
| Sicily | 3.19 | 39.43 | 42.62 | 41.37 | 0.93 |
| Balearic Islands | 4.68 | 40.97 | 45.65 | 43.26 | 1.57 |
| Cyprus | 6 | 49.31 | 55.31 | 51.77 | 1.7 |
| Malta Islands | 12.77 | 59.48 | 72.25 | 65.37 | 4.12 |
Source: [50].
Disclaimer/Publisher’s Note: The statements, opinions and data contained in all publications are solely those of the individual author(s) and contributor(s) and not of MDPI and/or the editor(s). MDPI and/or the editor(s) disclaim responsibility for any injury to people or property resulting from any ideas, methods, instructions or products referred to in the content. |
© 2024 by the authors. Licensee MDPI, Basel, Switzerland. This article is an open access article distributed under the terms and conditions of the Creative Commons Attribution (CC BY) license (https://creativecommons.org/licenses/by/4.0/).
Share and Cite
MDPI and ACS Style
Ruggieri, G.; Platania, M. Islands’ Tourism Seasonality: A Data Analysis of Mediterranean Islands’ Tourism Comparing Seasonality Indicators (2008–2018). Sustainability 2024, 16, 3674. https://doi.org/10.3390/su16093674
AMA Style
Ruggieri G, Platania M. Islands’ Tourism Seasonality: A Data Analysis of Mediterranean Islands’ Tourism Comparing Seasonality Indicators (2008–2018). Sustainability. 2024; 16(9):3674. https://doi.org/10.3390/su16093674
Chicago/Turabian StyleRuggieri, Giovanni, and Marco Platania. 2024. "Islands’ Tourism Seasonality: A Data Analysis of Mediterranean Islands’ Tourism Comparing Seasonality Indicators (2008–2018)" Sustainability 16, no. 9: 3674. https://doi.org/10.3390/su16093674
Note that from the first issue of 2016, this journal uses article numbers instead of page numbers. See further details here.