
Symmetry Analysis of Manual Wheelchair Propulsion Using Motion Capture Techniques

Faculty of Mechanical Engineering, Institute of Machine Design, Poznan University of Technology, 60-965 Poznań, Poland
*
Author to whom correspondence should be addressed.
Symmetry 2022, 14(6), 1164; https://doi.org/10.3390/sym14061164
Submission received: 16 May 2022
/
Revised: 29 May 2022
/
Accepted: 1 June 2022
/
Published: 5 June 2022
(This article belongs to the Special Issue Symmetry and Asymmetry in Sport Sciences)
Abstract
:There is no consensus among researchers on the biomechanics of wheelchair propulsion concerning the bilateral symmetry assumption. On one hand, the assumption is advantageous, as it allows for the simplification of data collection, processing, and analysis. It also facilitates the modelling of wheelchair propulsion biomechanics. On the other hand, there are reports that the validity of the bilateral symmetry assumption is unclear. Therefore, the present study aims to analyse the biomechanics of wheelchair propulsion for side-to-side differences. Motion capture techniques based on ArUco with the use of OpenCV libraries were used for this purpose. The research was carried out on a group of 10 healthy and inexperienced volunteers with a semi-circular propulsion pattern, who declared right-handedness. The tests were carried out on a hard, even surface, without an additional load, within the frequency of the propelling phases dictated by sound signals, amounting to 30 BPM. The positions of markers on the hand, elbow, and wrist were analysed. As a result, a cloud of points of the markers’ displacement on the sagittal plane in the propulsion push progress function was obtained. The results were averaged with a breakdown by the right and left hand for individual persons, but also for the entire group of volunteers. A comparative analysis and the mutual position of the confidence intervals of the determined mean values were also performed. The collected data suggest that the mean values for individual participants show greater asymmetry than the mean positions of the markers for the entire group of participants. Therefore, the assumption about the symmetry of upper limb propulsion may not be true when analysing the biomechanics of propulsion for individuals, although it may be accurate when analysing larger groups of persons (participants free of upper-extremity pain or impairment).
1. Introduction
Wheelchairs are basic tools that provides motion for people with disabilities. They are used for rehabilitation purposes [1], but they are also used during sports, such as basketball [2,3], tennis [3,4], and rugby [5,6]. Taken as a whole, the wheelchair and the human body constitute an anthropotechnical system [7,8]. This system can be defined by a series of biomechanical parameters that are interrelated and that interact with each other. The parameters are, inter alia, velocity [9,10] and acceleration [11] but are also alterations of the centre of gravity position [12], for example, during propelling. In addition, the efficiency of such an anthropotechnical system depends on the user’s anatomy [13], the parameters of his or her muscles and muscle activity [14], and the geometry of the wheelchair itself—such as the rear-wheel camber [15] or the seat position [16,17,18]. Additionally, the kinematics of the wheelchair propulsion system can be modified by installing systems supporting its manual propulsion. There are also works and research aimed at such wheelchair design modifications that can allow the load on muscles and joints to be reduced in order to reduce or avoid pain development [19].
Since a human is a part of the discussed system, the ergonomics and effective design of technical solutions in this respect is of particular importance. Such an approach allows the possibility of injuries to be reduced and enhances physical performance regarding wheelchair propelling. Most often, efficiency improvements are achieved through experimental or theoretical methods. A combination approach can also be used. On one hand, experimental research allows for the observation and analysis of the biomechanics of wheelchair propulsion during real working conditions or in laboratory conditions arranged to simulate the real conditions as precisely as possible. Several parameters resulting from the test scenarios (conditions) are analysed, such as the type of activity, type of disability, experience [20], or age [21]. A good example of the effects of direct experiment analysis is stroke pattern classification based on digitised video recordings [22,23].
The biomechanics of the wheelchair propulsion process can be broadly divided into two separate cases related to the kinematics of the left and right upper limbs. Such an assumption seems to be justified by the laterality of the right and left sides of the human body. On the other hand, when analysing the process of wheelchair propelling, the symmetry of both sides of the human body is often assumed. This can be explained by the fact that the asymmetry of propulsion and the lack of the coupling of the wheels results in difficulties in riding in a straight line [24]. Moreover, such a simplified assumption is also advantageous during experiments, as it reduces the amount of equipment necessary for recording the biomechanical parameters. Regarding motion capture techniques, it allows, for example, the use of only one camera. This approach effectively reduces the resources and time needed for such research and for the processing of the recorded data. Although there is a justified possibility to apply the assumption of the symmetry of propulsion to some extent, it is not a clear issue. There are a number of studies focusing on differences concerning side-to-side differences in propulsion mechanics. On one hand, some results suggest that there are no significant differences in symmetry in variables associated with the kinematics [25] and kinetics [26] of wheelchair propulsion. It is also often indicated that there are some differences in the arithmetic mean values of the analysed biomechanical parameters, although the values remain statistically insignificant [25,27]. On the other hand, there are also research results showing differences in similar propulsion variables for the left and the right sides of the body [28,29].
The analysis of this issue suggests that it is unlikely that the biomechanics of wheelchair propulsion of the dominant side are identical to the non-dominant side. Moreover, it is to be expected that the individual propelling phases differ, even in the context of a single limb. The human body cannot perform actions with the accuracy and repeatability of automatons. Therefore, it may be a mistake to assume symmetry in the context of an individual. It is possible to say that a larger scale of asymmetry occurs within two limbs of a single person than in the set of averaged data for a particular side for a certain group of people [27,30,31].
The problem outlined in this way is the subject of the present paper. This research is aimed towards checking the mutual relation of the upper limb kinematics of averaged propelling cycles in the aspect of comparing the right and left sides of the body. In other words, an answer was sought to the following question: what is the mutual relation of deviations from the mean value between the individual propelling cycles for one hand and the mean values recorded for the other hand? It was decided that we would analyse the worst possible case, i.e., people with little experience in propelling a wheelchair.
2. Materials and Methods
2.1. Research Participants
The research included a group of 10 males (test subjects were marked: A1 to A10) aged 26.1 ± 3.04 years, with a bodyweight of 83 ± 8.94 kg and a height of 177.6 ± 6.39 cm. The participants of the research were selected regarding similar propulsion movement stroke patterns (therefore, they were characterised by a semi-circular pattern [32]), and each of them also declared right-handedness. Such a selection of participants was to minimise the risk of the impact of the variables related to the diversity of the group on the recorded results. For the worst-case assessment, people declaring no previous experience in propelling a wheelchair were selected.
Such a choice was justified by the fact that the lack of experience should cause the greatest dispersion of results (the greatest differences) in individual propulsion movements of a given limb. Thus, an analysis of such results allows for the assessment of the greatest possible differences in mean values recorded for individual limbs, i.e., the worst-case scenario. Naturally, it should be noted at this point that, most likely, the results for people experienced in propelling wheelchairs would have a smaller spread. More experienced users are expected to develop more symmetrical propulsion mechanics and more energy-efficient movements [27]. The volunteers were recruited from a group of students from Poznań University of Technology and provided written informed consent. The research conducted as part of the project was positively assessed by the bioethics commission at Poznań Medical University (commission resolution no. 513/21 of 24 June 2021).
2.2. Data Collection
The research participants were supposed to ride the wheelchair inside a building, on a flat and hard surface in such a way that it moved along a straight line, with the data for each arm being recorded separately. To ensure the normalisation of the push-off pace, study participants were asked to perform individual propelling phases to the beat of a metronome set to 30 BPM, which translated into an average drive phase every 1.79 ± 0.16 s.
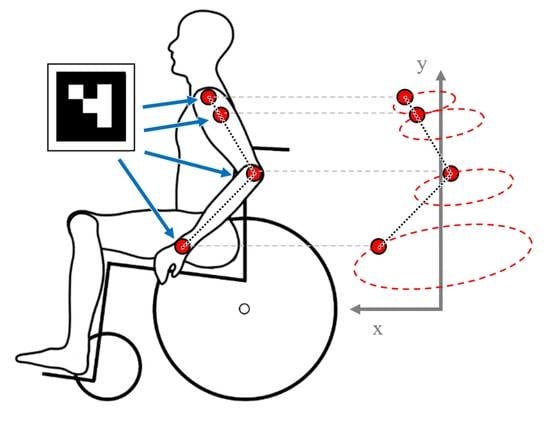
For motion capture, OpenCV libraries [33], based on the detection of ArUco markers, were used. It should be noted, however, that markerless motion analysis systems for manual wheelchairs can also be distinguished [34]. As part of the research, five markers (ID0-ID4) with dimensions of 40 × 40 mm were used to determine the trajectory of movement of the upper limb. One stationary marker was placed at the axis of rotation of the larger wheel (ID0). The next four that remained in motion were placed on: the wrist (ID1), the elbow (ID2), slightly under the shoulder (ID3), and on the shoulder (ID4). The locations of the markers on the researched person’s limb are shown in Figure 1. A fixed GoPro hero7 camera (GoPro, Inc., San Mateo, CA, USA) was used to record the image in a resolution of 720 p at 240 fps. The successively recorded video streams were processed using software developed by the authors using the OpenCV library. It allowed the positions of the markers placed on the joints of the upper limb for the fixed (ID0) marker to be determined. In this way, a cloud of points was obtained reflecting the position of individual markers, i.e., the wrist, the elbow, and the shoulder of the tested person while propelling the wheelchair with the use of handrims.
Marker ID3 was used, as needed, to derive and correct the position of marker ID4. It was dictated by the fact that there were cases where marker ID4 was not visible to the camera due to the movement of the hand of the person propelling the wheelchair. In some situations, the positioning of the marker in relation to the plane of the recording device prevented its correct recognition by the position-detecting software (its rotation plane deviated too far from the sagittal plane). The cloud of points collected in this way had to be further processed to be used for calculations. For this purpose, the data set for marker ID4 was smoothed with the simple moving average value with the width window of the last 30 data points.
2.3. Data Processing
For further calculations, 5 full propelling cycles were taken into consideration for each limb—right and left. For example, the calculation did not account for the propelling cycles with attempts to correct the rectilinear movement of the wheelchair, considering them ”incomplete“ (it happened that the researched person did not perform the full propelling cycle but only a partial one to correct movement trajectory). The mean curves were determined from the cloud of points collected in this way, illustrating the positions of the sagittal plane markers on the x and y axes (Figure 1). The measurements for the left hand were mirrored in sequence with respect to the y axis; therefore, the coordinate systems for the left and right hands coincided (compare “a” and “b” in Figure 1). It was necessary because, during the measurements, the positive part of the x axis was always assumed in the direction of the wheelchair’s movement to standardise the set of data. The mean curves from 5 propelling cycles were adopted as the estimators of the search value, and the confidence interval was estimated following the t-Student distribution for the significance level of α = 0.05.
An attempt was also made to evaluate the source of the differentiation of results regarding the right and left limbs. For this purpose, the variability of the features in the distributions for each limb was determined in accordance with the relationship (1):
where is the coefficient of variation, is the mean value measurement uncertainty, and is the mean value of the position of a given marker on the x or y axes.
3. Results and Discussion
Figure 2 presents a view of the set of averaged results for the right and left hands of the research participants: A1, A2, A3, and A6. Figure 3 and Figure 4 show the mean ID1 and ID4 marker position changes over the course of the propelling cycle for the left and right hands, respectively. The graphs show the displacements on both the x and y axes. The purpose of this was to show which parts of the push progress and displacements on which axes were the greater sources of the position range changes. Figure 5, Figure 6 and Figure 7 show the averaged positions of the ID1, ID2 and ID4 markers in juxtaposition for the left and right sides of the selected research participants. The graphs show the positions of individual markers as the push progress function. This should be understood as the percentage advancement of the propelling phase, where 0% is the beginning of the movement, and 100% is the end of it. Therefore, going from 0% to 100% push progress is equal to one propulsion cycle. The analysis of the presented charts shows that there are some differences between the left and right hands in the averaged curves of displacement on the x and y axes for each of the selected research participants. It was observed that greater side-to-side differences were recorded for the ID4 marker than for the other markers. However, it is particularly important to compare the mutual position of the confidence intervals for the average curves determined. It can be observed that, in most cases, the mean values for the left and right hands are contained in the confidence intervals of the opposite limbs (especially for the ID1 and ID2 markers, located on the hand and elbow, respectively; this applies to a lesser extent to the ID4 marker located on the arm). Nevertheless, there are also such large differences that the average position and confidence intervals of the given markers on the right and left hands do not coincide. It is clearly seen, e.g., in the final part of the chart in Figure 3 and Figure 7. This is due to the differences in the positions of the markers within the curves, based on which the mean values were determined. The conclusion is that the differences observed between the left and right limbs are most likely caused by significant differences in the relative position of the markers (and not the dispersion of their positions) within the individual propelling cycles that comprise the mean curves.
The average curves were determined successively, not accounting for the individual research participants, but only with divisions into the left and right sides of the body (in other words, the positions of markers for all left and right hands were averaged). Figure 8 and Figure 9 present the averaged curves (AVG) of the change in the position of the ID1 marker on the x and y axes during the propelling cycle for all research participants, separately for the right and left limbs. Figure 10 shows the averaged curves (AVG) of the ID2 marker of all research participants for the right and left hands, respectively.
An observation of the data provided allows one to notice, again, that the confidence intervals of the determined curves overlap only to a certain extent. However, no lack of common parts of the confidence intervals was observed, as in the case of comparing the results for the right and left hand with a breakdown by individual participants. Averaging the results of all research participants for the left and right hands reduced the differences between the recorded curves, but in many cases, it widened the confidence intervals. This can be clearly seen by comparing, for example, Figure 3, Figure 4, Figure 5, Figure 6, Figure 7 and Figure 8 and Figure 6, Figure 7, Figure 8, Figure 9 and Figure 10. Table 1 presents a summary of the largest determined values of the confidence interval for individual participants in comparison with the averaged values. The analysis of the table shows that half of the values for individual participants are greater than the averaged values for the entire group of research participants. Such observations may prove that, for individual participants, greater asymmetries were observed in the movement of the right and left limbs than in the mean value calculated for the entire study group, which is consistent with the observations of other researchers [27,30,31]. Thus, the symmetry assumption of the upper limb propulsive movement may not be true in the case of the analysis of wheelchair propulsion biomechanics for individual people. It should be noted that the tests were performed in fairly mild conditions, i.e., without additional loads (such as riding uphill or on a soft surface), and the research participants were people not affected by diseases of the locomotor system. As indicated in [27], asymmetry may be affected by the magnitude of the load when the power demand of the upper limbs is increased. It was also established in [35] that research participants with multiple sclerosis show greater symmetry than able-bodied participants and participants with spinal cord injuries.
A summary of the greatest determined values for coefficient with a breakdown by individual markers and the left and the right limbs is presented in Table 2. According to the analysis of the values presented in the table, it is not possible to unequivocally assess which limb generates greater deviations from the mean value. Therefore, it should be stated that, within the group of research participants, it is not possible to clearly indicate whether the leading limb provides a smaller scatter of the recorded results.
A potential limitation of this study is that measurements were obtained with one recording device separately for each limb. However, the tests were performed without loads in comfortable conditions and at a low speed of the wheelchair; therefore, potential systematic differences between the tests resulting from fatigue of the research participants should be small, if any. Additionally, efforts were made to minimise potential differences by random selection of the test sequence for the left and right limbs.
Another limitation results from the selection of a group of healthy people for the purpose of the research. This decision was dictated by an attempt to analyse the maximum observable changes. It should be expected that, as a wheelchair user’s experience grows, the precision of the propelling movements increases. Thus, the range of moves performed by limbs during propulsion decreases, which is caused by the pursuit of greater energy efficiency in the process.
Research on a larger population should be considered an obvious extension and supplementation of the work that was carried out. In particular, people with more experience in propelling a wheelchair should be examined. The combination of experienced and inexperienced users can allow for assessing the scatter of the data resulting from a lack of training in the performance of the propelling motion. The direction of future work may also focus on testing a similar scenario during propelling a wheelchair on a treadmill or ergometer to assess whether such experimental variants affect the kinematics of upper limb movements.
4. Conclusions
Based on the collected data and the analyses performed, it can be concluded that:
- In some cases, large differences were observed between the average markers’ locations on the left and right limbs.
- The average markers’ locations for individual research participants are characterised by greater asymmetry than the average markers’ locations for the entire group of participants.
- In the group of research participants, the leading hand did not generate a noticeably smaller deviation from the averaged location of the markers.
Author Contributions
Conceptualisation, M.K.; methodology, M.K.; software, W.M.; validation, M.K. and W.M.; formal analysis, M.K.; investigation, M.K. and W.M.; resources, M.K.; data curation, M.K. and W.M.; writing—original draft preparation, M.K.; writing—review and editing, M.K. and W.M.; visualisation, M.K.; supervision, M.K.; project administration, M.K.; funding acquisition, M.K. All authors have read and agreed to the published version of the manuscript.
Funding
This research is a part of the project: “Innovative Drive Systems for Wheelchairs—Design, Prototype, Research”, number: “Rzeczy są dla ludzi/0004/2020”, financed by the National Centre for Research and Development, https://www.gov.pl/web/ncbr (accessed on 1 June 2022).
Institutional Review Board Statement
This study was accepted by the Bioethical Commission at Karol Marcinkowski Medical University in Poznań, Poland (Resolution No. 513/21 of 24 June 2021, under the guidance of MD M. Krawczyński for the research team led by M. Kukla).
Informed Consent Statement
Informed consent was obtained from all subjects involved in the study.
Data Availability Statement
The data that support the findings of this study are available from the corresponding author upon reasonable request.
Conflicts of Interest
The authors declare no conflict of interest.
References
- Warguła, Ł.; Marciniak, A. The Symmetry of the Muscle Tension Signal in the Upper Limbs When Propelling a Wheelchair and Innovative Control Systems for Propulsion System Gear Ratio or Propulsion Torque: A Pilot Study. Symmetry 2022, 14, 1002. [Google Scholar] [CrossRef]
- Vanlandewijck, Y.C.; Theisen, D.; Daly, D. Wheelchair Propulsion Biomechanics. Sports Med. 2001, 31, 339–367. [Google Scholar] [CrossRef] [PubMed]
- Croft, L.; Dybrus, S.; Lenton, J.; Goosey-Tolfrey, V. A Comparison of the Physiological Demands of Wheelchair Basketball and Wheelchair Tennis. Int. J. Sports Physiol. 2022, 5, 301–315. [Google Scholar] [CrossRef] [PubMed] [Green Version]
- Richardson, E.V.; Papathomas, A.; Smith, B.; Victoria, L.G.-T. The psychosocial impact of wheelchair tennis on participants from developing countries. Disabil. Rehabil. 2017, 39, 193–200. [Google Scholar] [CrossRef] [PubMed] [Green Version]
- Bauerfeind, J.; Koper, M.; Wieczorek, J.; Urbański, P.; Tasiemski, T. Sports Injuries in Wheelchair Rugby—A. Pilot Study. J. Hum. Kinet. 2015, 48, 123–132. [Google Scholar] [CrossRef] [Green Version]
- Barfield, J.P.; Malone, L.A.; Arbo, C.; Jung, A.P. Exercise intensity during wheelchair rugby training. J. Sports Sci. 2010, 28, 389–398. [Google Scholar] [CrossRef]
- Wieczorek, B.; Warguła, Ł. Problems of dynamometer construction for wheelchairs and simulation of push motion. MATEC Web Conf. 2019, 254, 01006. [Google Scholar] [CrossRef]
- Wieczorek, B.; Warguła, Ł.; Rybarczyk, D. Impact of a Hybrid Assisted Wheelchair Propulsion System on Motion Kinematics during Climbing up a Slope. Appl. Sci. 2020, 10, 1025. [Google Scholar] [CrossRef] [Green Version]
- Veeger, E.H.; Van Der Woude, L.H.; Rozendal, R.H. Effect of handrim velocity on mechanical efficiency in wheelchair propulsion. Med. Sci. Sports Exerc. 1992, 24, 100–107. [Google Scholar] [CrossRef]
- Gil-Agudo, A.; Del Ama-Espinosa, A.; Pérez-Rizo, E.; Pérez-Nombela, S.; Crespo-Ruiz, B. Shoulder joint kinetics during wheelchair propulsion on a treadmill at two different speeds in spinal cord injury patients. Spinal Cord. 2010, 48, 290–296. [Google Scholar] [CrossRef] [Green Version]
- Coutts, K.D. Kinematics of sport wheelchair propulsion. J. Rehabil. Res. Dev. 1990, 27, 21–26. [Google Scholar] [CrossRef]
- Wieczorek, B.; Kukla, M.; Warguła, Ł. Methods for measuring the position of the centre of gravity of an anthropotechnics human-wheelchair system in dynamic conditions. Mater. Sci. Eng. Conf. Ser. 2020, 776, 012062. [Google Scholar] [CrossRef]
- Leary, M.; Gruijters, J.; Mazur, M.; Subic, A.; Burton, M.; Fuss, F.K. A fundamental model of quasi-static wheelchair biomechanics. Med. Eng. Phys. 2012, 34, 1278–1286. [Google Scholar] [CrossRef]
- Mulroy, S.J.; Gronley, J.K.; Newsam, C.J.; Perry, J. Electromyographic activity of shoulder muscles during wheelchair propulsion by paraplegic persons. Arch. Phys. Med. Rehabil. 1996, 77, 187–193. [Google Scholar] [CrossRef]
- Tsai, C.-Y.; Lin, C.-J.; Huang, Y.-C.; Lin, P.-C.; Su, F.-C. The effects of rear-wheel camber on the kinematics of upper extremity during wheelchair propulsion. BioMed. Eng. OnLine 2012, 11, 87. [Google Scholar] [CrossRef] [Green Version]
- Richter, W.M. The effect of seat position on manual wheelchair propulsion biomechanics: A quasi-static model-based approach. Med. Eng. Phys. 2001, 23, 707–712. [Google Scholar] [CrossRef]
- Hughes, C.J.; Weimar, W.H.; Sheth, P.N.; Brubaker, C.E. Biomechanics of wheelchair propulsion as a function of seat position and user-to-chair interface. Arch. Phys. Med. Rehabil. 1992, 73, 263–269. [Google Scholar]
- Kotajarvi, B.R.; Sabick, M.B.; An, K.N.; Zhao, K.D.; Kaufman, K.R.; Basford, J.R. The effect of seat position on wheelchair propulsion biomechanics. J. Rehabil. Res. Dev. 2004, 41, 403–414. [Google Scholar] [CrossRef]
- Kulig, K.; Sreesha, S.R.; Sara, J.M.; Craig, J.N.; JoAnne, K.G.; Ernest, L.B.; Jacquelin, P. Shoulder joint kinetics during the push phase of wheelchair propulsion. Clin. Orthop. Relat. Res. 1998, 354, 132–143. [Google Scholar] [CrossRef] [PubMed]
- de Groot, S.; de Bruin, M.; Noomen, S.P.; van der Woude, L.H. Mechanical efficiency and propulsion technique after 7 weeks of low-intensity wheelchair training. Clin. Biomech. 2008, 23, 434–441. [Google Scholar] [CrossRef]
- Slavens, B.A.; Schnorenberg, A.G.; Aurit, C.M.; Graf, A.; Krzak, J.J.; Reiners, K.; Vogel, L.C.; Harris, G.F. Evaluation of Pediatric Manual Wheelchair Mobility Using Advanced Biomechanical Methods. Biomed. Res. Int. 2015, 2015, 634768. [Google Scholar] [CrossRef] [Green Version]
- Boninger, M.L.; Souza, A.L.; Cooper, R.A.; Fitzgerald, S.G.; Koontz, A.M.; Fay, B.T. Propulsion patterns and pushrim biomechanics in manual wheelchair propulsion. Arch. Phys. Med. Rehabil. 2002, 83, 718–723. [Google Scholar] [CrossRef]
- de Groot, S.; Veeger, H.E.J.; Hollander, A.P.; van der Woude, L.H.V. Effect of wheelchair stroke pattern on mechanical efficiency. Am. J. Phys. Med. Rehabil. 2004, 83, 640–649. [Google Scholar] [CrossRef]
- de Groot, S.; Veeger, D.H.; Hollander, A.P.; Van der Woude, L.H. Wheelchair propulsion technique and mechanical efficiency after 3 weeks of practice. Med. Sci. Sports Exerc. 2002, 34, 756–766. [Google Scholar] [CrossRef] [PubMed] [Green Version]
- Goosey, V.L.; Campbell, I.G. Symmetry of the elbow kinematics during racing wheelchair propulsion. Ergonomics 1998, 41, 1810–1820. [Google Scholar] [CrossRef] [PubMed]
- Hurd, W.J.; Morrow, M.M.; Kaufman, K.R.; An, K.N. Influence of varying level terrain on wheelchair propulsion biomechanics. Am. J. Phys. Med. Rehabil. 2008, 87, 984–991. [Google Scholar] [CrossRef] [PubMed] [Green Version]
- Soltau, S.L.; Slowik, J.S.; Requejo, P.S.; Mulroy, S.J.; Neptune, R.R. An investigation of bilateral symmetry during manual wheelchair propulsion. Front. Bioeng. Biotechnol. 2015, 3, 86. [Google Scholar] [CrossRef]
- Hurd, W.J.; Morrow, M.M.; Kaufman, K.R.; An, K.N. Biomechanic evaluation of upper-extremity symmetry during manual wheelchair propulsion over varied terrain. Arch. Phys. Med. Rehabil. 2008, 89, 1996–2002. [Google Scholar] [CrossRef] [Green Version]
- Stephens, C.L.; Engsberg, J.R. Comparison of overground and treadmill propulsion patterns of manual wheelchair users with tetraplegia. Disabil. Rehabil. Assist. Technol. 2010, 5, 420–427. [Google Scholar] [CrossRef] [PubMed]
- Koontz, A.M.; Cooper, R.A.; Boninger, M.L. An autoregressive modeling approach to analyzing wheelchair propulsion forces. Med. Eng. Phys. 2001, 23, 285–291. [Google Scholar] [CrossRef]
- Schnorenberg, A.J.; Slavens, B.A.; Wang, M.; Vogel, L.C.; Smith, P.A.; Harris, G.F. Biomechanical model for evaluation of pediatric upper extremity joint dynamics during wheelchair mobility. J. Biomech. 2014, 47, 269–276. [Google Scholar] [CrossRef] [PubMed] [Green Version]
- Shimada, S.D.; Robertson, R.N.; Bonninger, M.L.; Cooper, R.A. Kinematic characterization of wheelchair propulsion. J. Rehabil. Res. Dev. 1998, 35, 210–218. [Google Scholar] [PubMed]
- Lebedev, I.; Erashov, A.; Shabanova, A. Accurate Autonomous UAV Landing Using Vision-Based Detection of ArUco-Marker. In Proceedings of the 5th International Conference on Interactive Collaborative Robotics (ICR 2020), St. Petersburg, Russia, 7–9 October 2020; pp. 179–188. [Google Scholar]
- Rammer, J.; Brooke, S.; Joseph, K.; Jack, W.; Susan, R.; Gerald, H. Assessment of a markerless motion analysis system for manual wheelchair application. J. Neuroeng. Rehabil. 2018, 15, 96. [Google Scholar] [CrossRef] [PubMed]
- Fay, B.T.; Boninger, M.L.; Fitzgerald, S.G.; Souza, A.L.; Cooper, R.A.; Koontz, A.M. Manual wheelchair pushrim dynamics in people with multiple sclerosis. Arch. Phys. Med. Rehabil. 2004, 85, 935–942. [Google Scholar] [CrossRef]
Figure 1.
The locations of markers on the researched person’s limb and the assumed marking of the coordinate axes are shown for (a) the left hand and (b) the right hand.
Figure 1.
The locations of markers on the researched person’s limb and the assumed marking of the coordinate axes are shown for (a) the left hand and (b) the right hand.

Figure 2.
A view of the set of averaged results for the right and left hands of research participants A1, A2, A3, and A6.
Figure 2.
A view of the set of averaged results for the right and left hands of research participants A1, A2, A3, and A6.

Figure 3.
The average curve of the ID1 marker position change during the propelling cycle on the x axis for the left and right hand (the thick line); the thin lines are ± confidence interval; Participant A2.
Figure 3.
The average curve of the ID1 marker position change during the propelling cycle on the x axis for the left and right hand (the thick line); the thin lines are ± confidence interval; Participant A2.

Figure 4.
The average curve of the ID4 marker position change during the propelling cycle on the y axis for the left and right hand (the thick line); the thin lines are ± confidence interval; Participant A2.
Figure 4.
The average curve of the ID4 marker position change during the propelling cycle on the y axis for the left and right hand (the thick line); the thin lines are ± confidence interval; Participant A2.

Figure 5.
The averaged positions of the ID1 marker for the left and right side of participant A9; the error bars marked in grey are ± measurement uncertainty for the left limb.
Figure 5.
The averaged positions of the ID1 marker for the left and right side of participant A9; the error bars marked in grey are ± measurement uncertainty for the left limb.

Figure 6.
The averaged positions of the ID2 marker for the left and right side of participant A9; the error bars marked in grey are ± measurement uncertainty for the left limb.
Figure 6.
The averaged positions of the ID2 marker for the left and right side of participant A9; the error bars marked in grey are ± measurement uncertainty for the left limb.

Figure 7.
The averaged positions of the ID4 marker for the left and right side of participant A7; the error bars marked in grey are ± measurement uncertainty for the left limb.
Figure 7.
The averaged positions of the ID4 marker for the left and right side of participant A7; the error bars marked in grey are ± measurement uncertainty for the left limb.

Figure 8.
Change in the position of the ID1 marker on the x axis of the set of averaged results for all research participants for the left and right hands, respectively (the thick line); the thin lines are ± confidence interval.
Figure 8.
Change in the position of the ID1 marker on the x axis of the set of averaged results for all research participants for the left and right hands, respectively (the thick line); the thin lines are ± confidence interval.

Figure 9.
Change in the position of the ID1 marker on the y axis of the set of averaged results for all research participants for the left and right hands, respectively (the thick line); the thin lines are ± confidence interval.
Figure 9.
Change in the position of the ID1 marker on the y axis of the set of averaged results for all research participants for the left and right hands, respectively (the thick line); the thin lines are ± confidence interval.

Figure 10.
Position of the ID2 marker for the left and right hands averaged for all research participants; the error bars marked in grey are ± measurement uncertainty for the left limb.
Figure 10.
Position of the ID2 marker for the left and right hands averaged for all research participants; the error bars marked in grey are ± measurement uncertainty for the left limb.


Table 1.
A summary of the greatest determined values of the confidence interval for individual participants in comparison with the averaged values. All values are given in mm.
Table 1.
A summary of the greatest determined values of the confidence interval for individual participants in comparison with the averaged values. All values are given in mm.
| Test Subject Number | Right or Left Side, Marker Number, and Axis | |||||
|---|---|---|---|---|---|---|
| R ID1 x | R ID1 y | R ID2 x | R ID2 y | R ID4 x | R ID4 y | |
| A1 | 48.94 | 50.54 | 48.15 | 46.21 | 27.56 | 31.02 |
| A2 | 89.10 | 27.95 | 57.88 | 31.84 | 21.24 | 22.06 |
| A3 | 55.06 | 27.75 | 32.82 | 28.20 | 23.95 | 37.19 |
| A4 | 45.89 | 54.36 | 34.88 | 30.45 | 18.06 | 25.89 |
| A5 | 60.47 | 26.49 | 67.64 | 53.94 | 24.58 | 41.43 |
| A6 | 46.11 | 54.63 | 44.12 | 30.83 | 19.21 | 25.95 |
| A7 | 67.45 | 55.17 | 46.14 | 59.54 | 26.51 | 47.38 |
| A8 | 71.33 | 42.56 | 43.57 | 52.09 | 30.05 | 49.76 |
| A9 | 48.02 | 57.91 | 49.74 | 50.40 | 13.53 | 18.01 |
| A10 | 48.02 | 57.91 | 49.74 | 50.40 | 18.27 | 30.50 |
| AVG | 112.12 | 37.51 | 47.10 | 28.48 | 30.03 | 23.34 |
| L ID1 x | L ID1 y | L ID2 x | L ID2 y | L ID4 x | L ID4 y | |
| A1 | 97.72 | 50.18 | 97.72 | 50.18 | 15.61 | 17.44 |
| A2 | 64.07 | 33.61 | 24.04 | 39.13 | 16.51 | 23.85 |
| A3 | 80.28 | 43.15 | 80.28 | 43.15 | 14.75 | 28.31 |
| A4 | 64.74 | 34.09 | 64.74 | 34.09 | 53.04 | 31.46 |
| A5 | 57.18 | 25.30 | 57.18 | 25.30 | 20.80 | 31.75 |
| A6 | 62.81 | 35.28 | 62.81 | 35.28 | 19.50 | 28.81 |
| A7 | 78.71 | 42.19 | 78.71 | 42.19 | 16.57 | 31.96 |
| A8 | 49.37 | 37.83 | 49.37 | 37.83 | 14.95 | 25.46 |
| A9 | 55.67 | 30.38 | 28.97 | 34.95 | 13.53 | 18.01 |
| A10 | 55.67 | 30.38 | 55.67 | 30.38 | 19.50 | 28.81 |
| AVG | 76.74 | 29.70 | 49.17 | 25.72 | 31.75 | 25.91 |
Table 2.
Values of coefficient with a breakdown by individual markers and the left and the right limbs. All values are given in %.
Table 2.
Values of coefficient with a breakdown by individual markers and the left and the right limbs. All values are given in %.
| Test Subject Number | Right or Left Side and Marker Number | |||||
|---|---|---|---|---|---|---|
| R ID1 | R ID2 | R ID4 | L ID1 | L ID2 | L ID4 | |
| A1 | 30.15 | 9.87 | 4.64 | 38.14 | 9.20 | 2.59 |
| A2 | 10.83 | 7.06 | 3.72 | 21.62 | 8.51 | 3.78 |
| A3 | 21.15 | 6.52 | 6.14 | 23.37 | 7.12 | 4.75 |
| A4 | 32.04 | 6.34 | 4.20 | 23.19 | 7.50 | 4.92 |
| A5 | 21.53 | 10.55 | 6.20 | 16.14 | 7.60 | 4.65 |
| A6 | 46.02 | 7.24 | 4.22 | 21.12 | 9.80 | 4.67 |
| A7 | 38.86 | 13.16 | 7.51 | 31.36 | 7.73 | 5.10 |
| A8 | 27.31 | 10.56 | 7.69 | 26.37 | 6.60 | 3.76 |
| A9 | 23.78 | 10.32 | 2.65 | 30.47 | 7.53 | 2.65 |
| A10 | 27.51 | 11.24 | 4.89 | 43.96 | 8.25 | 4.86 |
Publisher’s Note: MDPI stays neutral with regard to jurisdictional claims in published maps and institutional affiliations. |
© 2022 by the authors. Licensee MDPI, Basel, Switzerland. This article is an open access article distributed under the terms and conditions of the Creative Commons Attribution (CC BY) license (https://creativecommons.org/licenses/by/4.0/).
Share and Cite
MDPI and ACS Style
Kukla, M.; Maliga, W. Symmetry Analysis of Manual Wheelchair Propulsion Using Motion Capture Techniques. Symmetry 2022, 14, 1164. https://doi.org/10.3390/sym14061164
AMA Style
Kukla M, Maliga W. Symmetry Analysis of Manual Wheelchair Propulsion Using Motion Capture Techniques. Symmetry. 2022; 14(6):1164. https://doi.org/10.3390/sym14061164
Chicago/Turabian StyleKukla, Mateusz, and Wojciech Maliga. 2022. "Symmetry Analysis of Manual Wheelchair Propulsion Using Motion Capture Techniques" Symmetry 14, no. 6: 1164. https://doi.org/10.3390/sym14061164
Note that from the first issue of 2016, this journal uses article numbers instead of page numbers. See further details here.