2.1. Experimental Procedure
A convenience sample of 29 healthy young participants (eight females, 28.3 ± 2.7 years, 173.4 ± 8.8 cm, 69.7 ± 14.2 kg, mean ± standard deviation (SD)) was recruited. They were screened to ensure that no participant had any illnesses, neuromuscular injuries or previous surgeries that might affect their balance and gait. The University of Manitoba Human Research Ethics Committee approved the study and all participants signed the informed consent form prior to the tests.
Participants were asked to walk on an instrumented Bertec treadmill (Bertec Corporation, Columbus, OH, USA) under three different walking conditions:
- (a)
Walk only (WO) trial of 1 min at a speed of 1.0 m/s, and
- (b)
Dual-task (DT) walking trial of 1 min at a speed of 1.0 m/s, which is described below, and
- (c)
Walk only trial of 1 min at a speed of 1.3 m/s (WO-1.3).
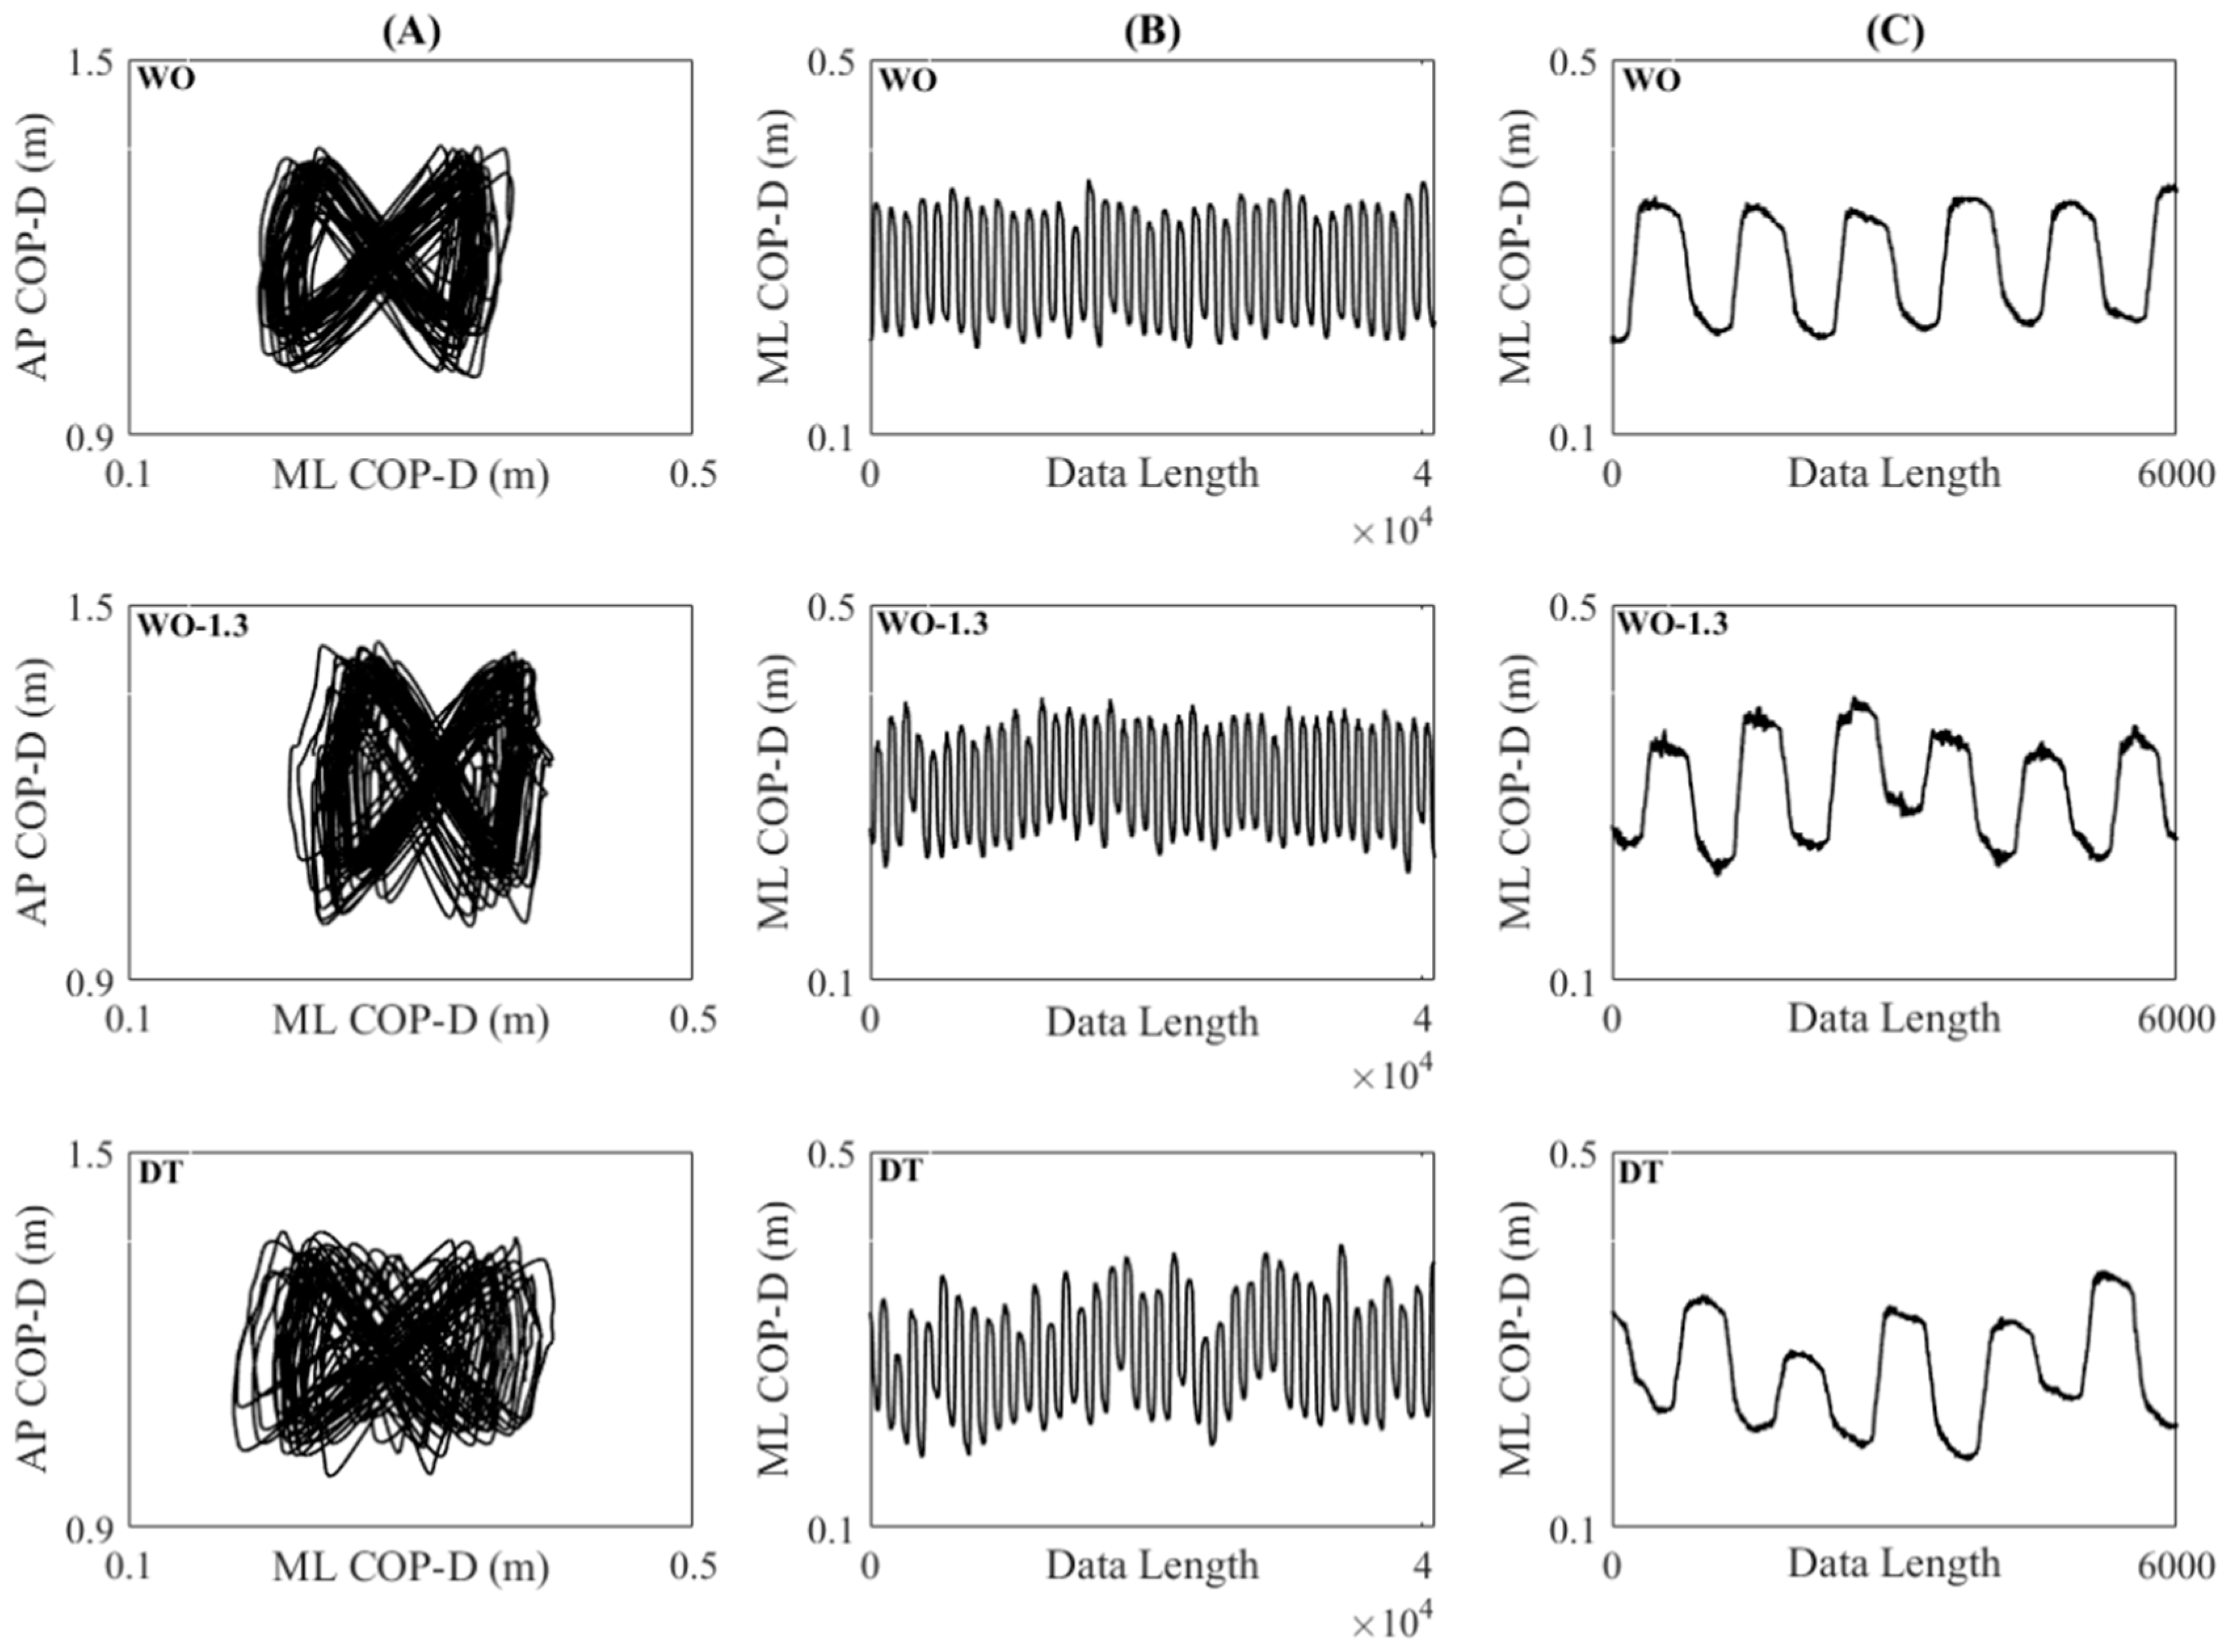
Center of pressure displacements in the mediolateral (ML COP-D) and anteroposterior (AP COP-D) directions (
Figure 1) were calculated from the force and moment components, which were sampled at 1000 Hz. Forty seconds of each signal, which contained at least 30 strides [
16], were used after discarding approximately the first 4 strides.
During all walking trials, participants viewed an 80 cm computer monitor positioned 1 meter away at eye level. During the WO trials, participants watched a scenery video to maintain gaze and head position relative to the monitor. For the purpose of hands-free interaction with game activities, a commercial inertial-based wireless mouse (Elite mouse, SMK Electronics, Chula Vista, CA, USA) was mounted on a plastic headband worn by each participant. Therefore, during walking, the head rotation was used to control the motion of the computer cursor. The goal of the game was to move a game paddle horizontally to interact with moving game objects. The game objects were categorized as designated targets or designated distractors, with the shape of a soccer ball and dotted sphere, respectively. They appeared at random locations at the top of the display every 2 s and moved diagonally toward the bottom of the display. In response to each “game event” (target appearance), the participant produced a head rotation (i.e., rotation of the motion-sense mouse) to move the game paddle (left/right) to catch the target objects and avoid the distractors. For a full description of the interactive cognitive computer game, see Szturm et al. [
29].
2.3. Data Analysis
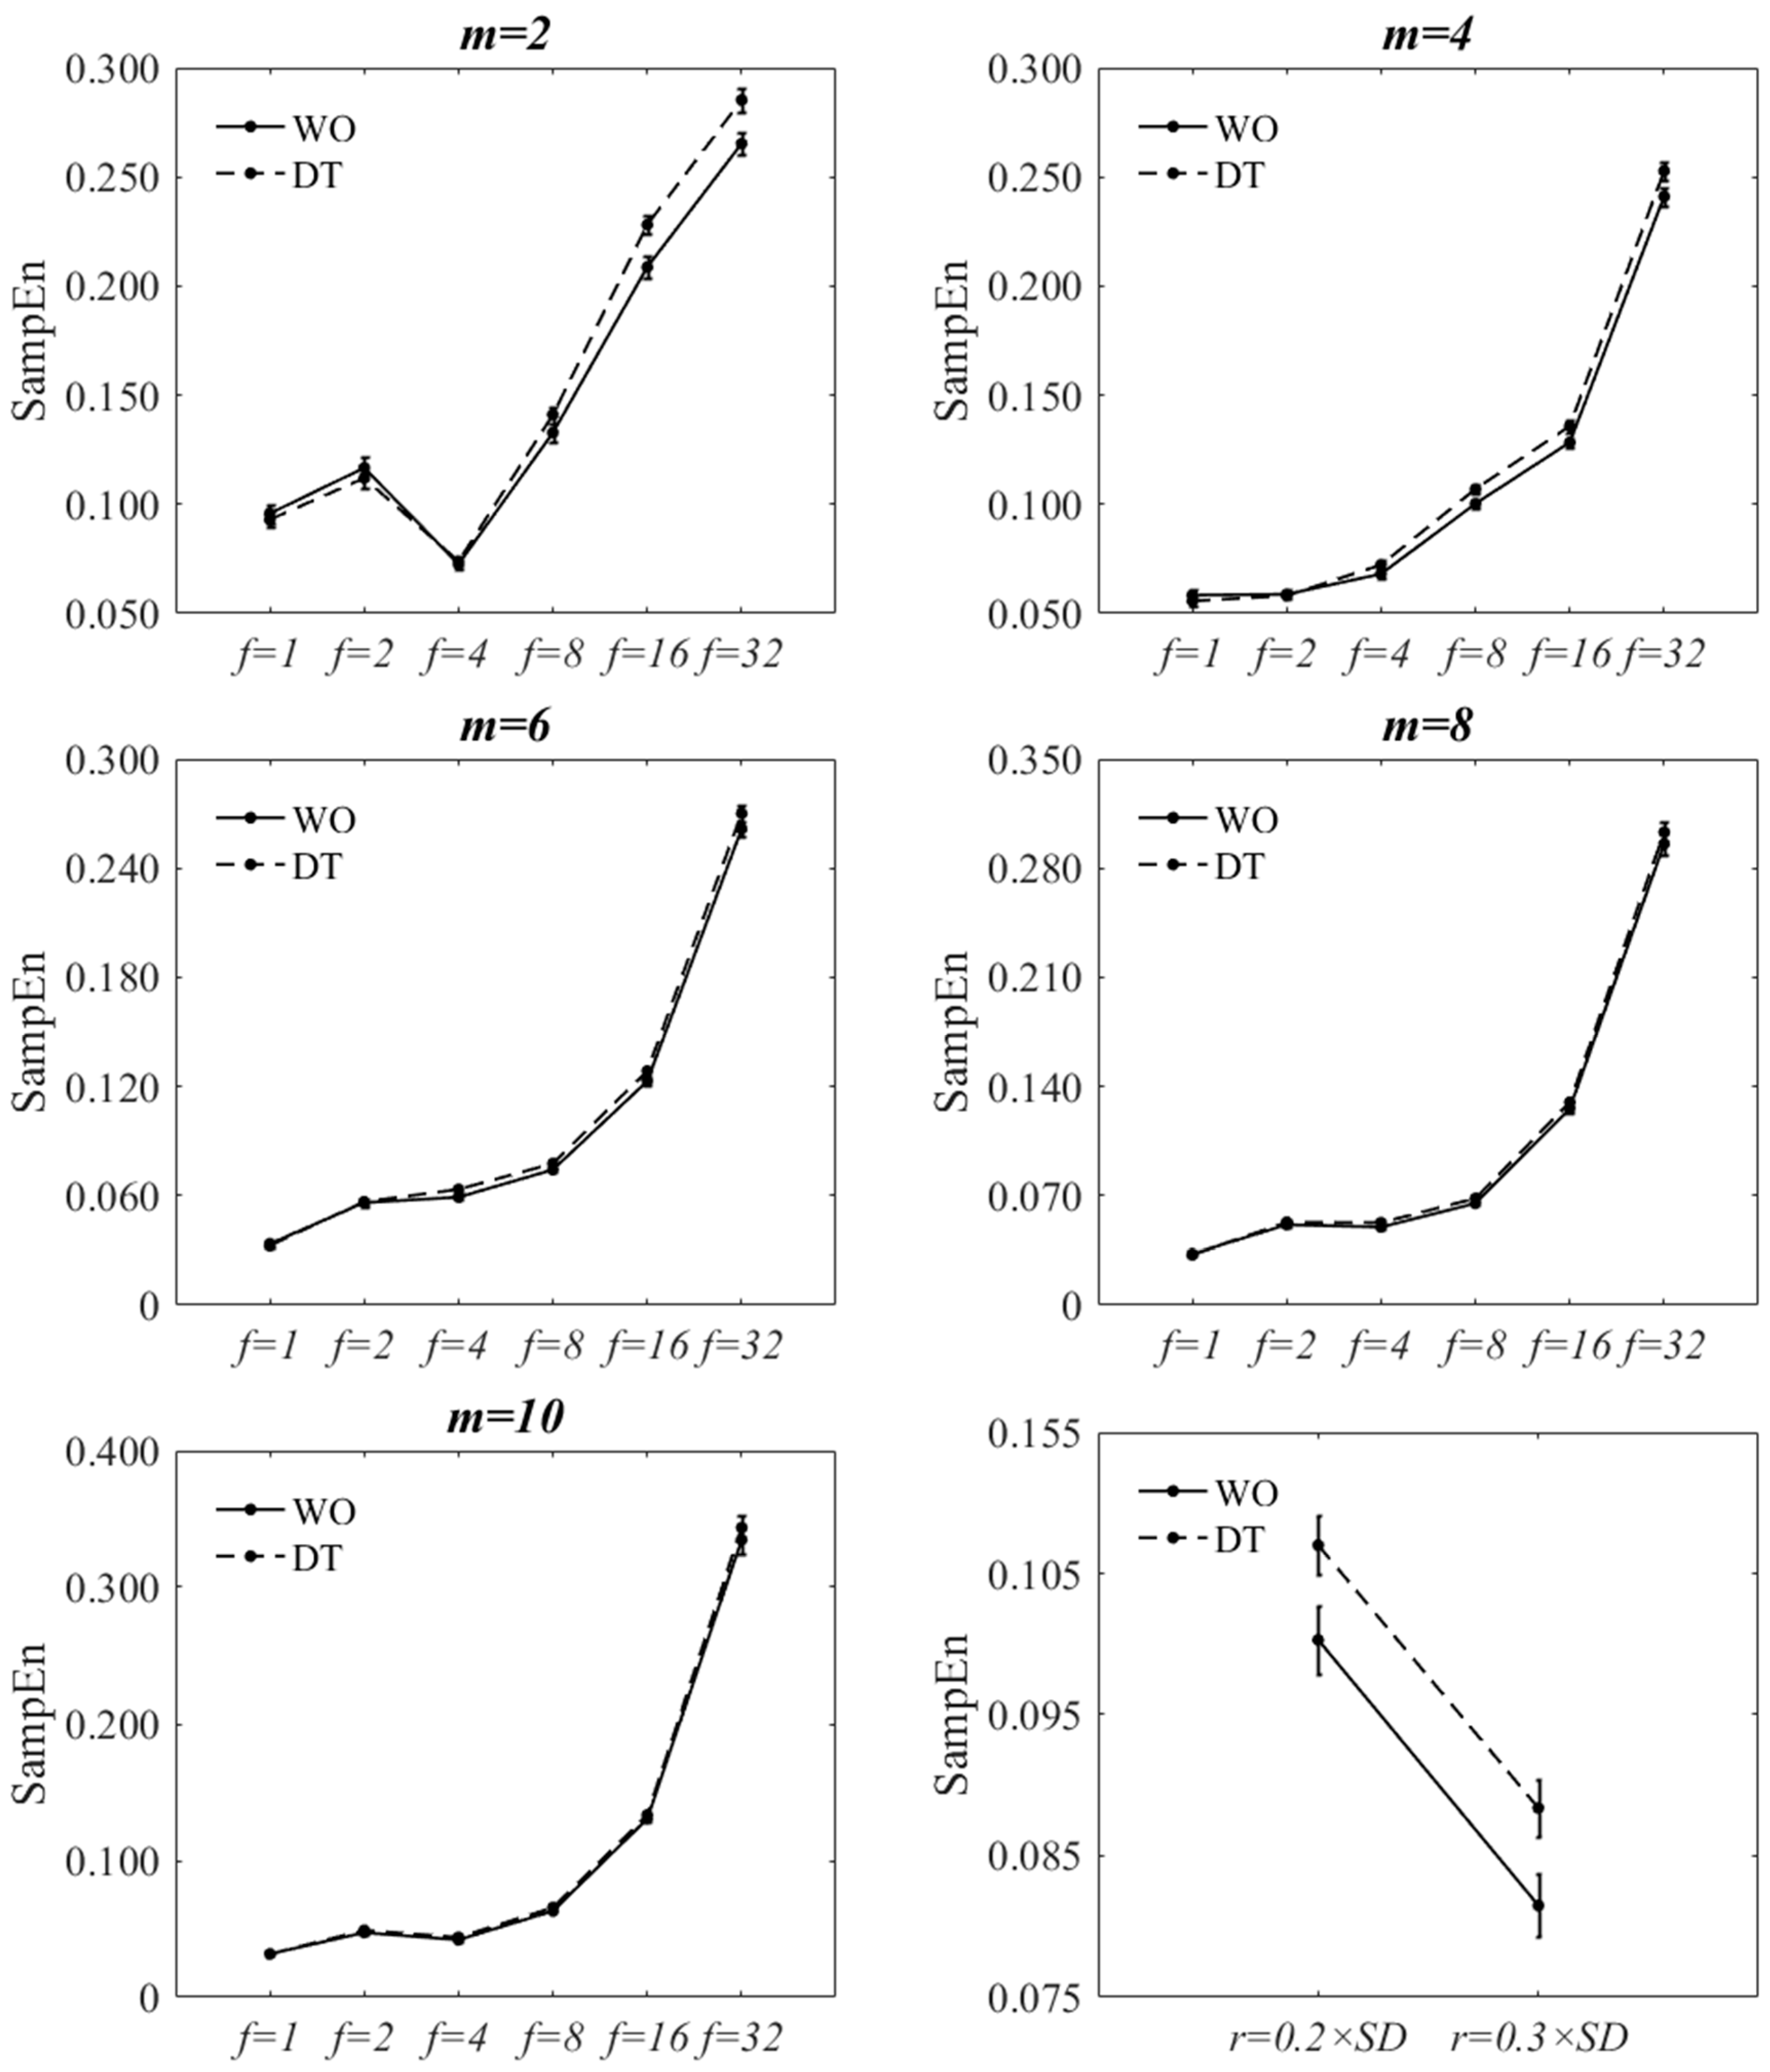
This study consists of two parts. In the first part, the sensitivity of SampEn to changing
m,
r, and sampling rate was investigated when comparing WO to DT. Two methods were used to downsample signals from 1000 Hz to lower sampling rates (
Table 1). The goal was to downsample signals by factors of 1, 2, 4, 8, 16 and 32. The first method, decimation (D) by a factor of
f, used an eighth-order low-pass Chebyshev Type I filter, which filtered the signal in forward and reverse directions to remove phase distortions and then selected every
fth point (MATLAB command
decimate). The filter had a normalized cut-off frequency of 0.8/
f. This method was chosen to avoid aliasing distortion that might occur by simply downsampling a signal.
The second method, filtering-and-downsampling (FD) by a factor of
f, used a second-order Butterworth low-pass filter with a cut-off frequency of 30 Hz, and then downsampled the signal by a factor of
f (MATLAB command
downsample). Butterworth low-pass filter is the most common filter used in the literature to reduce the effect of noise [
30] along with maintaining the variability in the lower range frequencies where the musculoskeletal motion occurs [
31]. A nonparametric PSD estimator, Welch’s algorithm, was used to obtain the cut-off frequency. The dominant peak was at 0.89 ± 0.06 Hz (mean ± SD) for WO, 0.91 ± 0.06 for DT, and 0.99 ± 0.06 for WO-1.3. The last peak before noise floor occurred in the 8–15 Hz frequency range. Therefore, 15 Hz was considered as the highest frequency component and 30 Hz was used as the cut-off frequency.
The two methods yielded approximately the same results with respect to the low-pass filtering for . Therefore, the first five f values could shed light on the effect of low-pass filtering prior to the calculation of SampEn.
SampEn was calculated using all combinations of parameter values,
and
r = 0.2 and 0.3 × standard deviation (SD) of all the time series, and for all downsampling factors
, and for both decimated and filtered-and-downsampled signals of WO and DT condition. The present investigation was based on more
m and
f values in the selected ranges. However, the necessity for statistical analysis with the purpose of studying the discriminatory ability of SampEn, led to choosing fewer parameter values (levels within a factor); e.g., five levels versus nine levels for template size (
m = 2~10). In a previous study [
11],
were tested when SampEn was applied to the inter-stride spatio-temporal gait variables. The present work included more
m values to study the SampEn of the entire gait signals and not just times at heel strike or step distances. It was hypothesized that larger
m values could better discern changes when there is a much greater number of data points per gait cycle or stride. Additionally, unlike ApEn, SampEn decreases almost monotonically with increasing
r value [
3,
11] and 0.1–0.3 times the standard deviation has been suggested for inter-stride spatio-temporal gait variables [
11]. The current analysis was based on
,
and
. However, when the parameter value
was used, many SampEn values converged to infinity. Therefore this level was not included in the results. Large
r values were not included because they result in much smaller SampEn values for each condition, i.e., more matched templates, which diminish the discriminatory ability of SampEn.
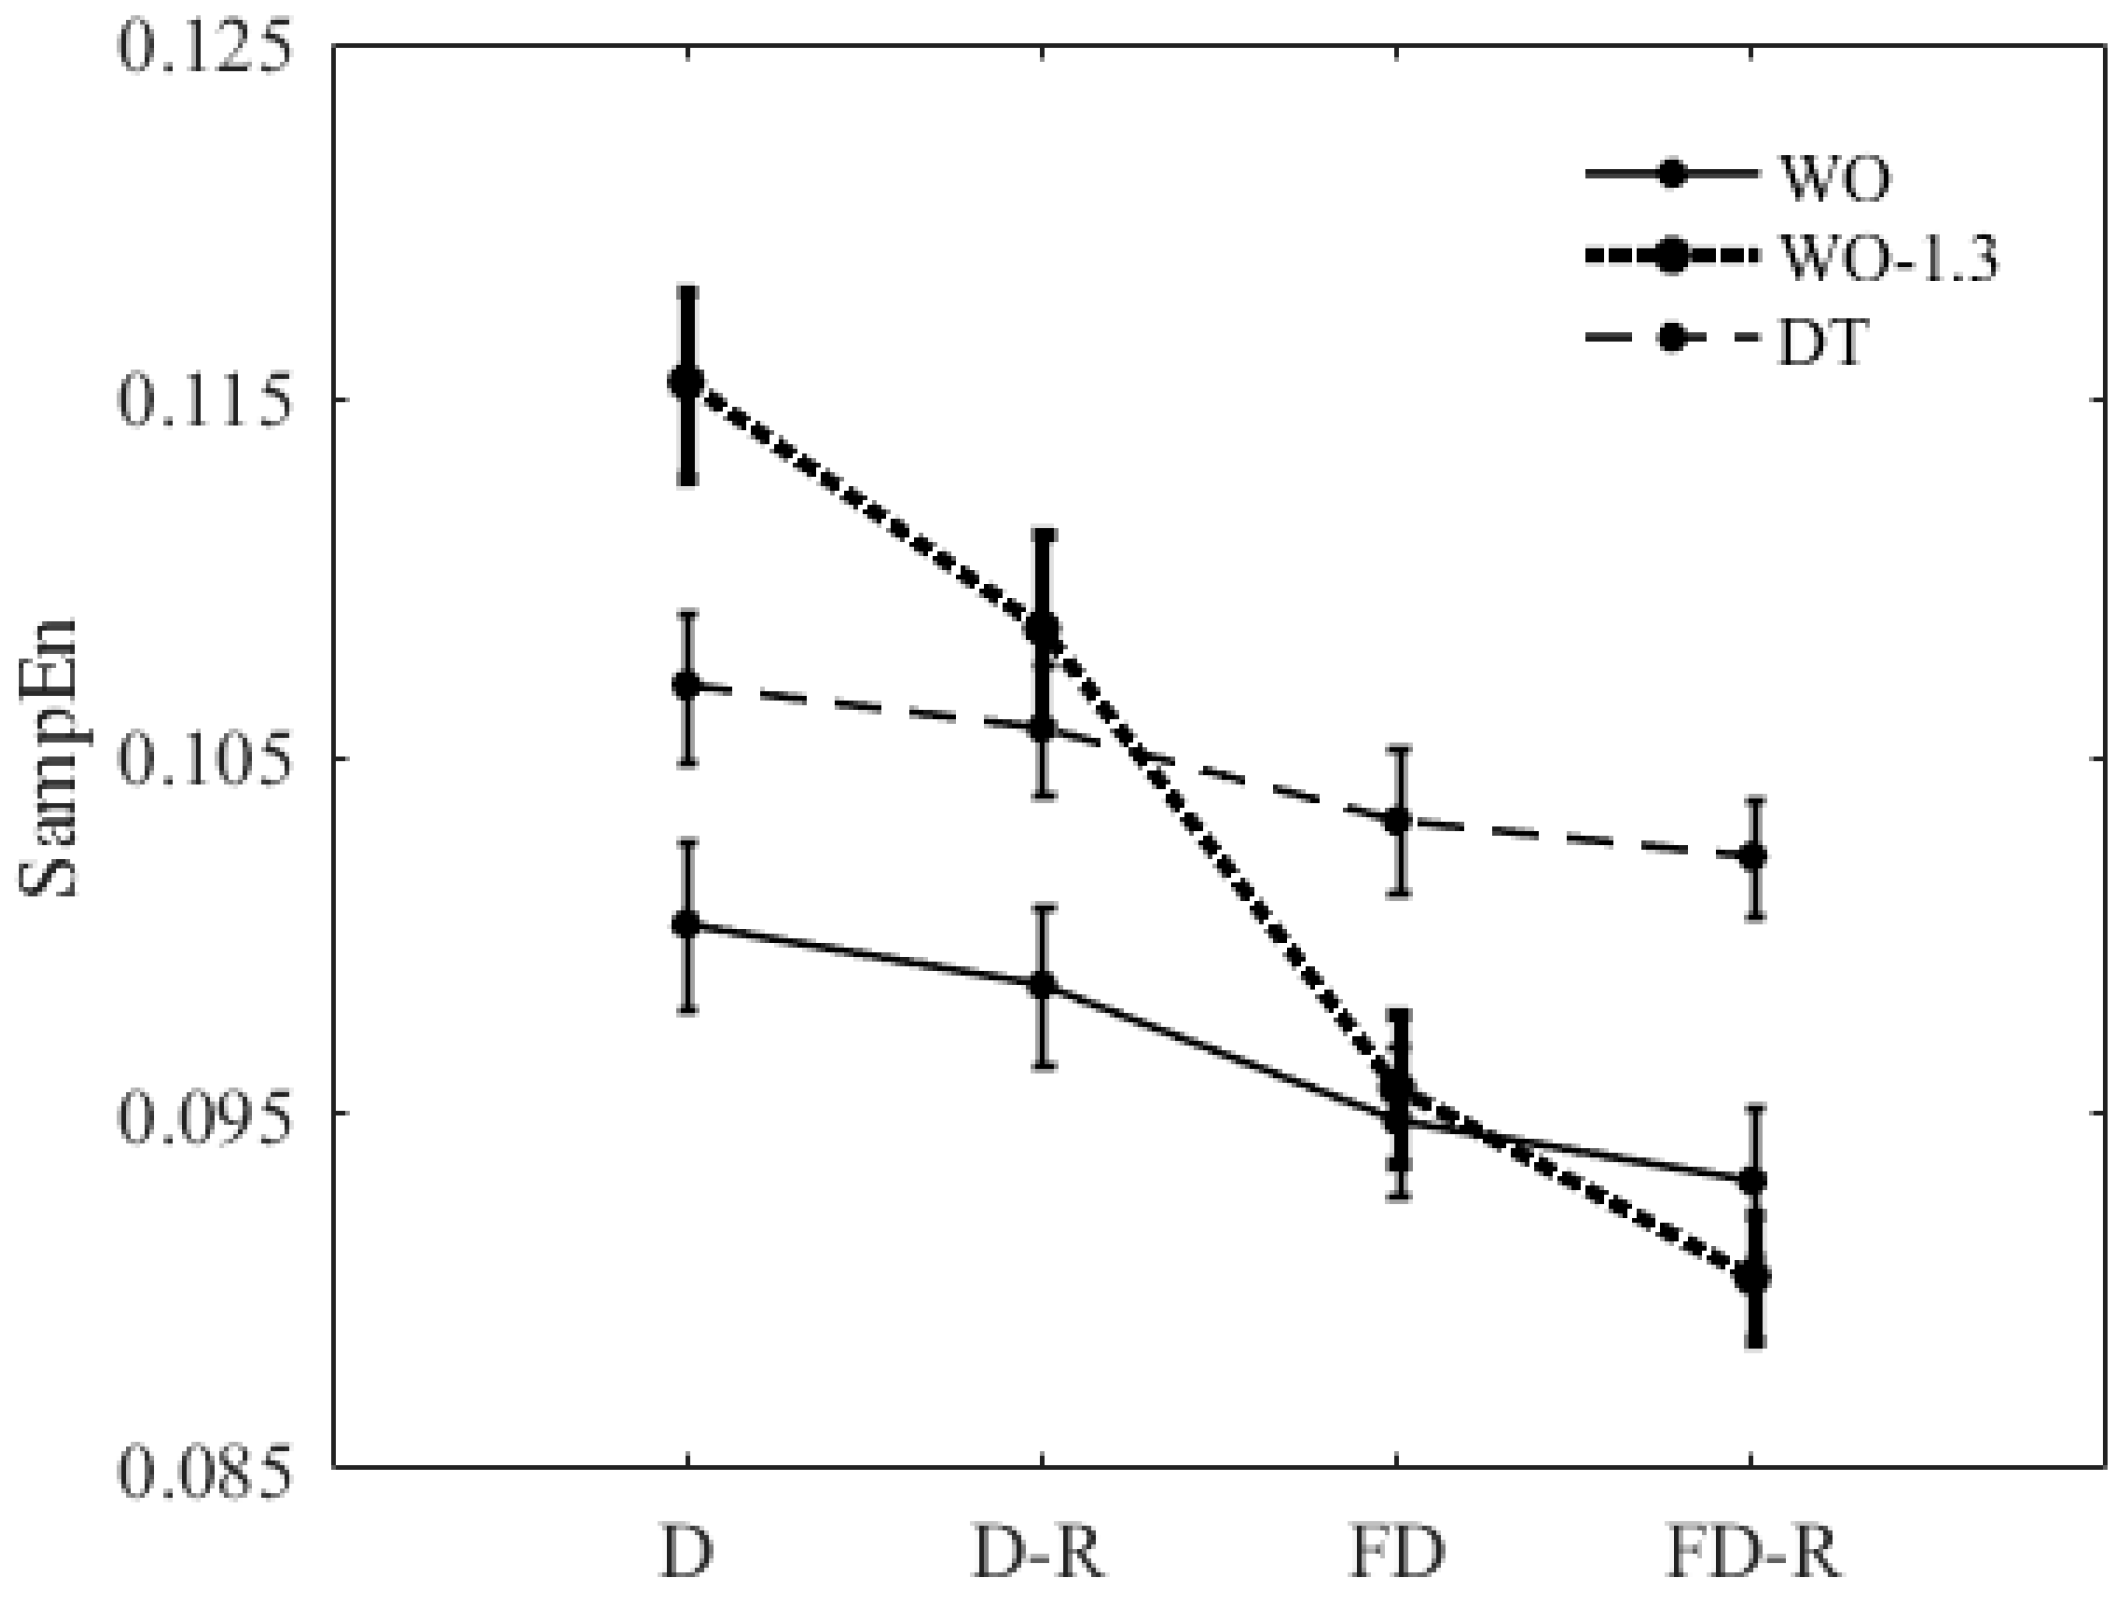
In the second part, the effect of low-pass filtering and resampling, to have the same average number of data points per stride, was investigated. SampEn of ML COP-D signal of WO, DT, and WO-1.3 was calculated using , and (based on the results of the first part). Four methods of preprocessing were used for each condition;
decimation (D),
decimation-and-resampling (D-R),
filtering-and-downsampling (FD) and,
filtering-and-downsampling-and-resampling (FD-R).
The average number of data points per stride for WO, DT and WO-1.3 were 142, 140 and 128, respectively. Therefore, 30 strides of each time series were resampled (MATLAB command resample) so that all of the signals would have an average of 142 data points per stride.
2.4. Statistical Analysis
In the first part of this study, there were 4 factors of within-subject repeated measures, which are 2 levels of walking condition (WO and DT), 2 levels of r, 6 levels of f, and 5 levels of m. The following steps were taken to perform the statistical analysis separately for both decimated and filtered-and-downsampled signals.
A two-factor repeated measure ANOVA (walking condition*m) was performed at each f level while considering the first tolerance level.
A two-factor repeated measure ANOVA (walking condition*m) was performed at each f level while considering the second tolerance level.
A two-factor repeated measure ANOVA (walking condition*f) was performed at each m level while considering the first tolerance level.
A two-factor repeated measure ANOVA (walking condition*f) was performed at each m level while considering the second tolerance level.
Post hoc pairwise comparisons with Bonferroni correction were performed to examine the effect of dual-tasking at each level.
Finally, a two-factor (walking condition*r) repeated measure ANOVA was performed at fixed m = 4 and f = 8 values, which were chosen based on the previous step’s statistical results.
In the second part of this study, two two-factor within-subject ANOVA were used to examine the main and interaction effects of the following factors on SampEn;
walking condition (WO versus DT) and preprocessing method (D, D-R, FD, FD-R)
gait speed (1.0 m/s versus 1.3 m/s) and preprocessing method (D, D-R, FD, FD-R)
Normality of all dependent variables was checked using the Shapiro-Wilk normality test. Results confirmed that the data was normally distributed. Statistical analyses were carried out using SPSS software version 24. In all the tests, a p-value less than 0.05 was considered significant. A Bonferroni correction was used in the software for multiple comparisons.


