In this section, we propose novel methods to measure the activeness of groups and the loyalty of users. To predict the activeness of groups, three well-known machine-learning techniques are used, and results have been shown to validate our methods.
4.1. Method to Measure Group Activeness
In the multi-online groups platform like Meetup, one key characteristic that emerges to clarify the active or inactive status of each group is the number of events in a specific period of time. Because of different types of groups, the numbers of events of groups are different in the same time period. For example, some groups have events daily or weekly, while others arrange only one event in a month or even in three months. Hence, the change in the number of events in each group between two consecutive time intervals is adopted to evaluate whether the group is active or not. In other words, the change in the number of events is used to specify three levels of group activeness, i.e.,
active,
stable, and
inactive, because this feature strongly reflects the group activeness than any other features. Therefore, we define the concept of group activeness in EBSNs based on the numbers of events that are created in different consecutive time windows.
Table 4 lists the notations used in this paper.
To measure activeness, we propose a method that is used to label the activeness level of each group after a set of consecutive time windows. The proposed method consists of two steps. Inspired by calculating the journal impact factor from Clarivate Analytics organization (
https://clarivate.com/), first we compute the ratio on the numbers of events in two consecutive time windows and assign each group with an activeness label. After that, we develop an association label matrix to reassign a new label for each group after several consecutive time windows. We do not consider more consecutive windows in deciding group activeness because different groups have different histories. It will complicate the matter if multiple time windows are used to compute the activeness of different groups. The process of this method is expressed in the following details.
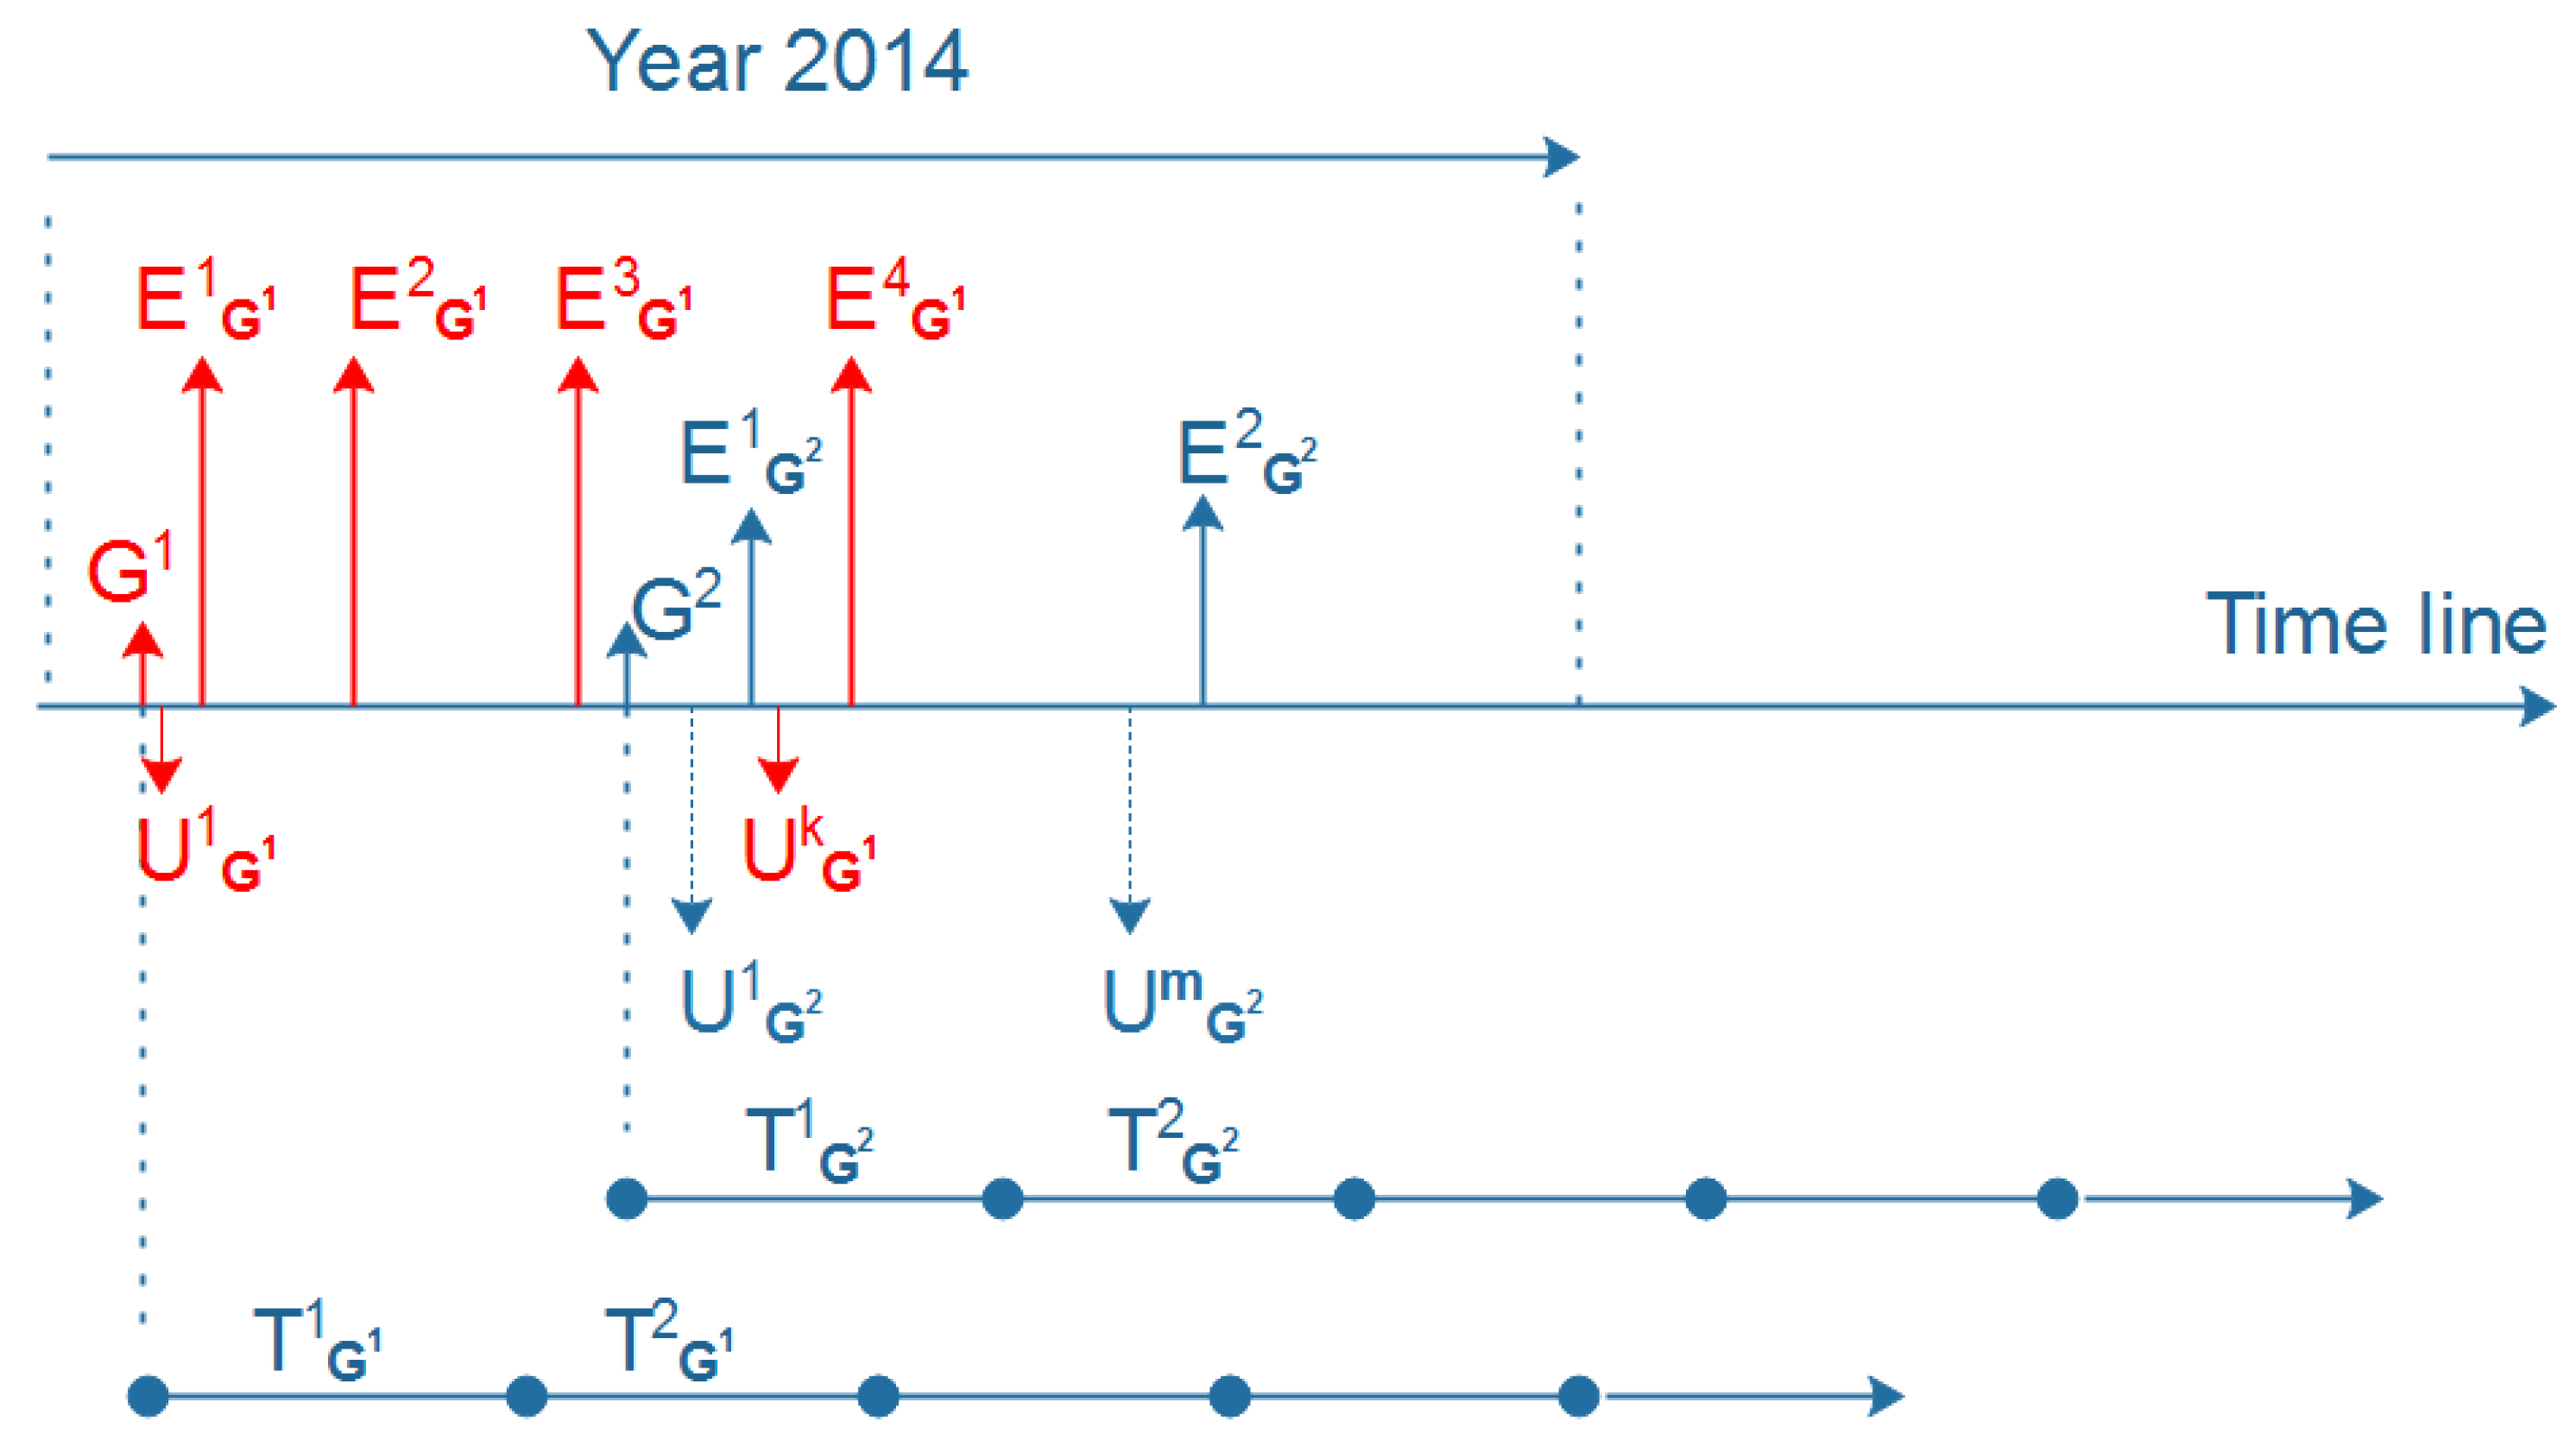
Activeness labels. Given a group
G and a given set of consecutive time windows, {
, …,
}, in which each
has a corresponding number of events
created by
G, as illustrated in
Figure 2, we first calculate the ratio of events
R between
and
as the following equation:
where
and
are the numbers of events of the group
G in
and
, respectively. Note that, if both
and
are equal to 0, the value of
R is assigned to 0. On the other hand, if
> 0 and
, then the value of
R is assigned by
.
The label of the group
G in the period of
is then defined as follows:
where
R is the ratio computed in Equation (
1), and
L denotes the labels of the group.
Finally, we develop the following label matrix to assign an activeness label for the group
G after the whole set of time windows
.
Specifically, if
is the activeness label of
G in the period of
, and
is the label in the period of
. The activeness label of
G in the whole
is assigned by
A.
The following example describes the process of assigning the activeness label for groups.
Example of activeness label. The matrix
A describes the numbers of events of five groups (
, …,
) in four consecutive time windows. First, the ratios of the numbers of events between two consecutive time windows for each group are calculated as shown in the matrix
B. Note that the values in the matrix
B with a marked * are also assigned based on Equation (
1). Then, the matrix
C illustrates the activeness label of each group in the two consecutive time windows, the labels are assigned based on Equation (
2). To label these groups in the period of the first three time windows, i.e.,
,
, and
, we select the first two columns, i.e.,
and
, in the matrix
C. After that, we use the
label matrix to assign a label to each corresponding group for the period of
. The results of the five groups for the period of
are shown in the first column in the matrix
D, and the second column
in
D is still the activeness label obtained from the matrix
C. Finally, we use the
label matrix for the matrix
D to achieve the activeness label for the five groups after the period of
, as illustrated in the
activeness label matrix.
4.2. Method to Measure User Loyalty
Similarly, we use the time windows to define the loyalty of users towards their group. The concept of user loyalty is defined based on participation, which is considered as a strong view for clarifying loyal users. To measure the loyalty of a user
u in his/her group
G, we first obtain attended events by user
u in one
. We then calculate
, which is the ratio of attended events of
u to all events of
G created in
. Finally, we measure the loyalty of user
u after several consecutive time windows as follows.
where
n is the number of consecutive time windows. The value of
is from 0 to 1. If the value is close to 1, the user
u is loyal to the group
G. Otherwise, if the value is near to 0, the user
u is the disloyal user.
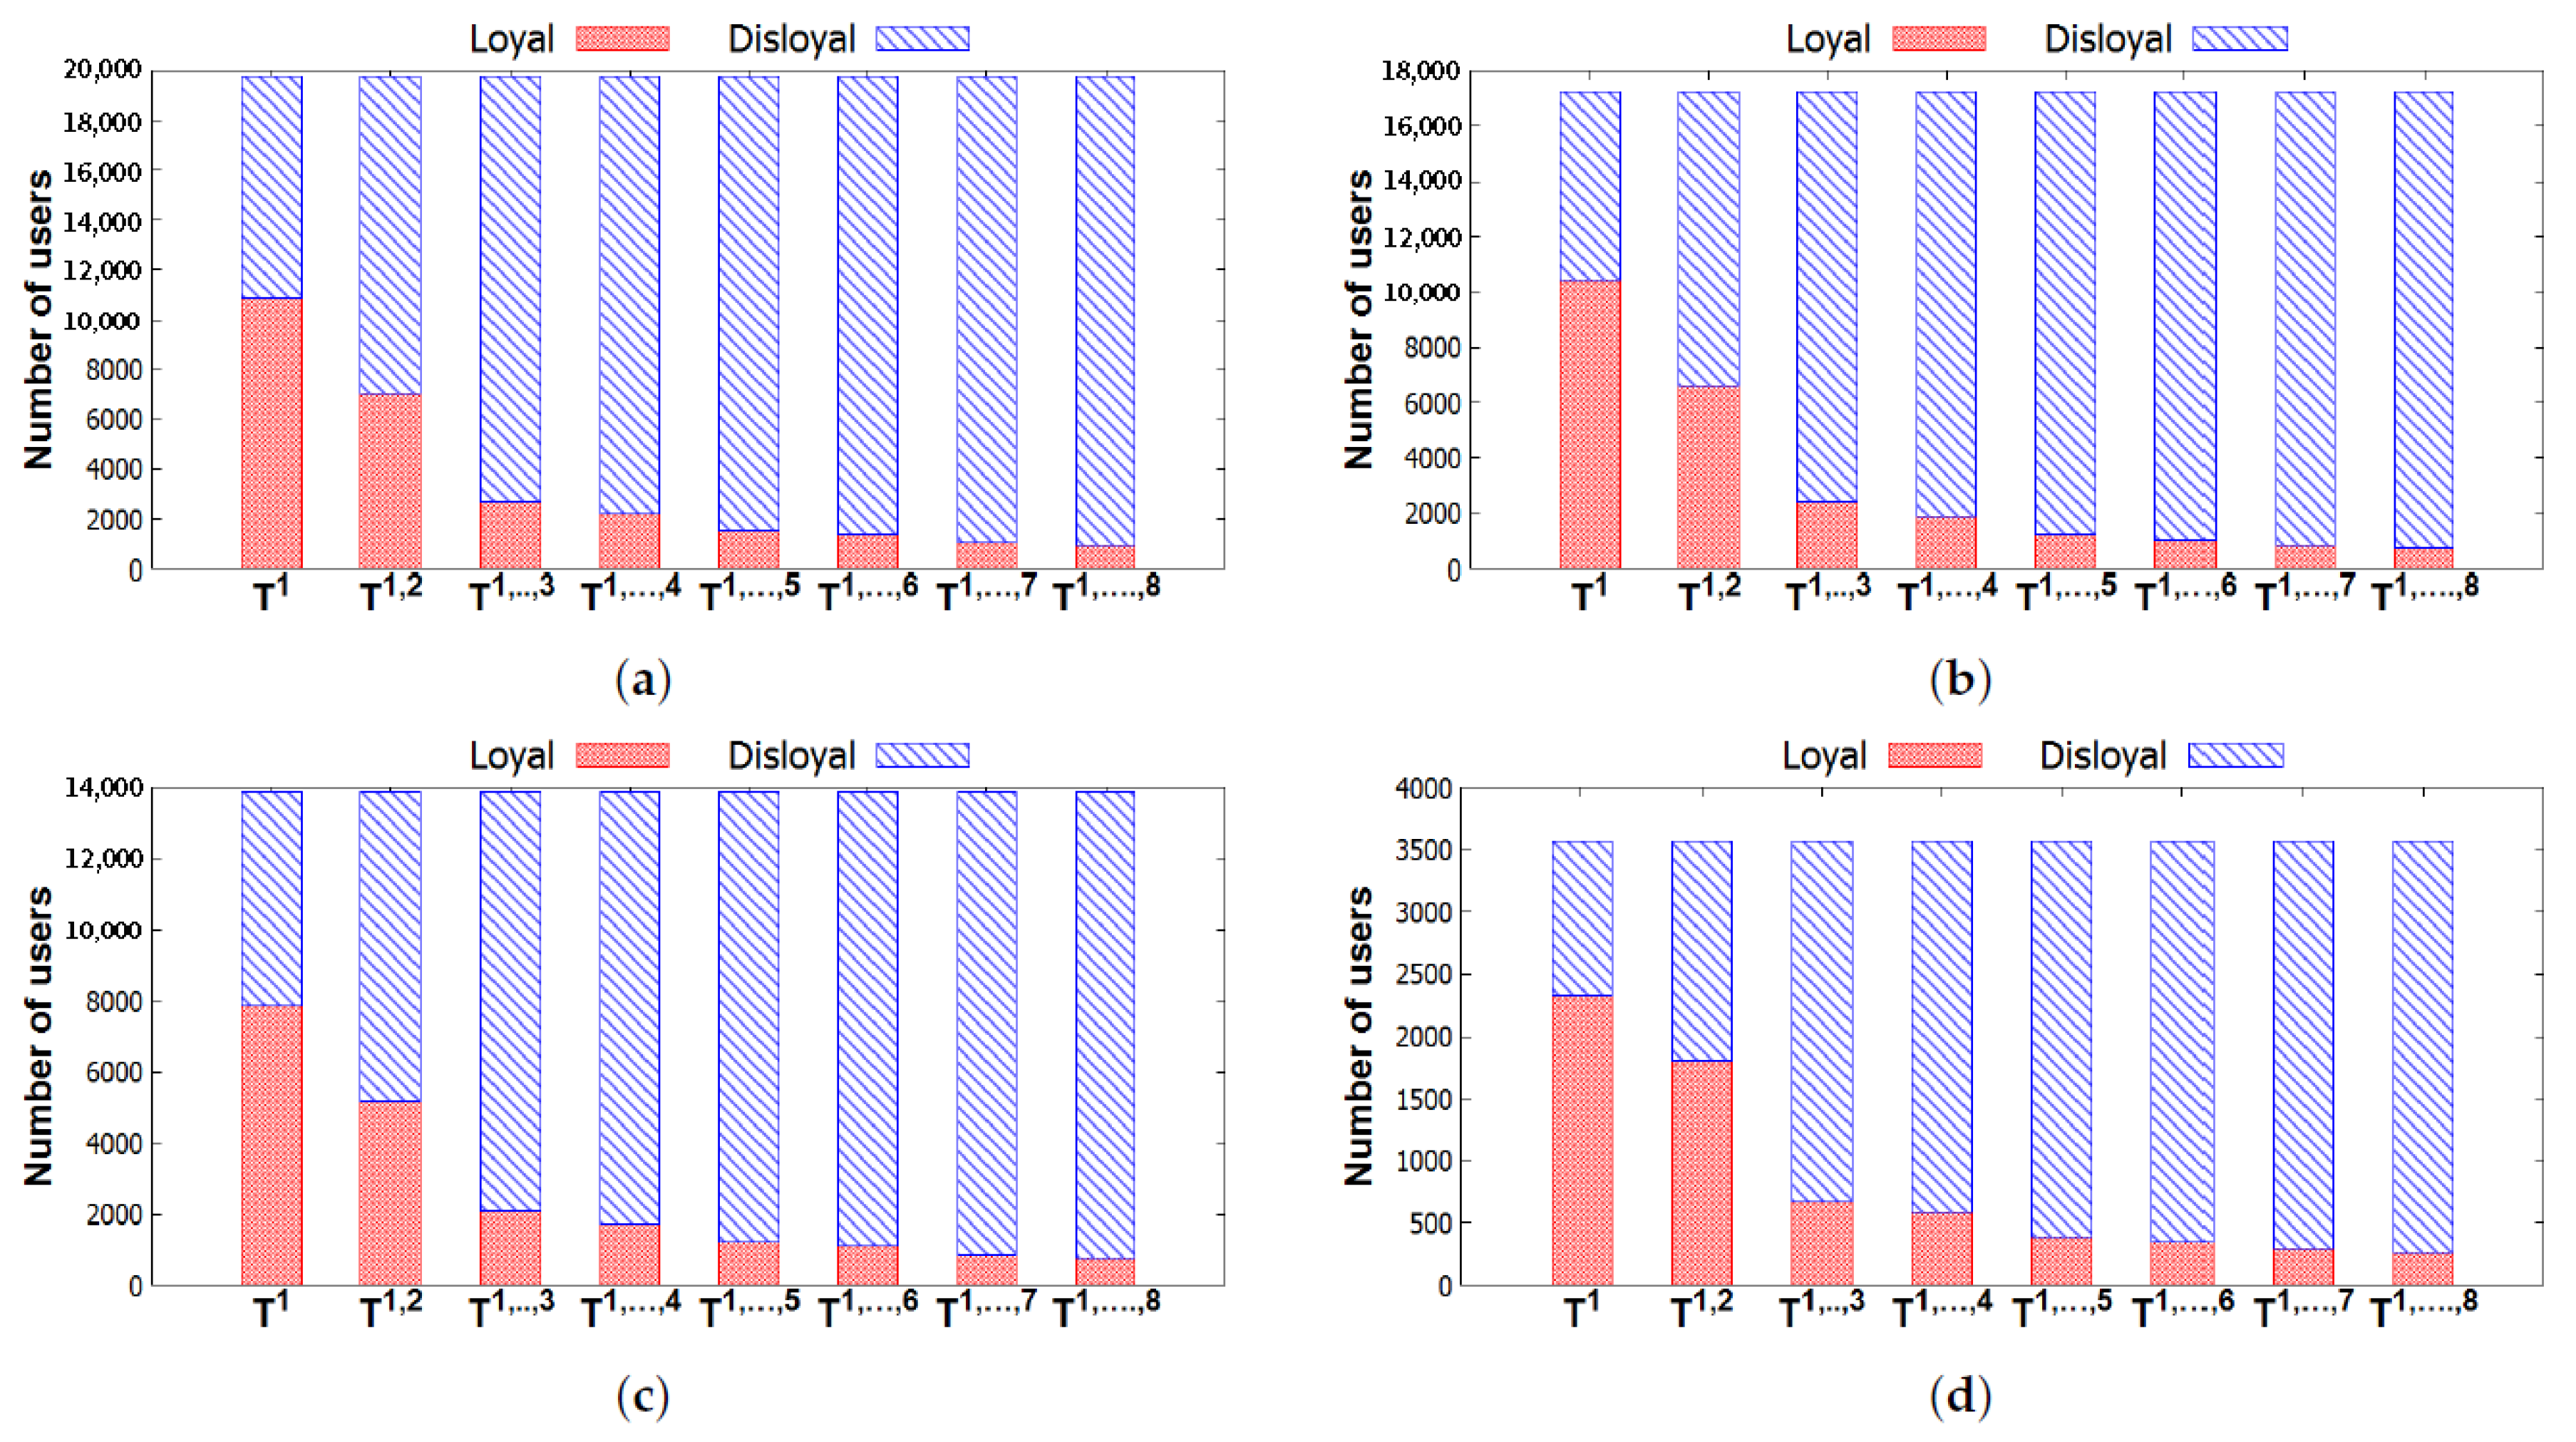
We use a given threshold to differentiate loyal users and disloyal users within n consecutive time windows. If , which means u is considered the loyal user; for example, u is the loyal user of G within . The number of loyal users of G is denoted by the feature.
4.3. Prediction Techniques
As discussed above, one group has a set of generated features and a corresponding activeness label. The set of these features consists of user-based features, group-based features, event-based features, and the
feature. To evaluate the set of generated features and the activeness label for each group, we adopt supervised classifiers. The random forest (RF) method [
28,
29] can predict high accuracy even with a set of weak features. The decision tree method [
30] can select a group of strong features to construct a prediction tree. Moreover, these methods are nonparametric ones. The support vector machine (SVM) [
31] is another well-known method that is very useful for a group of features that are highly correlated. Therefore, we selected these three methods to evaluate the activeness label of each group by using the set of features of the group. The process of evaluation is described in
Section 5.4.


