2.1. Characteristics of catalysts
The X-ray diffraction (XRD) patterns of the powders are presented in
Figure 2, where A stands for anatase and R for rutile phases. It can be observed that the synthesized TiO
2 powder consists of pure anatase (curve 1). The pattern of TiO
2 Degussa P25 powder (curve 3) exhibited both anatase and rutile crystalline polymorphs in a wt % ratio A: R = 88: 12 (
Table 1), which is in accordance with recently reported values in the literature [
14,
15]. After the doping procedure, the crystalline structure of each powder was preserved (curves 2 and 4) due to the temperature of thermal treatment which was only 50 °C higher than the calcination temperature of the undoped powder and below the temperature of anatase-to-rutile phase transition. In addition, the intensities and widths of the characteristic peaks for the undoped powders are similar to those of the respective N-doped samples. Only a small increase in the crystallite size, especially for the synthesized TiO
2 was found, while the phase composition of the mixed-phase samples remained unchanged.
Figure 2.
XRD patterns of undoped and urea-modified TiO2 powders.
Figure 2.
XRD patterns of undoped and urea-modified TiO2 powders.
Table 1.
Phase composition and average diameter of the crystallites in the studied samples.
Table 1.
Phase composition and average diameter of the crystallites in the studied samples.
| Parameter | Nominal name |
|---|
| TiO2 | N-doped TiO2 | TiO2 Degussa P25 | N-doped TiO2 Degussa P25 |
|---|
| Phase composition [wt %] | A: 100 | A: 100 | A: 87.6 | A: 87.3 |
| R: 12.4 | R: 12.7 |
| Average diameter [nm] | A: 9.3 | A: 12.3 | A: 19.9 | A: 18.9 |
| R: 27.2 | R: 28.0 |
UV-Vis diffuse reflectance spectra R of the studied powders are presented in
Figure 3. The Kubelka-Munk relation F = (1 − R)
2/2R was used to convert the diffuse reflectance spectra R into the equivalent absorption spectra F (
Figure 4). It can be observed that the N-doped TiO
2 and N-doped TiO
2 Degussa P25 powders exhibit increased absorption in the visible region in comparison to their undoped precursors TiO
2 and Degussa P25, respectively. This is evidenced by the shift of the absorption curves to larger wavelengths and by the enhancement of the Urbach tails. The energy band gaps Eg given in the inset were obtained by extrapolation of the linear part of the absorption function (FxE)
1/2. The band gap values are: TiO
2 — 3.08 eV, N-doped TiO
2 — 3.03 eV, TiO
2 Degussa P25 — 3.08 eV and N-doped TiO
2 Degussa P25 — 3.01 eV. Thus, the increased amount of visible light absorbed energy can be related to two phenomena: introduction of surface structural defects and lattice alteration during the modification procedure. In fact, the width of the band gap was only slightly affected by the thermal treatment in the presence of urea as the Eg values decreased only by 0.05 eV and 0.07 eV for the N-doped samples (inset of
Figure 4). These findings suggest that the treatment procedure leads mainly to surface modification of the catalyst and not to incorporation of the nitrogen into its structure. Hence, the photocatalytic behavior of the catalysts is more likely to be connected to the introduction of electronic states in the band gap rather than to the band gap narrowing [
16].
Figure 3.
UV-Vis diffuse reflectance spectra of undoped and urea-modified TiO2 powders.
Figure 3.
UV-Vis diffuse reflectance spectra of undoped and urea-modified TiO2 powders.
Figure 4.
Kubelka-Munk absorption curves F for the powders studied. The band gaps appear in the inset as a result of the extrapolation procedure.
Figure 4.
Kubelka-Munk absorption curves F for the powders studied. The band gaps appear in the inset as a result of the extrapolation procedure.
2.2. Photocatalytic activity
To investigate the photocatalytic activity of N-doped TiO
2 and N-doped TiO
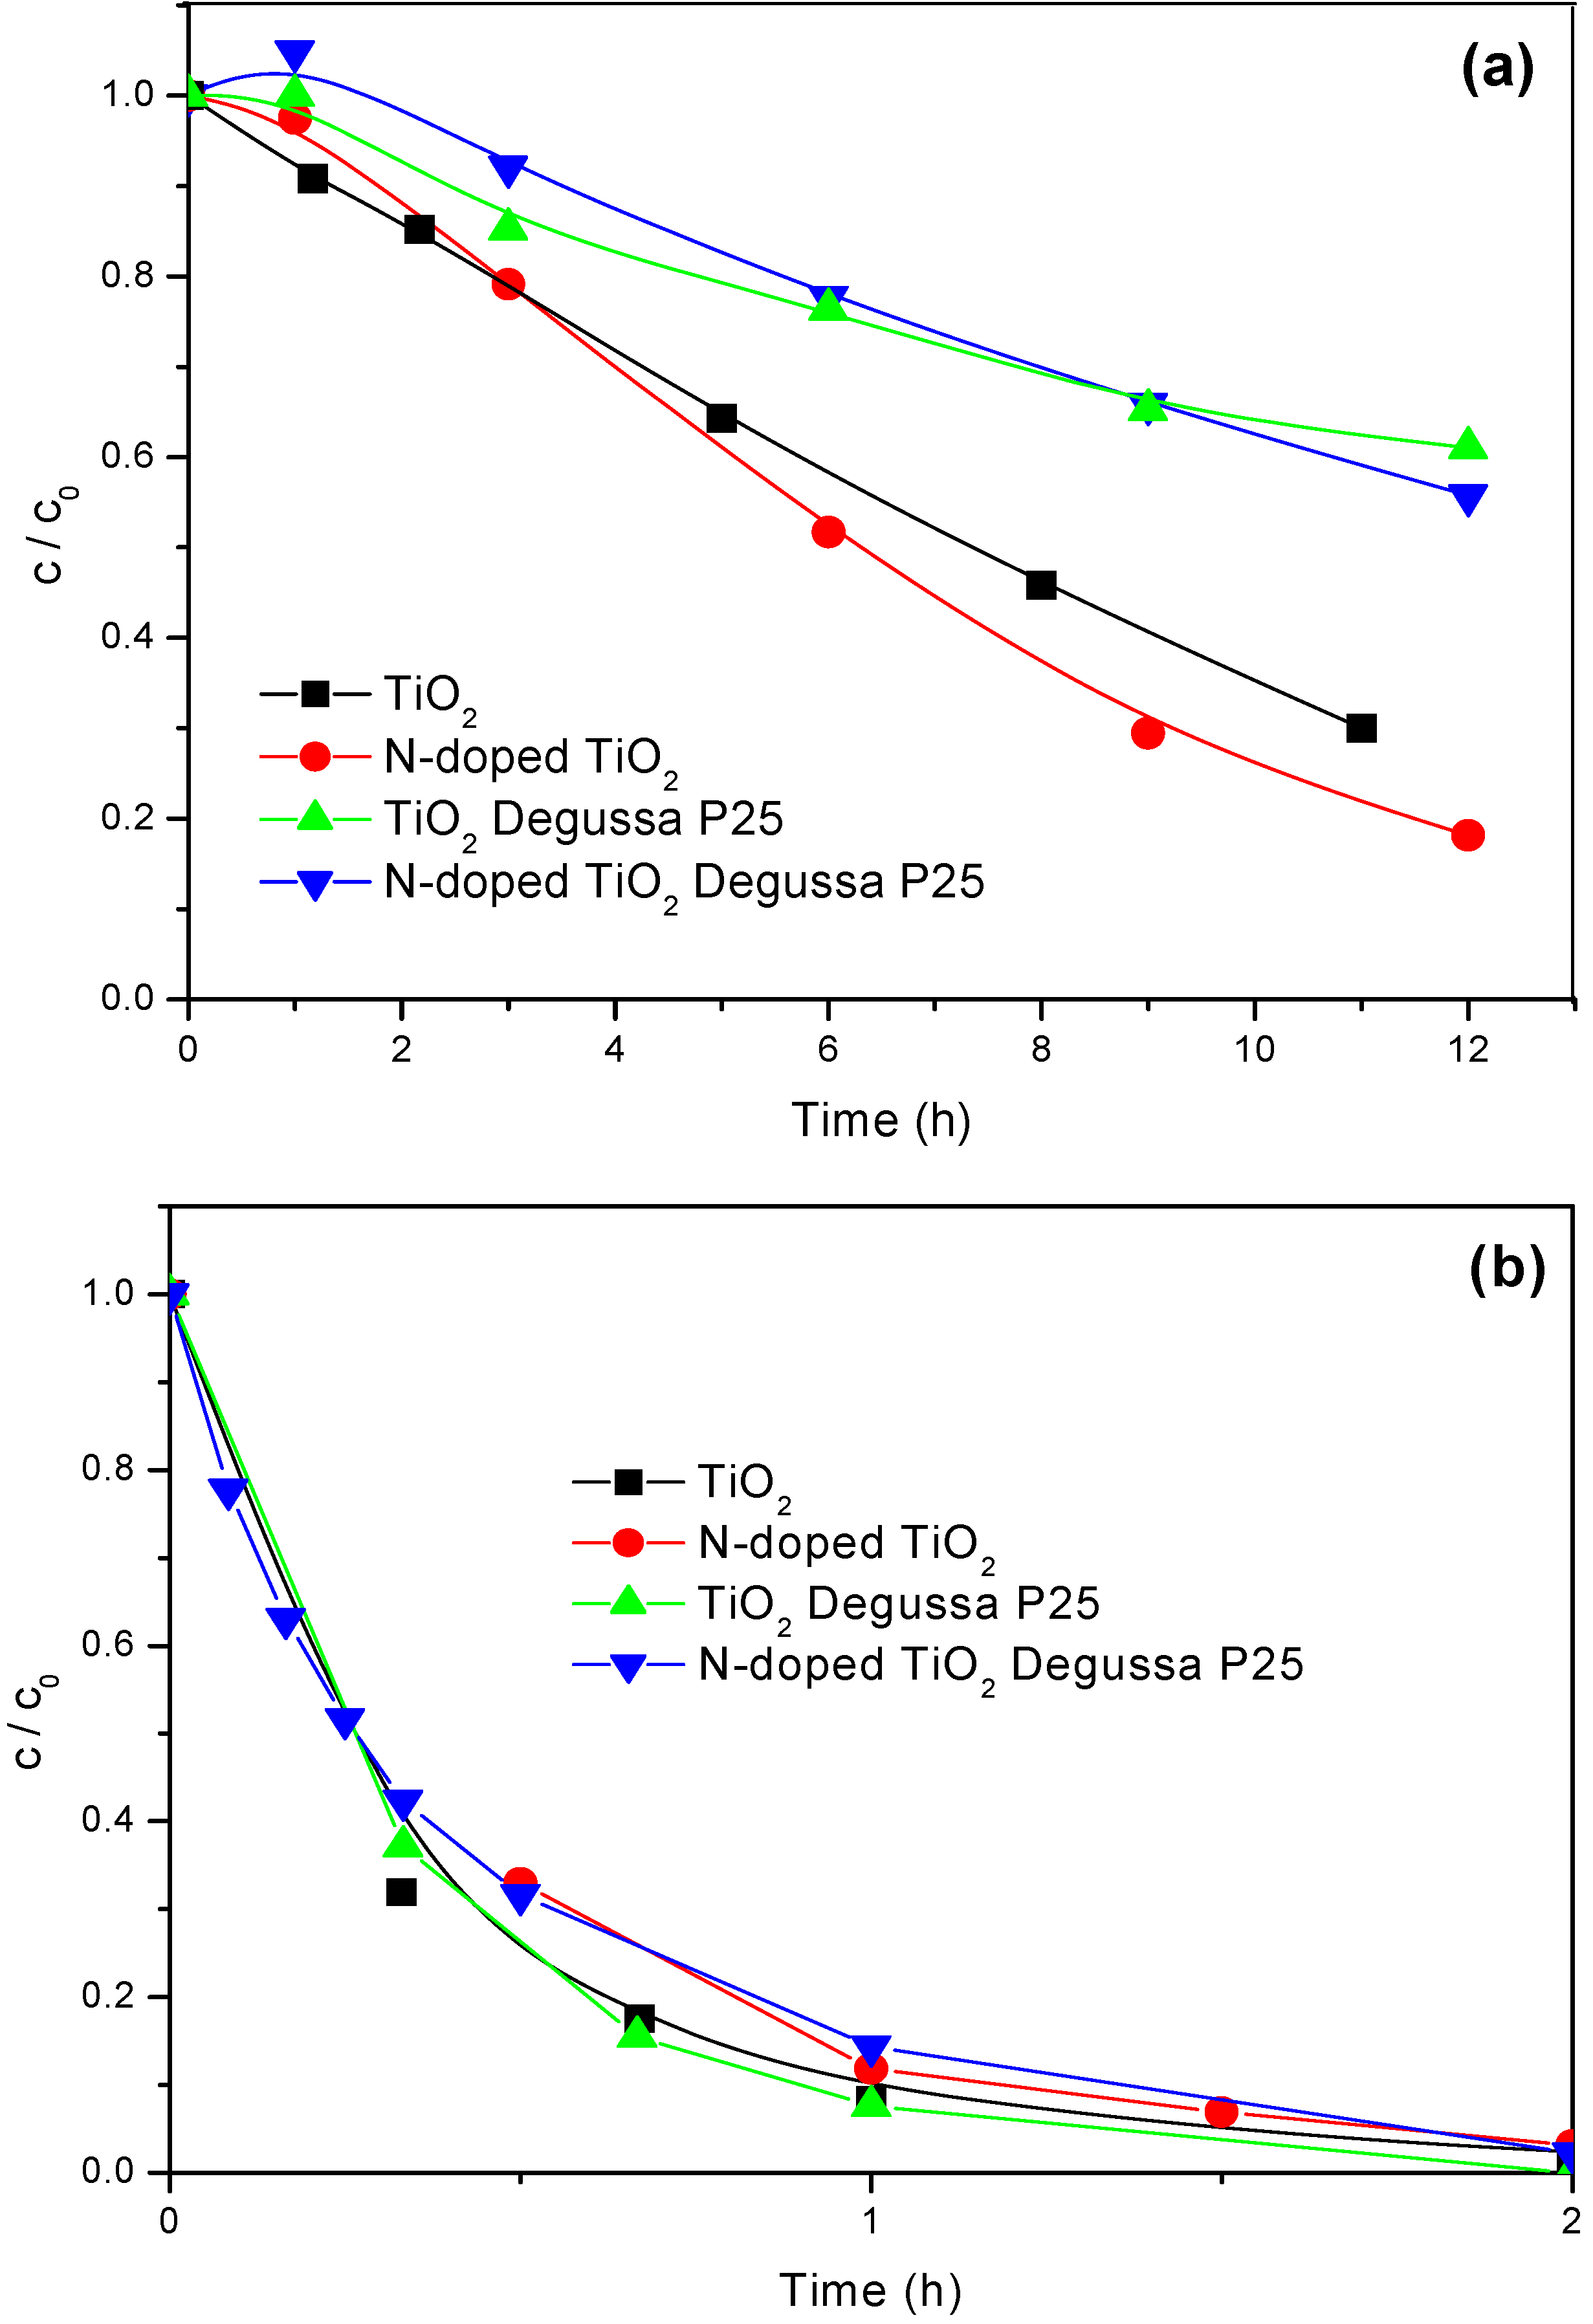
2 Degussa P25, the degradation of mecoprop (
Figure 5a) was carried out using artificial visible light. As can be seen, the N-doped TiO
2 appeared to be somewhat more efficient than the starting TiO
2 powder. Besides, N-doped TiO
2 Degussa P25 is also slightly more efficient than TiO
2 Degussa P25, which was more pronounced after a prolonged time of irradiation. Such behavior was expectable since, as already mentioned, the absorption edge of the doped catalysts is shifted to the visible range and higher absorption due to the alteration in the Urbach tails is observed (
Figure 4). Additionally, in spite of the fact that N-doped TiO
2 showed slightly increased value Eg in comparison with N-doped TiO
2 Degussa P25 (in the frames of the evaluation error), the higher photocatalytic activity of the former one in the visible range can be also assigned to its higher absorption in this region which is revealed by the position of the Urbach tails (
Figure 4).
It is interesting to note that in the first period of photocatalytic degradation on the N-doped TiO
2 Degussa P25 the concentration of mecoprop is higher than their initial equilibrium concentration, which may be ascribed to desorption of herbicide induced by irradiation [
17].
Under visible light irradiation, the undoped TiO
2 and TiO
2 Degussa P25 exhibited high photocatalytic activity (
Figure 5a) too, which is a consequence of the formation of a charge-transfer complex between the mecoprop and catalyst [
18,
19]. Namely, TiO
2 treating with mecoprop caused a red shift and a slight absorbance in the visible region (400–500 nm) was observed in comparison with the spectrum of TiO
2 powder. This indicates the formation of a charge-transfer complex between TiO
2 and mecoprop. Taking into account the FTIR spectra, it was postulated that the charge-transfer complex between TiO
2 and mecoprop is formed through carboxylate formation [
18].
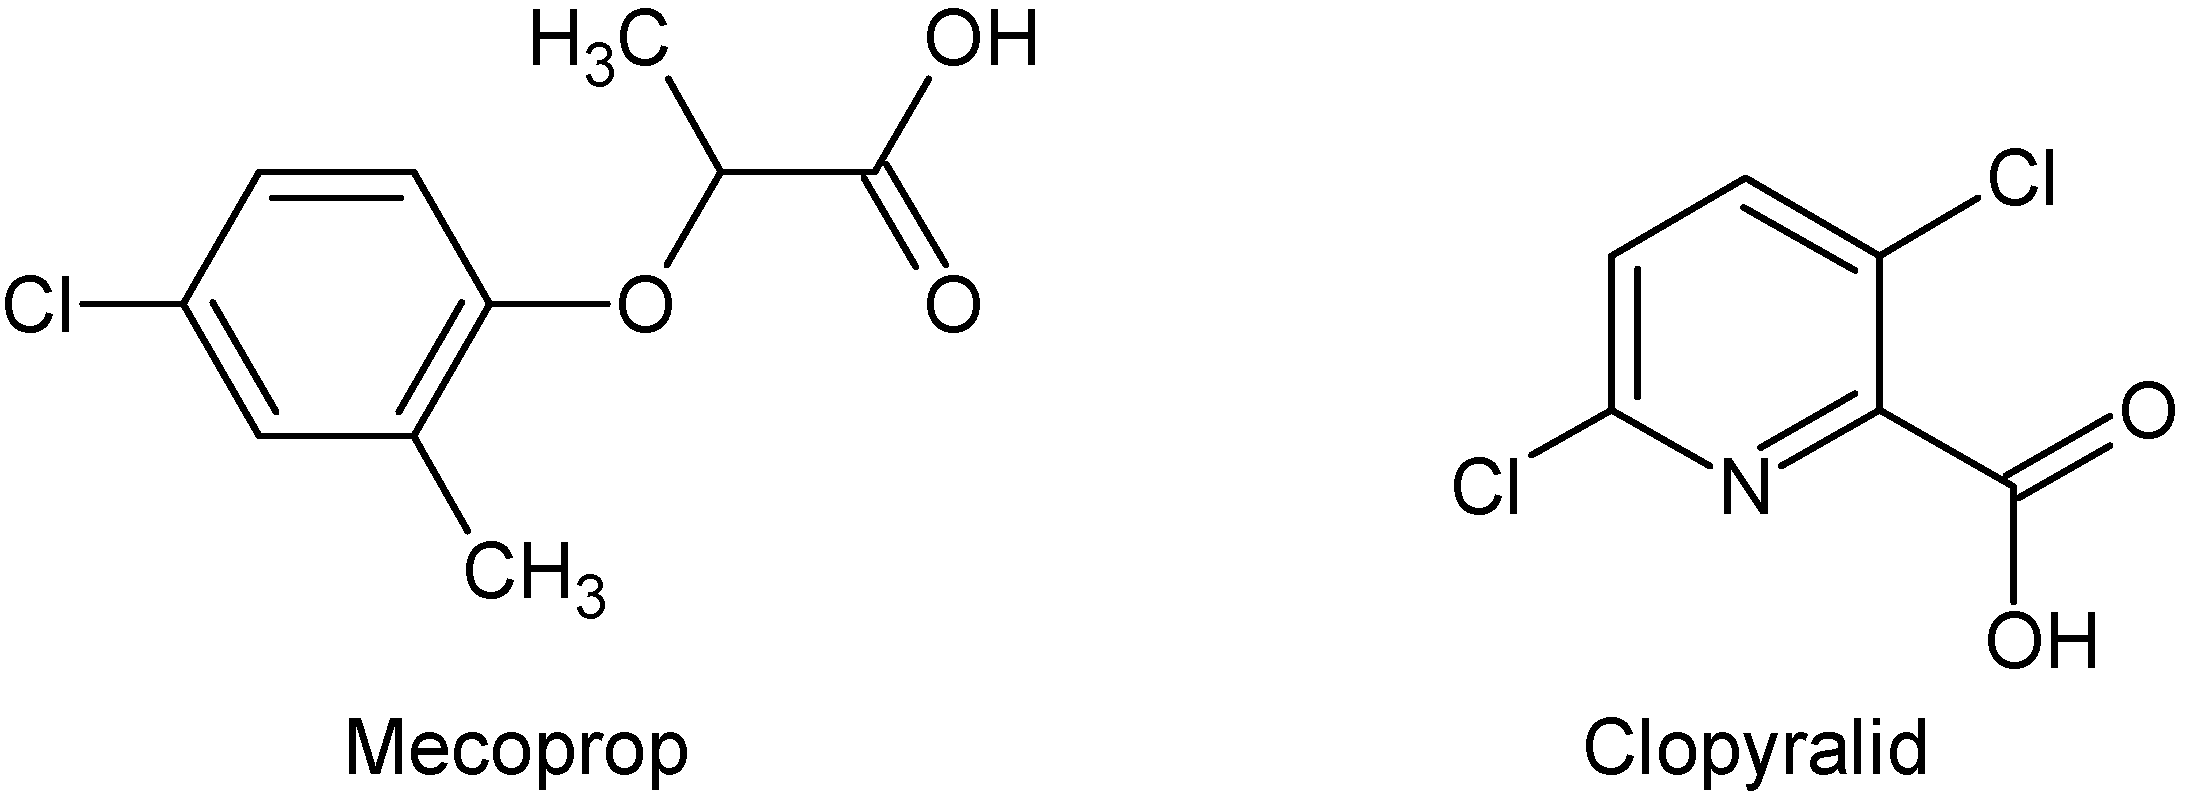
To study how the molecular structure of the pesticide substrate influences its degradation rate, we compared the degradation processes for mecoprop, containing an aromatic ring (
Figure 5) and clopyralid (
Figure 6), characterized by the presence of pyridine ring.
It appeared that the situation in the case of clopyralid was quite different (
Figure 6) compared to mecoprop in the presence of both types of irradiation. Namely, under the visible light, clopyralid is practically not degraded in the presence of any of the mentioned catalysts (
Figure 6a), whereas under UV irradiation (
Figure 6b) some degradation takes place, but at a rate which is by about three times lower than in the case of mecoprop. The photocatalytic degradation of mecoprop and clopyralid seems to be related to the difference in p
Ka values (for mecoprop p
Ka = 3.11–3.78 [
20] and for clopyralid p
K1 = 1.4 and p
K2 = 4.4 [
21]) [
22] and to the difference in molecular structure of these compounds. The larger rate of clopyralid photodegradation under UV than under visible irradiation is in agreement with results of other authors [
22], who explain it by the difference in the mechanism of the process.
Figure 5.
Disappearance of mecoprop (2.7 mmol/dm3) under visible (a) and UV (b) light irradiation (1.0 mg/cm3 of catalyst).
Figure 5.
Disappearance of mecoprop (2.7 mmol/dm3) under visible (a) and UV (b) light irradiation (1.0 mg/cm3 of catalyst).
Figure 6.
Disappearance of clopyralid (1.0 mmol/dm3) under visible (a) and UV (b) light irradiation (1.0 mg/cm3 of catalyst).
Figure 6.
Disappearance of clopyralid (1.0 mmol/dm3) under visible (a) and UV (b) light irradiation (1.0 mg/cm3 of catalyst).
The photocatalytic activities of N-doped and undoped photocatalysts were also compared using UV irradiation (
Figure 5b and
Figure 6b). The photocatalytic degradation of mecoprop (
Figure 5b) appeared to be somewhat more efficient in the presence of undoped powders (TiO
2 and TiO
2 Degussa P25). However, when studying the kinetics of clopyralid degradation (
Figure 6b), N-doped TiO
2 Degussa P25 was slightly more efficient, which is also a consequence of the difference in molecular structures of the herbicides.
On
Figure 7, two dimensioned chromatograms obtained from photocatalytic degradation of mecoprop (
Figure 7a) and clopyralid (
Figure 7b) under visible light irradiation are presented. As can be seen from
Figure 7a, the peak of the starting compound appears at the retention time of about 5.5 minutes and shows a decrease with irradiation time. At the same time, intermediates at 3.2, 3.5 and 4.9 minutes are formed, and these peaks increase with irradiation time.
Figure 7b illustrates the degradation of clopyralid. There is only signal for the starting compound at the retention time of 3.2 minutes, which decomposes only to a very small extent, while no intermediates are registered during the process of irradiation. This was expected bearing in mind the corresponding kinetic curves (
Figure 6a).
Figure 7.
HPLC profiles during the mecoprop (2.7 mmol/dm3), λ = 228 nm (a) and clopyralid (1.0 mmol/dm3), λ = 225 nm (b) photocatalytic degradation in the presence of N-doped TiO2 (1.0 mg/cm3) using visible light.
Figure 7.
HPLC profiles during the mecoprop (2.7 mmol/dm3), λ = 228 nm (a) and clopyralid (1.0 mmol/dm3), λ = 225 nm (b) photocatalytic degradation in the presence of N-doped TiO2 (1.0 mg/cm3) using visible light.
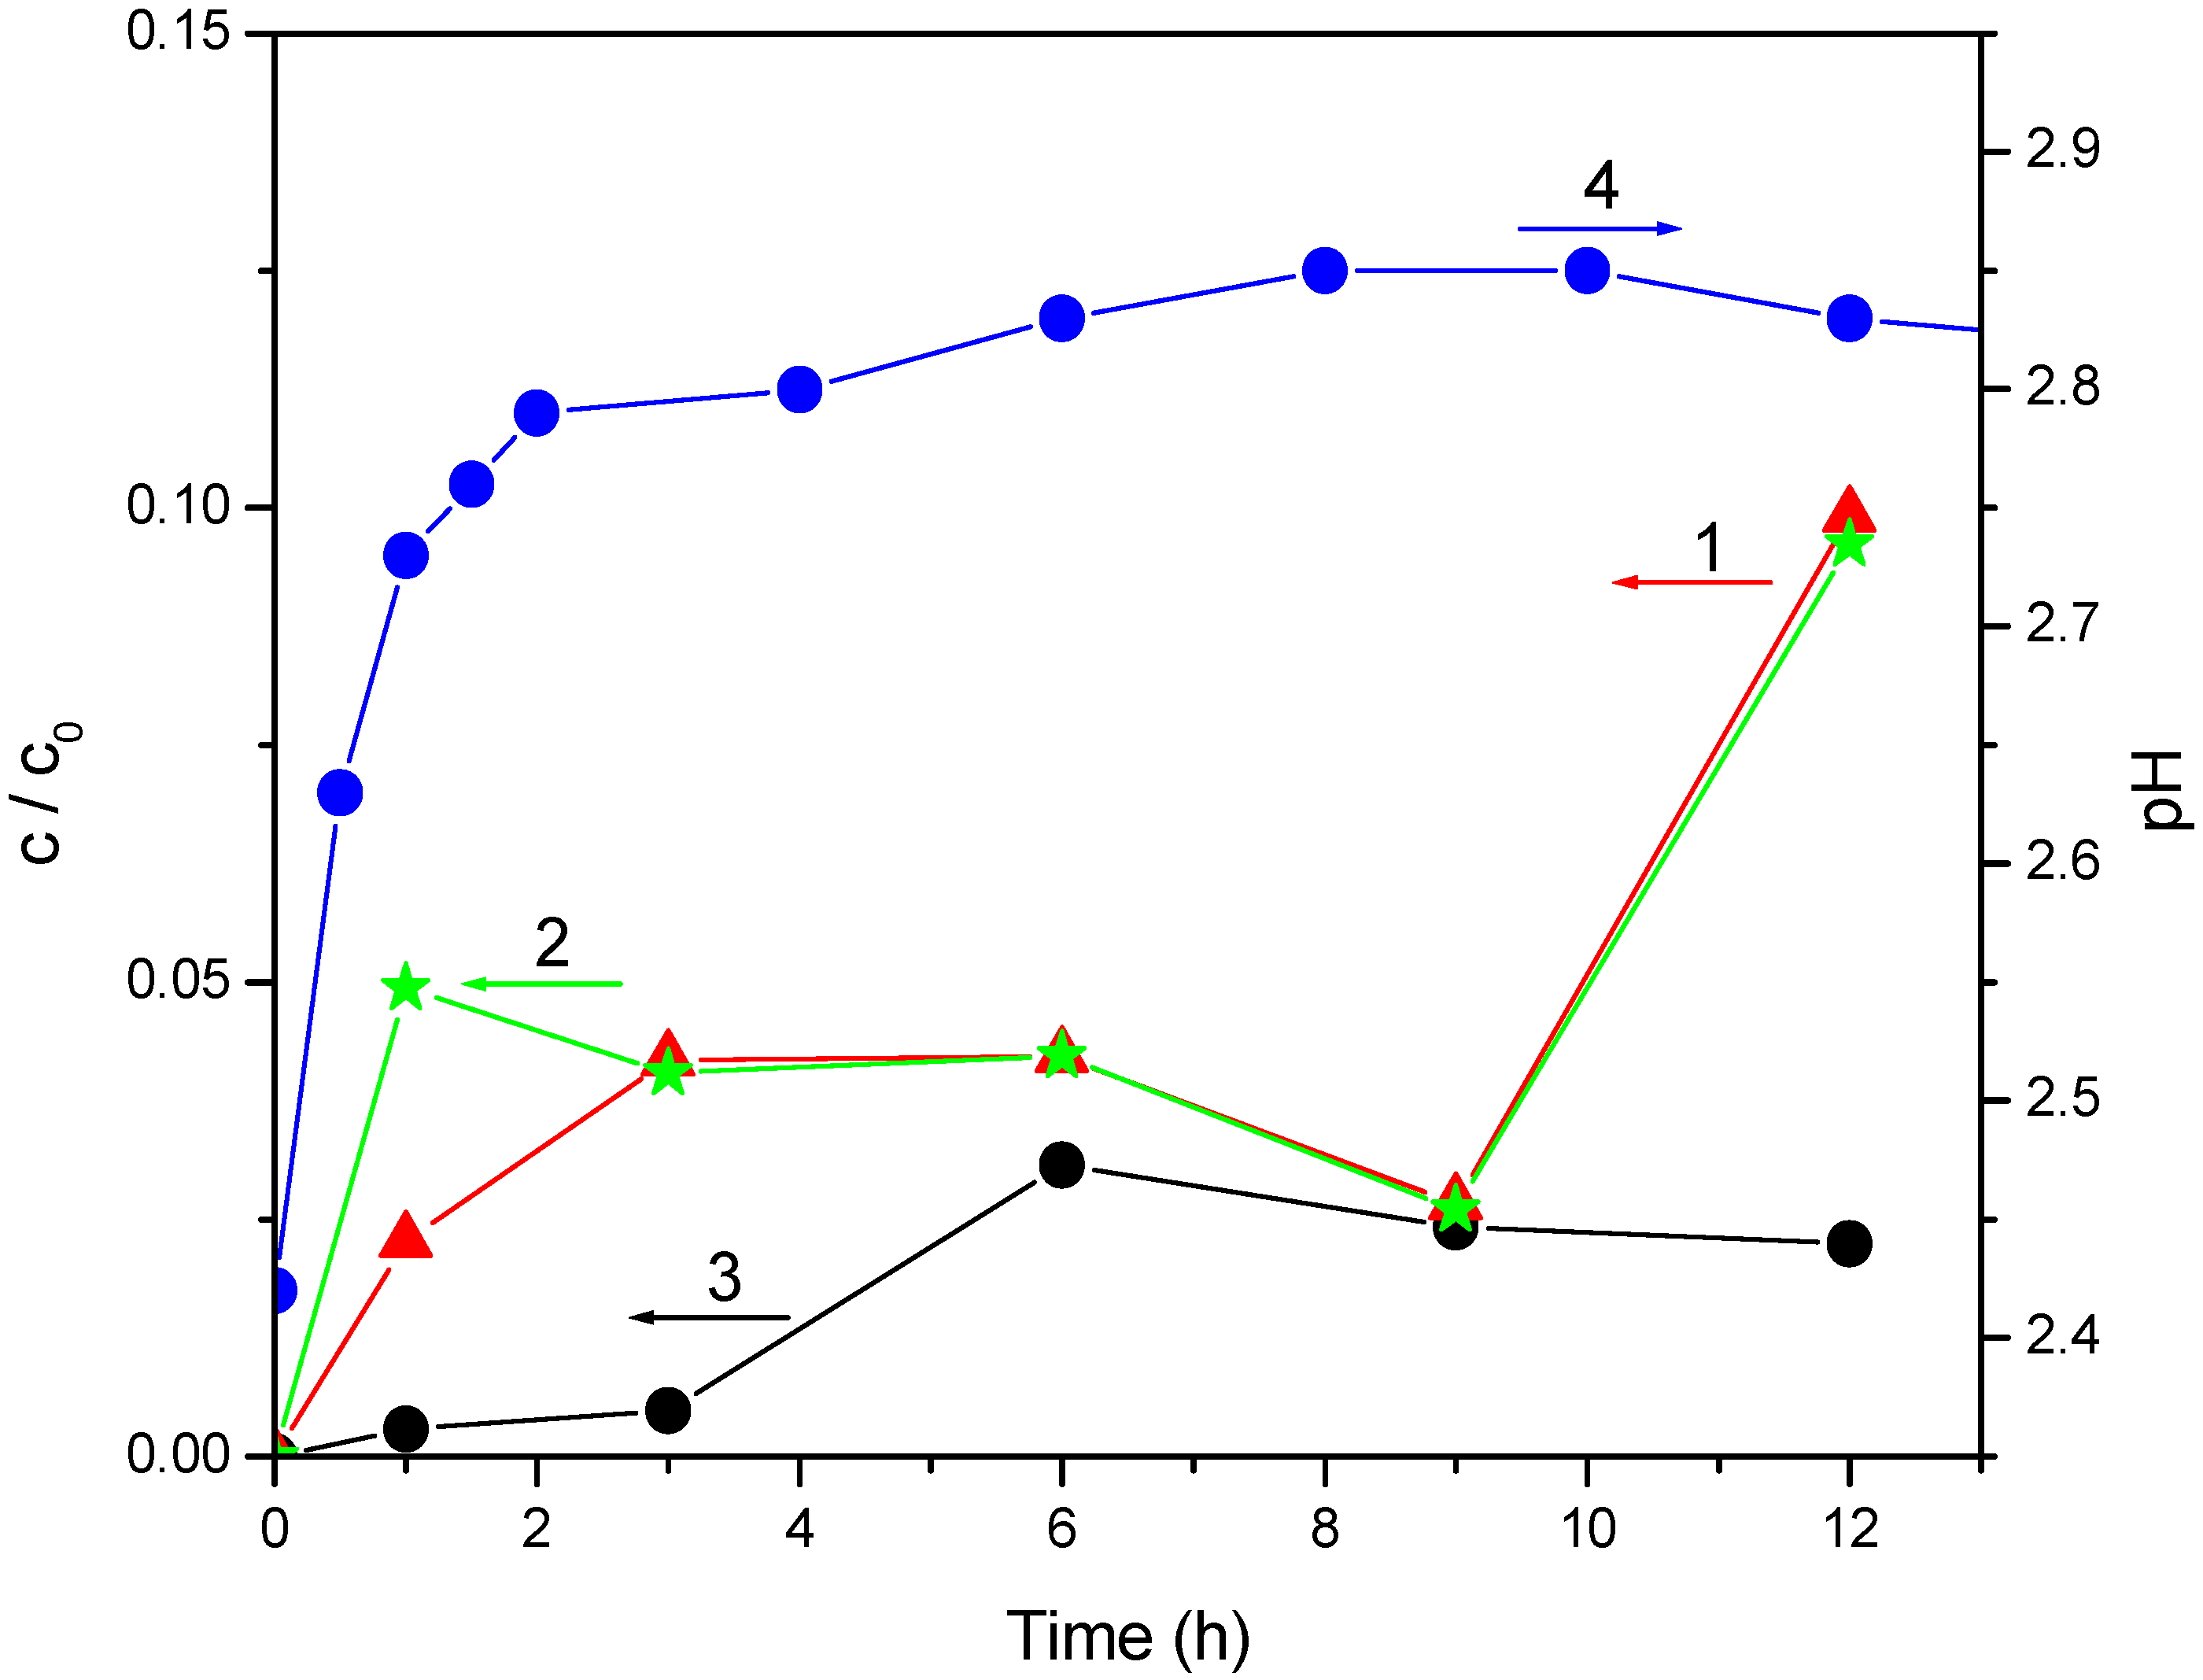
In view of the fact that N-doped TiO
2 appeared to be the most efficient as catalyst under visible light irradiation in the case of mecoprop photodegradation, ionic chromatography was employed to monitor the ionic degradation products. Since mecoprop contains covalently bounded chlorine, which is converted to chloride during photocatalytic degradation, the kinetics of chloride generation were monitored (
Figure 8, curve 1).
Figure 8.
Photocatalytic degradation of mecoprop (2.7 mmol/dm3) in the presence of N-doped TiO2 (1 mg/cm3): (1) chloride ion formation; (2) acetate ion formation; (3) formiate ion formation and (4) pH.
Figure 8.
Photocatalytic degradation of mecoprop (2.7 mmol/dm3) in the presence of N-doped TiO2 (1 mg/cm3): (1) chloride ion formation; (2) acetate ion formation; (3) formiate ion formation and (4) pH.
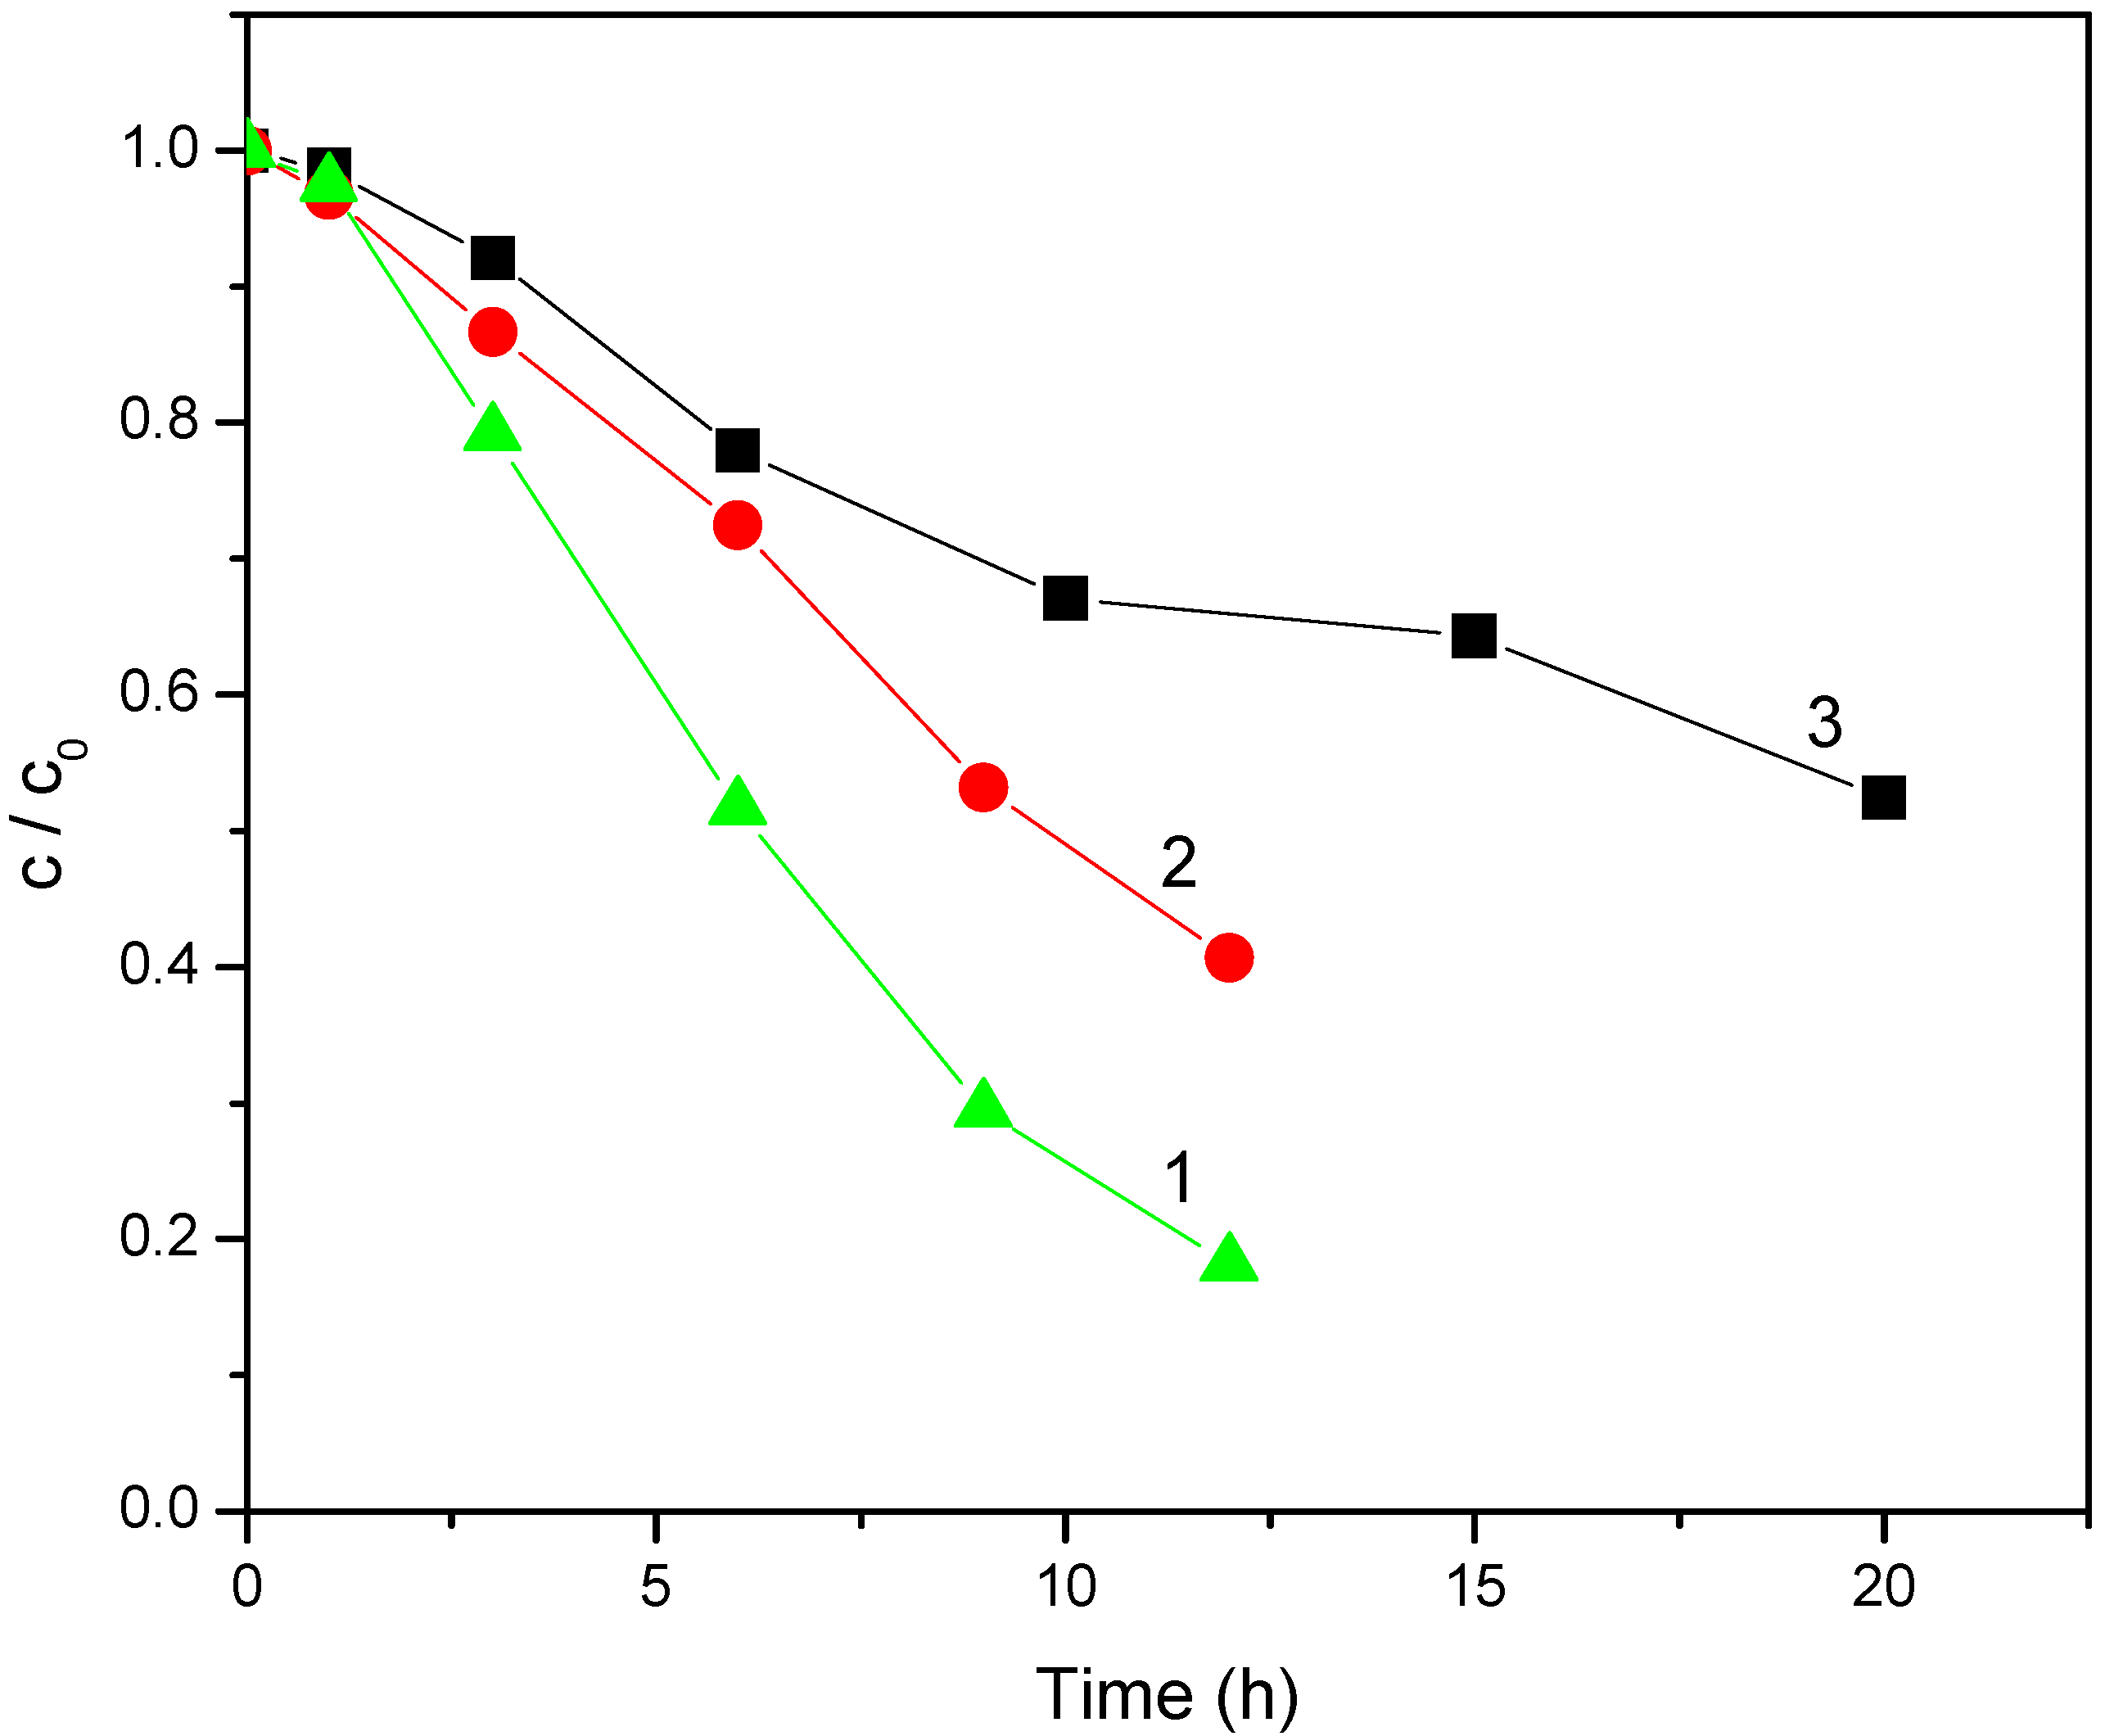
After 12 h a small quantity of chloride was registered. The reaction of chloride release is slower compared to that of mecoprop (
Figure 9, curve 1), as well as to aromatic ring (
Figure 9, curve 2) degradation. This suggests formation of aliphatic intermediates containing Cl, which indicates that the degradation mechanism of mentioned compound under visible light irradiation is different from that under UV irradiation [
18,
23]. Also, the slope of the spectrophotometrically obtained kinetic curve was smaller compared to that obtained by HPLC (
Figure 9, curve 1), which is understandable if we bear in mind that spectrophotometry monitored the kinetics of degradation of the aromatic ring (mecoprop and its degradation products with aromatic ring), whereas HPLC (at the retention time of 5.5 minute) measured only the change of mecoprop concentration. Besides, the rate of mecoprop degradation in the presence of the N-doped TiO
2 (
Figure 9, curve 2) whose synthesis is described in the present work, was compared to the rate measured in the presence of the catalyst obtained by mixing ammonia with titanium tetraisopropoxide [
19]. It was found that the 12-hour irradiation resulted in the degradation of 60% and 35%, respectively,
i.e., the N-doped TiO
2 synthesized in this work was significantly more efficient. Monitoring of the kinetics of photocatalytic degradation via the change in the pH has mainly been investigated for simple molecules, where practically no intermediates are formed, and therefore the formation of hydronium ions directly corresponds to the kinetics of degradation of the initial compound [
24]. This is generally not the case with more complex molecules, where the change in pH cannot be used for kinetic analysis, but even so, its monitoring during a photocatalytic process gives a valuable information about the changes in the investigated system. Thus, the loss of carboxylic group in the initial phase of photodegradation led to the formation of less acidic intermediates, which caused a smaller increase in the pH (
Figure 8, curve 4). Hence, it can be concluded that no HCl is released in this period. Under these experimental conditions acetate and formiate are formed (
Figure 8, curves 2 and 3, respectively), yielding CO
2 and H
2O. Hence, the final degradation products are CO
2, H
2O and HCl. These data are in agreement with those in the literature [
23]. TOC method showed a mineralization degree of mecoprop of 50% for 20 hours of irradiation (
Figure 9, curve 3).
Figure 9.
Photocatalytic degradation of mecoprop (2.7 mmol/dm3) in the presence of N-doped TiO2 (1 mg/cm3): (1) disappearance of mecoprop (HPLC, λ = 228 nm); (2) disappearance of aromatic ring (spectrophotometry, λ = 228 nm) and (3) total organic carbon (TOC).
Figure 9.
Photocatalytic degradation of mecoprop (2.7 mmol/dm3) in the presence of N-doped TiO2 (1 mg/cm3): (1) disappearance of mecoprop (HPLC, λ = 228 nm); (2) disappearance of aromatic ring (spectrophotometry, λ = 228 nm) and (3) total organic carbon (TOC).
2.3. Effect of substrate structure on photocatalytic activity
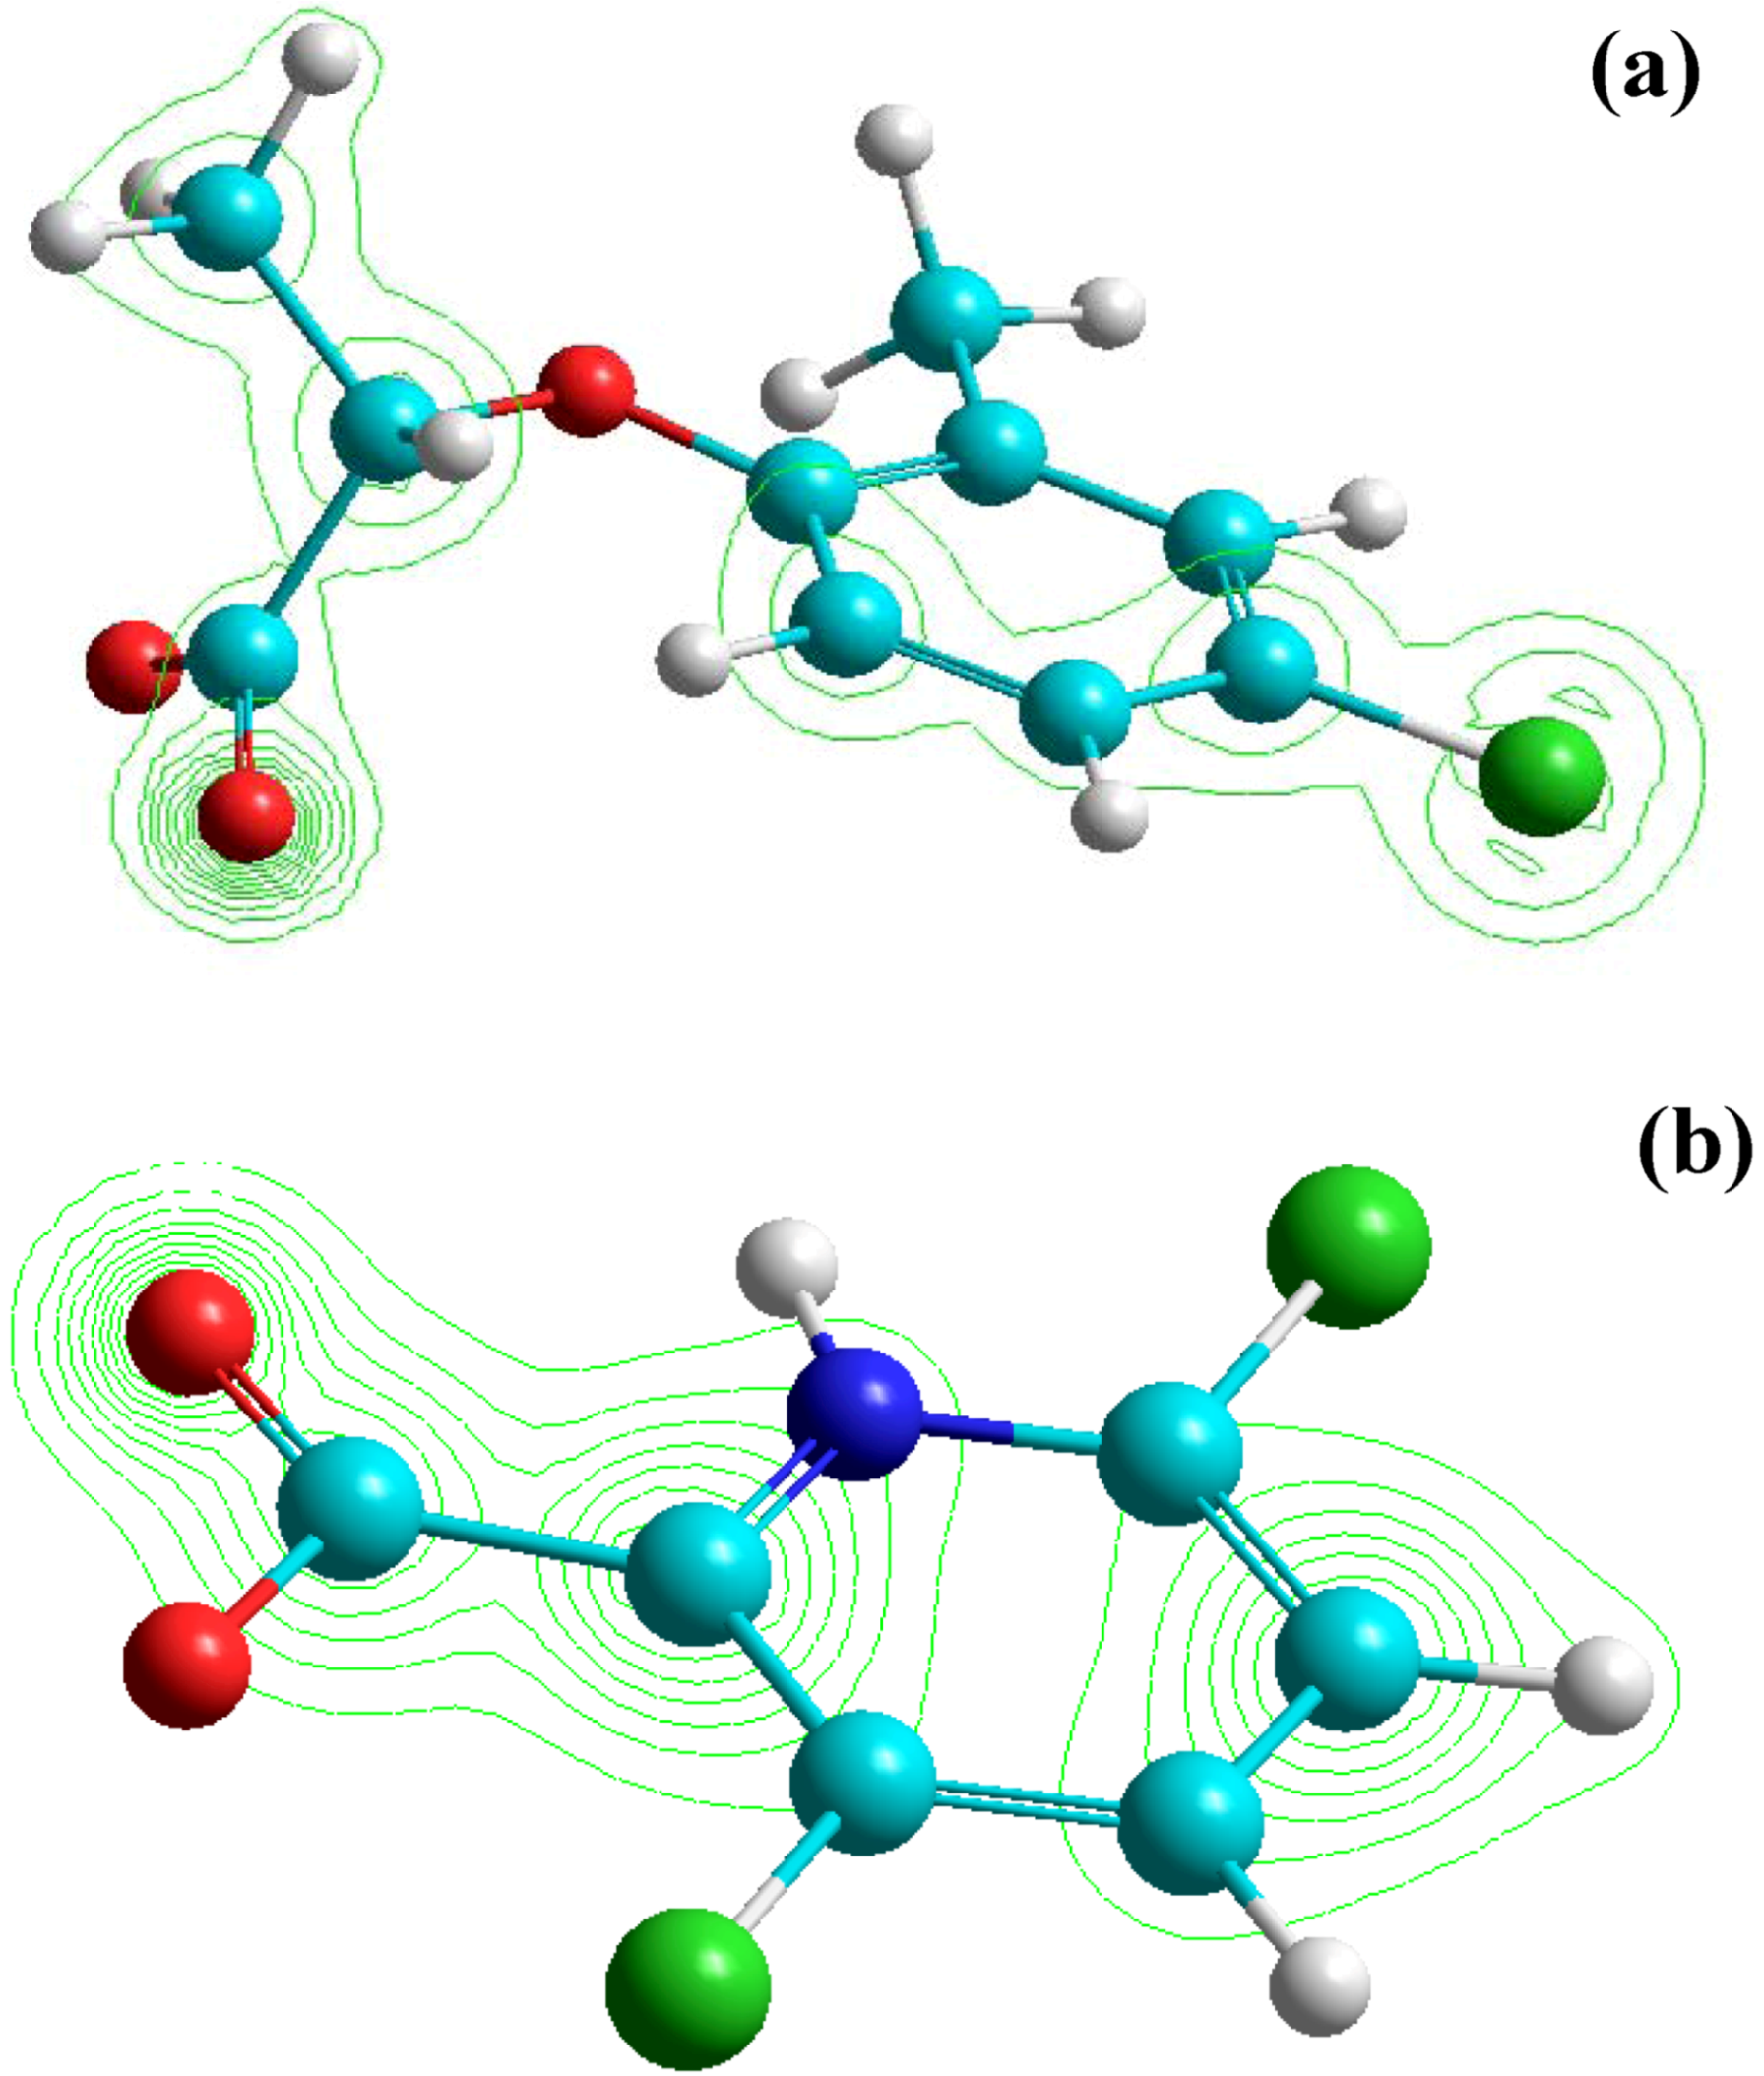
The differences in the degradation rate of substrates is directly related to the electron-donor or electron-withdrawing character of the different substituents in the herbicide aromatic/pyridine ring, which can activate or deactivate the ring with respect to the electrophilic attack of the
·OH radical. This may be explained in terms of the effect of Cl and CH
3 group as substituents. Namely, the higher reactivity of mecoprop compared to clopyralid is probably due to the presence of the benzene-ring activating CH
3 group (
Figure 1). The mecoprop molecule contains also Cl atom, playing a deactivating role. However, the clopyralid molecule has two Cl atoms bound to the pyridine ring, causing its lower reactivity compared to that of mecoprop. These results are in agreement with those reported in the literature [
25]. Also, it is known that pyridine, because of the presence of N atom in its ring, is less reactive than benzene, leading to lower reactivity of clopyralid compared to mecoprop. Besides, the presence of the electronegative COO
− group, clearly shown in the Hyperchem-derived total charge density (TCD) (
Figure 10), indicates that the bond between the substrate and the catalyst is realized via the COO
− group in the case of both herbicides, bearing in mind that the pH of the suspension is about 3, which renders the catalyst surface positively charged.
Figure 10 shows that the charge density on the COO
− group of mecoprop is higher compared to that of clopyralid, this property being directly proportional to the photoreactivity of the herbicide molecule.
Figure 10.
TCD maps for the herbicide molecules: mecoprop (a) and clopyralid (b). TCD contours are shown in green lines, C atoms - cyan, H atoms - white, O atoms - red, Cl atoms - green and N atom - blue.
Figure 10.
TCD maps for the herbicide molecules: mecoprop (a) and clopyralid (b). TCD contours are shown in green lines, C atoms - cyan, H atoms - white, O atoms - red, Cl atoms - green and N atom - blue.
The herbicides adsorption on TiO2 Degussa P25 was also assessed to determine how herbicide structure influences the adsorption on the catalyst. It appeared that the adsorption after 15-minute sonification of clopyralid suspension was very low (about 3%), the adsorption of mecoprop being somewhat more pronounced (about 6%). This is directly proportional to the photocatalytic degradation rate of the mentioned herbicides and may be still another explanation for the slower reaction of clopyralid compared to mecoprop.


