1. Introduction
Euphorbia lunulata Bge. (Euphorbiaceae) is a perennial herbaceous plant that has long been used in China as a traditional crude drug for the treatment of chronic bronchitis. Previous investigations of
E. lunulata Bge. have yielded some flavonoids and coumarins that have been reported to have anticancer, antioxidant, insulin and interleukin-10 (IL-10) mimicking activities [
1,
2,
3,
4,
5].
It is well known that obesity is often accompanied by hyperglycemia, hypertension, and hyperlipidemia, which are together known as metabolic syndrome. Obesity is the result of an increase in the number and size of adipocytes, in which adipocytes accumulate a large amount of lipids and become enlarged. Cultured 3T3-L1 adipocytes show many properties similar to those of normal adipocytes, lipids are accumulated during the differentiation and maturing process, the cytosolic enzyme glycerol-3-phosphate dehydrogenase (GPDH) appears to have an important role in the conversion of glycerol into triglyceride (TG), and the level of activity of GPDH increases during the conversion of 3T3 cells. Recent studies indicate that obesity is associated with low-grade chronic inflammation of adipose tissues, and the obese adipose tissue is characterized by increased infiltration of macrophages. In a coculture system of 3T3-L1 adipocytes and RAW264 macrophages, marked increases in secretion levels of inflammatory mediators such as TNF-α, MCP-1, and nitric oxide (NO) were observed [
6,
7,
8]. NO mediates diverse functions by acting on various cells through interactions with different molecular targets, and excessive NO production is involved in various types of inflammation [
9]. Therefore, as a part of our continuing investigation of anti-adipogenesis and anti-inflammatory agents from natural sources [
10], the chemical composition of the whole plant of
E. lunulata Bge. has been examined.
In the present study, the 70% acetone extract of the whole plant of
E. lunulata Bge. and the ethyl acetate soluble portion of the extract were observed to inhibit the accumulation of TG in 3T3-L1 cells, and inhibit NO production in lipopolysaccharide (LPS) and interferon-γ (IFN-γ) activated macrophages. Furthermore, an attempt to identify the bioactive compounds present in this plant led to the isolation of a new flavonol galactopyranoside gallate, myricetin 3-
O-(2'',3''-digalloyl)-β-
D-galactopyranoide (
1), and 23 known constituents, including myricetin 3-
O-(2''-galloyl)-β-
D-galactopyranoide (
2) [
11], myricitrin (
3) [
12], myricetin (
4) [
13], quercetin 3-
O-(2'',3''-digalloyl)-β-
D-galactopyranoide (
5) [
2], quercetin 3-
O-(2''-galloyl)-
β-
D-galactopyranoide (
6) [
14], hyperin (
7) [
15], isoquercetrin (
8) [
16], quercetin (
9) [
17], kaempferol (
10) [
18], apigenin (
11) [
19], luteolin (
12) [
19], 3-
O-methylquercetin (
13) [
20], 5,7,2',5'-tetrahydroxyflavone (
14) [
21], 1,3,4,6-
tetra-
O-galloyl-β-
D-glucose (
15) [
22], 1,2,6-
tri-
O-galloyl-β-
D-glucose (
16) [
23], 1,3,6-
tri-
O-galloyl-β-
D-glucose (
17) [
24], gallic acid (
18) [
25], protocatechuic acid (
19) [
26], 3,4,5-trimethoxybenzoic acid (
20) [
27], 2,6-dihydroxyacetophenone(
21) [
28], 3,3'-
di-
O-methylellagic acid (
22) [
29], ellagic acid (
23) [
30] and esculetin (
24) [
31] (
Figure 1). Among these compounds,
1–4,
8,
11–17, and
19–22 were isolated from
E. lunulata Bge. for the first time. We also describe their inhibitory activity towards the differentiation of 3T3-L1 preadipocytes and TG accumulation in maturing adipocytes, and their inhibition of NO production in RAW 264.7 cells in this contribution.
Figure 1.
Structures of compounds 1–24.
Figure 1.
Structures of compounds 1–24.
2. Results and Discussion
Whole plants of Euphorbia lunulata Bge. were extracted with 70% aqueous acetone, followed by evaporation of the solvent under reduced pressure from the combined extract to give the 70% acetone extract. The extract [TG and NO inhibitory activity: 50%, 89%, respectively (100 μg/mL)] was dissolved in water and successively partitioned to give a chloroform layer [68%, 71% (30 μg/mL)], ethyl acetate layer [70%, 76% (30 μg/mL)], n-butanol layer [41%, 23% (30 μg/mL)], and aqueous layer [32%, 8% (30 μg/mL)]. We have focused our efforts on investigating the chemical constituents of the ethyl acetate soluble fraction, which was separated by Diaion HP-20 column chromatography to yield eight fractions from which twenty three compounds were isolated. One compound was isolated from the chloroform layer.
Compound
1 was obtained as a yellow amorphous powder and gave positive Mg-HCl and FeCl
3 tests. The molecular formula of
1 was established as C
35H
28O
21 by HR-FAB-MS. The UV spectrum exhibited absorption maxima at 268 and 355 nm, suggesting the presence of aromatic rings in the molecule. The IR spectrum contained absorption bands for a hydroxyl group (3,396 cm
−1), ester carbonyl (1,703 cm
−1) and conjugated carbonyl (1,656 cm
−1), and aromatic ring (1,608, 1,497 cm
−1). The
1H-NMR spectrum of
1 indicated
meta-coupled proton signals at δ 6.31 (1H, d,
J = 2.1 Hz) and 6.14 (1H, d,
J = 2.1 Hz), and an A
2-type aromatic proton signal at δ 7.27 (2H, s). These data for the aromatic region matched those of myricetin 3-
O-(2''-galloyl)-β-
D-galactopyranoide (
2) and myricetin (
4), indicating the aglycone was most likely a myricetin (
Table 1). Except for the aglycone signals, the
1H- and
13C-NMR spectra of
1 showed the presence of two galloyl groups [δ
H 7.03, 7.02, (each 2H, s); δ
C 166.4 (C=O), 166.2 (C=O), 145.1 (×4), 138.8, 138.7, 119.1, 118.7, 109.4 (×2), 109.3 (×2)], and a sugar of the anomeric proton signal at δ 5.94 (1H, d,
J = 8.1 Hz). The sugar was found to be
4C
1 galactopyranose with the help of
1H-
1H COSY. These data coupled with the FAB-MS data indicated that
1 may be a digallate of myricetin galactopyranoside. Myricetin, gallic acid, and
D-galactose were identified by hydrolysis of
1 (see Experimental). Furthermore, comparative analysis of the
13C-NMR data of the aglycone carbons in
1 with those of
4 showed an upfield shift of C-3 (
Δδ 1.6 ppm), a downfield shift of C-2 (
Δδ 9.7 ppm) and C-4 (
Δδ1.8 ppm), suggesting the location of the sugar was at C-3 [
32]. This was further supported by HMBC correlations, the anomeric proton signal δ 5.94 (H-1'') showed long-range correlation with the carbon signal at δ 134.0 (C-3) (
Figure 2). The locations of the two galloyl groups in
1 were confirmed to be at C-2'' and C-3'' of the galactosyl moiety by the remarkable downfield shifts of H-2'' (δ 5.81, dd,
J = 10.2, 8.1 Hz), and H-3'' (δ 5.18, dd,
J = 10.2, 3.0 Hz) signals, a finding which was further supported by HMBC correlations between the sugar protons at δ5.81 and δ5.18 with the carbon signals (δ 166.4, 166.2) of the two galloyl carbonyls (
Figure 2). Based on the foregoing findings,
1 was determined to be myricetin 3-
O-(2'',3''-digalloyl)-β-
D-galactopyranoide.
Table 1.
1H- and 13C-NMR Spectral Data of compounds 1, 2 and 4 [(300/75 MHz, in methanol-d4, TMS, δ (ppm) (J = Hz)].
Table 1.
1H- and 13C-NMR Spectral Data of compounds 1, 2 and 4 [(300/75 MHz, in methanol-d4, TMS, δ (ppm) (J = Hz)].
| Position | 1 | 2 | 4 |
|---|
| δH | δC | δH | δC | δH | δC |
|---|
| 2 | | 156.4 | | 156.6 | | 146.7 |
| 3 | | 134.0 | | 134.0 | | 135.6 |
| 4 | | 177.6 | | 177.4 | | 175.8 |
| 4a | | 104.6 | | 104.7 | | 103.3 |
| 5 | | 161.7 | | 161.7 | | 161.1 |
| 6 | 6.14 (d 2.1) | 98.5 | 6.13 (d 2.1) | 98.5 | 6.17 (d 2.1) | 98.1 |
| 7 | | 164.5 | | 164.4 | | 164.2 |
| 8 | 6.31 (d 2.1) | 93.3 | 6.30 (d 2.1) | 93.3 | 6.36 (d 2.1) | 93.2 |
| 8a | | 156.6 | | 156.8 | | 156.8 |
| 1' | | 120.6 | | 120.8 | | 121.8 |
| 2' | 7.27 (s) | 108.6 | 7.25 (s) | 108.6 | 7.32 (s) | 107.3 |
| 3' | | 144.9 | | 144.9 | | 145.4 |
| 4' | | 136.6 | | 136.6 | | 136.1 |
| 5' | | 144.9 | | 144.9 | | 145.4 |
| 6' | 7.27 (s) | 108.6 | 7.25 (s) | 108.6 | 7.32 (s) | 107.3 |
| 1'' | 5.94 (d 8.1) | 100.1 | 5.77 (d 7.8) | 100.2 | | |
| 2'' | 5.81 (dd 10.2, 8.1) | 74.8 | 5.43 (dd 9.9, 7.8) | 73.5 | | |
| 3'' | 5.18 (dd 10.2, 3.0) | 70.7 | 3.84 (dd 9.9, 3.6) | 72.4 | | |
| 4'' | 4.28 (d 3.0) | 66.9 | 3.95 (d 3.6) | 69.5 | | |
| 5'' | 3.75 (m) | 76.3 | 3.61 (m) | 76.4 | | |
| 6'' | 3.71, 3.69 (m) | 60.8 | 3.71, 3.69 (m) | 61.0 | | |
| 1''' | | 119.1, 118.7 | | 120.4 | | |
| 2''',6''' | 7.03, 7.02 (s) | 109.4, 109.3 | 7.12 (s) | 109.5 | | |
| 3''',5''' | | 145.1 | | 145.0 | | |
| 4''' | | 138.8, 138.7 | | 138.5 | | |
| C=O | | 166.4, 166.2 | | 166.7 | | |
Figure 2.
Key HMBC correlations of 1.
Figure 2.
Key HMBC correlations of 1.
Compounds 2–24 were identified as known compounds by detailed comparisons of their spectroscopic data with that in the literature.
Compounds
1–24 were next evaluated for their inhibitory effects on triglyceride accumulation and GPDH activity in 3T3-L1 cells at the concentration of 30 μM (
Figure 3). The major component, quercetin (
9, 0.038% yield), which has been reported to have inhibitory effects on triglyceride accumulation, was used as a positive control [
10,
33]. As shown in
Figure 3, the hydrolysable tannins,
15–17,
22 and
23 showed significant inhibition of adipogenesis in 3T3-L1 adipocytes, with TG inhibition values of 75.7%, 72.2%, 56.6%, 64.2% and 72.8%, respectively. The flavonol galactopyranoside gallates,
1,
2,
5 and
6 showed moderate TG inhibitory activities (43.7%, 30.5%, 55.5% and 32.5% inhibition, respectively). Comparing
1 with
2 and
5 with
6, compounds
1,
5 showed stronger TG and GPDH activity inhibition than
2 and
6, respectively; these results suggest that the galloyl group may enhance their activities. The flavonols,
7,
8,
9,
10 and
13 showed moderate TG inhibitory activities (35.8%, 27.7%, 42.4%, 40.8% and 25.9% inhibition, respectively), which were stronger than the flavones,
11,
12 and
14 with TG inhibitions 20.3%, 13.7%, and 15.9%, respectively. The phenylpropanoids
18–21 and coumarin
24 showed weak inhibitory effects on TG and GPDH activity. Furthermore, effects of isolated compounds on cell viability of 3T3-L1 cells were measured by MTT assay. As shown in
Figure 3, the isolated compounds of
15–17,
22 and
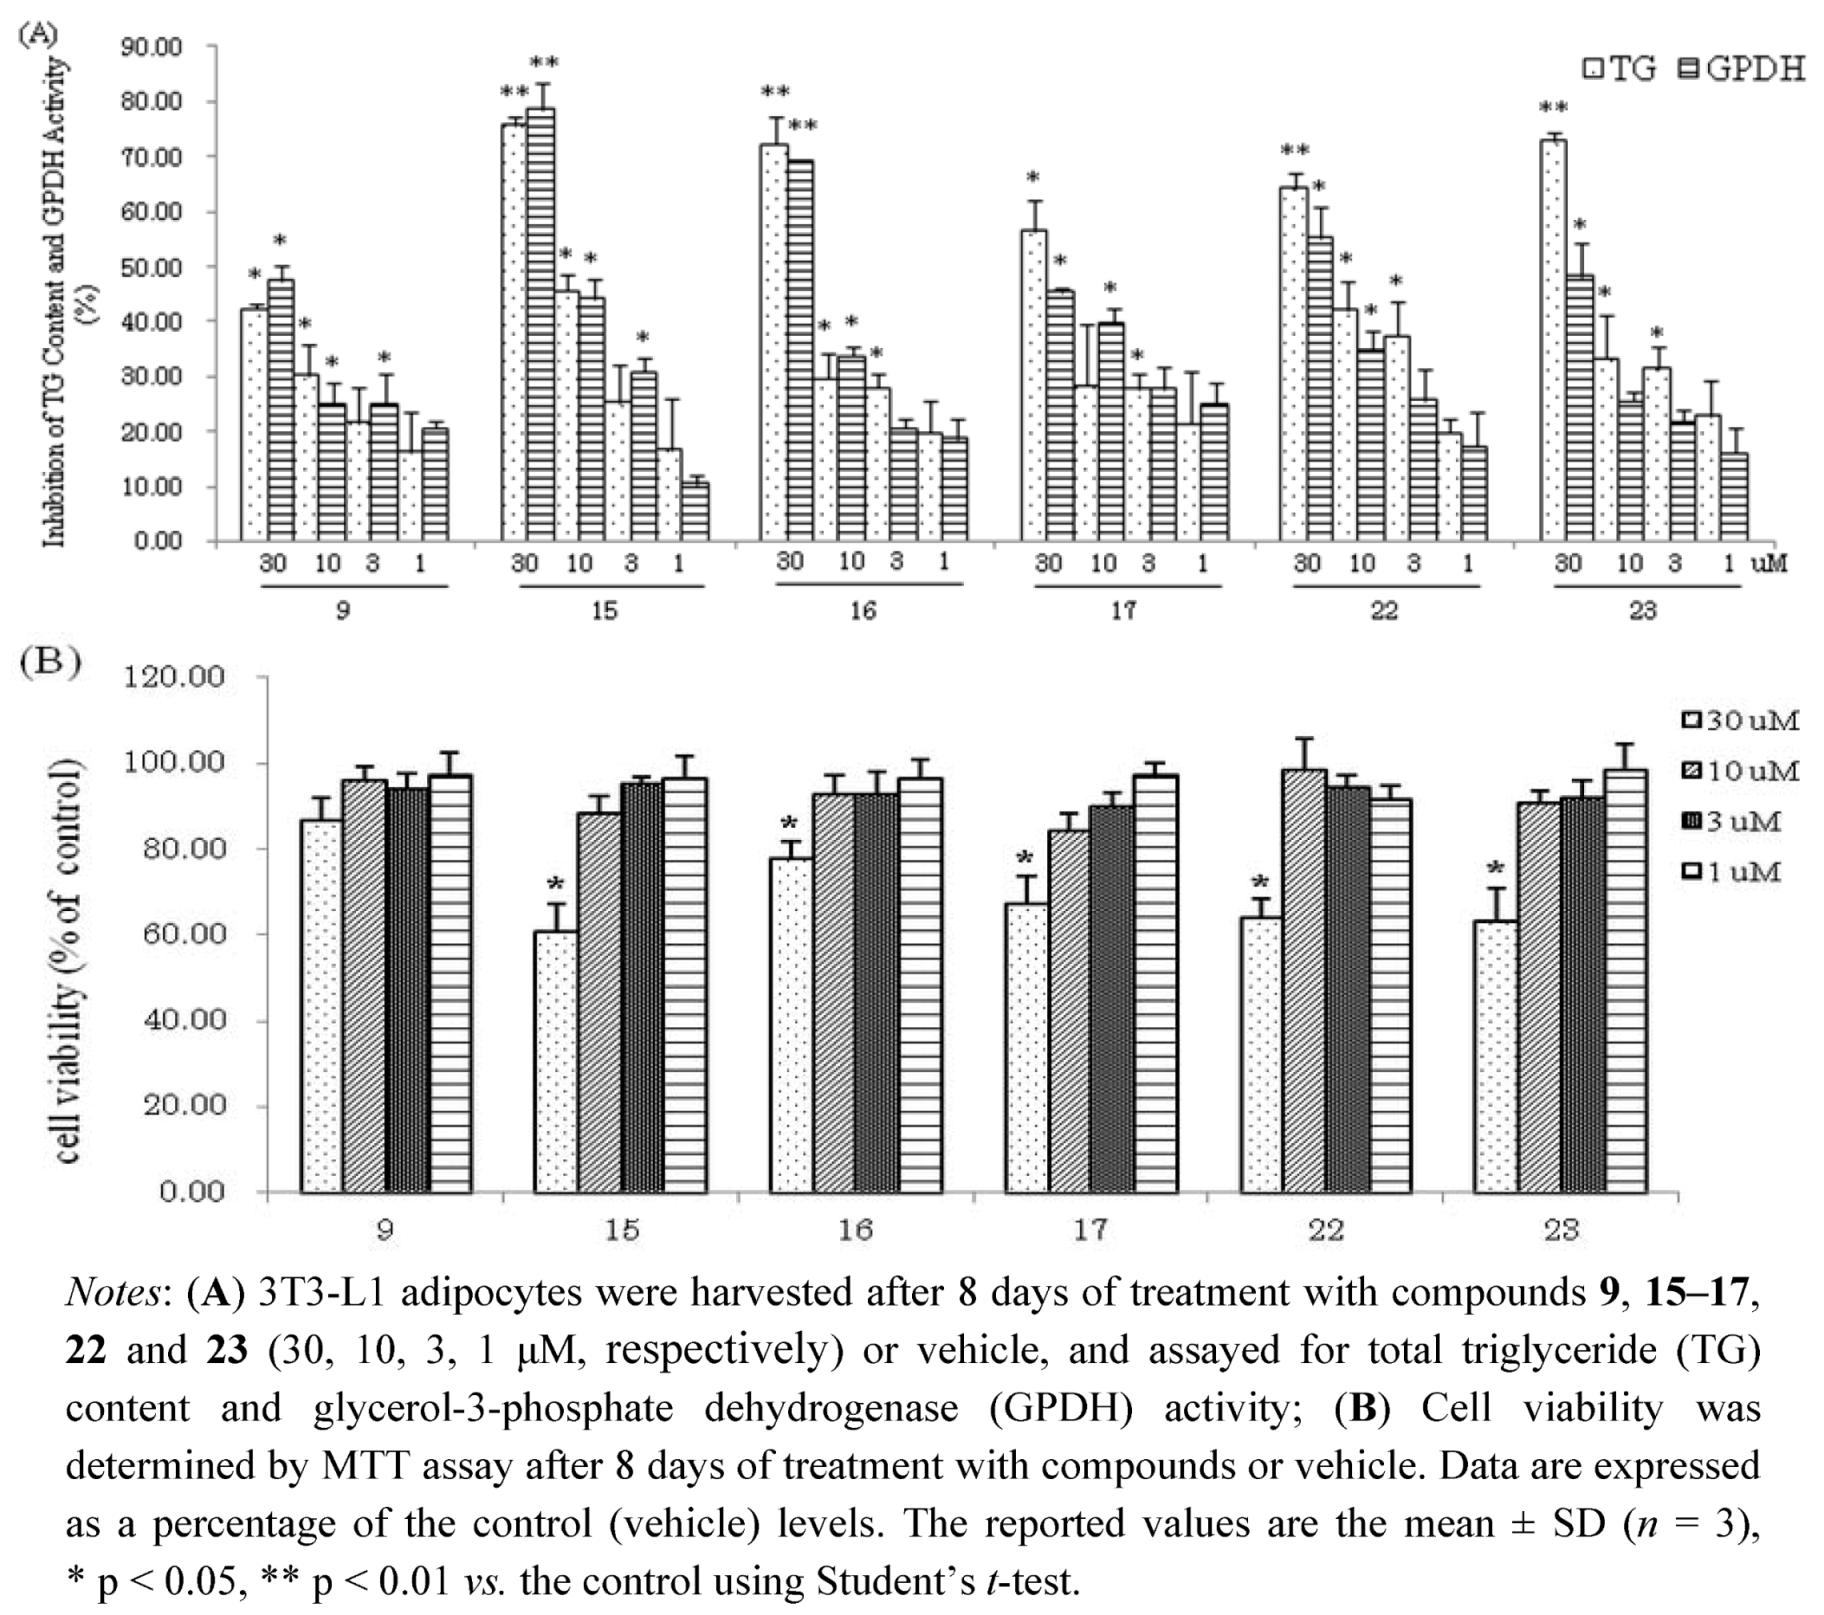
23 had effects on viability of 3T3-L1 at concentration of 30 μM. However, these compounds at low concentrations (10, 3, 1 μM, respectively) suppressed the differentiation of 3T3-L1 preadipocytes and TG accumulation in maturing adipocytes without exerting cytotoxicity (
Figure 4). The hydrolysable tannin,
15 and
22 showed significant inhibitions of TG content and GPDH activity at the concentration of 10 μM,
15 with values of 45.6% and 44.2%,
22 with values of 42.0% and 34.7%, respectively.
Figure 3.
(A) Inhibition of TG Content and GPDH Activity by the isolated compounds in 3T3-L1 Adipocytes; (B) Cell viability of 3T3-L1 cells by MTT assay.
Figure 3.
(A) Inhibition of TG Content and GPDH Activity by the isolated compounds in 3T3-L1 Adipocytes; (B) Cell viability of 3T3-L1 cells by MTT assay.
Figure 4.
(A) Inhibition of TG Content and GPDH Activity by compounds 9, 15-17, 22 and 23 at low concentrations in 3T3-L1 Adipocytes; (B) Cell viability of 3T3-L1 cells by MTT assay.
Figure 4.
(A) Inhibition of TG Content and GPDH Activity by compounds 9, 15-17, 22 and 23 at low concentrations in 3T3-L1 Adipocytes; (B) Cell viability of 3T3-L1 cells by MTT assay.
Compounds
1–24 also examined with respect to their inhibition of NO production stimulated by LPS and IFN-
γ in RAW 264.7 cells (
Table 2). In the assay, aminoguanidine, which has been reported to have inhibitory effects on NO production in LPS activated RAW 264.7 macrophages by down-regulation of inducible nitric oxide synthase (iNOS), was used as a positive control (IC
50 17.5 μM) [
34]. As shown in
Table 2, in general, all compounds except
3,
7,
8,
18,
20,
21 and
24 showed NO production inhibitory activities with IC
50 values lower than 100 μM. Furthermore, the hydrolysable tannins,
15 and
17, showed slightly stronger NO production inhibitory effects than aminoguanidine, with IC
50 values of 14.2 and 16.9 μM, respectively; compounds
16,
22 and
23 showed moderate NO inhibitory activity, with IC
50 values of 21.7, 18.5 and 26.1 μM, respectively. These results showed that the hydrolysable tannins were the significantly active compounds in
E. lunulata Bge. In addition, the free flavonoids,
4,
9,
10,
11,
12,
13 and
14, showed strong or moderate NO inhibitory activity, with IC
50 values of 37.2, 20.6, 21.5, 17.9, 23.8, 42.6 and 18.5μM, respectively. The flavonol glycosides,
3,
7 and
8, showed no inhibition. However, the flavonol galactopyranoside gallates,
1,
2,
5 and
6, showed little or moderate NO inhibitory activity, with IC
50 values of 62.3, 48.6, 56.8 and 43.2 μM, respectively. In contrast, the descending orders of the NO inhibitory activities were:
4 >
2 >
1 >
3 (myricetin derivatives), and
9 >
6 >
5 >
7,
8 (quercetin derivatives). These results showed that the free flavonoids exerted stronger activities than the corresponding glycosides, and the conjugation of gallic acid may have enhanced the activities of the flavonoid glycosides, even though gallic acid (
18) itself showed no inhibition. Furthermore, effects of isolated compounds on cell viability of RAW264.7 cells were measured by MTT assay. As shown in
Figure 5, the isolated compounds had no effects on viability of RAW264.7 at concentration of IC
50 values.
Table 2.
Inhibition by isolated compounds of NO production stimulated by LPS and IFN-γ in RAW 264.7 cells.
Table 2.
Inhibition by isolated compounds of NO production stimulated by LPS and IFN-γ in RAW 264.7 cells.
| Compound | IC50 (μM) | Compound | IC50 (μM) |
|---|
| 1 | 62.3 | 13 | 42.6 |
| 2 | 48.6 | 14 | 18.5 |
| 3 | >100 | 15 | 14.2 |
| 4 | 37.2 | 16 | 21.7 |
| 5 | 56.8 | 17 | 16.9 |
| 6 | 43.2 | 18 | >100 |
| 7 | >100 | 19 | 19.8 |
| 8 | >100 | 20 | >100 |
| 9 | 20.6 | 21 | >100 |
| 10 | 21.5 | 22 | 18.5 |
| 11 | 17.9 | 23 | 26.1 |
| 12 | 23.8 | 24 | >100 |
| Aminoguanidine | 17.5 | | |
Figure 5.
Effects of isolated compounds on cell viability of RAW264.7 cells by MTT assay.
Figure 5.
Effects of isolated compounds on cell viability of RAW264.7 cells by MTT assay.
3. Experimental
3.1. General
The UV spectrum was obtained in MeOH on a Shimadzu UV-160 spectrophotometer, and the IR spectrum was recorded on a JASCO FT/IR 300E spectrophotometer. Optical rotations were measured in MeOH on a JASCO P-1020 polarimeter. The NMR spectra were recorded on a Varian Mercury 300 spectrometer, with TMS as an internal standard. The MS were obtained on a JEOL GCmate mass spectrometer. Column chromatography was carried out with Diaion HP-20 (Mitsubishi Chemical Co.), Sephadex LH-20 (Pharmacia), MCI Gel CHP20P (Mitsubishi Chemical Co.) and Chromatorex ODS (Fuji Silysia Chemical Ltd.). Thin-layer chromatography (TLC) was performed on Merck TLC plates (0.25 mm thickness), with compounds visualized by spraying with 5% (v/v) H2SO4 in ethanol solution and then heating on a hot plate. HPLC was performed on a JASCO PU-2089 apparatus equipped with JASCO UV-2075 and Shodex OR-2. Senshu Pak Silica 60-5(10 × 150 mm i.d.), YMC-Pack Pro C18 (10 × 150 mm i.d.), YMC-Pack ODS Al (10 × 150 mm i.d.) and Cosmosil 5C18 PAQ (10 × 150 mm i.d.) was used for preparative purposes. A CAPCELL Pak NH2 column (4.6 × 250 mm i.d.) was used for the detection of D-galactose.
3.2. Plant Material
Whole plants of E. lunulata Bge. were collected in Hebei Province, China, in October 2006 and were identified by Professor Naili Wang (Shenyang Pharmaceutical University, China). Voucher specimens have been deposited at the Laboratory of Pharmacognosy, School of Pharmacy, Nihon University.
3.3. Extraction and Isolation
The whole plants of E. lunulata Bge. (4.75 kg) were extracted twice with 70% acetone and concentrated to give the extract. This extract (721 g) was dissolved and suspended in water (3 L) and partitioned into a chloroform layer (81 g), ethyl acetate layer (50 g), n-butanol layer (81 g) and water layer (490 g). The ethyl acetate layer was subjected to Diaion HP-20 column chromatography and eluted with CH3OH-H2O to afford eight fractions. Fractions 1 and 2 were purified using Sephadex LH-20 column chromatography and eluted with CH3OH-H2O to give 3 (856 mg) and 16 (88 mg), respectively. Fraction 3 was purified using Sephadex LH-20 and ODS column chromatography, and reverse-phase HPLC eluted with CH3OH-H2O to give 1 (9 mg), 2 (13 mg), 5 (15 mg), 6 (607 mg), 7 (200 mg), 9 (68 mg), 15 (39 mg), 16 (5 mg) and 17 (7 mg). Fraction 4 was purified using CHP20P column chromatography and reverse-phase HPLC eluted with CH3OH-H2O to give 3 (10 mg), 4 (8 mg), 8 (11 mg) and 20 (26 mg). Fraction 5 was purified using CHP20P column chromatography and reverse-phase HPLC eluted with CH3OH-H2O to give 9 (1,800 mg), 12 (18 mg) and 14 (6 mg). Fraction 6 was purified using CHP20P column chromatography and reverse-phase HPLC eluted with CH3OH-H2O to give 10 (9 mg), 11 (10 mg), 13 (6 mg), 21 (5 mg), 22 (125 mg) and 23 (68 mg).The chloroform layer was subjected to silica gel column chromatography and reverse-phase HPLC to give 24 (25 mg).
Myricetin 3-O-(2'',3''-digalloyl)-β-D-
galactopyranoide (
1). Yellow amorphous powder; Negative HR-FAB-MS
m/z: 783.1040 (Calcd for C
35H
27O
21, 783.1043); [α]
D25 −18.9° (c = 0.10, MeOH). UV (MeOH) λ
max nm (log ε): 210 (4.62), 268 (4.27), 355 (3.96); IR (KBr) ν
max cm
−1: 3,396, 1,703, 1,656, 1,608, 1,497, 1,451, 1,352, 1,300, 1,272, 1,231, 1,075, 1,036, 942, 876, 760;
1H- and
13C-NMR data, see
Table 1.
3.4. Acid Hydrolysis of 1 and Identification of Sugar
Compound 1 (5 mg) was dissolved in 10% H2SO4 and heated at 85 °C for 3 h. After cooling, the reaction mixture was neutralized by passage though an Amberlite IRA-93ZU (Organo) column and then partitioned between ethyl acetate and water. The ethyl acetate layer was concentrated and the concentrate was passed through an ODS column, and then successively eluted with 20% MeOH and 50% MeOH. Gallic acid was recovered from the 20% MeOH fraction, and myricetin from the 50% fraction by direct comparison with authentic samples. Silica gel TLC of the water layer in BuOH:Me2CO:H2O (4:5:1) showed the sugar was most likely a galactose (Rf 0.22) by direct comparison with authentic sample. The water layer was then analyzed by HPLC under the following conditions: column, CAPCELL Pak NH2 (4.6 × 250 mm i.d.); solvent, CH3CN:H2O = 75:25; flow rate 1.0 mL/min; detector, Shodex OR-2. D-galactose present in the water layer was identified by comparing its retention time and polarity with those of an authentic sample; tR (min):16.8 min (D-galactose, positive polarity).
3.5. Triglyceride (TG) Content and Glycerol-3-phosphate Dehydrogenase (GPDH) Activity in 3T3-L1 Cells [10,35]
3T3-L1 preadipocytes (American Type Culture Collection, Manassas, VA, USA) were subcultured in Dulbecco’s Modified Eagle’s Medium (DMEM) containing 10% newborn calf serum (Gibco) at 37 °C under a humidified 5% CO2 atmosphere. Briefly, 2 days after reaching confluence (day 0), the 3T3-L1 preadipocytes were induced by switching the differentiation medium to DMEM containing 10% fetal bovine serum (FBS) (SAFC Biosciences), 500 μM 3-isobutyl-1-methylxanthine (Sigma), 1 μM dexamethasone (Sigma), and 10 μg/mL insulin (Sigma) for three days. The medium was then replaced with DMEM containing 10% FBS and 5 μg/mL insulin, and was changed every 2 or 3 days.
The 3T3-L1 preadipocytes were seeded at 1.0 × 10⁵ cells/mL onto 24-well plates (Sumitomo Bakelite, MS-80240, Tokyo) and incubated at 37 °C. A test sample was added to the medium on day 0, and added at the time of every medium change during the 8 days of incubation. After removing the medium, the cells were washed twice with 500 μL of PBS. The cells were collected in 500 μL of cold sonication buffer (pH 7.5 25 mM Tris buffer containing 1 mM EDTA) and sonicated in ice-cold water. After centrifugation, the cell lysate was used to measure the TG content with LabAssayTM Triglyceride (WAKO Pure Chemical Industries Ltd.), GPDH activity with a GPDH Assay Kit (TaKaRa Bio Inc.), and DNA quantity with a DNA Quantity Kit (Primary Cell Co., Ltd.), according to the manufacturer's protocol. Inhibition of TG and GPDH activity was calculated using the following formula: Inhibition (%) = [(Cn − S)/Cn] × 100, where S is TG amount or GPDH activity when cells incubated with sample and divided by the amount of DNA for each well; Cn is TG amount or GPDH activity when cells incubated with DMSO (control) were divided by the amount of DNA for each well). Cell viability was confirmed by microscopic observation, and was measured using the 3-(4,5-dimethyl-2-thiazolyl)-2,5-diphenyl-2H-tetrazolium bromide (MTT) assay method.
3.6. NO Production in Activated Macrophage-Like Cell Line, RAW 264.7 [10,36]
The macrophage-like cell line, RAW 264.7, was obtained from American Type Culture Collection. The cells were cultured in Ham’s F12 medium with 10% FBS (SAFC Biosciences) at 37 °C under a humidified 5% CO2 atmosphere. The RAW264.7 cells were seeded at 1.2 × 10⁶ cells/mL onto 96-well plates (Sumitomo Bakelite, MS-8096R, Tokyo) and then incubated at 37 °C for 2 h. A test sample was then added to the culture simultaneously with both Escherichia coli LPS (100 ng/mL) and recombinant mouse IFN-γ (0.33 ng/mL), and the cells were incubated at 37 °C, usually for 16 h. The amount of nitrite in culture supernatants was measured using the Griess assay. Cytotoxicity was measured using the MTT assay method.
3.7. Statistical Analysis
The values represent mean ± S.D. of at least three experiments. Statistical significant differences were evaluated by the one-way ANOVA followed by the Student’s t-test for paired populations, and a P value of 0.05 or less among the means were considered significant.


