2.2. Influence of the Culture Media on the Biomass, Chitin and Chitosan Production by C. elegans
Table 2 present the values of biomass production, pH, chitin and chitosan yields obtained in each trial as a response for the 2
2 factorial design using different CW and CSL concentrations. The responses recorded were biomass production, chitin and chitosan yield by
C.elegans. An estimate of pure experimental error was calculated from four replicates run corresponding to a central point of the complete factorial (trial 5). These results indicated a higher biomass production (9.93 g/L) during 96 h of fermentation of
Cunninghamella elegans using conditions 3 (5% CW, 8% CSL). This suggests a culture medium with a greater concentration of CSL in relation to cassava wastewater CW concentrations could favor growth by
C. elegans. CSL consists of amino acids and carbohydrates which influence the growth of Mucoralean fungi [
19]. Similar results were reported by Berger
et al. [
6] and Cardoso
et al. [
20] also showed the positive influence in biomass production of the same concentrations of CSL (8%) used in this study. Probably, the considerably higher carbon and nitrogen contents of CSL compared with cassava wastewater CW, as shown in
Table 1, favored this result. Other studies also suggest using CSL as a source of carbon and nitrogen in the composition of culture media instead of glucose and yeast extract, for example by using this substrate to produce succinic acid by
Actinobacillus succinogenes [
21]; and to produce a biosurfactant by the yeast
Candida sphaerica [
22].
Table 2.
Design matrix for the factorial experiments used to study the influence of factors, cassava wastewater (CW) and corn steep liquor (CSL) concentrations, varied symmetrically around the central point according to the 22 levels.
Table 2.
Design matrix for the factorial experiments used to study the influence of factors, cassava wastewater (CW) and corn steep liquor (CSL) concentrations, varied symmetrically around the central point according to the 22 levels.
| Assays | Cassava wastewater (CW) % (v/v) | Corn steep liquor (CSL) % (v/v) | pH | Biomass (g/L) | Chitin (mg/g) | Chitosan (mg/g) |
|---|
| 1 | 5.00 | 4.00 | 6.98 | 6.93 | 69.57 | 50.12 |
| 2 | 10.0 | 4.00 | 6.98 | 5.67 | 89.39 | 57.82 |
| 3 | 5.00 | 8.00 | 6.18 | 9.93 | 50.09 | 44.51 |
| 4 | 10.0 | 8.00 | 6.20 | 8.57 | 60.71 | 34.47 |
| 5 | 7.50 | 6.00 | 6.50 | 7.16 | 70.03 | 47.37 |
| 6 | 7.50 | 6.00 | 6.35 | 8.00 | 72.40 | 48.93 |
| 7 | 7.50 | 6.00 | 6.23 | 7.70 | 76.64 | 46.00 |
| 8 | 7.50 | 6.00 | 6.48 | 7.31 | 70.27 | 45.81 |
On the other hand, contrary result was observed with condition 2 (10% CW, 4% CSL) which gave the best chitin (89.39 mg/g) and chitosan (57.82 mg/g) yields. Similar result was obtained by Lins
et al. [
19] who obtained the highest chitosan production by
Rhizopus arrhizus also using 4% of CSL. There was an increase in the pH range from 5.6 (start of fermentation) to 6.98–6.18. A similar result was observed by Cardoso
et al. [
20]. However, the lower pH in
Table 2 (6.18 and 6.20) resulted in the higher yields of biomass. Probably this acidic condition is better for the
C. elegans growth. The influence of the culture media pH in the biomass yield was also observed by Nwe
et al. [
23] and Nwe and Stevens [
14] who observed that the slightly acidic pH values are more favorable to the fungal growth.
Therefore a greater CW concentration and a lower CSL concentration favored these response variables. The addition of CSL in culture media improved chitosan production by
Syncephalastrum racemosum, but at a 2% concentration [
15] which is lower than the concentration shown by trial 2, used in this study. Santos
et al. [
16] also showed the positive effect of this agroindustrial waste as a nutritional source for chitosan production by
Cunninghamella elegans but using a 0.45% concentration of CSL, which is much less than the 4% concentration used in this study. From these results, considering the high nutritional value of corn steep liquor, it can be suggested that the choice of this waste at lower concentrations could be sufficient to increase chitosan production by
Cunninghamella elegans.
White
et al. [
24] suggest that the composition of fungal and bacterial cell walls can be attained by genetic manipulation or alteration of culture conditions and consequently, these changes could result in a potential for altering cell wall synthesis in fungi to improve chitosan productivity. The positive influence of high and low concentrations of CW and CSL, respectively, in the production of chitin and chitosan. On the other hand, the growth of the fungus was stimulated in the presence of low concentrations of CW and high concentrations of CSL, a source of nitrogen and carbon.
The best results for biomass, chitin and chitosan production obtained in this study (
Table 2) are compared with the literature in
Table 3. The different results presented in
Table 3 for the chitin and chitosan yields of each microorganism prove that the chitosan content of fungi depends on the fungal strains, the age of the mycelia age, the cultivation medium and the growth conditions and chitin and chitosan extraction method used [
2,
4,
24,
25].
Table 3.
Biomass, chitin and chitosan production by C. elegans grown on agroindustrial waste compared with results obtained by the literature.
Table 3.
Biomass, chitin and chitosan production by C. elegans grown on agroindustrial waste compared with results obtained by the literature.
| Microorganism | Substrate | Biomass (g L−1) | Chitin (mg g−1) | Chitosan (mg g−1) | Reference |
|---|
| Cunninghamella elegans | CSL and CW | 9.93 | 89.39 | 57.82 | This study |
| Rhizopus arrhizus | CSL and CW | 8.80 | 54.38 | 20.51 | [6] |
| Rhizopus arrhizus | Synthetic medium for Mucorales | - | 92 | 13 | [8] |
| Rhizopus arrhizus | Modified synthetic medium for Mucorales | - | 94 | 14 | [8] |
| Rhizopus arrhizus | CSL and honey | 20.6 | - | 29.3 | [26] |
| Rhizopus arrhizus | CSL 4% | 13.00 | 30.40 | 12.85 | [27] |
| Mucor circinelloides | Yam bean | 20.70 | 500 | 64 | [5] |
| Cunninghamella elegans | Yam bean | 24.30 | 440 | 66 | [3] |
| Aspergillus niger | Potato dextrose broth | 9.00 | - | 107 | [16] |
| Lentinus edodes | Potato dextrose broth | 1.4 | - | 33 | [16] |
| Zygosaccharomyces rouxii | Yeast malt extract broth | 4.4 | - | 36 | [16] |
| Candida albicans | Yeast malt extract broth | 1.8 | - | 44 | [16] |
| Mucor rouxii | YPD medium | 9–14 | - | 40–80 | [28] |
| Mucor racemosus | YPD medium | 15.0 | - | 35.1 | [29] |
| Cunninghamella elegans | YPD medium | 25.0 | - | 20.5 | [29] |
| Gongronella butleri | Sweet potato pieces and mineral solution and urea | 56.3 | - | 127 (12.7%) | [30] |
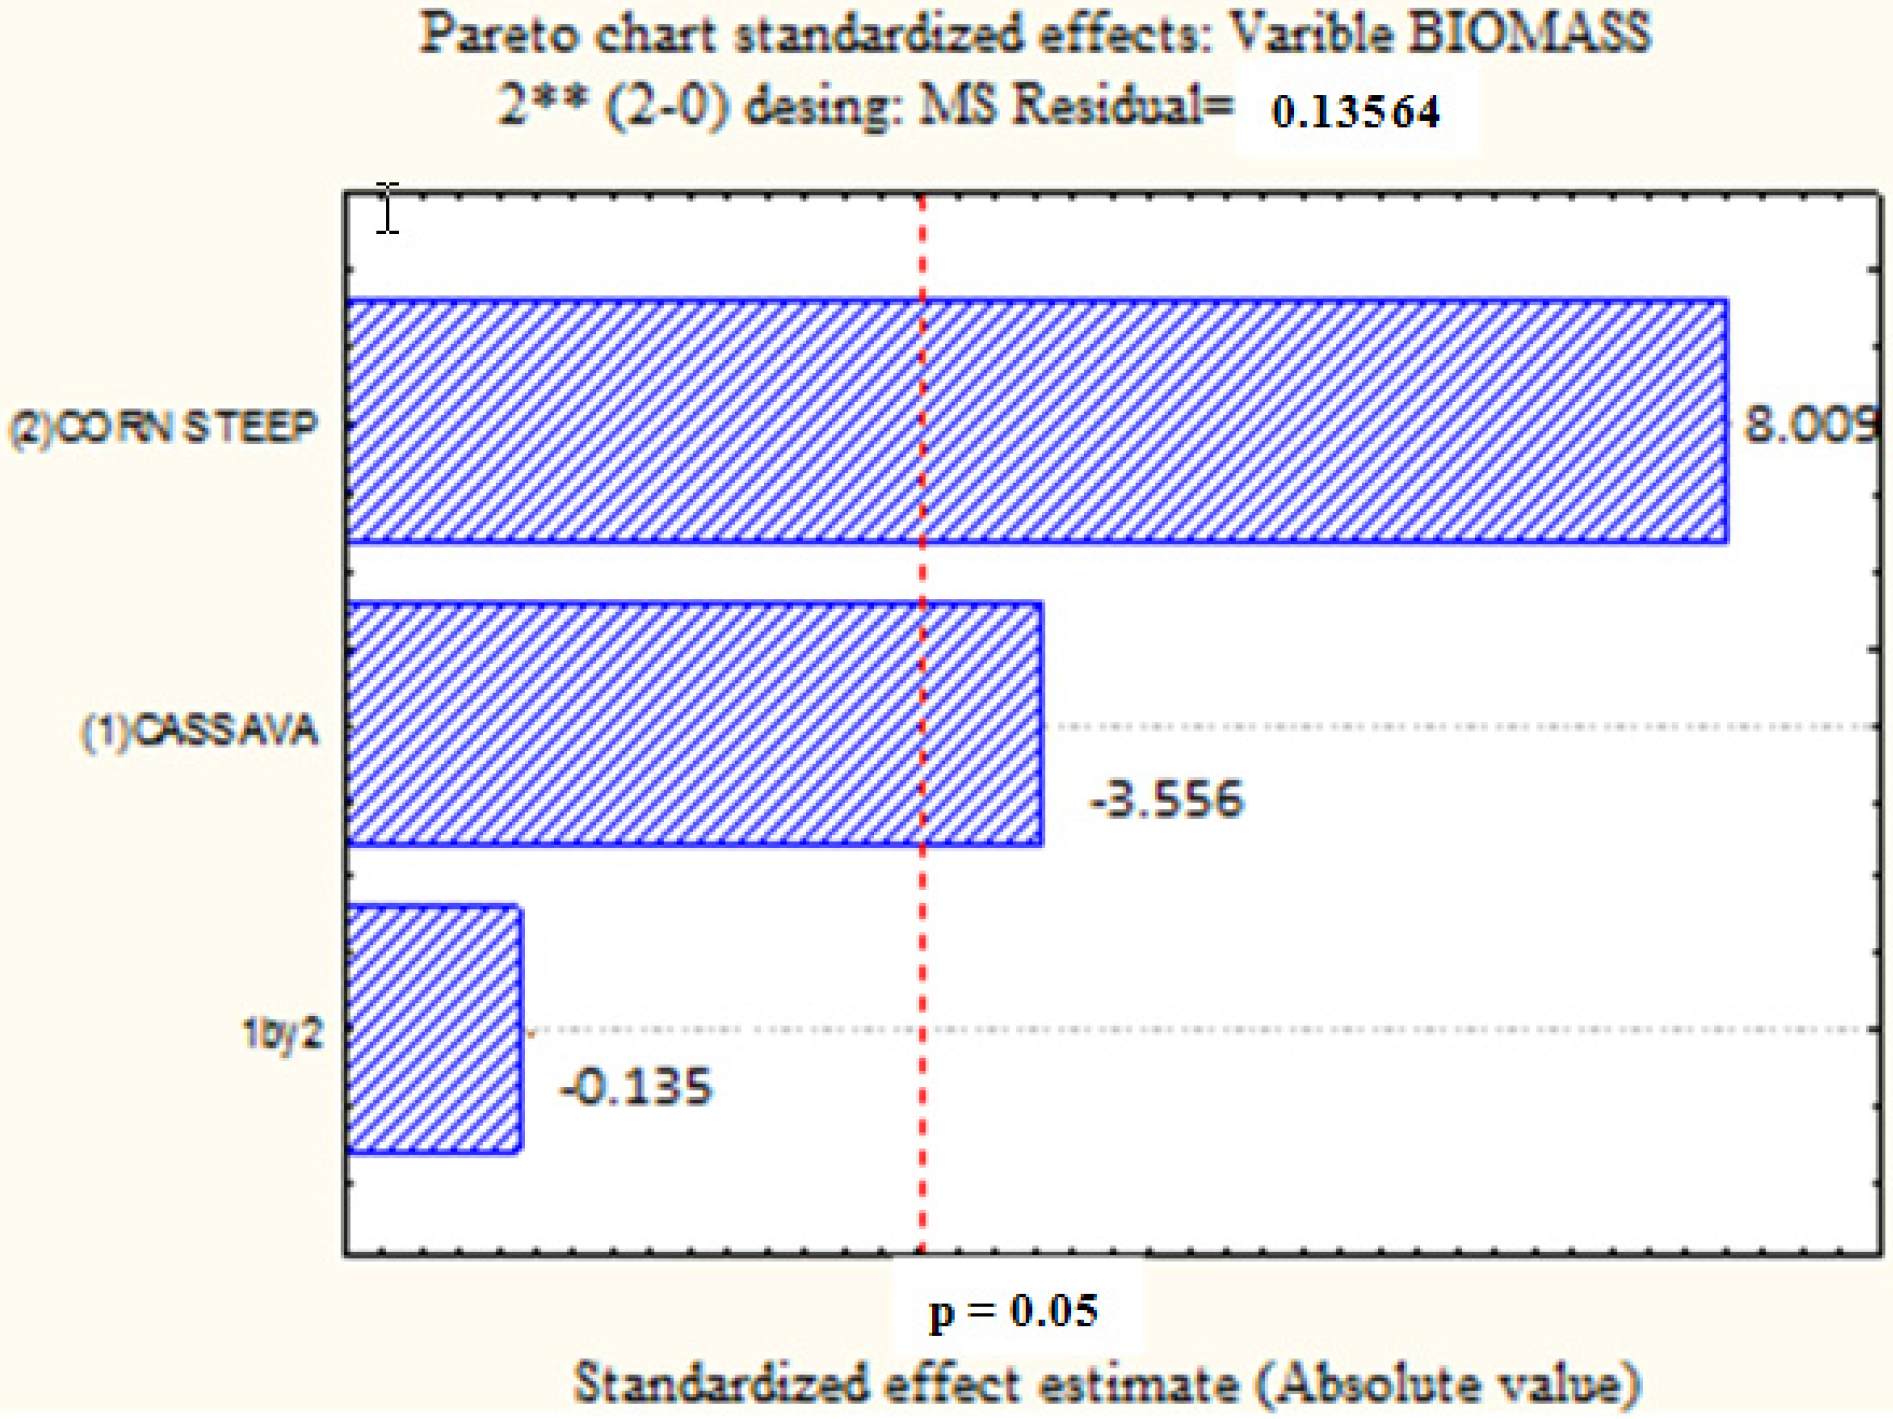
Figure 1 presents the influence of CW (1), CSL (2) and the interaction between these factors (1 × 2) in the biomass production by
C. elegans, using a factorial design, with statistical significance (
p < 0.05). The increase of CSL percentage provided a higher yield of biomass and the opposite was observed when the percentage of CW was increased. The interaction between these factors had a negative effect on biomass production, but not a statistically significant one. These results suggest that, in future research, the biomass production of
C. elegans could be increased in a culture media with higher CSL and low CW concentrations.
Figure 1.
Pareto graph showing the effect of independent variables on the production of biomass by Cunninghamella elegans strain UCP/WFCC 0542. Statistically significant (p < 0.05).
Figure 1.
Pareto graph showing the effect of independent variables on the production of biomass by Cunninghamella elegans strain UCP/WFCC 0542. Statistically significant (p < 0.05).
Figure 2 shows contrary results compared to
Figure 1 for the influence of CSL and CW in chitin production. The Pareto chart presents the positive and negative influence of CW and CSL, respectively for chitin production by
Cunninghamella elegans, with statistical significance (
p < 0.05)
. As in
Figure 1, the interaction between these two variables did not favor (at least not in a statistically significant way), the production of chitin. These results confirm the data obtained in trial 2 (10% CW, 4% CSL,
Table 2).
Figure 2.
Pareto graph showing the effect of independent variables on the chitin yield by Cunninghamella elegans strain UCP/WFCC 0542. Statistically significant (p < 0.05).
Figure 2.
Pareto graph showing the effect of independent variables on the chitin yield by Cunninghamella elegans strain UCP/WFCC 0542. Statistically significant (p < 0.05).
Figure 3 presents the negative influence of CW and CSL, and the interaction between these variables, respectively, for chitosan production by
C. elegans. An increase in the percentage of the two substrates in the culture medium will not favor the production of chitosan by this fungus, which was statistically significant for CSL and interaction of the two wastes (
p < 0.05) and of no statistical significance for CW (
p < 0.05)
. This suggests the use of these wastes in smaller concentrations in the culture medium to achieve better yields of chitosan.
Figure 3.
Pareto graph showing the effect of independent variables on the chitosan yield by Cunninghamella elegans strain UCP/WFCC 0542. Statistically significant (p < 0.05).
Figure 3.
Pareto graph showing the effect of independent variables on the chitosan yield by Cunninghamella elegans strain UCP/WFCC 0542. Statistically significant (p < 0.05).
2.4. Cytotoxicity Test using Chorioallantoic Membrane (HET-CAM Test)
The cytotoxicity of chitin and chitosan were verified using the HET-CAM test. Cytotoxicity was evaluated for development of irritation symptoms, such as haemorrhage, coagulation (intra- and extravascular protein denaturation) and vasoconstriction, when the test substances were added to the membrane and left in contact for 5 min (
Table 6). The polymers were shown to be non-irritating (IS = 0.0) because they did not prompt vasoconstriction, haemorrhage or coagulation in the CAM within 5 min.
Table 6.
Cytotoxicity of chitin and chitosan evaluated for the development of irritant endpoints: vasoconstriction, haemorrhage and coagulation.
Table 6.
Cytotoxicity of chitin and chitosan evaluated for the development of irritant endpoints: vasoconstriction, haemorrhage and coagulation.
| Assays | Chitin | Chitosan | 1% SLS |
|---|
| Vasoconstriction | 0.0 | 0.0 | 6.0 ±1.0 |
| Haemorrhage | 0.0 | 0.0 | 48 ±3.0 |
| Coagulation | 0.0 | 0.0 | 63 ±3.0 |
| Irritation potential | 0.0 | 0.0 | 17.74 ± 0.4 |
The CAM has been proposed as a model for a living membrane because it has a functional vasculature. The acute effects induced by a test substance on the small blood vessels and proteins of this soft tissue membrane are proposed to be similar to those of the rabbit eye test, while offering the advantages of being more universally acceptable as it is a non-animal test and is completed more rapidly [
44]. Several studies have been conducted to evaluate the feasibility of using HET-CAM as a complete replacement for the
in vivo rabbit ocular test. This test has several advantages, including due to its being simple, rapid, sensitive, easily performed and relatively cheap [
45,
46].
In Germany and France, HET-CAM has been officially accepted as a valid
in vitro assay, at least for predicting several irritating substances [
47]. Current laws regulating animal experimentation allow protocols that use chick embryos without authorisation from animal experimentation committees; however, in the UK, the British Animal Welfare Act (1986) states that an embryo egg up to 10 days of gestational age can be used as a non-animal test [
44,
45].


