Manipulating the equation above, the apparent
constant can be expressed in terms of the equilibrium constant between the two tautomeric forms
:
where
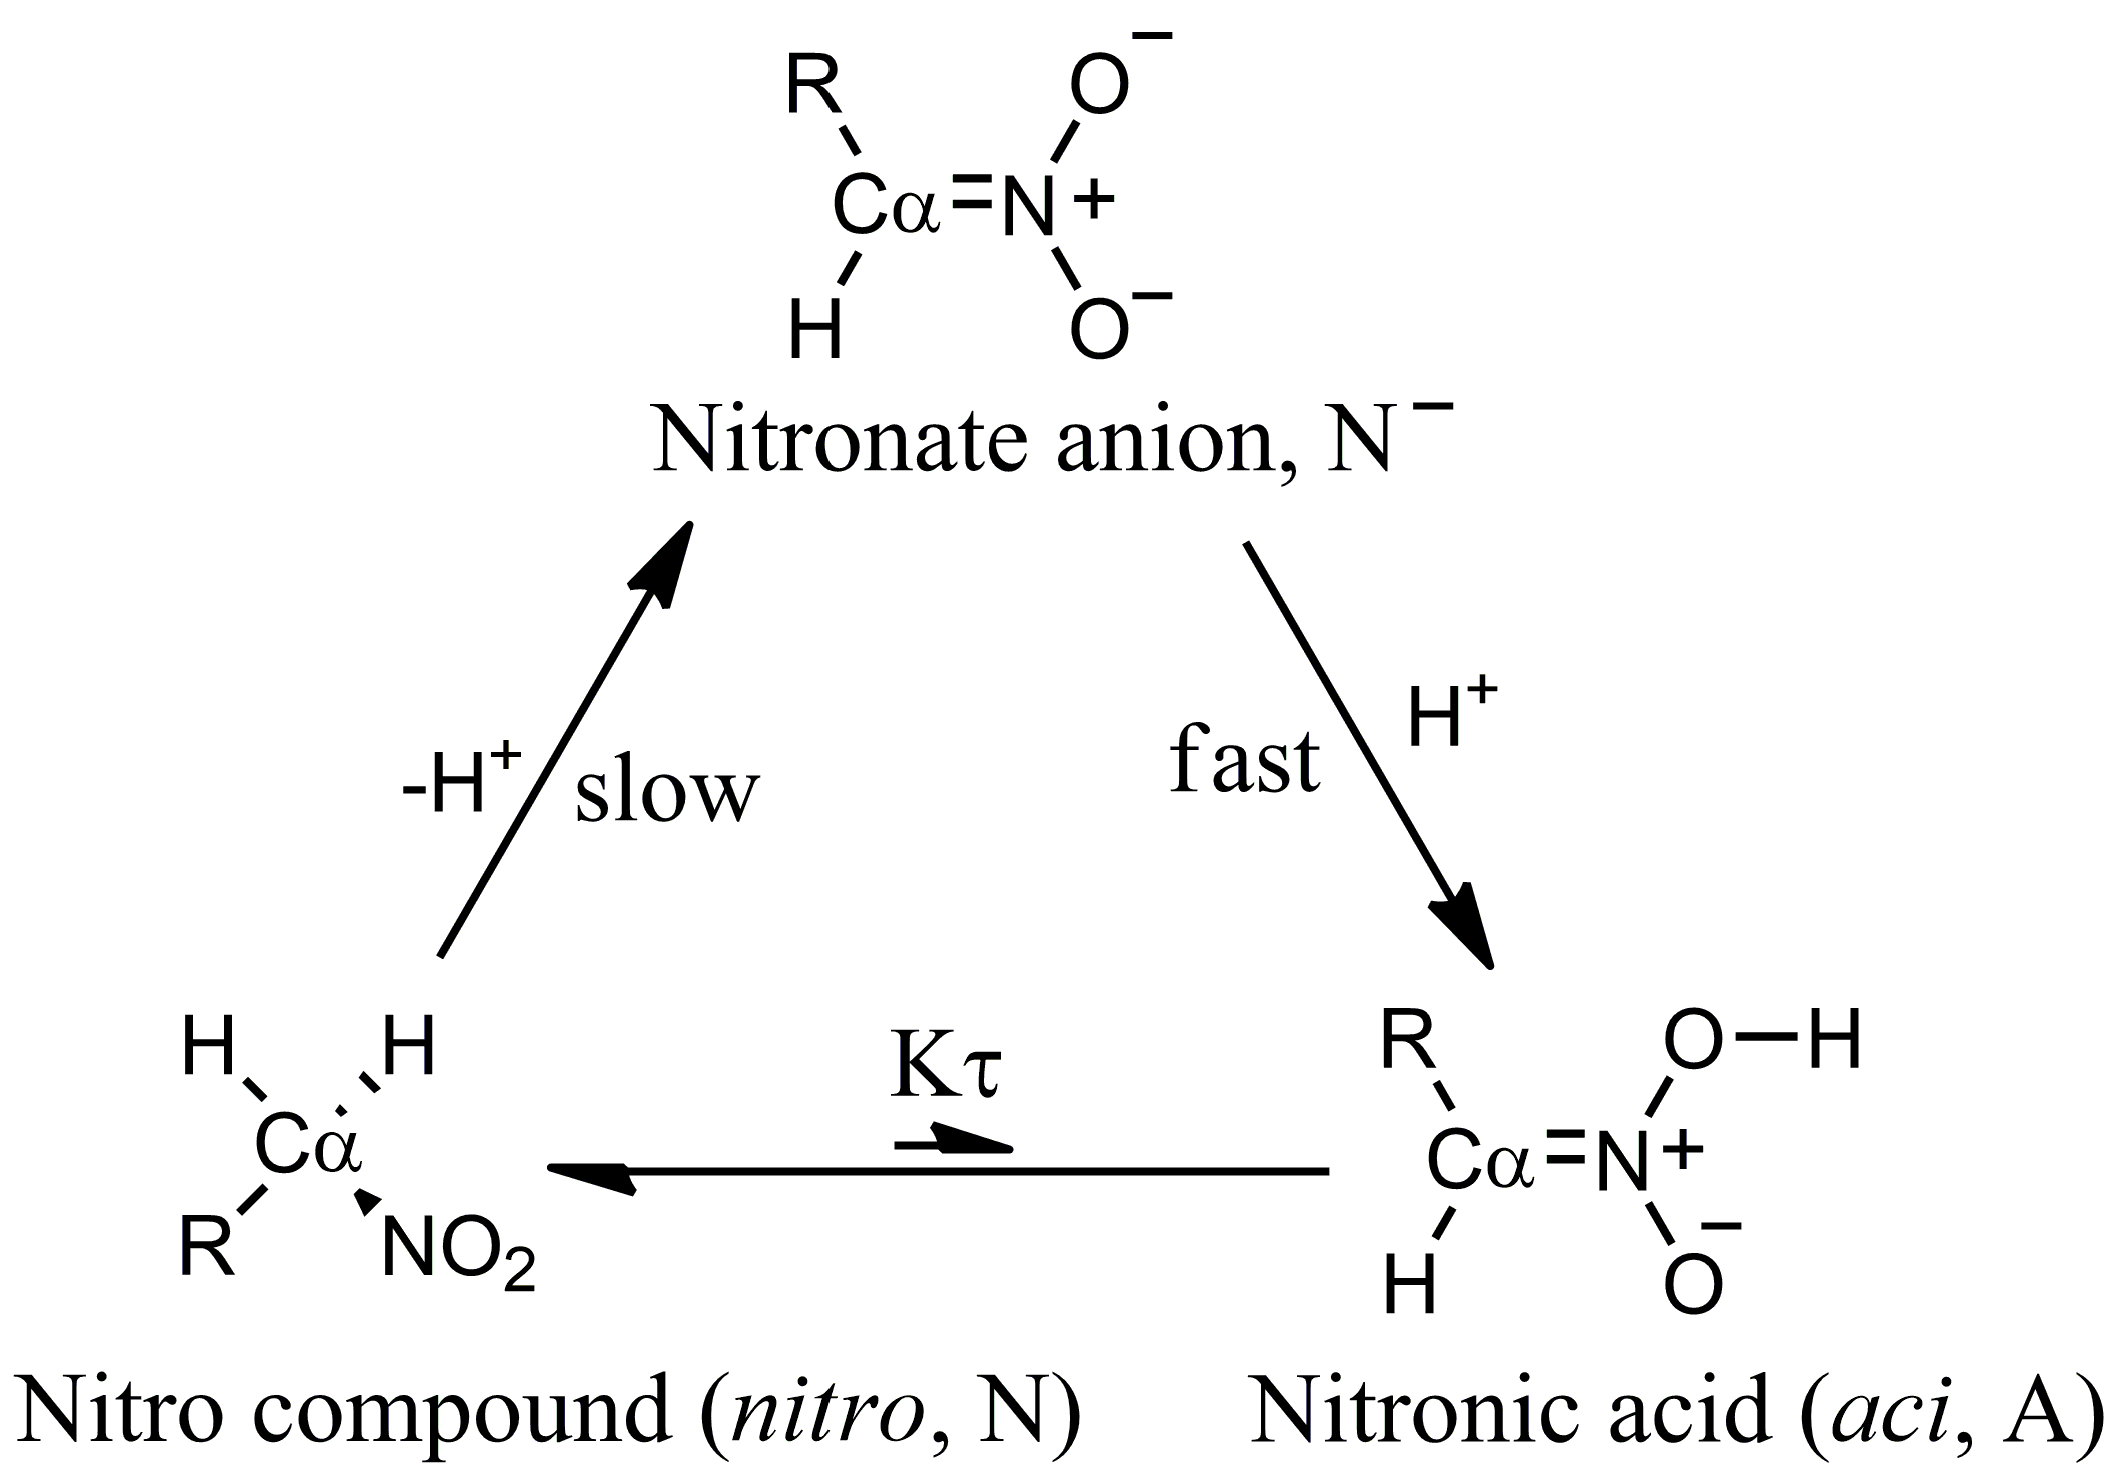
is the ionization constant of the nitro form (that is the most stable at room conditions) and
= [A]/[N]. The low ratio between
aci and
nitro forms (
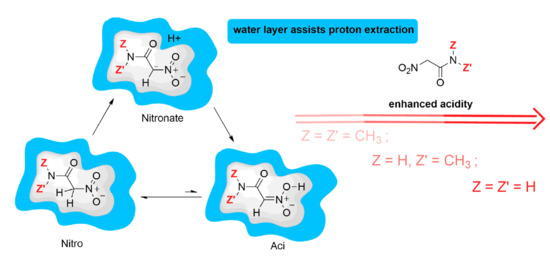
) at room conditions in water solution prevents the species from showing the larger acidity of the
aci form compared to the
nitro. The former is more acidic because the C–H bond is always stronger than the O–H bond. However, the enhanced chemical properties of rare species present with very low statistical weight in the sample are evident in the measured apparent ionization constant. The stronger acidity of the low-weight
aci form is evident when the proton exchange between the
aci form and the
nitro form is frozen or the kinetics of the
aci deprotonation can be separated by measured kinetic data [
12]. Hereafter, we indicate
as
.
From a microscopic point of view, the contribution of rare acidic forms to the average observed property, that is potentially dominated by low-acidic forms, can be explained if the reactive form is trapped within energy barriers. In this case, the conversion from the rare form to the most stable one is slower than the ionization. The average property, provided by the series of sampled microscopic states, slowly converges with sampling.
In order to compare the thermodynamic quantities measured by experiments with results of microscopic models, we make the following assumption in the context of the nitro compounds an object of this study. The larger the statistical weight of the aci form, the larger the acidity of the sample. The tight-binding approximation can be then used to describe realistic configurations with significant statistical weight for each of the two tautomeric forms. Once this goal is achieved, the proton transfer between the two forms can be described with more detailed computational experiments still including the contribution of the solvation layer. The latter task is accomplished here by adding an external empirical potential to a density-functional theory (DFT) approximation of electron density coupled with molecular dynamics (MD) simulations.
2.1. Tight-Binding Approximation of nitro and aci Forms
In
Table 2, the difference in average energy (
) at
K and at the water density of bulk water (
g/cm
) between the two tautomeric forms is reported.
These data are compared with the measured ionization free energy change and with the same energy difference computed with an accurate DFT approximation that allows geometry optimization in an implicit model of the water solvent. The final column is the
derived from p
values predicted with an empirical method provided by the SciFinder™ database. According to a comparison between different prediction methods [
29], the ACDLabs [
22] method is one of the best performing.
The approximate DFTB model of the electronic structure and the low statistics are not expected to provide agreement between the measured free energy changes (column 2) and the computed energy difference between ionized and neutral species (not shown here). However, it can be noticed that the most acidic species (less positive free energy of ionization, column 2) display the lowest difference in energy of the aci tautomeric form (column 3). With the exception of 6, the series of substituents displays the correct order for both and . This rough correlation indicates that the contribution to the apparent acidity due to substituent R can be ascribed to the increasing statistical weight of the aci form, the latter characterized by large acidity.
The ACDLabs empirical prediction, though it is excellent for the compounds that are presumably tabulated (4–8), fails in predicting the high acidity of compound 1 and the decrease of acidity of 3 with respect to 1.
Intramolecular interactions have only a partial role in determining the average energy difference between the two tautomeric forms. This is shown by the values of
energy difference computed with the more accurate DFT method (column 4 in
Table 2). The values are larger in absolute value than the corresponding DFTB estimate, even though they follow approximately the same ordering, with the smallest absolute values corresponding to the most acidic compounds. The range displayed for the amide derivatives is due to the choice of different structures as initial configurations for the geometry optimization. For instance, the lowest energy
nitro structure corresponds to an open extended
all-trans structure, where there is no interaction between the nitro and the amine group. The
aci form is, compared to this extended structure, at the highest energy. On the other hand, when the
nitro compound forms intramolecular interactions that favor a closed structure, the
aci form is at a lower energy. However, in both cases, the energy difference is larger than when the calculation is performed with a less accurate model, but includes the solvent layer explicitly. Therefore, the inclusion of explicit solvent makes the energy landscape flatter than in the case of a polarizable continuum model for the solvent.
The interplay between intramolecular interactions and interactions with solvent molecules is shown by simulations in the explicit solvent.
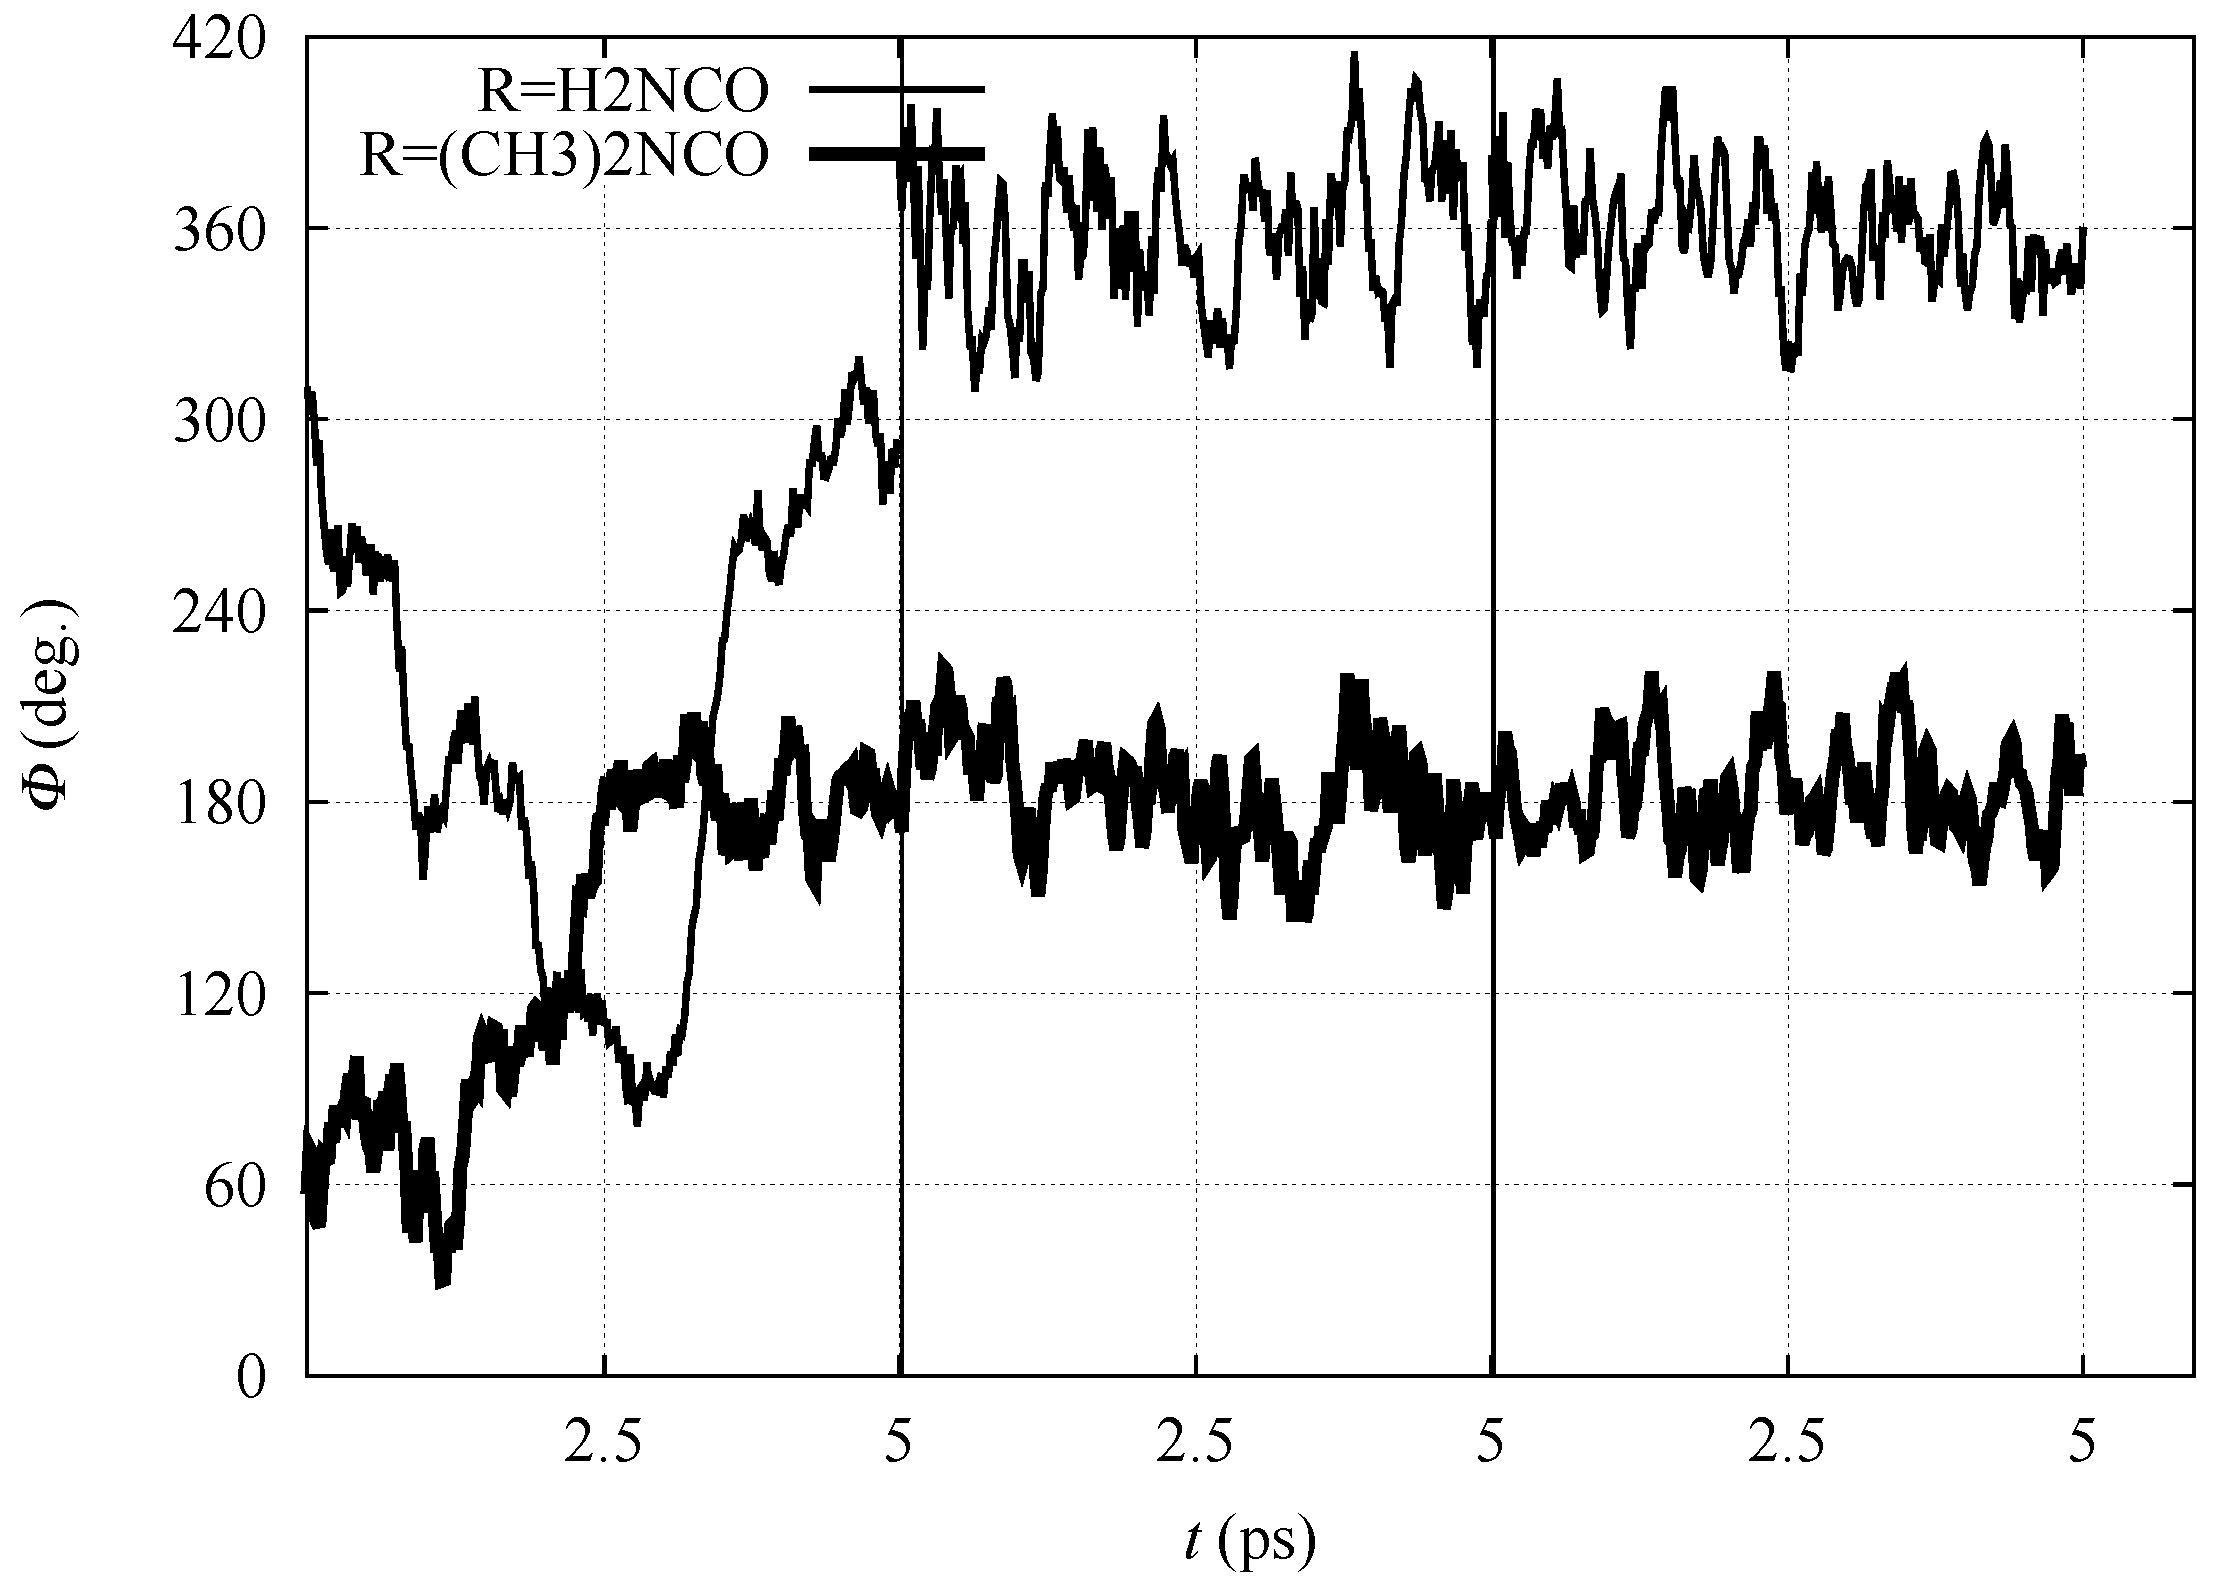
In
Figure 3, the time evolution of the N-C
-C
-N
dihedral angle is displayed for all the three simulation stages (
nitro,
aci and ionized forms) for
1 and
3, performed in the DFTB model. The dihedral angle displays for both compounds large fluctuations when in the
nitro form because of the
configuration of C
. After the displacement of
H to the nitro O atom (in the
aci form) and then into the bulk water (ionized form), the molecules are sealed into, respectively, E and Z configurations for
1 and
3. Despite the conformational freezing, keeping the
aci form in the E configuration, the intramolecular H–N⋯H
-O
-N hydrogen bond is not observed. Also in the ionized form, the O
atoms of the nitro group strongly interact with water molecules in the solvent (see below).
Despite the absence of stable intramolecular hydrogen bonds, there are significant intramolecular interactions in certain compounds. For instance, there is a high persistence of the intramolecular interaction between the N–O bond and the amide H atom when R = NH
2CO (
1). This interaction keeps the
aci form sealed in the E conformation, the latter more hindered to water access than the
aci form of other compounds (see
Table 3 and
Figure 4 discussed below). The N–O⋯H–N interaction displays an angle smaller than 135
, thus being not classified as an hydrogen bond, but rather a strong electrostatic interaction. The proton attached to the nitro group in the
aci form when R = NH
2CO never interacts with N and O of the amide group. The latter atom is always
anti to the nitro group with respect to C
-C bond. As a consequence of this closed
aci form, the anion displays always the strong N–O⋯H–N intramolecular electrostatic interaction, while such interaction is not effective in the other substituents.
These observations indicate that the energy of most of the species reported in
Table 2 is also strongly modulated by interactions with the water environment, in addition to the electrostatic intramolecular interactions discussed above. The hydrogen bond population of H-bond donor and acceptor groups is reported in
Table 3 and in
Figure 4.
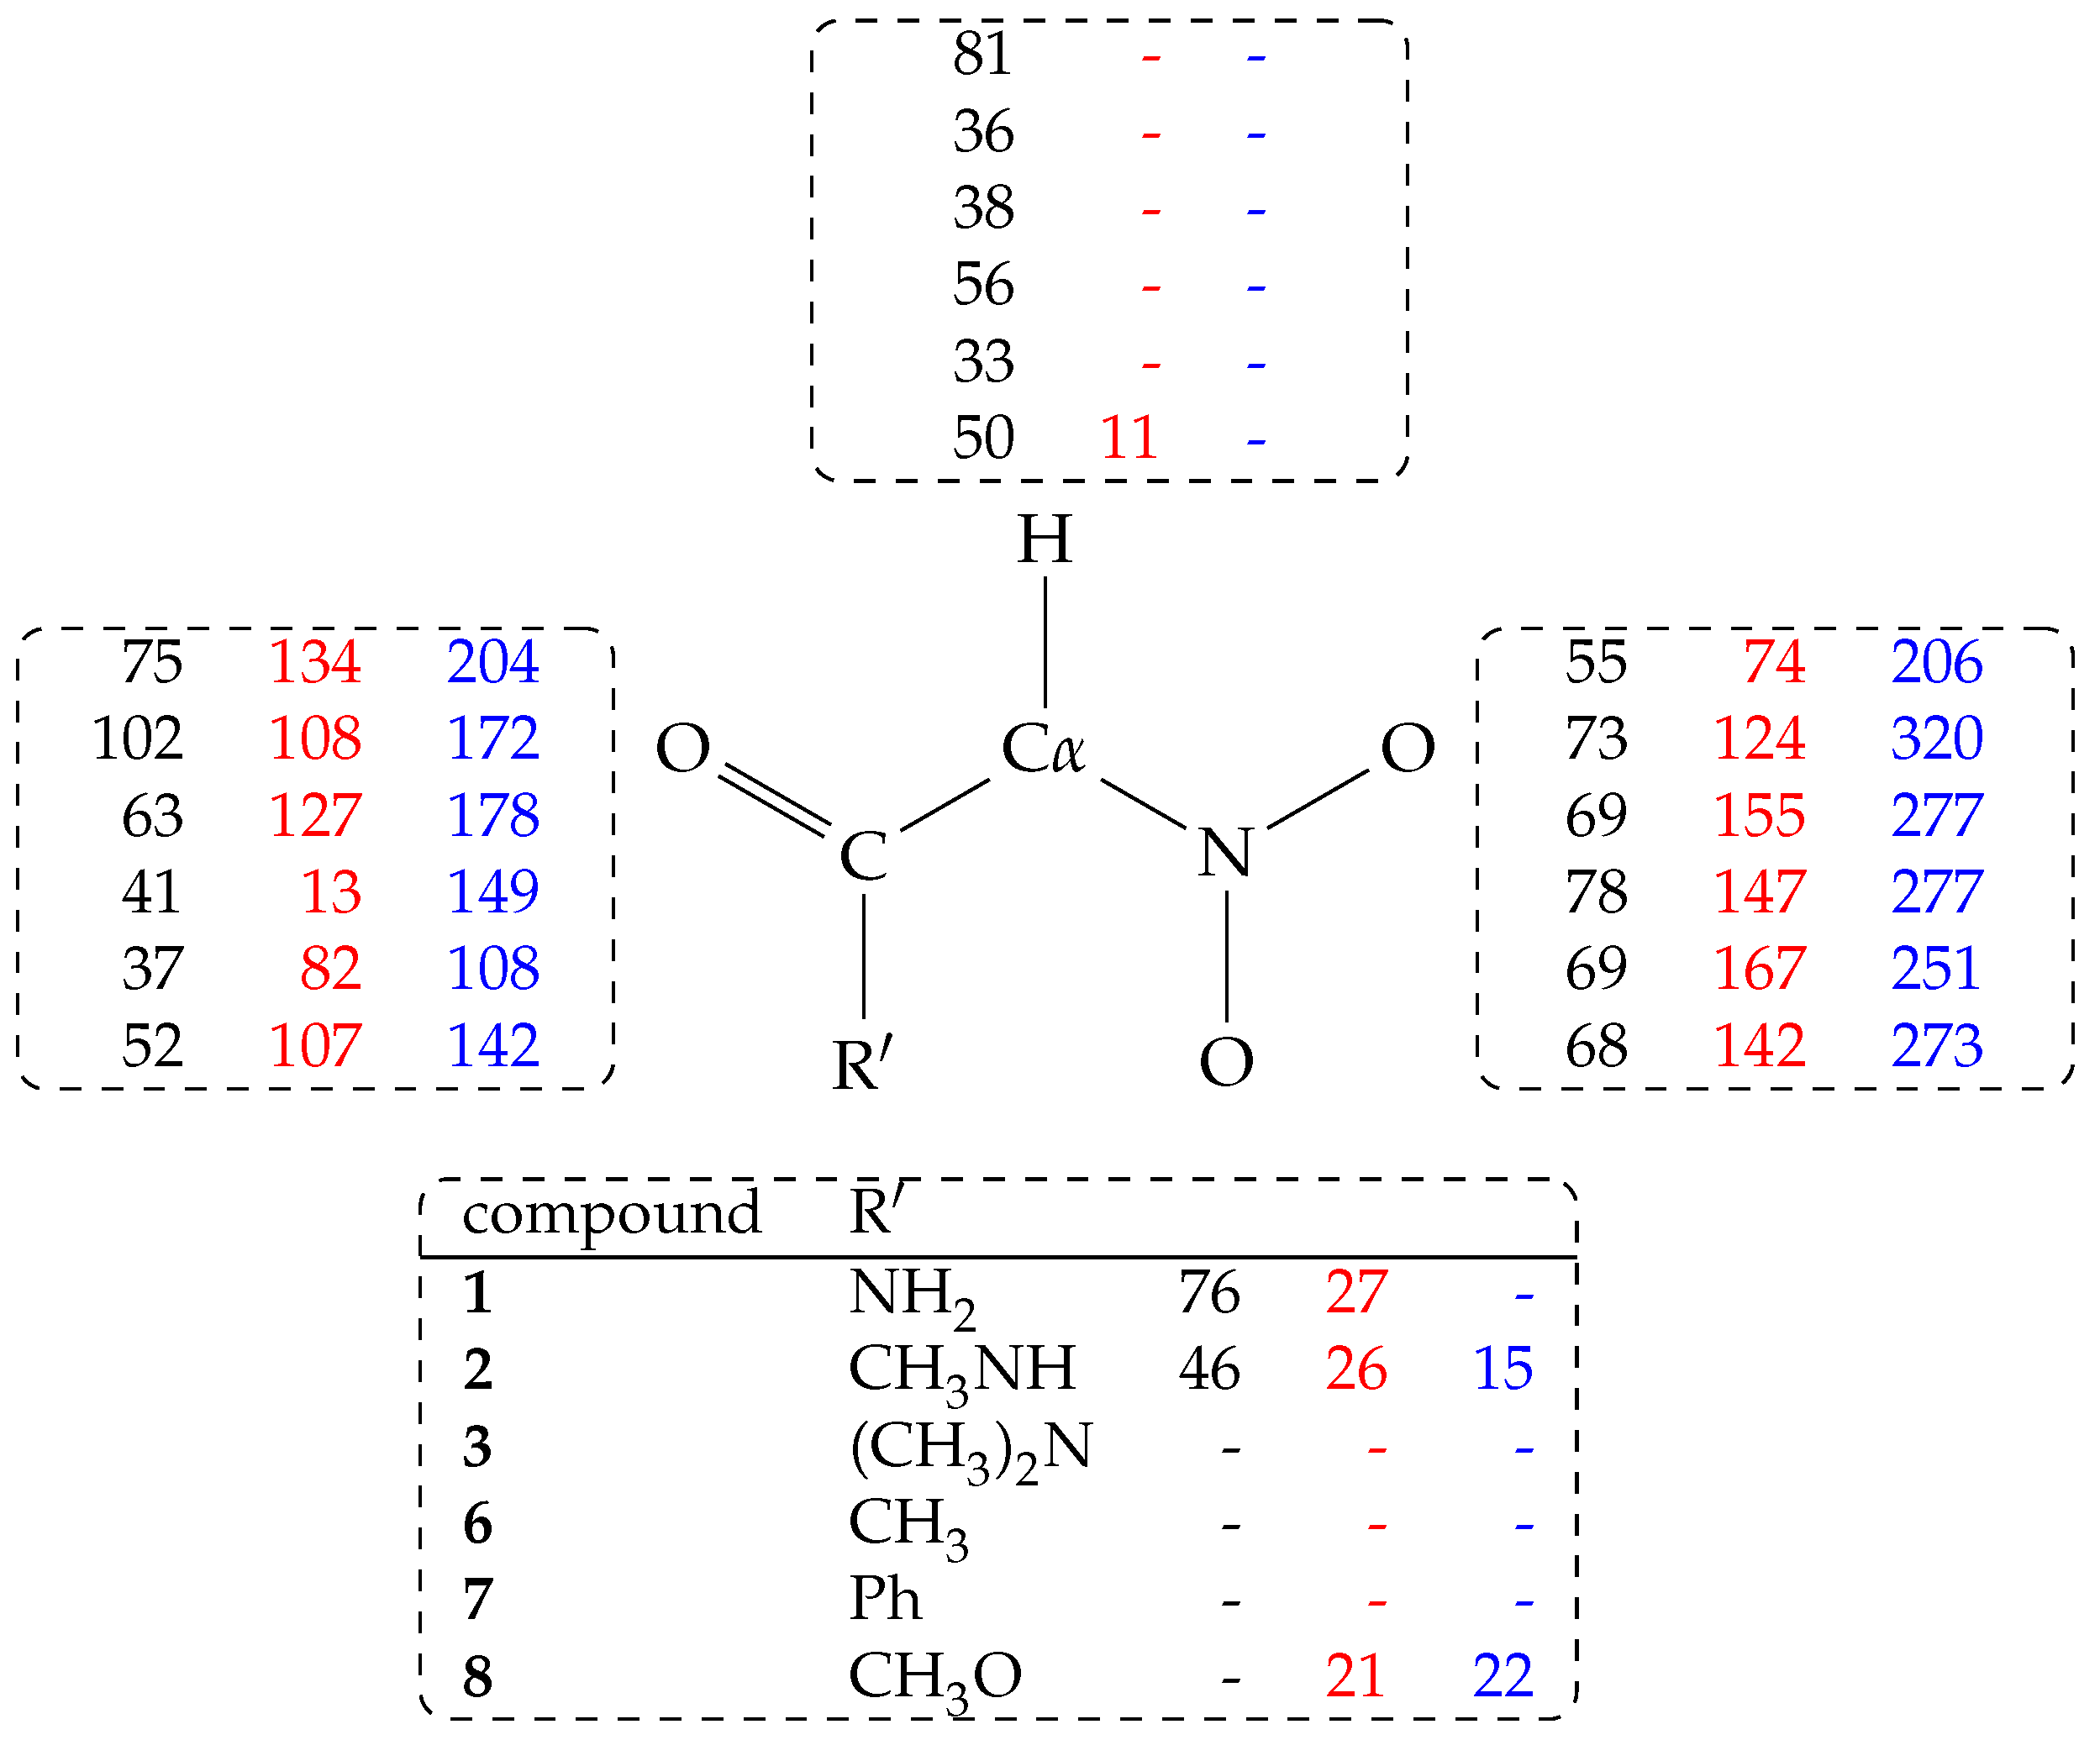
In this analysis, all the water molecules (213, 210 only when R = PhCO) in the sample are included. From
Table 3, it can be observed that the
H atom forms a significant amount of hydrogen bonds with water molecules (C
-H⋯Ow, with Ow the O atom in water molecules) when C
is in the
nitro form. As a term of comparison, when R = CH
3 (
5, data not displayed in Table) the probability for C
-H and C
-H hydrogen bonds with water is, respectively, 23 and 22%.
The C
-H⋯Ow hydrogen bond is lost when the C
atom is converted into the
electronic configuration (
aci and nitronate forms). The highest population C
-H⋯Ow hydrogen bond is observed for R = NH
2CO (
1) in the
nitro form (81%, see
Figure 4).
The probability of any hydrogen bond with water molecules (both donating and accepting solute hydrogen atoms) reported in
Table 3 shows that, for
1 and
2, and when the solute is neutral, the population of hydrogen bonds has its maximum in the
nitro form. The probability is still high when the proton is moved to the
aci form. Finally, when the proton is removed from the solute (the negatively charged nitronate form), the probability of hydrogen bonds with the solvent increases, mainly because of the negatively charged nitro group. Looking at the partition of hydrogen bonds (
Figure 4), it can be noticed that substituents with at least one N–H bond are particularly efficient in keeping water molecules structured in the first solvation layer around all the regions of the solute, independently of the tautomeric or protonation form.
The water environment around each molecule has different degrees of basicity and, once it is protonated by the H extraction, different degrees of acidity towards the solute molecule. To approximately measure acid-base properties of this water environment, H is extracted from the solute by moving the atom towards the closest water molecule in the solvent bath. In this condition, the water bath (containing a single H3O+ species) is allowed to give back the proton to the solute. If a short time is provided to the solute, allowing the relaxation of the C bond environment, the water bath gives the proton back to other basic groups because, in the tight-binding approximation, the relaxed C atom can not form a new C–H bond. Remarkably, in most of the cases, the group that is able to host the proton provided by the water bath is the nitro group, thus forming the solute in the aci form. Therefore, this alchemical process mimics a possible pathway for the proton transfer from position C to the nitro O atom, as it is mediated by the water layer around the solute. This simple experiment allows a first exploitation of the mechanism by which the solute can better manifest itself as the more acidic aci form. Interestingly, in some cases (R = PhCO), the carbonyl oxygen is able to form a transient covalent bond with the proton provided by the water layer.
In
Table 4, the times required to transfer the proton from the water layer to one of the oxygen atoms in the solute, producing either the
aci or the enolic form, is reported.
Each H extraction to the water layer is performed from a selected configuration displaying an approximately zero or dihedral angle for H’-C-N–O and a water molecule with Ow within 0.2 nm from H. It must be noticed that, when these two conditions are not fulfilled, in most of the cases, the proton is rapidly given back to C because there is no efficient relaxation mechanism for the H3O+ species formed in the water layer.
The formation of the
aci form from the reaction between the protonated water environment and the negatively charged form of the solute has different lag-times
displayed in
Table 4. In some cases (
1 and
7), the proton is finally bound by the carbonyl oxygen, forming the enolic isomer of the given species. Only in the case of
3, the proton goes always back to C
because of the strong repulsion between the solute and the close by hydronium species formed by the
H extraction. Therefore, these data show that, for
1,
2 and
7, the pathway for proton exchange between C–H bond in the solute and a O–H bond in the solvation water layer, followed by the exchange with the O–H bond in the solute, is easily found.
The large chance of formation of enolic forms in the case of
1 and
7 is an indication of the possibility for enolic form as an intermediate in the slow process of C
deprotonation. A higher probability for enolic form increases the rate for proton release in certain compounds, as observed in the literature [
12], because of the
pre-organization of C
. In the DFTB model investigated here, the enolic form appears, in the more hydrophilic nitro compounds analyzed here, as a second acidic form of the nitro compound, in addition to the
aci form. However, in the DFTB model, the mechanism to obtain the enolic form is mediated by the water molecule close to the
H atom that is extracted.
2.2. The H Extraction from the nitro Tautomer and Insertion into the aci Tautomer
The DFT model of the water solution sample circumvents the limitation of the tight-binding model in oversampling bound states. By using an external force that smoothly extracts one of the H atom away from the C-H bond at room thermal conditions, it is possible to break the C–H bond, keeping the possibility of forming alternative explicit H–O bonds in the first solvent layer of the solute.
The analysis of the change in potential energy along with the
H extraction in the two extreme cases (R = H
2NCO and R = (CH
3)
2NCO) is displayed in
Figure 5 (see Methods).
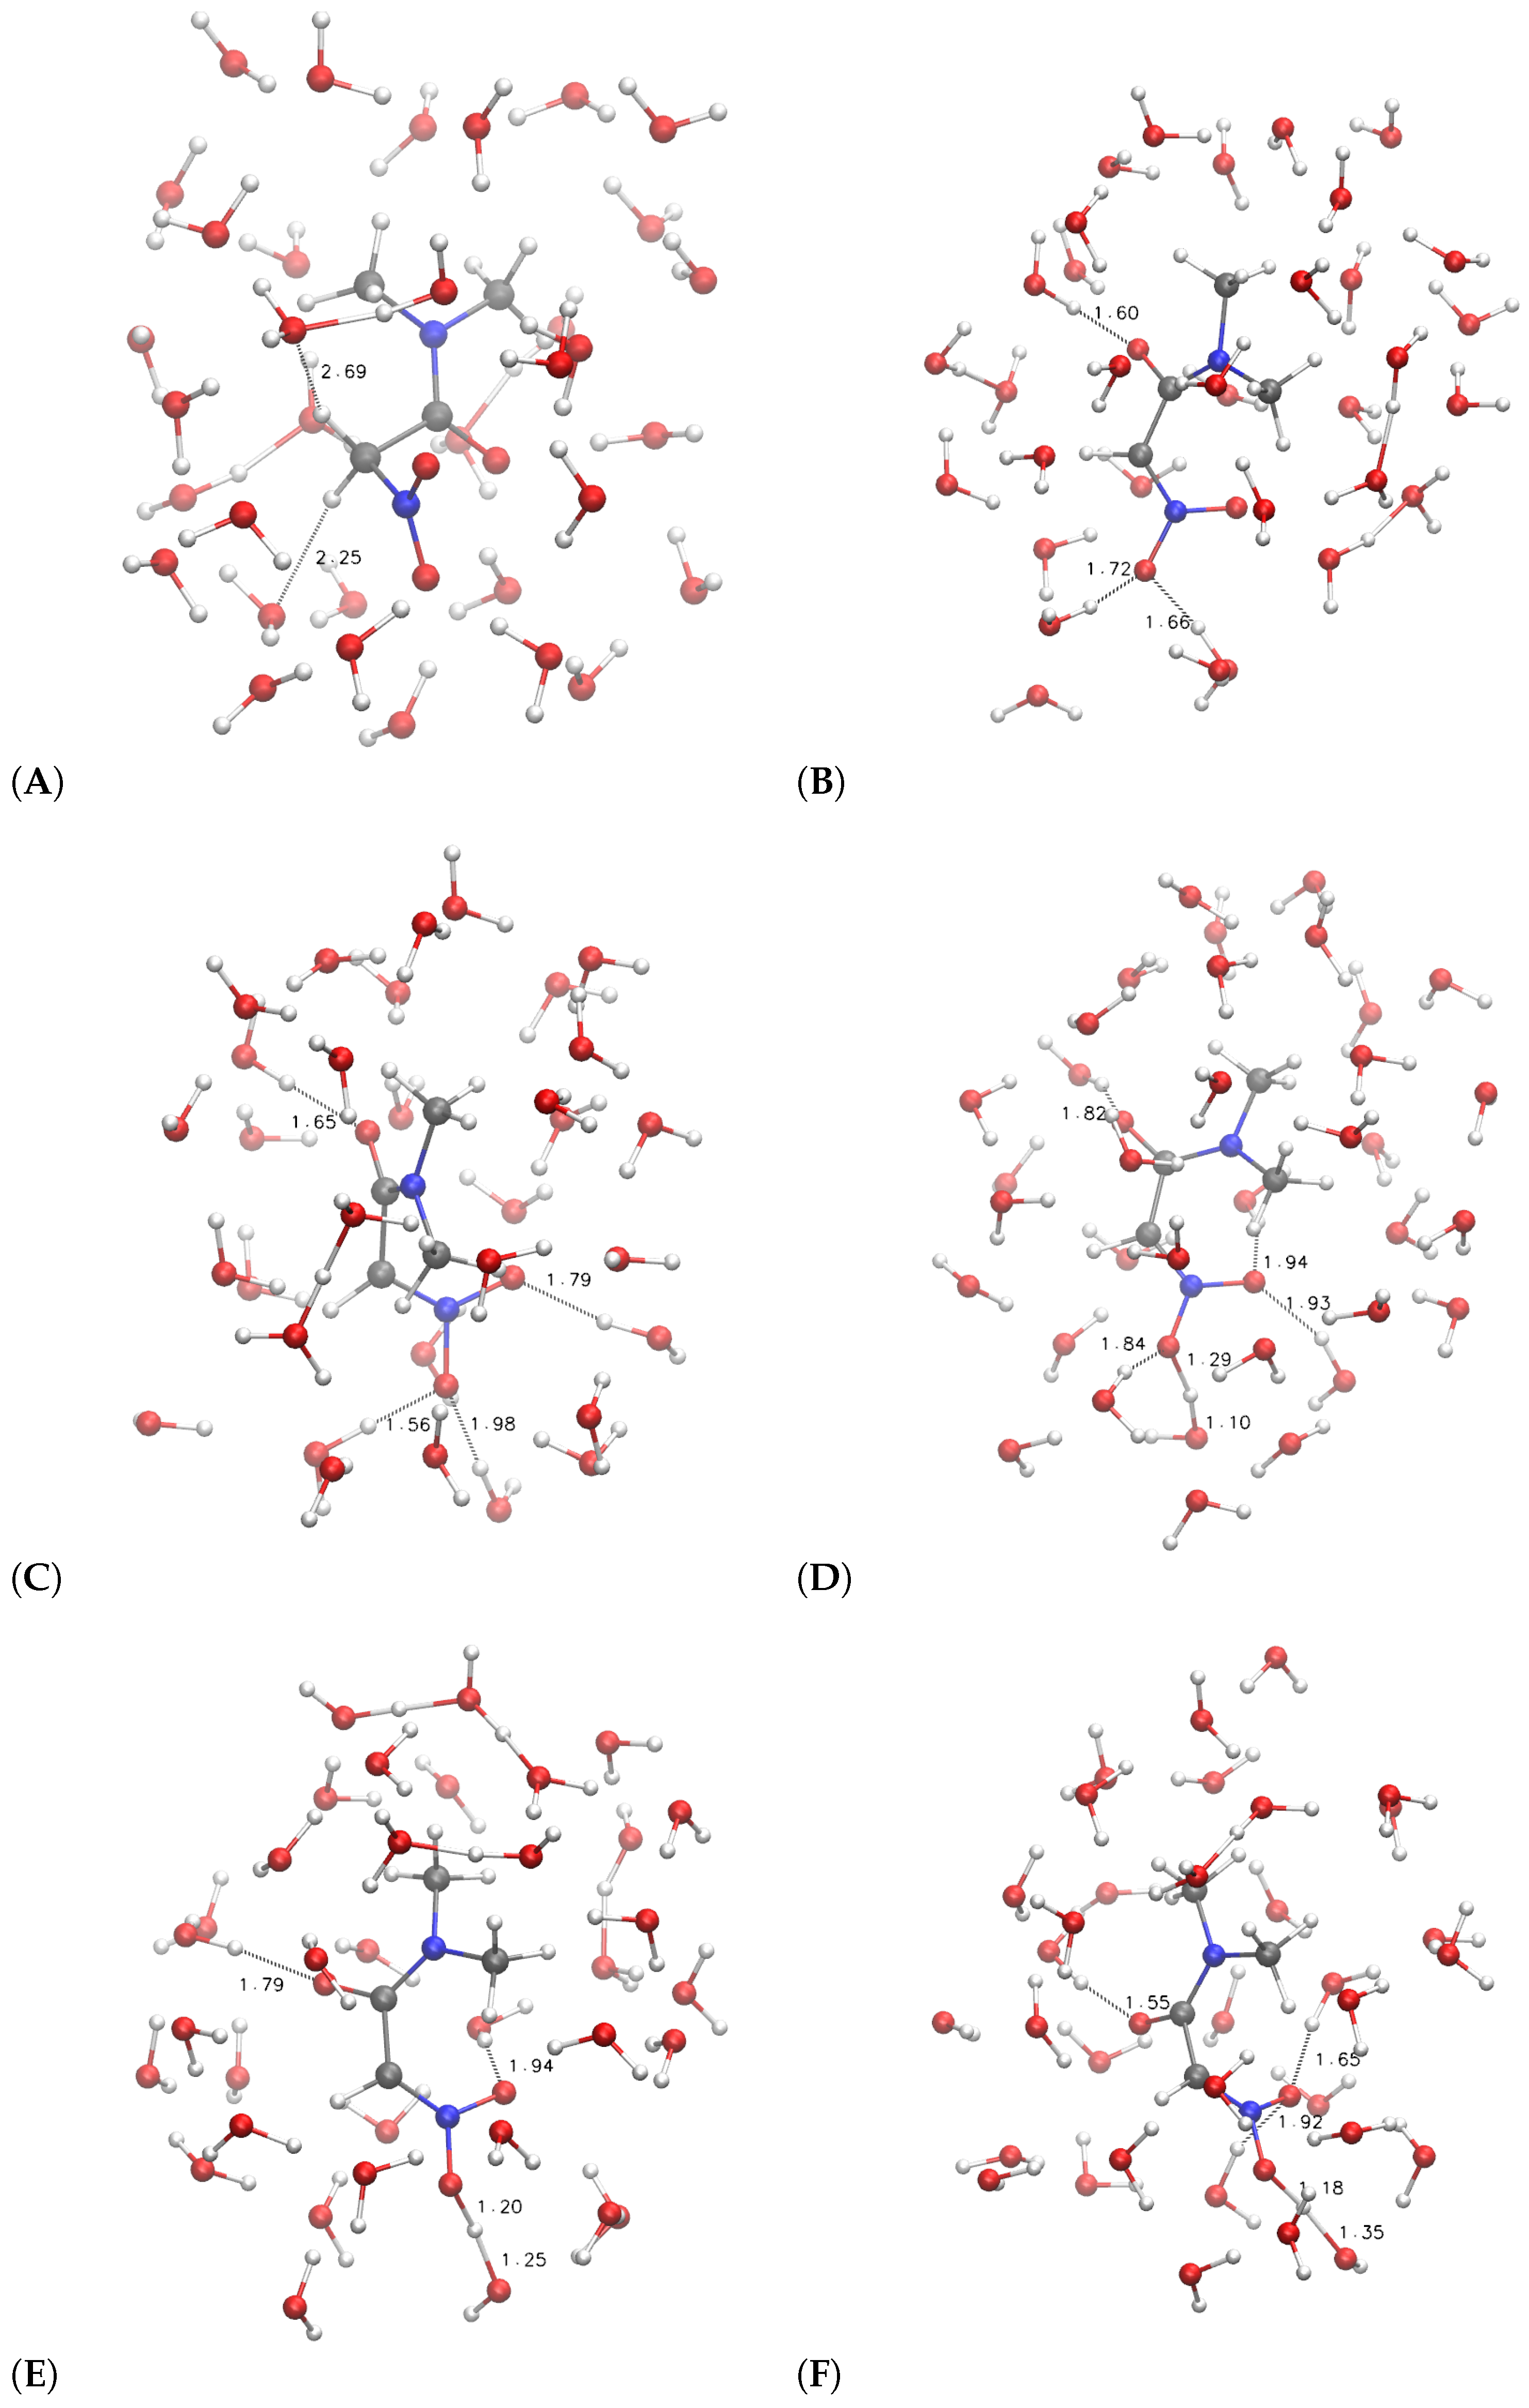
The configurations corresponding to some selected points, indicated by letters a–f and A–F, are displayed in
Figure 6 and
Figure 7, respectively.
It can be noticed that the compact initial structure of
1, where the electrostatic interaction between the amino and nitro groups is effective, is rapidly lost during equilibration, and extended configurations are sampled in the explicit solvent (
Figure 6, panel a). During the application of the external force that drives one of the
H towards the solvent, the more hydrophilic substituent (R = H
2NCO, filled circles in
Figure 5) displays the increase in potential energy due to the exchange of the C–H bond with a O–H bond (
Figure 5c). The potential energy is rapidly decreased (∼150 kJ/mol), producing configurations with the proton confined within the solute and a water molecule in the first solvation layer (
Figure 6d, the excess proton is on top-right).
On the other hand, the more hydrophobic substituent (R = (CH
3)
2NCO,
3, circles in
Figure 5) displays a fast movement of
H to the closest water molecule (2.7 Å compared to 2.0 of
1), with a similar increase in potential energy compared to
1. However, the following relaxation of the charge separation (
Figure 7C) does not allow a significant decrease in potential energy. The excess proton (that is visible in panel C on top of the carbonyl group) displays a high energy and the movement of the excess proton away from the first solvation layer does not produce a significant decrease in potential energy (
Figure 7D). The oscillation of potential energy (panels e–f and E–F of
Figure 6 and
Figure 7, respectively) does not allow for the hydrophobic substituent (circles in
Figure 5) the dissipation of potential energy that is allowed for the more hydrophilic one (filled circles in the same figure).
For both the substituents, the
aci form is produced during the forced N–O neutralization process (
Figure 6 and
Figure 7, panels E–F). Nevertheless, the
aci form is transient and in rapid exchange with anions displaying hydrogen bonds between the nitro group and water molecules in the first solvation layer.


