Article

Molecular Simulation to Explore the Dissolution Behavior of Sulfur in Carbon Disulfide

1
School of Chemistry and Chemical Engineering, Shandong University, Jinan 250014, China
2
Shandong Yanggu Huatai Chemical Co., Ltd., Yanggu, Liaocheng 252300, China
*
Author to whom correspondence should be addressed.
Molecules 2022, 27(14), 4402; https://doi.org/10.3390/molecules27144402
Submission received: 1 June 2022 / Revised: 4 July 2022 / Accepted: 6 July 2022 / Published: 8 July 2022

Abstract

:
Soluble sulfur (S8) and insoluble sulfur (IS) have different application fields, and molecular dynamics simulation can reveal their differences in solubility in solvents. It is found that in the simulated carbon disulfide (CS2) solvent, soluble sulfur in the form of clusters mainly promotes the dissolution of clusters through van der Waals interaction between solvent molecules (CS2) and S8, and the solubility gradually increases with the increase in temperature. However, the strong interaction between polymer chains of insoluble sulfur in the form of polymer hinders the diffusion of IS into CS2 solvent, which is not conducive to high-temperature dissolution. The simulated solubility parameter shows that the solubility parameter of soluble sulfur is closer to that of the solvent, which is consistent with the above explanation that soluble sulfur is easy to dissolve.

1. Introduction

As the macromolecule of soluble sulfur (S8) polymerization [1,2], insoluble sulfur (IS) can replace soluble sulfur (S8) as a high-performance rubber additive. Insoluble sulfur has a slow migration speed in rubber, which can effectively prevent compounds from frosting in tire production and improve the adhesion between tire films. The corresponding tire products have excellent heat resistance and wear resistance. Therefore, insoluble sulfur (IS), as an indispensable raw material in the production of high-quality tires, especially radial tires, is a rubber vulcanizing agent and accelerator with broad development prospects [3,4].
CS2 is commonly used as the extractant of IS in industrial production, which can effectively separate common sulfur (soluble sulfur S8) and polymerized sulfur (insoluble sulfur IS) and is easy to recycle. Considering the volatility, flammability and explosion of CS2, the danger is high in the actual production process. Therefore, researchers at home and abroad are mostly looking for a new, effective extractant for IS. For example, Luo Hongyan [5] selected toluene as the extractant by comparing the extraction effects of trichloroethane, toluene and CS2 with their toxicity and operation requirements, and they extracted it at 80 °C for 45 min to obtain more than 90% IS products. Zhang Kejuan et al. [6] selected styrene with an aromatic ring and C=C bond to extract IS. The best operating conditions were a temperature of 77 °C, time of 10 min and liquid–solid ratio of 27, and the highest content was 94.2% and the extraction efficiency was 91.1%. The literature shows that no matter which extractant is selected, most of them are based on CS2 for comparison or as a part of the extractant for research.
As a useful supplement to experiments, molecular simulation can reveal the properties of soluble sulfur and insoluble sulfur at the molecular level. Jones et al. [7,8] studied the structure of Sn (n = 2–18) by density functional theory and the Monte Carlo method and considered that the number of sulfur atoms in the IS chain was around 100. Wang Rongjie et al. [9] put forward a ring-opening cracking mechanism for S8 and established a possible reaction path through the transition state theory. The product distribution obtained is similar to that obtained by the vapor density method. Ma Jian et al. [10] compared the thermal stability and thermodynamic properties of IS with different stabilizers on the micro level based on density functional theory, and the simulation results were consistent with the experimental results and DSC characterization results. These simulation calculations provide microscopic information for researchers to better understand IS and increase their cognitive understanding of IS.
In industrial production, in order to obtain a rubber accelerator with excellent performance, soluble sulfur S8 will be extracted at room temperature, and insoluble sulfur IS will be obtained, which will be used after being distinguished from each other [11]. Experimental workers must realize that the solubility of S8 in CS2 can be explained on a microscopic scale, and an understanding of the reasons for the solubility difference between S8 and IS is also helpful for industrial design in practical operation. In this paper, the molecular dynamics simulation method is used to study the dissolution behavior of S8 and IS in CS2 solvent at a molecular scale, in order to obtain the reason for the solubility difference between the two types of sulfur, explain the related dissolution phenomena and verify the feasibility of the IS model. As a toxic and harmful organic solvent, CS2 is not friendly to the environment. This work can also aid in the subsequent industrial production to find a new, effective and pollution-free extractant for IS.

2. Model Construction and Simulation Method

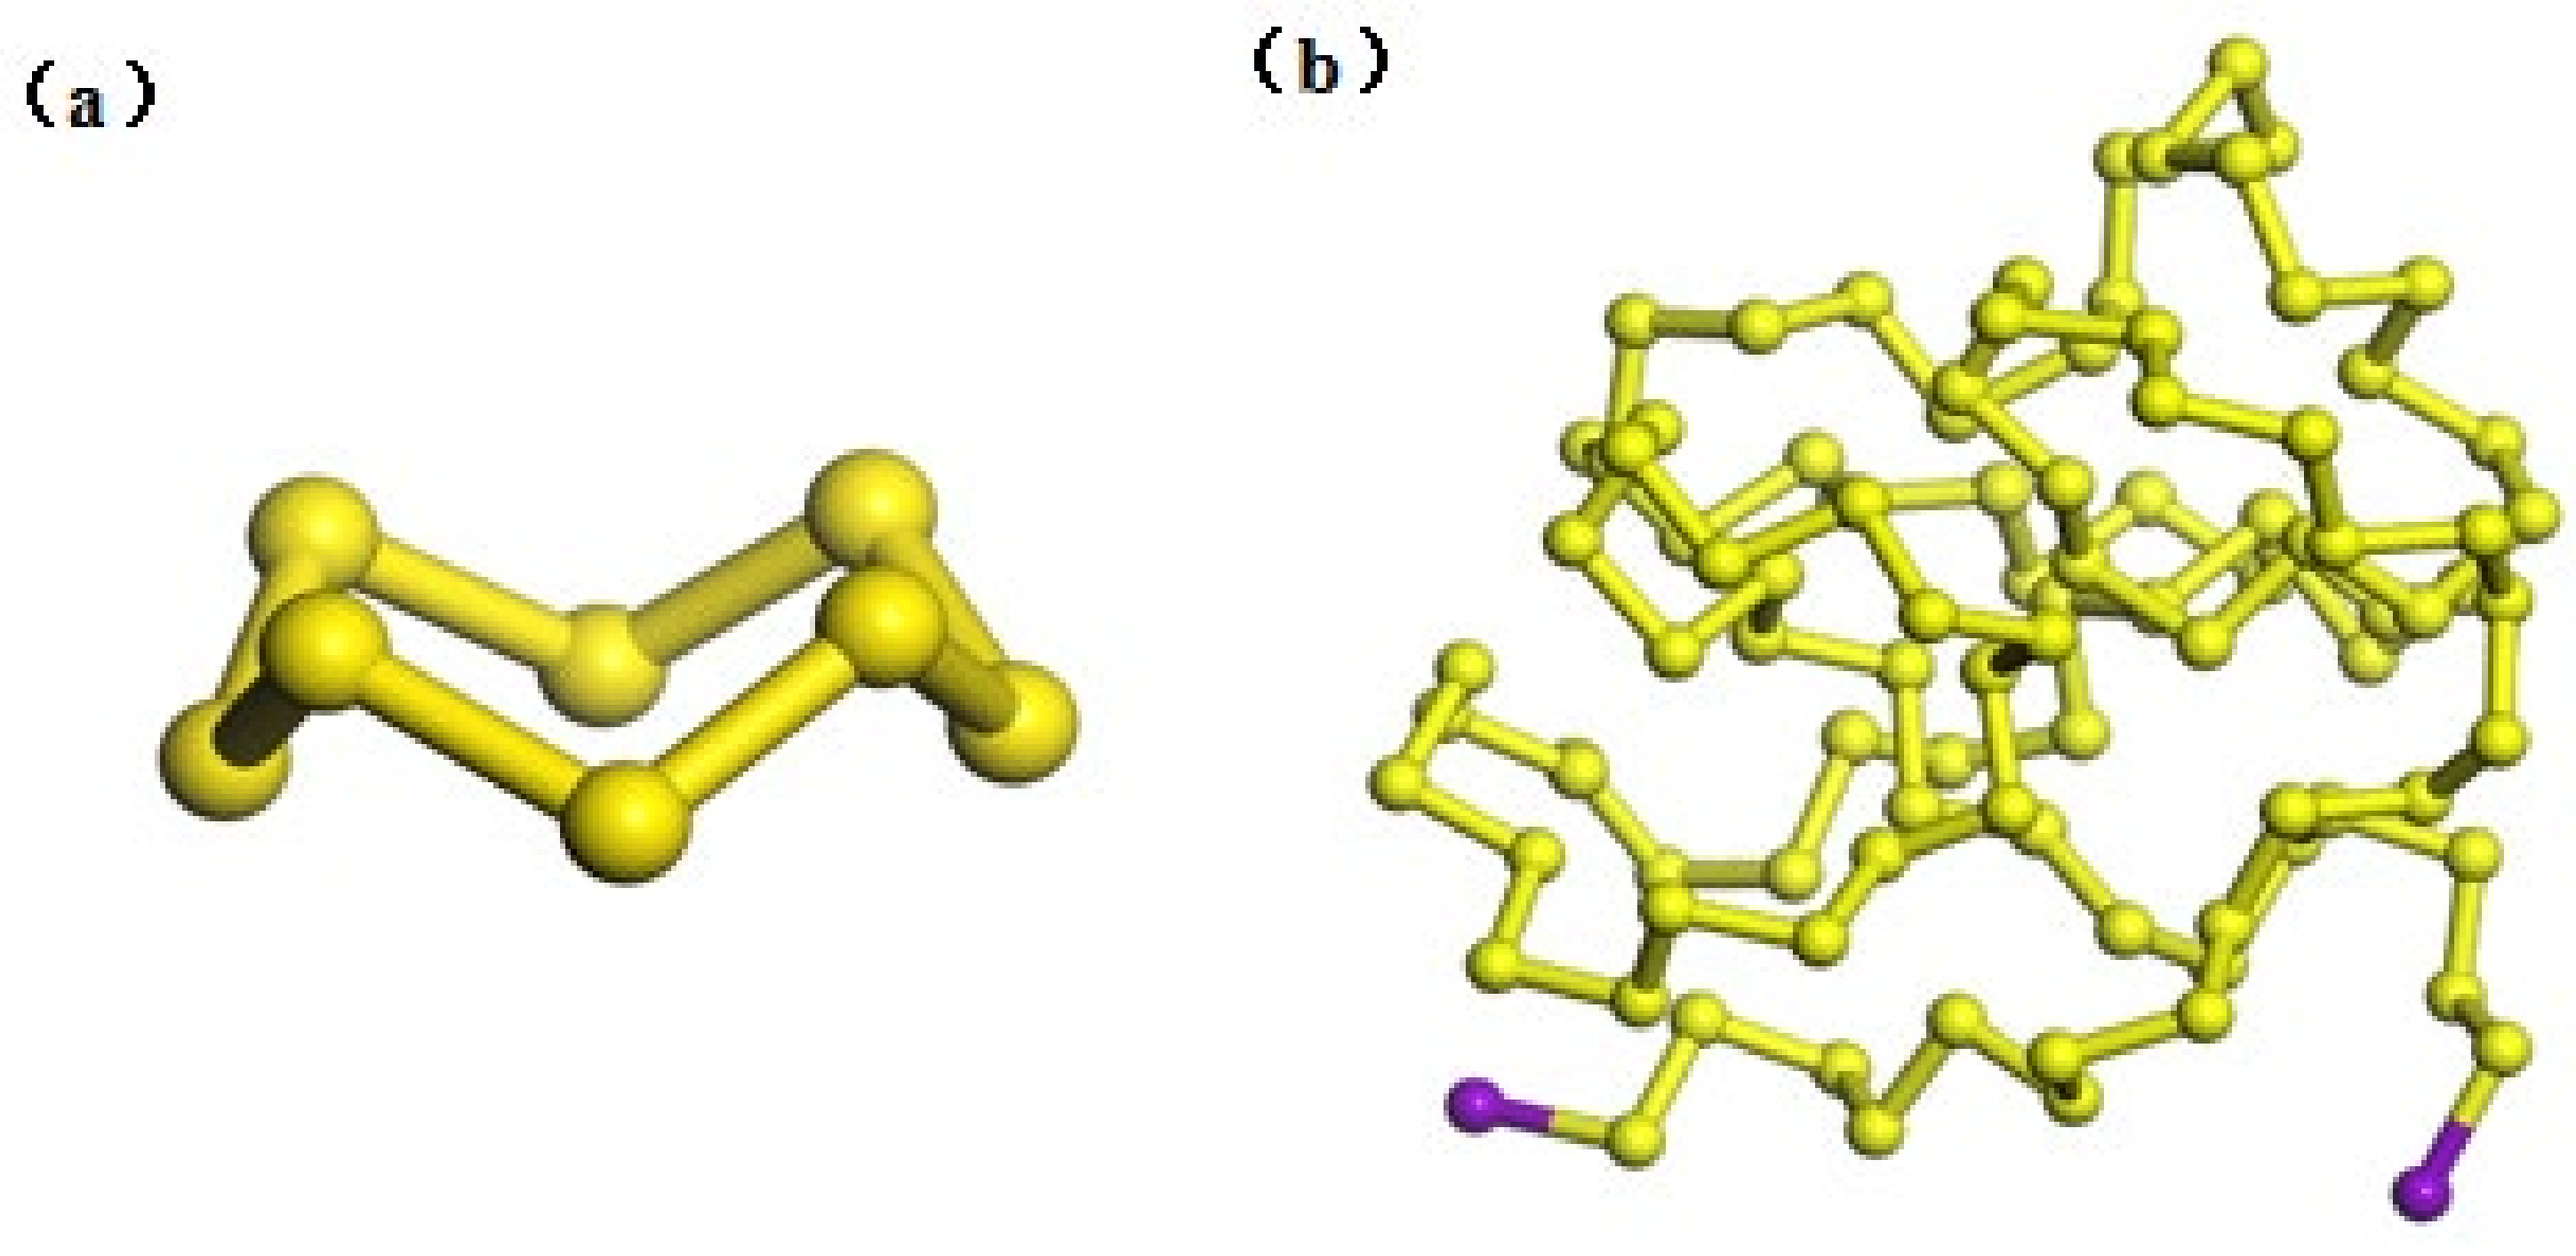
2.1. Model Construction

Firstly, the monomolecular models of soluble sulfur (S8), insoluble sulfur (IS) and carbon disulfide (CS2) were constructed according to reference [12]. S8 is a planar regular octagonal structure, and IS is a polymer chain with 96 S atoms. It has been shown in the literature that ·S8n· is a metastable substance [13], and both ends of the polymerized sulfur molecular chain are free radicals. After polymerization, ·S8n· will break from both ends, so it is necessary to add a small amount of stabilizer to inhibit the breaking speed of the sulfur atom chain and improve the stability of IS. In this paper, an iodine atom is selected as the capping agent. After the structure is completed, the DMol3 module in Materials Studio (MS) software is selected, and the structure is optimized based on density functional theory. Geometry optimization is selected as the task; GGA and BLYP are set as the basis set and universal function, respectively, in the functional; charge is set to 0, and max. iterations is set to 200. The rest of the convergence tolerance can be selected by default, and the obtained optimized configuration of IS is shown in Figure 1. The S8 configuration is a three-dimensional crown shape [13], which conforms to its theoretical configuration. The optimized IS configuration is similar to the winding three-dimensional space configuration of “wool”.

2.2. Simulation Details

Based on the optimized structure, a CS2 solution model is constructed, as shown in Figure 2. We selected Gromacs 2019.4 software and the GROMOS54A7 [14] all-atom force field, and the force field parameters were derived from the Automated Topology Builder (ATB) tool [15]. For the soluble sulfur S8 system (model A), firstly, a certain number of S8 molecules (310) were placed in a box of 6 × 6 × 6 nm to minimize the energy, and then the isothermal and isobaric ensemble (NPT) simulation was carried out. The Berendsen hot bath method was adopted to control the temperature, the simulation step was 2 fs, and the total simulation time was 10 ns, so as to obtain the appropriate density. At the simulation endpoint, the system simulation density was approximately 2.015 g/cm3, and the relative error with the data from [16] was 2.18%. It could be proved that this method could be used to simulate the density of substances. The final box size was 4.32 × 4.32 × 4.32 nm. The optimized aggregation model was placed in the center of a new box with a size of 9 × 9 × 9 nm, filled with a certain number of CS2 molecules (6550) and then simulated by canonical ensemble (NVT) at 298 K, 318 K and 333 K, respectively, with a simulation step of 2 fs and a total simulation time of 30 ns. In the whole simulation process, the Velocity-Verlet algorithm was used to solve Newton’s motion equation for each particle. The LINCS algorithm was used to constrain the bond length, the Lennard–Jones potential function was used for Van der Waals interaction, and its truncation radius was 1.2 nm. The molecular dynamics trajectory was observed by the VMD program, and the simulation systems were called A-298, A-318 and A-333, respectively.
The insoluble sulfur (IS) system was simulated by a similar treatment method. Because the actual density of IS is unknown, the initial box of the NPT ensemble was built as 6 × 6 × 6 nm, and 10 IS molecular chains were placed in it. Finally, the simulated grid under the NPT ensemble was 4.005 × 4.005 × 4.005 nm. The IS system in CS2 solvent (the same the CS2 molecule added to the box to correspond to the above A model) had a box size of 9 × 9 × 9 nm and the simulation temperature was controlled at 333 K, which was called simulation system B-333.

3. Results and Discussion

3.1. Simulation Results

As can be seen in Figure 3a, at the simulation endpoint (30 ns) of system A-298, a small group of S8 molecules on the surfaces of S8 clusters will diffuse into the surrounding CS2 solvent, but the inner S8 molecules of the S8 clusters will also move from the inside to the spherical shell of the S8 clusters, and the diameter of the S8 clusters is around 4 nm at this time. It can also be seen from the figure that the S8 cluster density decreases slightly, and its centroid also moves in the CS2 solvent. According to Figure 3a (A-298), b (A-318) and c (A-333), when the endpoint equilibrium is simulated, with the increase in temperature, more S8 molecules from the surfaces of the S8 cluster will diffuse into the surrounding CS2 solvent, more S8 molecules from the interior of the S8 cluster will move into the spherical shell of the S8 cluster, and the diameter of the S8 cluster will be altered. Comparing the conformation of the last frame of the model in Figure 3d (B-333) with its initial structure at the simulation endpoint, it is found that the centroid of the IS cluster will shift in the box space, there is no dissolution trend, and its volume in the space has no obvious change.

3.2. Solubility Analysis of Soluble Sulfur

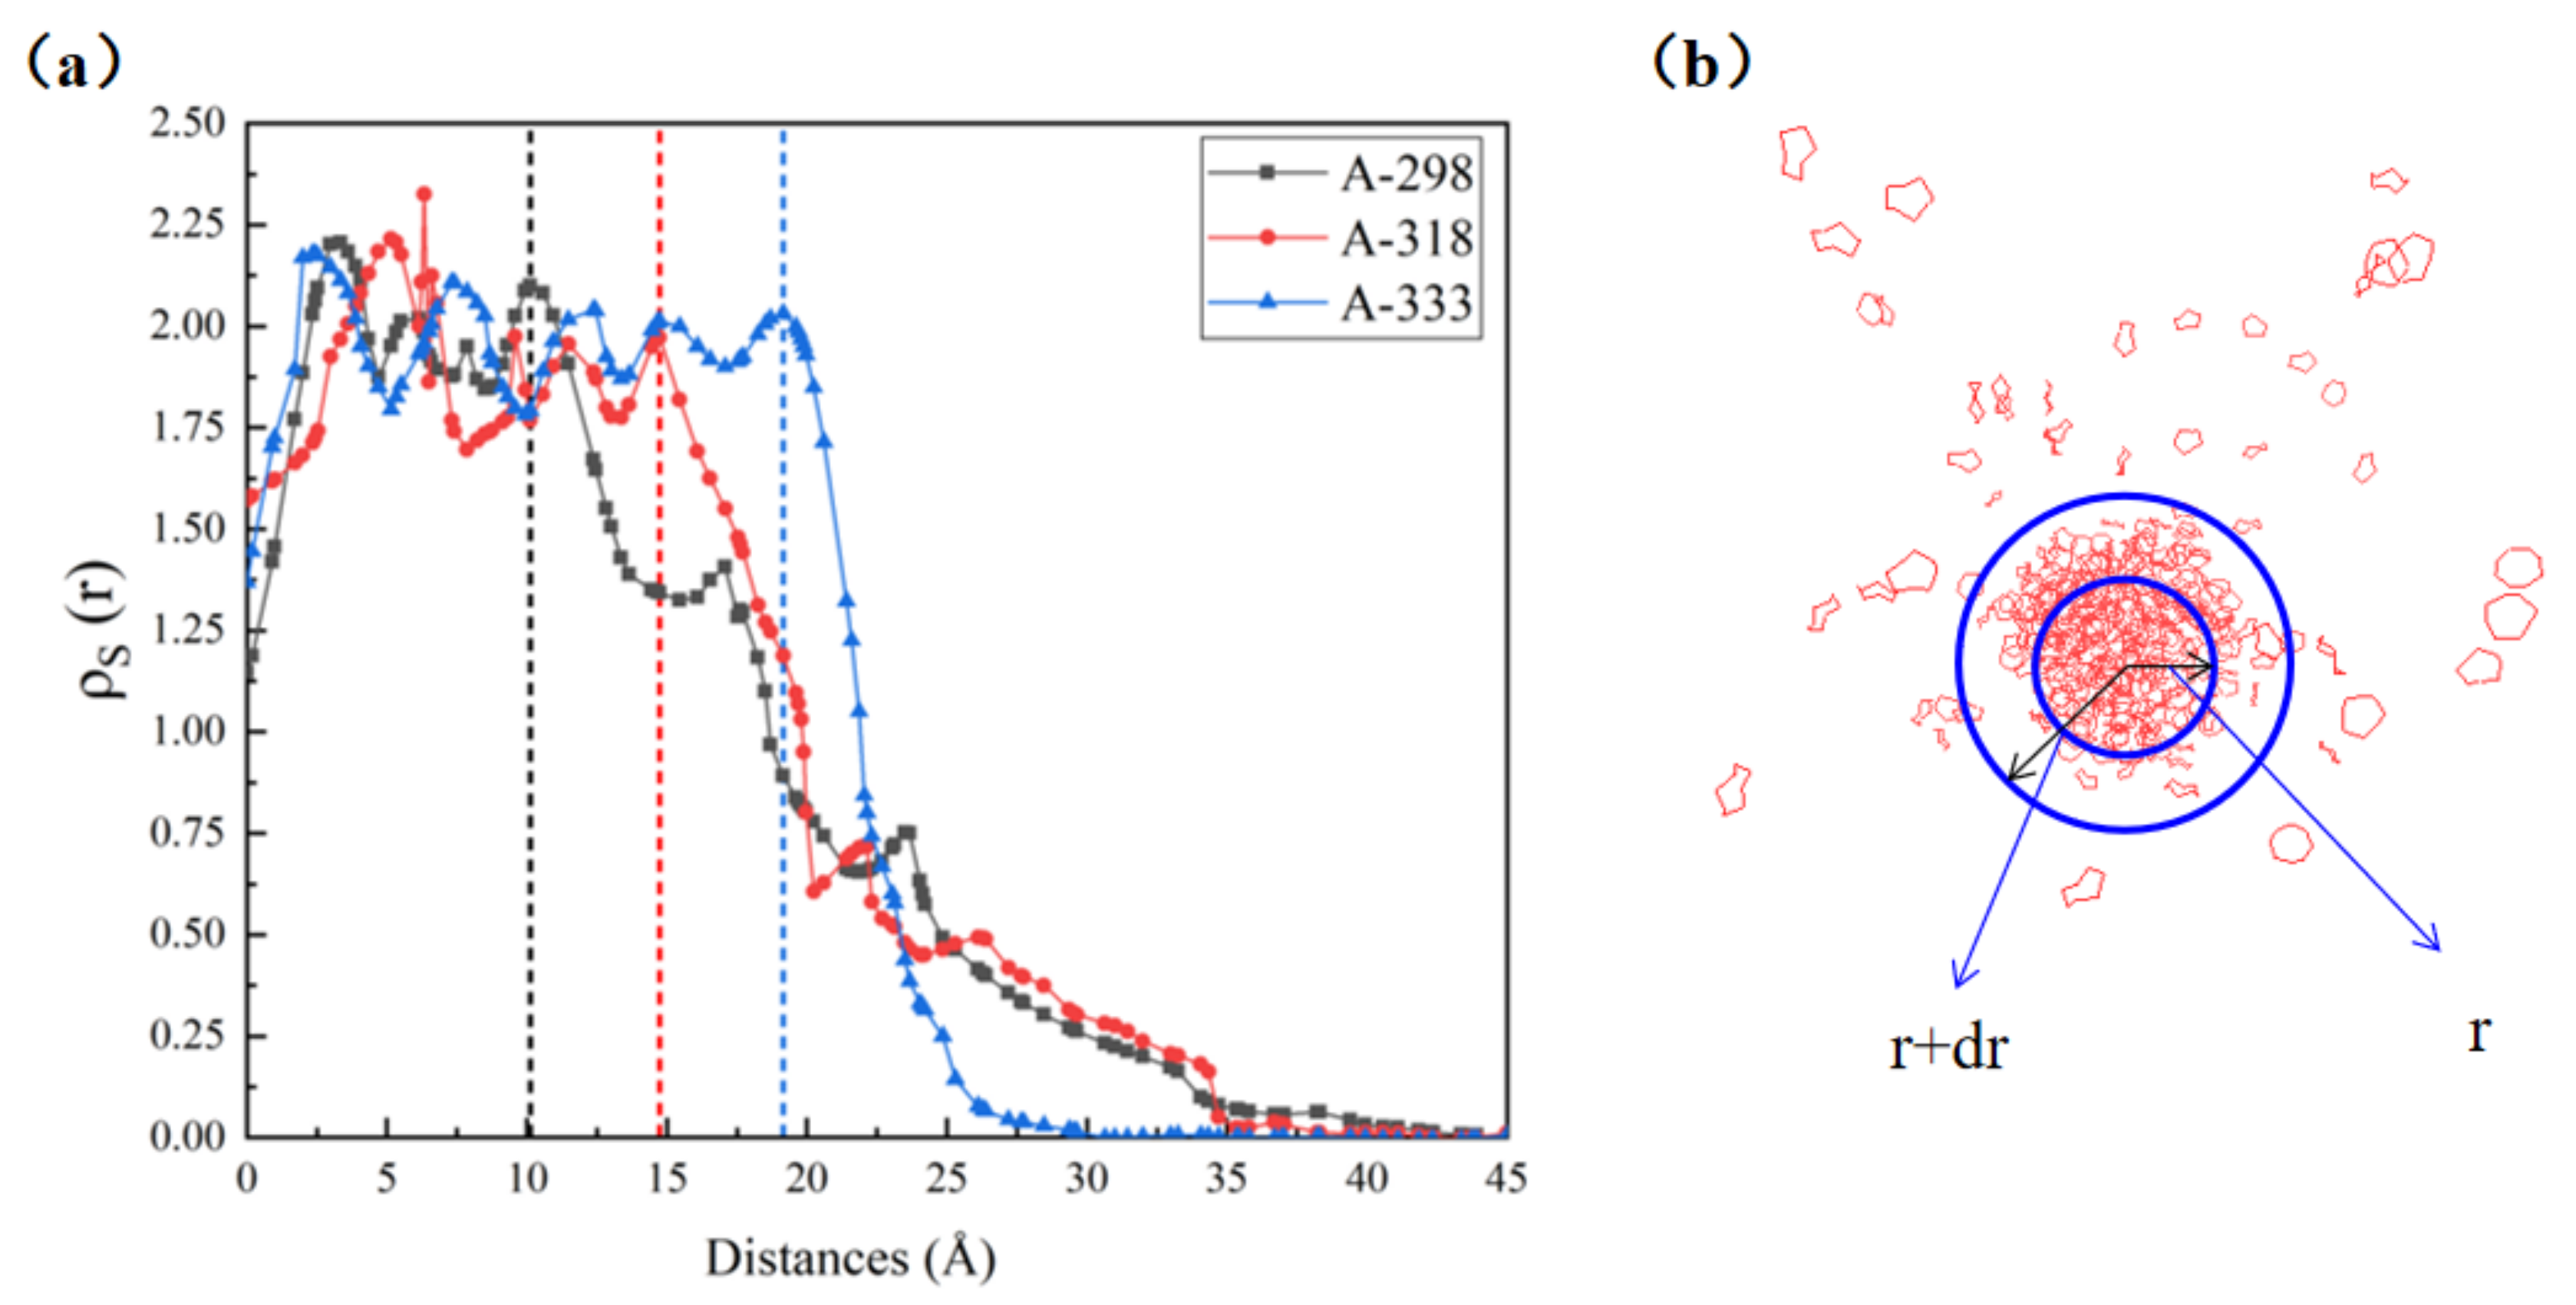
3.2.1. Properties of Dissolved Sulfur

In order to better study the relationship between S8 molecules and S8 clusters in the simulation process, the number density change of S8 in solution was studied in this paper. As shown in Figure 4b, taking the center of mass of the S8 cluster as the center, the number of S8 molecules contained from radius R to r + dr was counted as NS(r) [17], and the number density of S8 molecules in the “spherical shell” was counted by formula (1). When the radius of the S8 cluster tends to be stable, the distance between each S8 molecule and the centroid of S8 cluster was calculated.
ρ S r = N S r 4 3 π r + d r 3 r 3
As shown in Figure 4b, the whole space can be divided into three areas with increasing distance from the center of mass: the S8 cluster area, transition area and CS2 area. Near the centroid of the S8 cluster, ρS(r) tends to be stable, which is the S8 cluster area. In the transition region, the density distribution ρS(r) decreases rapidly with the increase in the distance from the centroid, and this region is occupied by different numbers of CS2 and S8 molecules. When ρS(r) decreases to a stable value, the S8 molecule at the stable value is considered to have entered the CS2 region. Moreover, in the transition region, with the increase in the distance from the centroid, the number density of S8 molecules decreases by an order of magnitude compared with that of the S8 cluster region.
In molecular dynamics simulation, the “10-90” method [18] is often used to determine the boundary between two phases. In order to better determine the boundary between the two phases, the trajectories of models A-298, A-318 and A-333 were analyzed. As shown in Figure 4a, ρS(r) was counted and the position of the junction was observed. It is found that ρS(r) in the figure has an obvious downward trend at a certain position; that is, the dotted lines in the figure are, respectively, defined as the junction of the S8 cluster area and transition area. According to this characteristic, the x coordinate value of each line segment is defined as m. For the three systems, A-298, A-318 and A-333, when the m value of the center of mass of the S8 molecule in the system is greater than 10, 15 and 18, respectively, it is considered that the S8 molecule is dissolved in CS2, and S8 is considered to be dissolved in CS2 at this time.
According to the definition in this paper, the dissolved sulfur is expressed as a molar fragment (M.F.). It can be seen from Figure 5 that the M.F. changes with the simulation time, but gradually approaches a stable value, which is close to the experimental value (the solid line parallel to the X axis in the figure). Figure 5a–c are schematic diagrams of the M.F. of A-298, A-318 and A-333 with simulation time, respectively. It can be clearly seen that with the increase in temperature, the molar ratio of S8 to CS2 gradually increases, and the number of dissolved S8 molecules also gradually increases, until the system reaches equilibrium; it will tend to a stable value, and this value is almost consistent with the data in [19]. As shown in Figure 5a,c, it takes around 22 ns for M.F. to converge at 298 K, but only around 15 ns at 333 K. This shows that only from these three temperatures, with the increase in simulated temperature, M.F. can converge faster. From the production perspective, a higher temperature can indeed improve the extraction efficiency, but it will also cause more energy consumption. According to this simulation, 318 K (45 °C) may be a good choice for production.

3.2.2. Dissolved Sulfur Interaction

Noncovalent interactions (NCI) analysis [14] is a tool that is generally applicable to graphically display the properties and occurrence areas of intermolecular noncovalent interactions. In order to better show the weak interaction between S8 and CS2, the independent gradient model (IGM) analysis [20] of these compounds was carried out via Multiwfn software [15]. The aRDG method is used to study the type and intensity of a weak interaction between a single S8 molecule and CS2, and the weak interaction intensity is generally measured by interaction energy. In AIM theory, ρ(r), the critical point of weak interaction, is one of the most important indexes to measure the strength of interaction. Its value has a positive correlation with the strength of the bond, so it is also used to define the bond level. By mapping the value of ρ(r) to the RDG isosurface in different colors, the aRDG diagram can be obtained, and the intensity of its interaction is clear at a glance. As shown in Figure 6, the bluer the color is, the stronger the electrostatic and hydrogen bond effects are; the redder the color is, the more obvious the steric hindrance effect is; meanwhile, the green color indicates that the average density value of the corresponding position is lower, which corresponds to a weak effect, namely the dispersion effect. The whole S8 forms a green isosurface, which clearly shows that S8 molecules tend to form van der Waals interactions with other CS2 molecules in these directions, so van der Waals interaction is the dominant factor affecting the weak interaction between S8 and CS2 molecules [21].
It is found that S8 molecules located at the edges of clusters can be dissolved in CS2 solvent under the interaction of CS2 molecules. We selected an S8 molecule in the subsurface of the S8 cluster and analyzed its trajectory. From Figure 7, it can be seen that in the first ns, a single S8 molecule will interact with its surrounding S8 molecules, continuously rotate and adjust its position in space in the sub-surface area of the S8 cluster, and it will then gradually move to the surface area of the S8 cluster. At around the ninth ns, the molecule will gradually escape the control of the S8 cluster and come into contact with more CS2 molecules. Then, under the action of van der Waals force, it will rotate and adjust its position in space until it completely enters the CS2 phase.

3.3. Solubility Analysis of Insoluble Sulfur

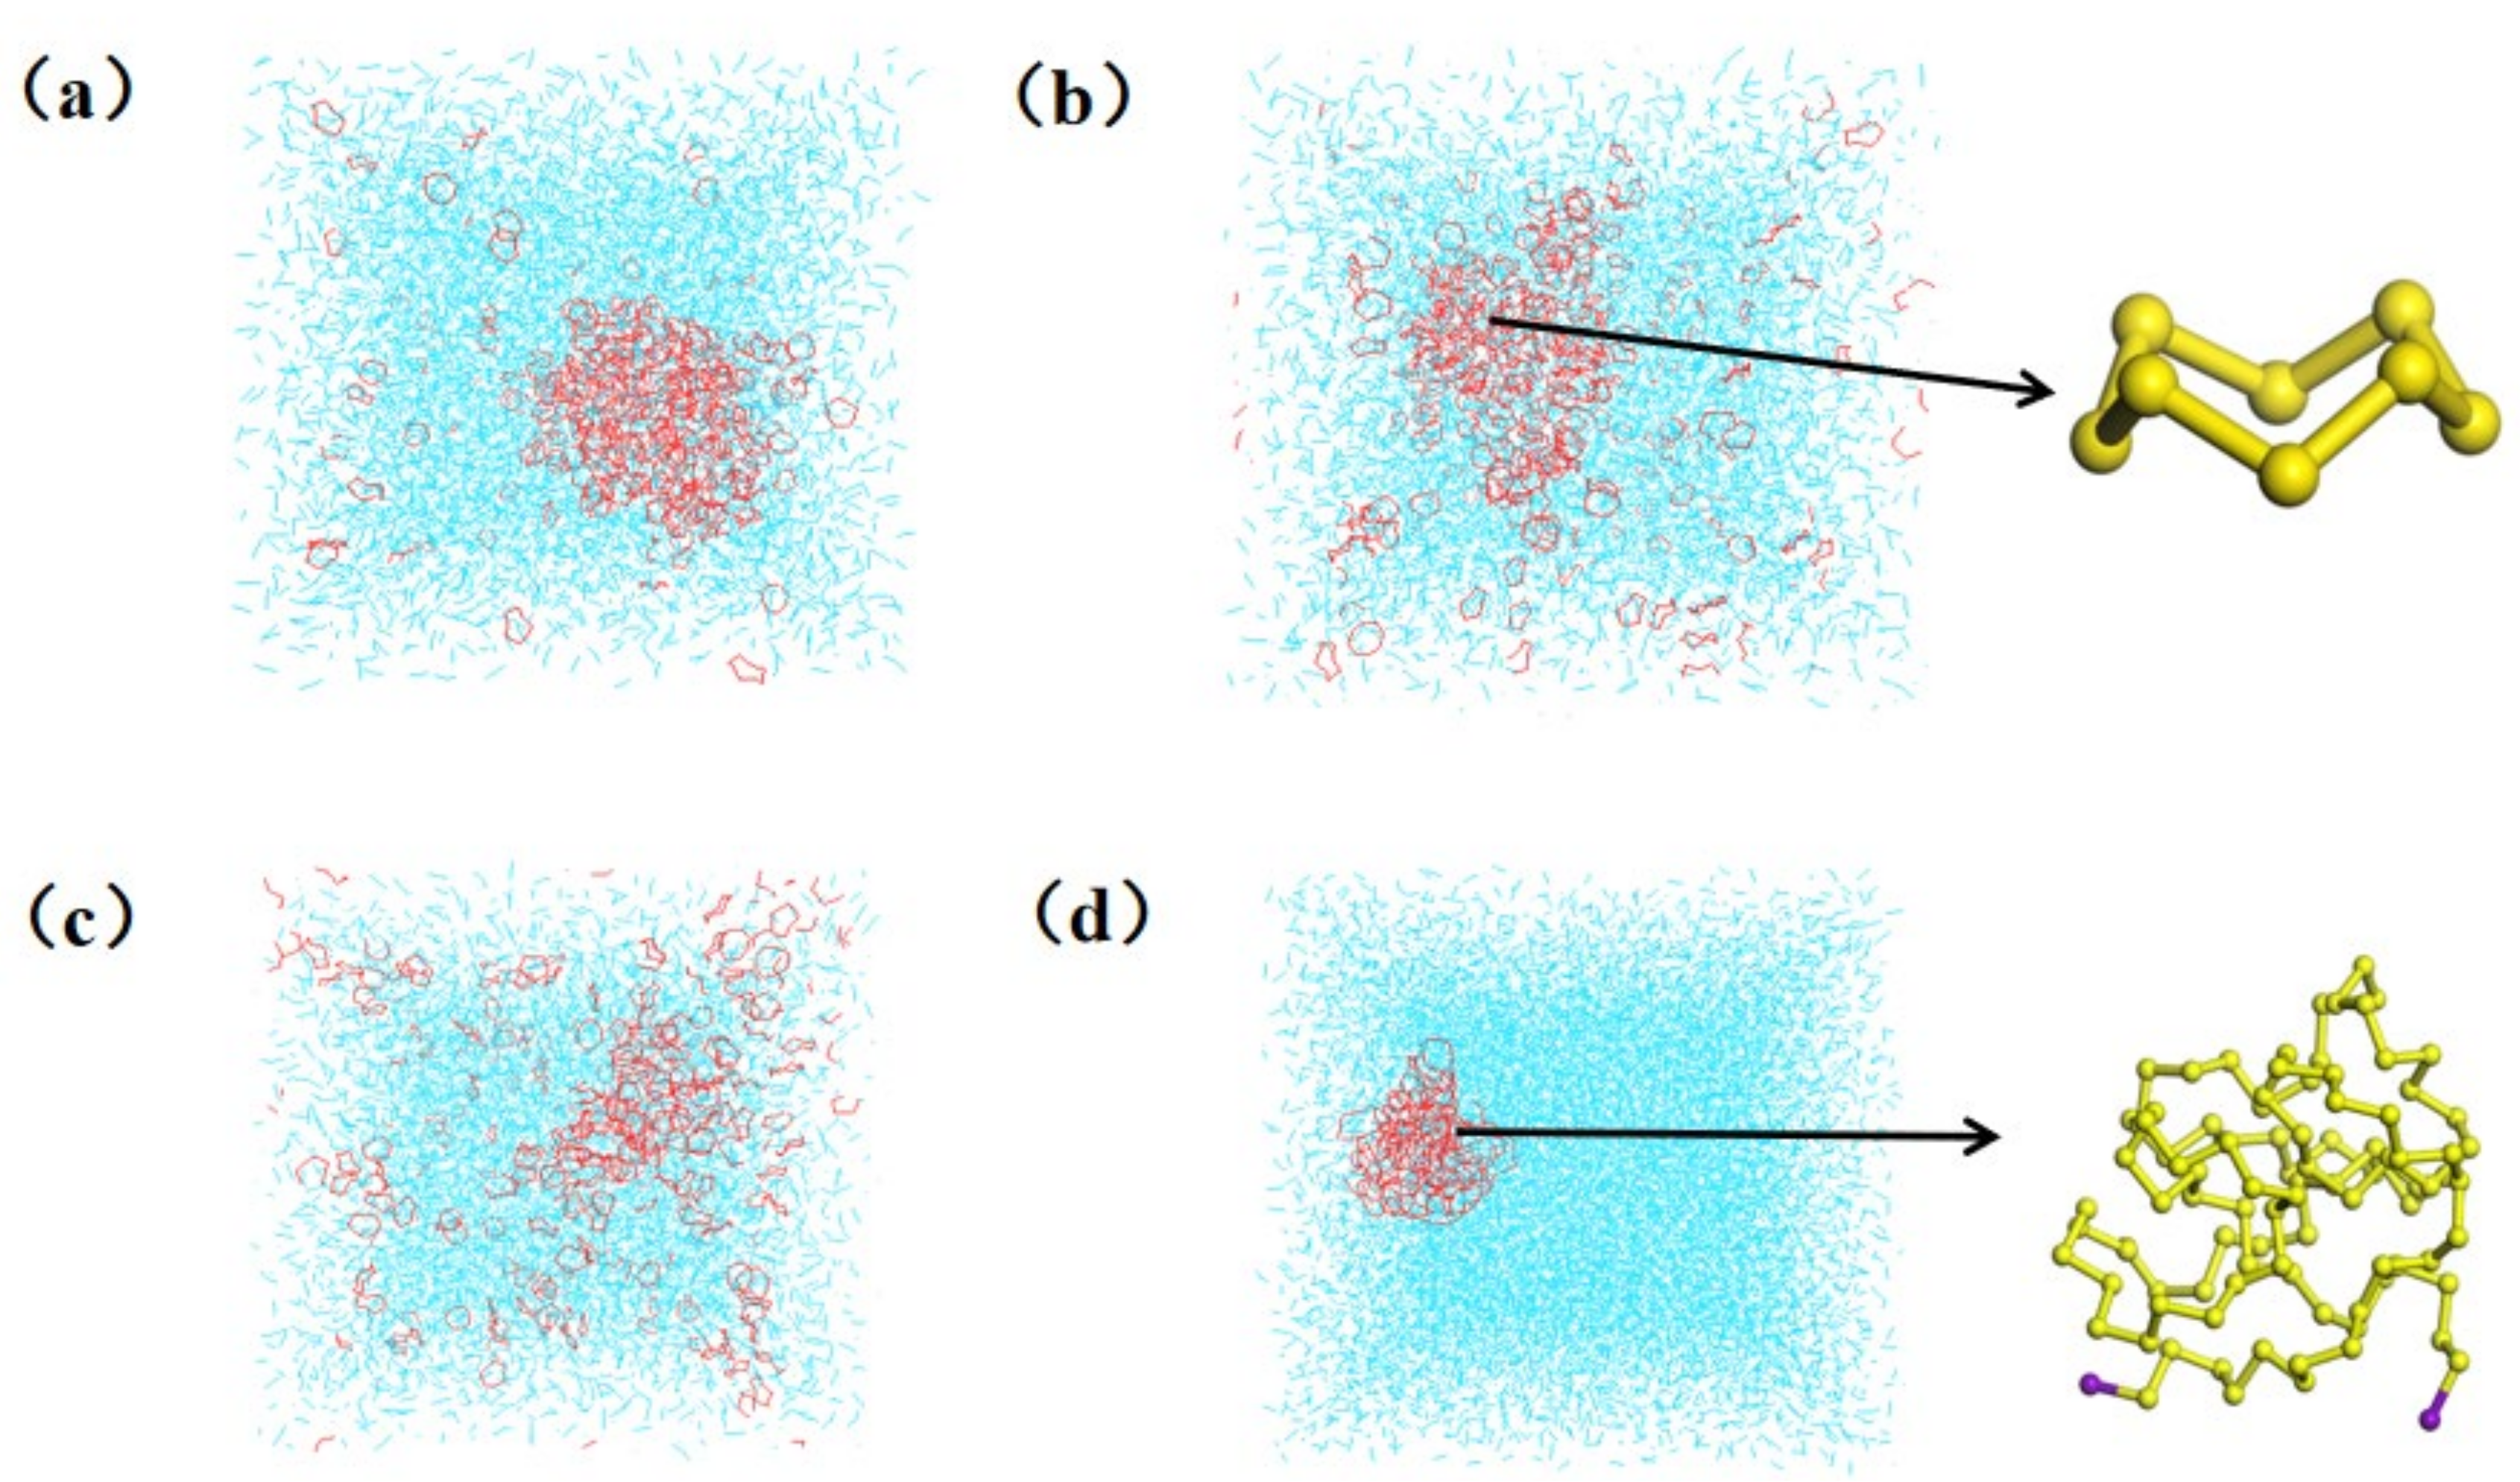
3.3.1. Dissolution Behavior of Insoluble Sulfur

It can be seen from the above that S8 can be dissolved in CS2, and the amount of dissolved sulfur increases with the increase in temperature in a certain temperature range, but it is not soluble in CS2 for polymeric sulfur IS. First of all, the simulation results of IS in the CS2 system (system B-333) can be seen from the last image in Figure 3. In the last frame of the simulation, the IS cluster is not dispersed, and it can be seen from its mass density distribution (as shown in Figure 8b) that there is only one peak in the whole simulation process from the beginning of the simulation to the end of the simulation. Combined with the IS cluster in Figure 8a, its volume expands slightly in space with the increase in simulation time. Furthermore, it can be seen from Figure 8b that the mass density curve of the 30 ns represented by the green curve is slightly lower and larger than the peak of the mass density curve of the 0th ns represented by the black line, which is in good agreement with the experimental results. It can be seen that IS clusters do not dissolve in the CS2 system, but their clusters will change in different positions in the CS2 system space.

3.3.2. Solute Interaction with Solvent

In order to determine why S8 can be dissolved in CS2 and IS cannot be dissolved in CS2 at the microscopic level, firstly, the interaction energy images of solute molecules S8 and IS and solvent molecules CS2 in systems A-333 and B-333 with simulation time were generated. From Figure 9, it can be seen that the interaction energy between IS and CS2 represented by the red curve at the top fluctuates in the equilibrium range of −5000 KJ/mol within the simulation time of 30 ns, which indicates that IS clusters are only in the CS2 solvent. The interaction energy curve of S8 and CS2 represented by the black curve at the bottom of the whole shows that the interaction energy decreases from around −12,000 kJ/mol to around −27,500 kJ/mol at the beginning of the simulation, until it fluctuates around −27,500 kJ/mol, indicating that S8 quickly dissolves in CS2 in the first time period, and then from approximately 15,000 ps; gradually, the system reaches equilibrium, and some undissolved S8 still exists in the system, which is not completely dissolved, in line with the above conclusion.

3.4. Solubility Parameter Theory

Through the molecular dynamics simulation, it can be concluded that S8 molecule IS dissolved in CS2 through van der Waals interaction, but IS was insoluble. We can also explain this from the perspective of solubility parameter theory [22,23,24]. The concept of the solubility parameter was first put forward by Hildebrand [25], and it is an important parameter to characterize the interaction strength of simple liquid molecules. At present, solubility parameters are widely used in the calculation of the phase equilibrium of multi-component systems, solvent extraction, selection of coating solvents and other fields. In the research of solubility, both low-molecular substances and high-molecular substances are applied in their condensed state. This aggregation state is determined by the geometric arrangement of molecules, which determines the physical properties of substances. The force between molecules in the aggregated state is not the chemical bond force, but the force between unbonded atoms, which can be divided into van der Waals force dispersion force, induction force, couple force and hydrogen bond. Usually, cohesive energy, cohesive energy density or solubility parameters are used to express intermolecular forces. The solubility parameter is defined as the square root of cohesive energy density.
δ = E V 0.5 = U m V m 0.5
In Equation (2), E is cohesive energy (KJ/mol), V is volume (ml/mol), and E and V are the cumulative values of the energy and volume of each group constituting the molecule, respectively; Um is the molar evaporation energy of the polymer, and Vm is the molar volume of one repeating unit of the polymer [26]. It is suggested that a carrier with a smaller difference (ΔSP) from the solvent solubility parameter should be selected as far as possible when screening carriers. If the solubility parameters of the solute and solvent are similar, they are easily mutually soluble [27]. Before studying the solubility parameters of IS, it is necessary to verify the feasibility of the simulation of the Focite module in MS software. At this time, task is selected as Cohesive Energy Density, the forcefield is set to Compass, and charges is set to forcefield assigned. Electrostatic and van der Waals are controlled by the atom-based method. The known solubility parameters of benzene (C6H6), ethyl acetate (CH3COOC2H5) and carbon disulfide (CS2) are calculated first.
It can be seen from Table 1 that the relative errors between the simulated values of the solubility parameters of C6H6, CH3COOC2H5 and CS2 and the reference values in the literature are all below 10%. Therefore, it can be considered that the above-mentioned methods for simulating the solubility parameters can be applied to predict the solubility parameters of a substance. Then, the solubility parameters of S8 and IS are calculated by using the above method of calculating solubility parameters and the aforementioned molecular models of S8 and IS, and the simulated values of solubility parameters of S8 and IS are shown in Table 2.
The literature shows that the ΔSP of solute and solvent in solid dispersion is 1.6−7.5. When ΔSP is melted at 1.6–7.5, solute and solvent are completely miscible; when ΔSP is in liquid state at 7.4−15.0, they are completely immiscible when ΔSP > 15.9 [29]. According to the above theoretical calculation, the difference ΔSP in solubility parameters between S8 and CS2 at 333 K is 8.256, ranging from 7.4 to 15.0, and they are partially soluble, while the difference ΔSP in solubility parameters between IS and CS2 is 16.953, which is greater than 15.9, and they are completely immiscible, which accords with this theory. It can be concluded that the IS model constructed above is reasonable and can play a role in the future study of IS. However, solubility parameters cannot fully reflect the influence of the molecular structure and spatial structure of the solvent on sulfur solubility, so it is not comprehensive to judge whether a solvent is suitable or unsuitable for sulfur solubility simply by the size of solubility parameters.

4. Conclusions

In this paper, the MD simulation method was used to study the dissolution behavior of S8 and IS in the CS2 system. From the whole simulation process, it is in line with the experimental expectation, so the model can be applied to explore the sulfur and insoluble sulfur problems in a microscopic way. From the simulation process, it can be seen that some S8 molecules around S8 clusters will diffuse into the CS2 system until the system reaches equilibrium, and the radius of S8 clusters will gradually decrease and become stable. As for the IS cluster, its position fluctuates in space, but there is no sign of scattering. We also introduced the definition of dissolved sulfur into the analysis of S8 in dissolution in the CS2 system. Through the simulation at 30 ns, we can see that S8 can dissolve in CS2, and its dissolution efficiency is different at 298 K, 318 K and 333 K. The higher the temperature, the better the dissolution effect. Moreover, from the industrial production point of view, the higher the temperature, the higher the dissolving efficiency of S8 in CS2, but at the same time, more energy and resources will be wasted. From the microscopic level, judging the weak interaction between solute S8 and solvent CS2 by the aRDG method, it can be found that van der Waals interaction is the dominant factor affecting the weak interaction between S8 and CS2. Furthermore, the solubility behavior of S8 and IS in the CS2 system was explained from the point of view of their interaction energy. In addition, the solubility parameter theory was used to verify that the IS model is reasonable, and the solubility parameter difference ΔSP between IS and carbon disulfide at 333 K is 16.953, which is greater than 15.9, and they are completely immiscible, which accords with this theory, and thus our findings can provide a reference for future research on IS problems, especially for finding a new, effective and pollution-free extractant as an alternative to CS2. However, the solubility parameter cannot fully reflect the influence of the molecular structure and spatial structure of the solvent on the solubility of sulfur, so it is not comprehensive to judge the solubility of a solvent for sulfur simply from the solubility parameter; however, the solubility parameter method can be applied to predict whether a substance is soluble in another substance.

Author Contributions

Conceptualization, X.C. and X.Z.; methodology, X.C. and W.W.; software, X.C.; validation, W.W., M.D. and D.M.; formal analysis, X.C. and W.W.; investigation, X.Z. and D.M.; resources, W.W. and M.D.; data curation, X.C.; writing—original draft preparation, X.C. and D.M.; writing—review and editing, X.Z.; visualization, X.C.; supervision, X.Z.; project administration, X.Z.; funding acquisition, X.Z. All authors have read and agreed to the published version of the manuscript.

Funding

The project was funded by the Shandong Provincial Key Research and Development Program (Plan No. 2017CXGC1101 and Project No. 2019JZZY010513).

Data Availability Statement

Data presented in this study is enclosed in the manuscript.

Conflicts of Interest

The authors declare no conflict of interest.

Sample Availability

Samples of the compounds are not available from the authors.

References

  1. Griebel, J.; Glass, R.S.; Char, K.; Pyun, J. Polymerizations with elemental sulfur: A novel route to high sulfur content polymers for sustainability, energy and defense. Prog. Polym. Sci. 2016, 58, 90–125. [Google Scholar] [CrossRef] [Green Version]
  2. Chaudhuri, R.G.; Paria, S. Synthesis of sulfur nanoparticles in aqueous surfactant solutions. J. Colloid Interface Sci. 2010, 343, 439–446. [Google Scholar] [CrossRef] [PubMed]
  3. He, J.; Qiu, L. Application of domestic insoluble sulfur OT-20in TBR tire. Tire Ind. 2009, 29, 550–553. [Google Scholar]
  4. Yuan, Y.; Zhang, X.; Song, T.; Gao, X. Application of Insoluble Sulfur Crystex Cure Pro in All-steel Radial Tire. Rubber Sci. Technol. 2022, 20, 75–78. [Google Scholar]
  5. Luo, H.K.; Li, D.G.; Luo, S. The effect of halide and the coordination geometry of chromium center in homogeneous catalyst system for ethylene trimerization. J. Mol. Catal. A Chem. 2004, 1–2, 75–78. [Google Scholar]
  6. Zhang, K.; Xia, X.; Qiang, Y. Effect of Styrene on The Extraction of Insoluble Sulfur. Spec. Petrochem. 2012, 29, 76–79. [Google Scholar]
  7. Jones, R.O.; Ballone, P. Density functional and Monte Carlo studies of sulfur(I): Structure and bonding in Sn rings and chains (n = 2−18). J. Phys. Chem. 2003, 118, 9257–9265. [Google Scholar] [CrossRef] [Green Version]
  8. Jones, R.O.; Ballone, P. Density functional and Monte Carlo studies of sulfur(II): Equilibrium polymerization of the liquid phase. J. Phys. Chem. 2003, 119, 8704–8715. [Google Scholar]
  9. Wang, R.; Shen, B.; Ma, J.; Zhao, R. Ring-open reaction mechanism of sulfur S8 based on density functional theory. CIESC J. 2015, 66, 3919–3924. [Google Scholar]
  10. Jian, M.; Jigang, Z.; Rongjie, W.; Yang, S.; Benxian, S. Molecular simulation studies on the properties of insoluble sulfur stabilizers. Chem. Ind. Eng. Prog. 2016, 35, 706–710. [Google Scholar]
  11. Jigang, Z.; Yang, S.; Rongjie, W.; Benxian, S. A novel and easy way to improve the thermal stability of insoluble sulfur by curing process. Phosphorus Sulfur Silicon Relat. Elem. 2017, 192, 431–436. [Google Scholar] [CrossRef]
  12. Audran, G.; Brémond , P.; Marque, S.R.; Santelli, M. Theoretical investigations on the conversions of cyclic polysulfides to acyclic polysulfide diradicals and subsequent reactions of biological interest. Tetrahedron 2017, 73, 3492–3496. [Google Scholar] [CrossRef]
  13. Orthous-Daunay, F.R.; Quirico, E.; Lemelle, L.; Beck, P.; de Andrade, V.; Simionovici, A.; Derenne, S. Speciation of sulfur in the insoluble organic matter from carbonaceous chondrites by XANES spectroscopy. Earth Planet. Sci. Lett. 2010, 300, 321–328. [Google Scholar] [CrossRef]
  14. Johnson, E.R.; Keinan, S.; Mori-Sanchez, P.; Contreras-García, J.; Cohen, A.J.; Yang, W. Revealing Noncovalent Interactions. J. Am. Chem. Soc. 2010, 132, 6498–6506. [Google Scholar] [CrossRef] [Green Version]
  15. Lefebvre, C.; Rubez, G.; Khartabil, H.; Boisson, J.-C.; Contreras-García, J.; Henon, E. Accurately extracting the signature of intermolecular interactions present in the NCI plot of the reduced density gradient versus electron density. Phys. Chem. Chem. Phys. 2017, 19, 17928–17936. [Google Scholar] [CrossRef]
  16. Foster, R.B. Sulfur-Challenging Market Conditions Reshaping the Future. EMJ- Eng. Min. J. 1993, 194, 52–56. [Google Scholar]
  17. Chen, H.; Liu, C.; Xu, X. Molecular dynamic simulation of sulfur solubility in H2S system. Int. J. Mod. Phys. B. 2019, 33, 0052. [Google Scholar] [CrossRef]
  18. Baidakov, V.G.; Chernykh, G.G.; Protsenko, S.P. Liquid-vapor equilibrium and surface tension in Lennard-Jones systems. Russ. J. Phys. Chem. A 2000, 74, 1241–1245. [Google Scholar]
  19. Zhang, S.; Li, C.; Wu, Q.; Xie, Y.; Zhang, S.; Cao, Z.; Ding, S.; Yu, Q.; Wang, M.; Wang, G.; et al. Chemical Handbook; Shandong Science and Technology Press: Shandong, China, 1986; pp. 19–84. [Google Scholar]
  20. Lu, T.; Chen, F.; Multiwfn. A multifunctional wavefunction analyzer. J. Comput. Chem. 2012, 33, 580–592. [Google Scholar] [CrossRef]
  21. Yuan, S.; Zhang, H.; Wang, X.; Zhang, H.; Zhang, Z.; Yuan, S. Molecular insights into the uptake of SiO2 nanoparticles on phospholipid membrane: Effect of surface properties and particle size. Colloids Surf. B. Biointerfaces 2022, 210, 112250. [Google Scholar] [CrossRef]
  22. Gao, M.; Zhang, Z.; Zhang, W.; Gao, Q.; Tang, Z.; Zhao, W. Understanding the top-down fragmentation of 2D material in miscible liquid environment based on Hansen solubility parameters theory. FlatChem 2022, 32, 100346. [Google Scholar] [CrossRef]
  23. Han, K.H.; Jeon, G.S.; Hong, I.K.; Lee, S.B. Prediction of solubility parameter from intrinsic viscosity. J. Ind. Eng. Chem. 2013, 19, 1130–1136. [Google Scholar] [CrossRef]
  24. Li, G.; Li, J.; Li, H.; Gao, M.; Liang, S. Molecular Dynamics Calculation of the Solubility Parameters of Ethyl Cellulose. Guangdong Chem. Ind. 2015, 42, 5–10. [Google Scholar]
  25. Hildebrand, J.H.; Scott, R.L. The solubility of nonelectrolytes. Journal of chemical education; Dover Publications: Mineola, NY, USA, 1965; p. 4. [Google Scholar]
  26. Gao, B. Application for Solubility Parameter. North China Insitute Technol. 1998, 2, 18–20. [Google Scholar]
  27. Xia, Q.; Yin, K. Calculation of Solubility Parameters of Organic Solvents by Molecular Dynamics Simulation. J. Jiangsu Inst. Technol. 2004, 1, 40–42. [Google Scholar]
  28. Liu, G.; Hu, Y. Molecular Structure and Solubility Parameter Liquids. East China Inst. Chem. Technol. 1990, 3, 257–264. [Google Scholar]
  29. Li, Y.; Guo, P. Calculation of solubility parameter for liquids. J. Xinyang Norm. Univ. 2002, 1, 52–53. [Google Scholar]
Figure 1. Chemical structure of two single molecules: (a) S8, (b) IS.
Molecules 27 04402 g001
Figure 2. Model building process for (a) S8 and CS2 system, (b) IS and CS2 system.
Molecules 27 04402 g002
Figure 3. Each system of model A and B simulates the last frame conformation for (a) A-298 model, (b) A-318 model, (c) A-333 model, (d) B-333 model.
Molecules 27 04402 g003
Figure 4. (a) The variation trend of ρS(r) of models A-298, A-318 and A-333 with radius r; (b) position projection of S8 cluster on X-Y plane during simulation (CS2 molecule is not shown).
Molecules 27 04402 g004
Figure 5. Schematic diagram of M.F. change with time for (a) A-298 model, (b) A-318 model, (c) A-333 model.
Molecules 27 04402 g005
Figure 6. Schematic diagram of average reduced density gradient (aRDG) of single S8 molecule in CS2 system.
Molecules 27 04402 g006
Figure 7. Partial enlargement of single S8 molecule dissolved in CS2 system (cyan is single S8 molecule, light blue is CS2 molecule).
Molecules 27 04402 g007
Figure 8. (a) The change diagram of IS cluster with simulation time in B-333 model (CS2 molecule is omitted); (b) the graph of mass density of IS clusters with simulation time.
Molecules 27 04402 g008
Figure 9. Interaction energies of solute molecules S8 and IS with solvent molecules CS2 in model A-333 and model B-333 with simulated time.
Molecules 27 04402 g009
Table 1. Simulation value of solubility parameters of each substance and literature value [28] (P0 = l atm, 296.15 K).
Substance NameSimulation Value/(MPa1/2)Reference Value/(MPa1/2)Relative Error/%
C6H617.619.59.7
CH3COOC2H517.418.87.4
CS220.619.45.8
Table 2. Solubility parameter simulation value of S8 and IS (P0 = l atm, 333 K).
Substance NameSimulation Value/(MPa1/2)
S829.943
IS38.631
CS221.678
Publisher’s Note: MDPI stays neutral with regard to jurisdictional claims in published maps and institutional affiliations.

