
Development of Thin Film Microextraction with Natural Deep Eutectic Solvents as ‘Eutectosorbents’ for Preconcentration of Popular Sweeteners and Preservatives from Functional Beverages and Flavoured Waters


Abstract
:
1. Introduction
2. Results and Discussion
2.1. Synthesis of NADESs
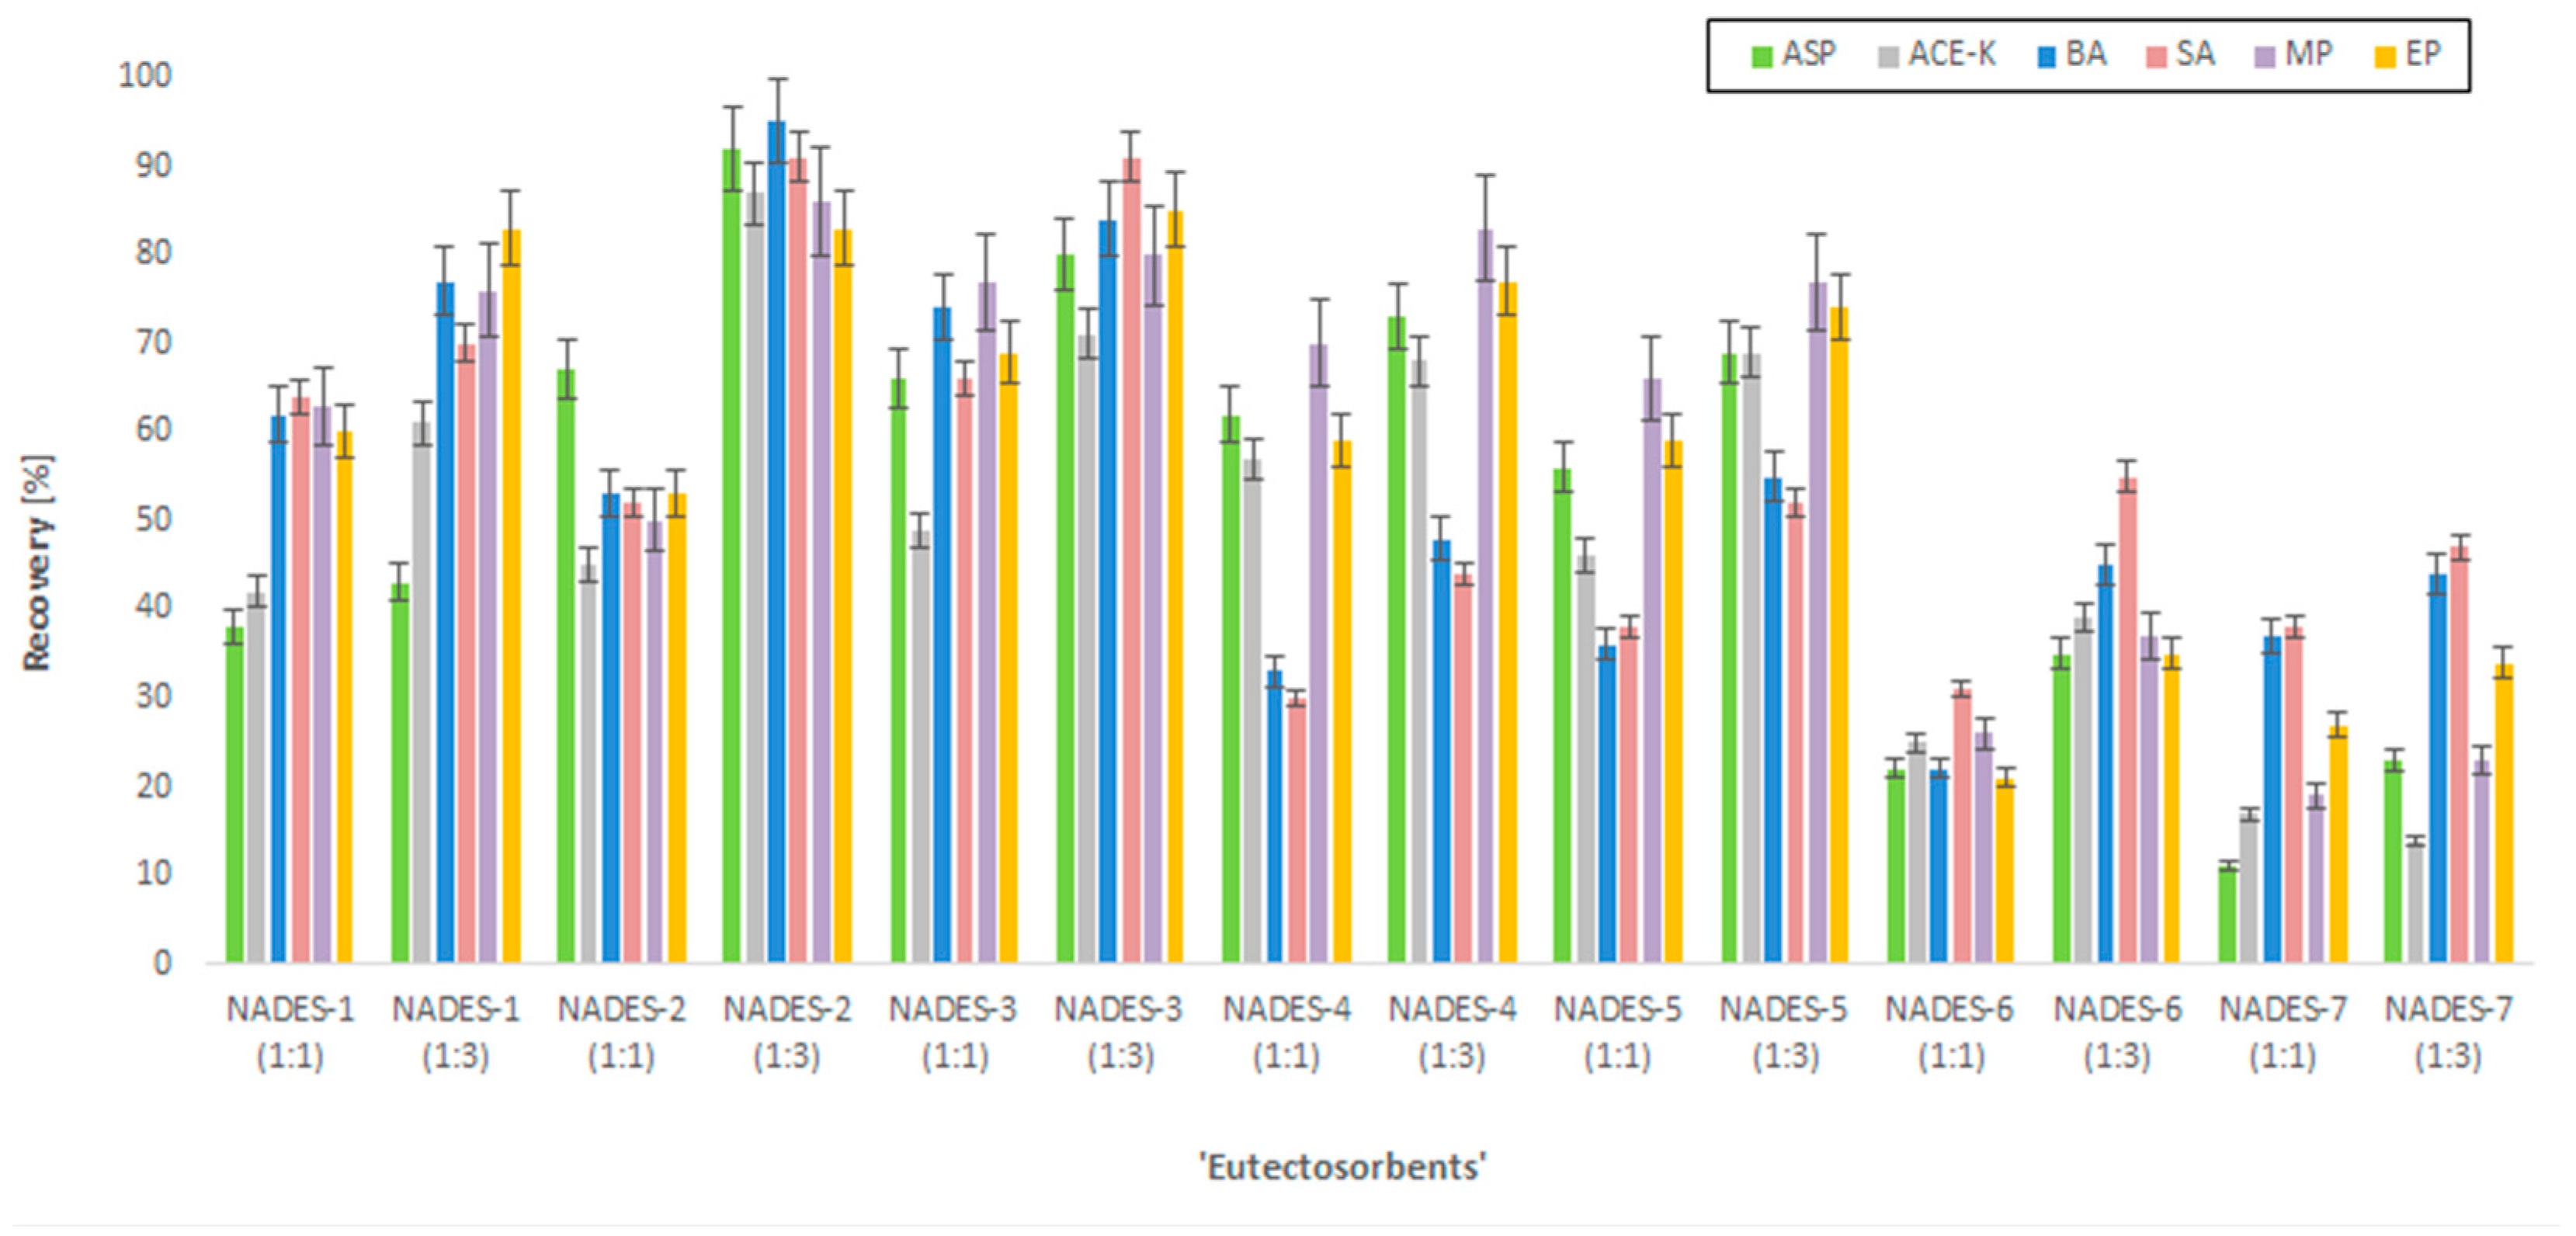
2.2. Selection of ‘Eutectosorbents’ and Desorption Solvent
2.3. Characterization of the Selected ‘Eutectosorbent’
2.3.1. SEM Images
2.3.2. Energy Dispersive X-ray Spectroscopy Analysis
2.3.3. Fourier-Transform Infrared Spectroscopy
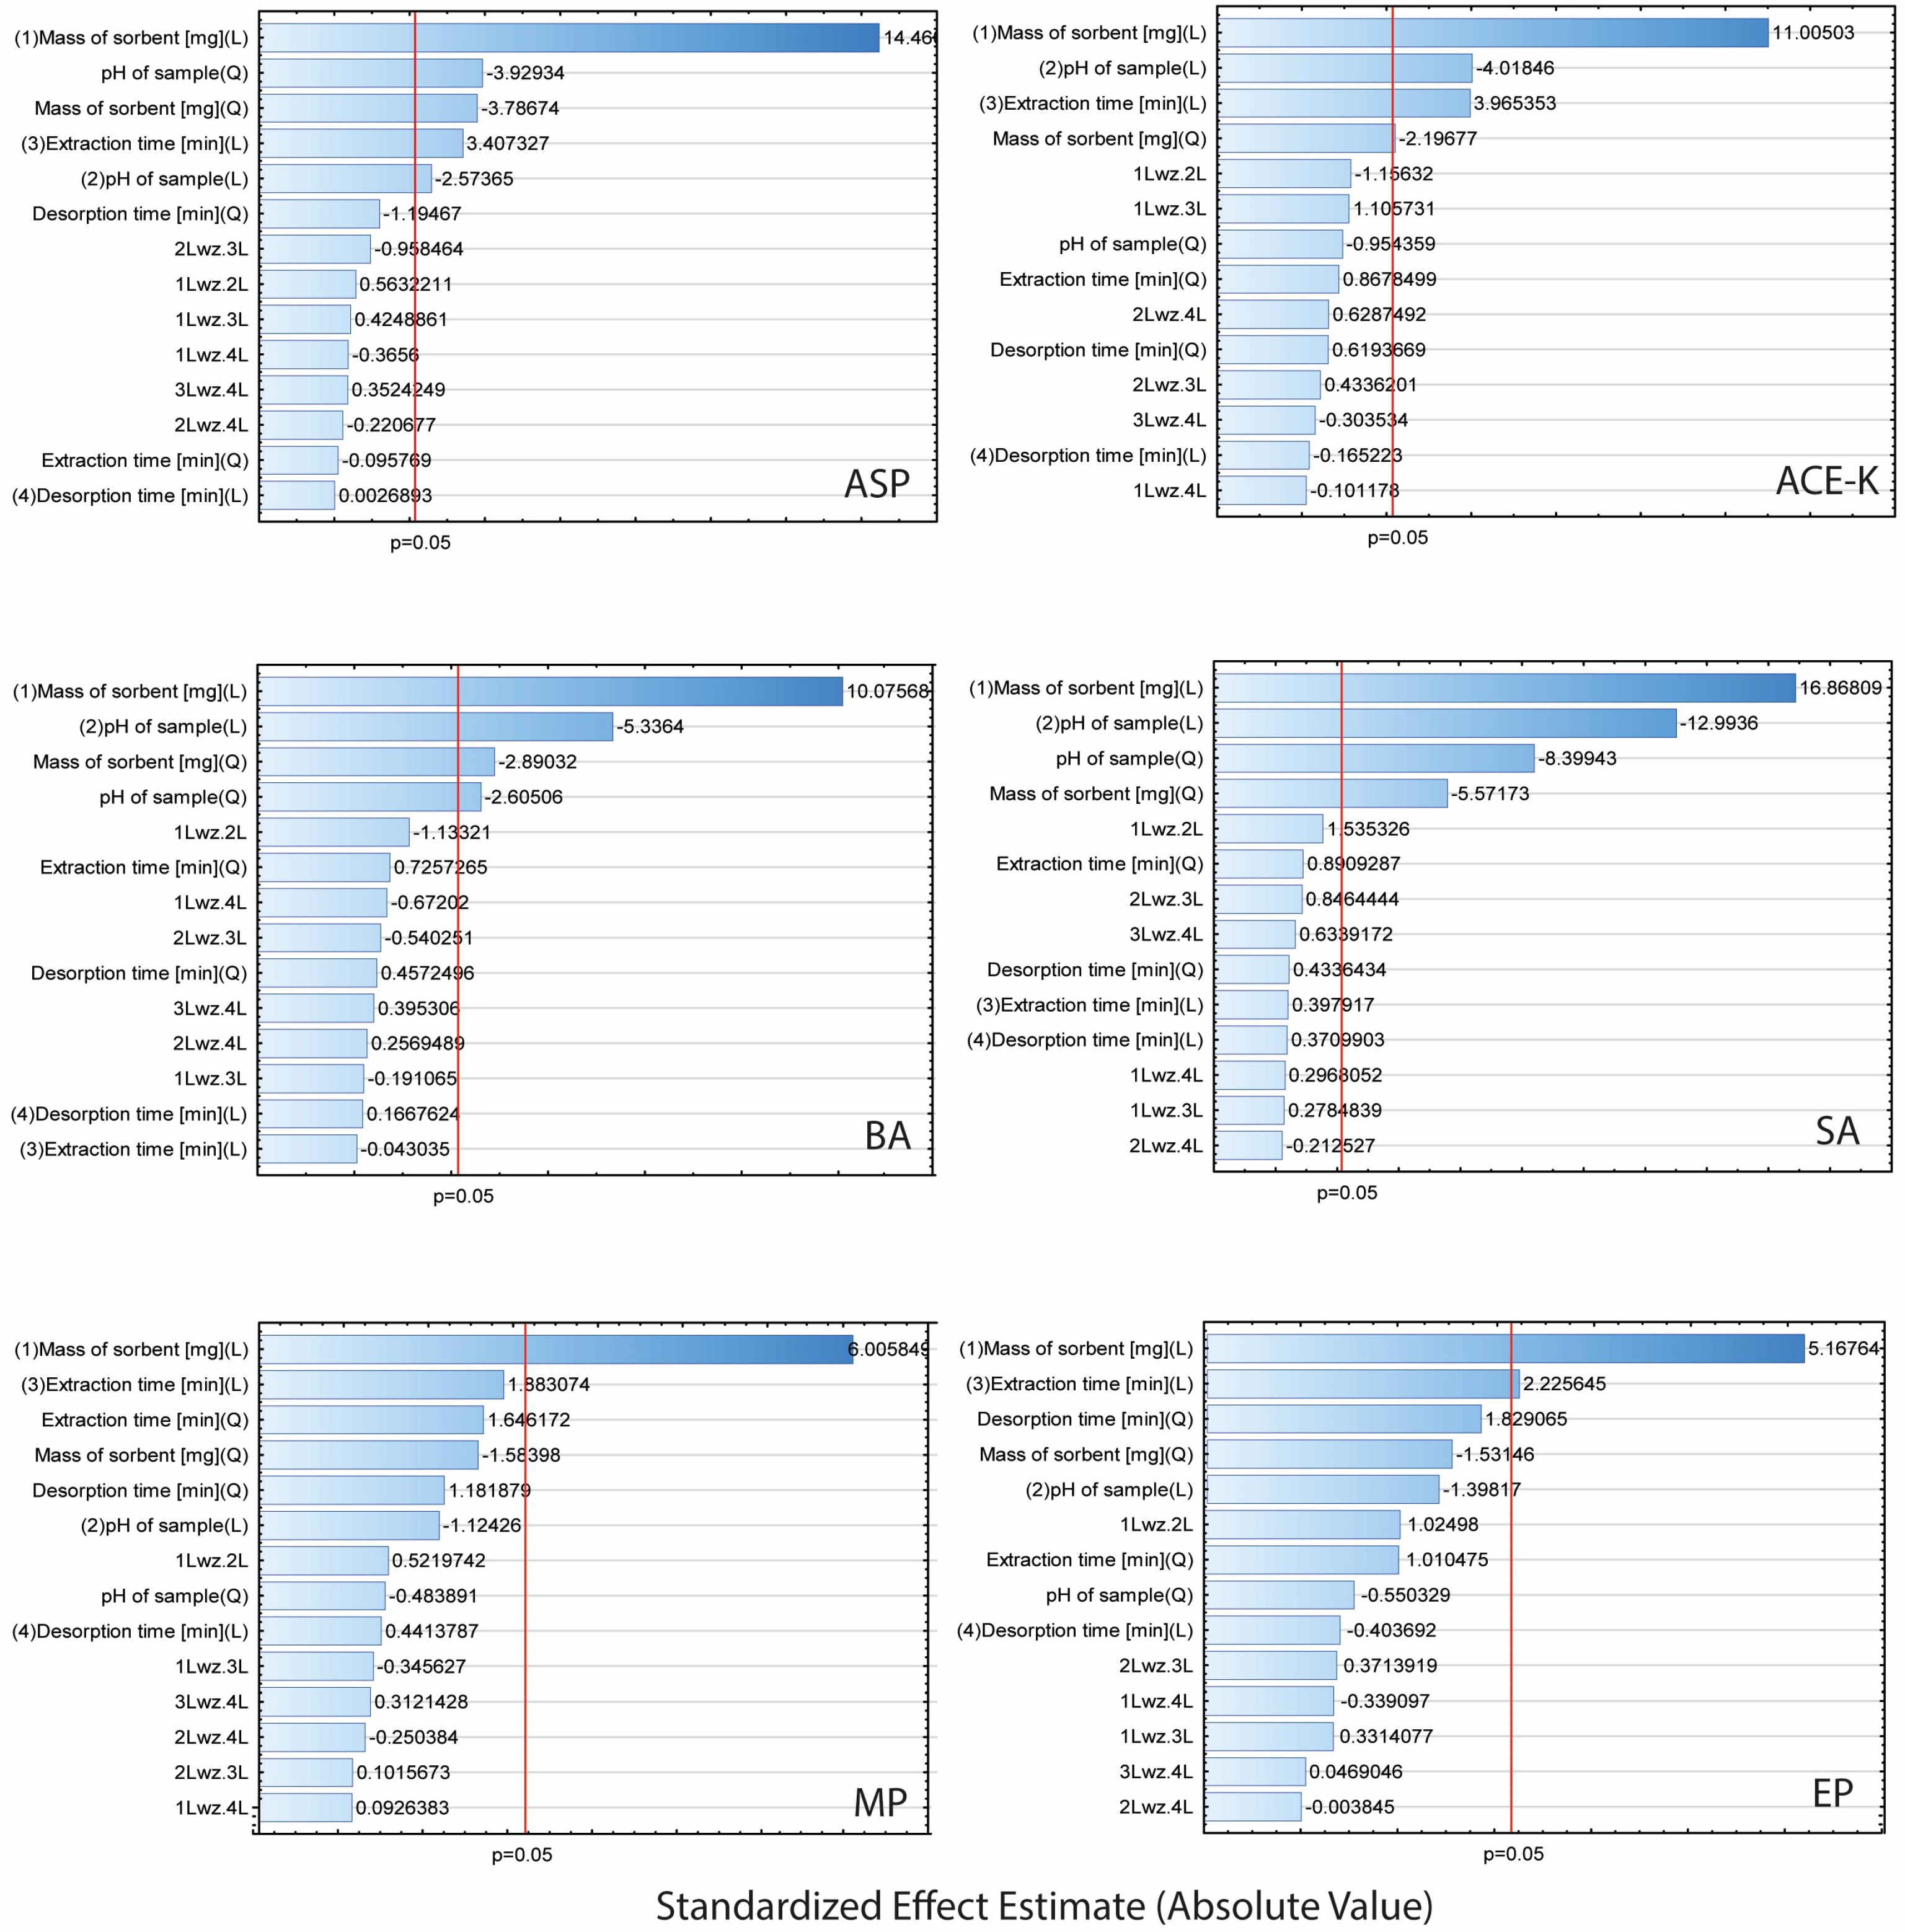
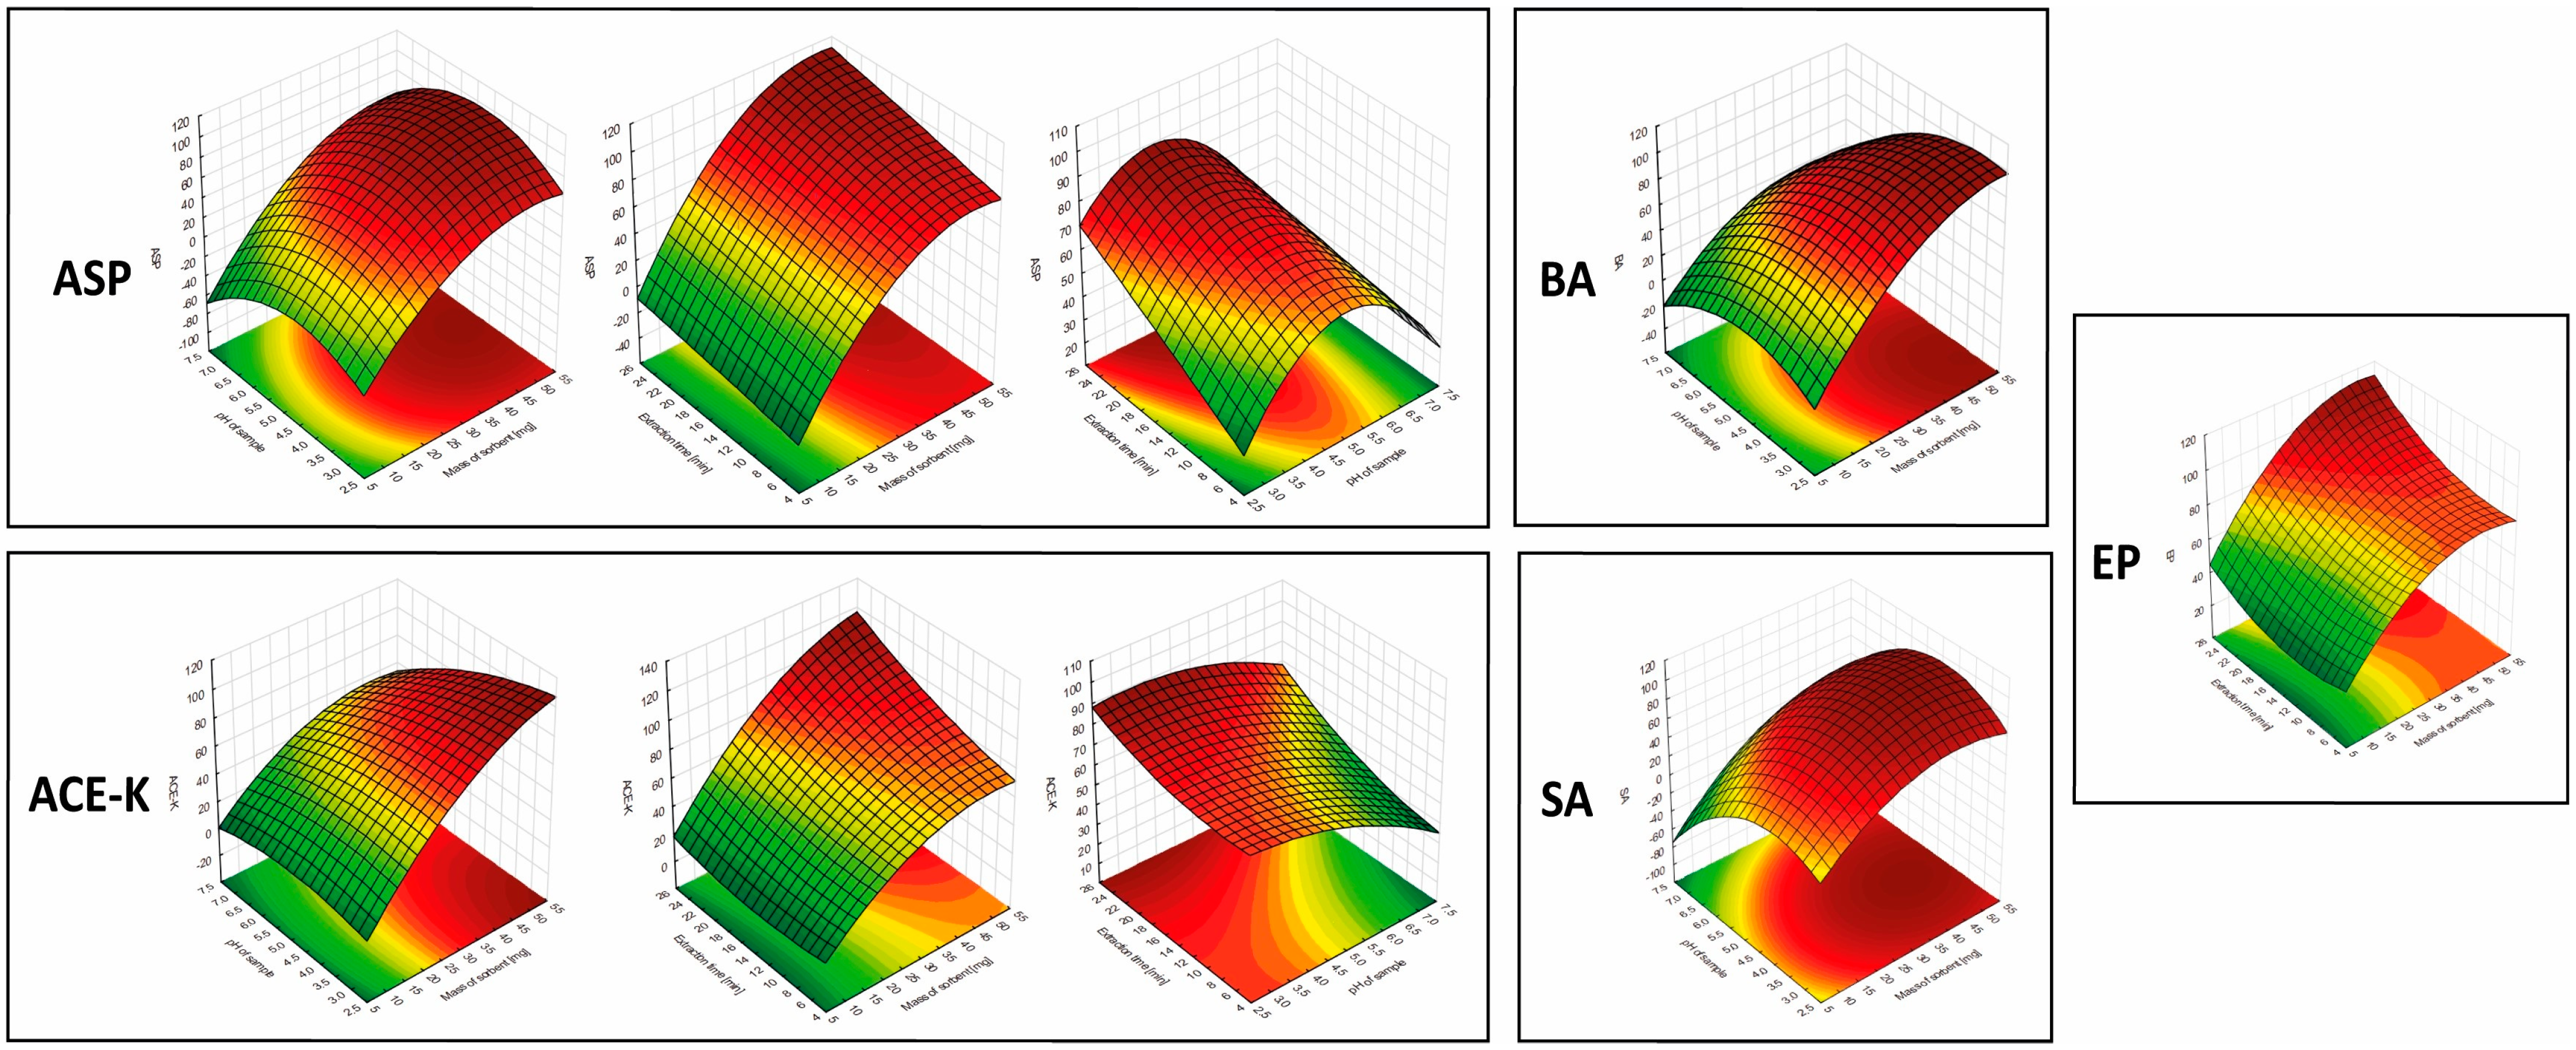
2.4. Response Surface Based on the Central Composite Design
2.5. Analytical Performance
2.6. The NADES-TFME/HPLC-UV Method on Real Samples
2.7. Reusability and Reproducibility of ‘Eutectosorbent’
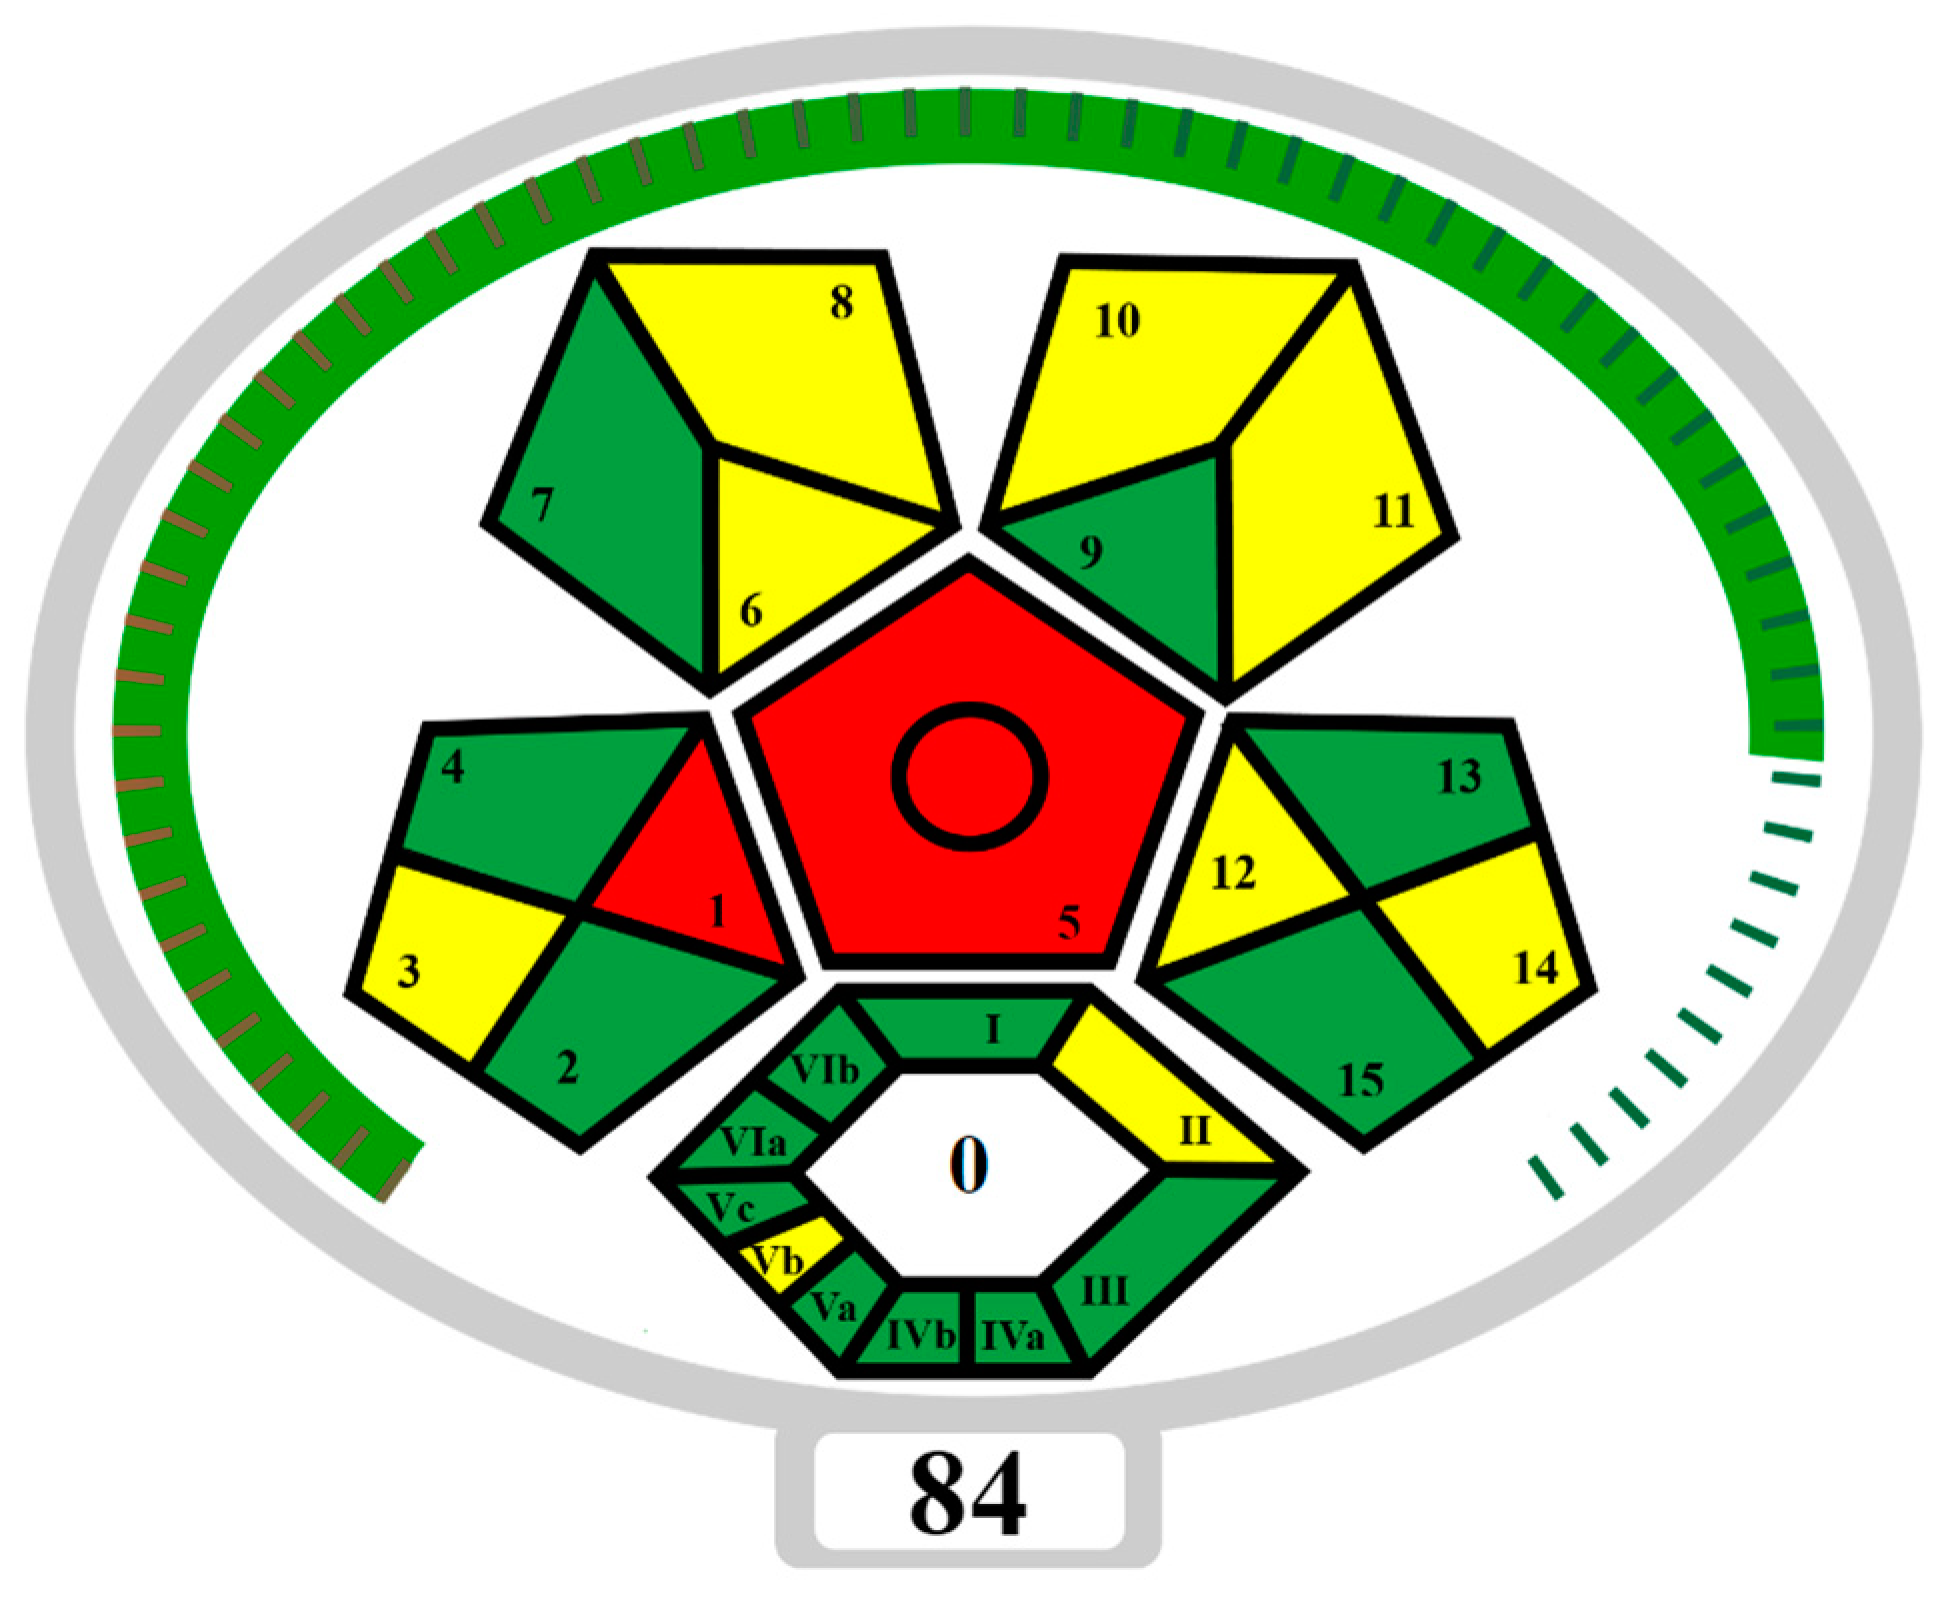
2.8. Greenness Evaluation
2.9. Comparison of Analytical Procedures to Determine Sweeteners and Preservatives
3. Materials and Methods
3.1. Reagents
3.2. Real Samples
3.3. Apparatus and Lab Equipment
3.4. Preparation of NADESs
3.5. Experimental Design
3.6. NADES-TFME Procedure
3.7. Chromatographic Conditions
4. Conclusions
Supplementary Materials
Author Contributions
Funding
Institutional Review Board Statement
Informed Consent Statement
Data Availability Statement
Conflicts of Interest
References
- Athanasiadis, V.; Chatzimitakos, T.; Kalompatsios, D.; Mantiniotou, M.; Bozinou, E.; Lalas, S.I. Determination of caffeine and elements in hypertonic, isotonic, and hypotonic beverages. Beverages 2023, 9, 56. [Google Scholar] [CrossRef]
- Chattopadhyay, S.; Raychaudhuri, U.; Chakraborty, R. Artificial sweeteners—A review. J. Food Sci. Technol. 2014, 51, 611. [Google Scholar] [CrossRef] [PubMed]
- Silva, M.M.; Lidon, F.C. Food preservatives—An overview on applications and side effects. Emirat. J. Food Agricult. 2016, 28, 366–373. [Google Scholar] [CrossRef]
- Magnuson, B.A.; Burdock, G.A.; Doull, J.; Kroes, R.M.; Marsh, G.M.; Pariza, M.W.; Spencer, P.S.; Waddell, W.J.; Walker, R.; Williams, G.M. Aspartame: A safety evaluation based on current use levels, regulations, and toxicological and epidemiological studies. Crit. Rev. Toxicol. 2007, 37, 629. [Google Scholar] [CrossRef] [PubMed]
- Shaher, S.A.A.; Mihailescu, D.F.; Amuzescu, B. Aspartame Safety as a Food Sweetener and Related Health Hazards. Nutrients 2023, 15, 3627. [Google Scholar] [CrossRef] [PubMed]
- Sezgin, B.; Arli, G.; Can, N.O. Simultaneous HPLC-DAD determination of seven intense sweeteners in foodstuffs and pharmaceuticals using a core-shell particle column. J. Food Composit. Anal. 2021, 97, 103768. [Google Scholar] [CrossRef]
- Oktavirina, V.; Prabawati, N.B.; Fathimah, R.N.; Palma, M.; Kurnia, K.A.; Darmawan, N.; Yulianto, B.; Setyaningsih, W. Analytical methods for determination of non-nutritive sweeteners in foodstuffs. Molecules 2021, 26, 3135. [Google Scholar] [CrossRef]
- Sakai, H.; Yamashita, A.; Tamura, M.; Uyama, A.; Mochizuki, N. Simultaneous determination of sweeteners in beverages by LC-MS/MS. Food Additiv. Contamin. 2015, 32, 808. [Google Scholar] [CrossRef]
- Kim, M.H.; Lee, D.Y.; Ahn, J.H. A study on the analysis of artificial sweeteners in processed foods including emulsified foods by HPLC-DAD. Anal. Sci. Technol. 2020, 33, 209. [Google Scholar]
- Henschel, J.; Hayen, H. Application of large volume injection for sensitive LC-MS/MS analysis of seven artificial sweeteners in surface waters. MethodsX 2020, 7, 101134. [Google Scholar] [CrossRef]
- Ordoñez, E.Y.; Rodil, R.; Quintana, J.B.; Cela, R. Determination of artificial sweeteners in beverages with green mobile phases and high temperature liquid chromatography-tandem mass spectrometry. Food Chem. 2015, 169, 162. [Google Scholar] [CrossRef] [PubMed]
- Mohamadi, S.; Esfandiari, Z.; Khodadadi, M.; Sadat, M.; Dehaghani, T. Simultaneous analysis of benzoic and sorbic acids in orange juice using thymol/water natural deep eutectic solvent and DLLME method followed by high performance liquid chromatography. Food Measure 2024, 18, 6285–6294. [Google Scholar] [CrossRef]
- Dinga, M.; Liub, W.; Penga, J.; Liuc, X.; Tanga, T. Simultaneous determination of seven preservatives in food by dispersive liquid-liquid microextraction coupled with gas chromatography-mass spectrometry. Food Chem. 2018, 269, 187–192. [Google Scholar] [CrossRef] [PubMed]
- Biana, Y.; Wanga, Y.; Yub, J.; Zhenga, S.; Qina, F.; Zhaoa, L. Analysis of six preservatives in beverages using hydrophilic deep eutectic solvent as disperser in dispersive liquid-liquid microextraction based on the solidification of floating organic droplet. J. Pharma. Biomed. Anal. 2021, 195, 113889. [Google Scholar] [CrossRef]
- Timofeeva, I.; Kanashina, D.; Stepanova, K.; Bulatov, A. A simple and highly-available microextraction of benzoic and sorbic acids in beverages and soy sauce samples for high performance liquid chromatography with ultraviolet detection. J. Chromatogr. A 2019, 1588, 1–7. [Google Scholar] [CrossRef]
- Zhao, J.; Hou, L.; Zhao, L.; Liu, L.; Qi, J.; Wang, L. An environment-friendly approach using deep eutectic solvent combined with liquid–liquid microextraction based on solidification of floating organic droplets for simultaneous determination of preservatives in beverages. RSC Adv. 2023, 13, 7185. [Google Scholar] [CrossRef]
- Jan, S.; Santaladchaiyakit, Y.; Burakham, R. Ultrasound-Assisted Surfactant-Enhanced Emulsification Micro-Extraction Followed by HPLC for Determination of Preservatives in Water, Beverages and Personal Care Products. J. Chromatogr. Sci. 2017, 55, 90–98. [Google Scholar] [CrossRef]
- Dong, C.; Wang, W. Headspace solid-phase microextraction applied to the simultaneous determination of sorbic and benzoic acids in beverages. Anal. Chim. Acta 2006, 562, 23–29. [Google Scholar] [CrossRef]
- Cárdenas-Soracá, D.M.; Singh, V.; Nazdrajić, E.; Vasiljević, T.; Grandy, J.J.; Pawliszyn, J. Development of thin-film solid-phase microextraction coating and method for determination of artificial sweeteners in surface waters. Talanta 2020, 211, 120714. [Google Scholar] [CrossRef]
- Ochiai, N.; Sasamoto, K.; Takino, M.; Yamashita, S.; Daishima, S.; Heiden, A.C.; Hoffmann, A. Simultaneous determination of preservatives in beverages, vinegar, aqueous sauces, and quasi-drug drinks by stir-bar sorptive extraction (SBSE) and thermal desorption GC–MS. Anal. Bioanal. Chem. 2002, 373, 56–63. [Google Scholar] [CrossRef]
- Ordónez, E.Y.; Quintana, J.B.; Rodil, R.; Cela, R. Determination of artificial sweeteners in water samples by solid-phase extraction and liquid chromatography-tandem mass spectrometry. J. Chromatogr. A 2012, 1256, 197. [Google Scholar] [CrossRef] [PubMed]
- Arthur, C.L.; Pawliszyn, J. Solid phase microextraction with thermal desorption using fused silica optical fibers. Anal. Chem. 1990, 62, 2145–2148. [Google Scholar] [CrossRef]
- Sajid, M.; Nazal, M.K.; Rutkowska, M.; Szczepańska, N.; Namieśnik, J.; Płotka-Wasylka, J. Solid phase microextraction: Apparatus, sorbent materials, and application. Crit. Rev. Anal. Chem. 2019, 49, 271–288. [Google Scholar] [CrossRef] [PubMed]
- Piri-Moghadam, H.; Alam, M.N.; Pawliszyn, J. Review of geometries and coating materials in solid phase microextraction: Opportunities, limitations, and future perspectives. Anal. Chim. Acta 2017, 984, 42–65. [Google Scholar] [CrossRef]
- Reyes-Garces, N.; Gionfriddo, E.; Gomez-Rıos, G.A.; Alam, M.N.; Boyacı, E.; Bojko, B.; Singh, V.; Grandy, J.; Pawliszyn, J. Advances in solid phase microextraction and perspective on future directions. Anal. Chem. 2018, 90, 302–360. [Google Scholar] [CrossRef]
- Bruheim, I.; Liu, X.; Pawliszyn, J. Thin-film microextraction. Anal. Chem. 2003, 75, 1002–1010. [Google Scholar] [CrossRef]
- Olcer, Y.A.; Tascon, M.; Eroglu, A.E.; Boyacı, E. Thin film microextraction: Towards faster and more sensitive microextraction. Trends Anal. Chem. 2019, 113, 93–101. [Google Scholar] [CrossRef]
- Emmons, R.V.; Tajali, R.; Gionfriddo, E. Development, Optimization and Applications of Thin Film Solid Phase Microextraction (TF-SPME) Devices for Thermal Desorption: A Comprehensive Review. Separations 2019, 6, 39. [Google Scholar] [CrossRef]
- Abbott, A.P.; Capper, G.; Davies, D.L.; Rasheed, R.K.; Tambyrajah, V. Novel solvent properties of choline chloride urea mixtures. Chem. Commun. 2003, 70–71. [Google Scholar] [CrossRef]
- Hansen, B.B.; Spittle, S.; Chen, B.; Poe, D.; Zhang, Y.; Klein, J.M.; Horton, A.; Adhikari, L.; Zelovich, T.; Doherty, B.W.; et al. Deep eutectic solvents: A review of fundamentals and applications. Chem. Rev. 2020, 121, 1232–1285. [Google Scholar] [CrossRef]
- El Achkar, T.; Greige-Gerges, H.; Fourmentin, S. Basics and properties of deep eutectic solvents: A review. Environ. Chem. Lett. 2021, 19, 3397–3408. [Google Scholar] [CrossRef]
- Andruch, V.; Kalyniukova, A.; Płotka-Wasylka, J.; Jatkowska, N.; Snigur, D.; Zaruba, S.; Płatkiewicz, J.; Zgoła-Grześkowiak, A.; Werner, J. Application of deep eutectic solvents in sample preparation for analysis (update 2017–2022). Part A: Liquid phase microextraction. Microchem. J. 2023, 189, 108509. [Google Scholar] [CrossRef]
- Werner, J.; Zgoła-Grześkowiak, A.; Płatkiewicz, J.; Płotka-Wasylka, J.; Jatkowska, N.; Kalyniukova, A.; Zaruba, S.; Andruch, V. Deep eutectic solvents in analytical sample preconcentration Part B: Solid phase (micro)extraction. Microchem. J. 2023, 191, 108898. [Google Scholar] [CrossRef]
- Werner, J.; Świtek, J.; Frankowski, R.; Zgoła-Grześkowiak, A. Development of an deep eutectic solvent based thin film solid phase microextraction technique for the preconcentration of chlorophenoxy acid herbicides in drainage ditches waters using central composite design. Microchem. J. 2022, 183, 108101. [Google Scholar] [CrossRef]
- Werner, J.; Grześkowiak, T.; Zgoła-Grześkowiak, A.; Frankowski, R.; Płatkiewicz, J. Hybrid materials based on deep eutectic solvents for the preconcentration of formaldehyde by SPME in coffee beverages. Talanta 2024, 268, 125309. [Google Scholar] [CrossRef]
- Werner, J.; Grześkowiak, T.; Zgoła-Grześkowiak, A. A polydimethylsiloxane/deep eutectic solvent sol-gel thin film sorbent and its application to solid-phase microextraction of parabens. Anal. Chim. Acta 2022, 1202, 339666. [Google Scholar] [CrossRef]
- Chabowska, A.; Werner, J.; Zgoła-Grześkowiak, A.; Płatkiewicz, J.; Frankowski, R.; Płotka-Wasylka, J. Development of thin film SPME sorbents based on deep eutectic solvents and their application for isolation and preconcentration of endocrine-disrupting compounds leaching from diapers to urine. Microchem. J. 2024, 199, 110023. [Google Scholar] [CrossRef]
- Choi, Y.H.; van Spronsen, J.; Dai, Y.; Verberne, M.; Hollmann, F.; Arends, I.W.C.E.; Witkamp, G.J.; Verpoorte, R. Are Natural Deep Eutectic Solvents the Missing Link in Understanding Cellular Metabolism and Physiology? Plant Physiol. 2011, 156, 1701–1705. [Google Scholar] [CrossRef]
- Cannavacciuolo, C.; Pagliari, S.; Frigerio, J.; Giustra, C.M.; Labra, M.; Campone, L. Natural deep eutectic solvents (NADESs) combined with sustainable extraction techniques: A review of the Green Chemistry approach in food analysis. Foods 2023, 12, 56. [Google Scholar] [CrossRef]
- Wu, K.; Ren, J.; Wang, Q.; Nuerjiang, M.; Xia, X.; Bian, C. Research Progress on the Preparation and Action Mechanism of Natural Deep Eutectic Solvents and Their Application in Food. Foods 2022, 11, 3528. [Google Scholar] [CrossRef]
- Hibbert, D.B. Experimental design in chromatography: A tutorial review. J. Chromatogr. B 2012, 910, 2–13. [Google Scholar] [CrossRef] [PubMed]
- Marrubini, G.; Dugheri, S.; Cappelli, G.; Arcangeli, G.; Mucci, N.; Appelblad, P.; Melzi, C.; Speltini, A. Experimental designs for solid-phase microextraction method development in bioanalysis: A review. Anal. Chim. Acta 2020, 1119, 77–100. [Google Scholar] [CrossRef] [PubMed]
- Mansour, F.R.; Omer, K.M.; Płotka-Wasylka, J. A total scoring system and software for complex modified GAPI (ComplexMoGAPI) application in the assessment of method greenness. Green Anal. Chem. 2024, 10, 100126. [Google Scholar] [CrossRef]
- EFSA ANS Panel (EFSA Panel on Food Additives and Nutrient Sources Added to Food); Aguilar, F.; Crebelli, R.; Di Domenico, A.; Dusemund, B.; Frutos, M.J.; Galtier, P.; Gott, D.; Gundert-Remy, U.; Lambré, C.; et al. Scientific Opinion on the re-evaluation of benzoic acid (E 210), sodium benzoate (E 211), potassium benzoate (E 212) and calcium benzoate (E 213) as food additives. EFSA J. 2016, 14, 1–110. [Google Scholar]
- EFSA FAF Panel (EFSA Panel on Food Additives and Flavourings); Younes, M.; Aqulina, G.; Castle, L.; Engel, K.H.; Fowler, P.; Fernandez, M.J.; Furst, P.; Gurtler, R.; Gunder-Remy, U.; et al. Scientific Opinion on the follow-up of the re-evaluation of sorbic acid (E 200) and potassium sorbate (E 202) as food additives. EFSA J. 2019, 17, 1–21. [Google Scholar]
- Angelov, T.; Vlasenko, A.; Tashkov, W. HPLC Determination of pKa of parabens and investigation on their lipophilicity parameters. J. Liq. Chromatogr. Relat. Technol. 2007, 31, 188–197. [Google Scholar] [CrossRef]


| Symbol of NADES | Structure of HBA | Structure of HBD | HBA/HBD (Molar Ratio) | Solidification Point |
|---|---|---|---|---|
| NADES-1 |  acetylcholine chloride (AcChCl) | 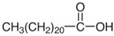 docosanoic acid (DCA) | 1:1 1:3 | 102 °C 95 °C |
| NADES-2 | 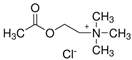 acetylcholine chloride (AcChCl) |  1-docosanol (DcOH) | 1:1 1:3 | 111 °C 103 °C |
| NADES-3 | 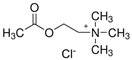 acetylcholine chloride (AcChCl) |  1-eicosanol (EiOH) | 1:1 1:3 | 108 °C 101 °C |
| NADES-4 |  betaine chloride (BeCl) | 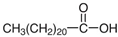 docosanoic acid (DCA) | 1:1 1:3 | 122 °C 109 °C |
| NADES-5 |  betaine chloride (BeCl) |  1-eicosanol (EiOH) | 1:1 1:3 | 105 °C 97 °C |
| NADES-6 |  glucose (GLU) |  docosanoic acid (DCA) | 1:1 1:3 | 93 °C 89 °C |
| NADES-7 |  glucose (GLU) |  1-docosanol (DcOH) | 1:1 1:3 | 90 °C 86 °C |
| Factor | Symbol | Levels of Factors | ||||
|---|---|---|---|---|---|---|
| Low Axial (−α) | Low Factorial (−1) | Center (0) | High Factorial (+1) | High Axial (+α) | ||
| Mass of sorbent [mg] | A | 10 | 20 | 30 | 40 | 50 |
| pH of sample | B | 3 | 4 | 5 | 6 | 7 |
| Extraction time [min] | C | 5 | 10 | 15 | 20 | 25 |
| Desorption time [min] | D | 5 | 10 | 15 | 20 | 25 |
| Parameter | ASP | ACE-K | BA | SA | MP | EP | |
|---|---|---|---|---|---|---|---|
| Linear range [µg mL−1] | 0.1–100 | 0.1–100 | 0.1–100 | 0.1–100 | 0.05–50 | 0.05–50 | |
| Determination coefficient (R2) | 0.9990 | 0.9993 | 0.9992 | 0.9991 | 0.9994 | 0.9995 | |
| LOD [µg mL−1] | 0.022 | 0.020 | 0.018 | 0.026 | 0.013 | 0.011 | |
| LOQ [µg mL−1] | 0.073 | 0.066 | 0.059 | 0.086 | 0.043 | 0.036 | |
| Precision RSD [%] (n = 4) | intra-day | 3.8 | 4.2 | 5.9 | 5.7 | 3.9 | 6.1 |
| inter-day | 5.7 | 6.6 | 7.4 | 6.9 | 7.2 | 6.5 | |
| Extraction recovery [%] | 85 | 82 | 89 | 93 | 92 | 96 | |
| Enrichment factor | 59 | 58 | 62 | 64 | 60 | 62 | |
| Sample | Analytes | Declared on the Label | Initial, µg mL−1 | Added 5 µg mL−1 | Added 50 µg mL−1 | ||||
|---|---|---|---|---|---|---|---|---|---|
| Measured | RSD [%] (n = 4) | Recovery [%] | Measured | RSD [%] (n = 4) | Recovery [%] | ||||
| isotonic drink type “light” | ASP | YES | 127.41 ± 5.15 | 131.62 ± 6.37 | 4.8 | 84 | 175.74 ± 7.08 | 4.0 | 97 |
| ACE-K | YES | 229.86 ± 9.06 | 234.53 ± 10.28 | 4.4 | 93 | 275.31 ± 9.73 | 3.5 | 91 | |
| BA | No | nd | 4.69 ± 0.39 | 8.3 | 94 | 46.44 ± 3.01 | 6.5 | 93 | |
| SA | No | nd | 4.55 ± 0.32 | 7.0 | 91 | 44.15 ± 3.26 | 7.4 | 88 | |
| MP | No | nd | 4.50 ± 0.34 | 7.6 | 90 | 44.12 ± 3.83 | 8.7 | 88 | |
| EP | No | nd | 4.58 ± 0.40 | 8.7 | 92 | 42.71 ± 4.17 | 7.4 | 86 | |
| isotonic drink with multi-fruit flavour | ASP | YES | 50.44 ± 3.87 | 54.60 ± 4.21 | 7.7 | 86 | 95.39 ± 5.52 | 5.8 | 90 |
| ACE-K | YES | 77.86 ± 3.74 | 82.45 ± 4.06 | 4.9 | 92 | 121.61 ± 5.58 | 4.6 | 88 | |
| BA | YES | 131.22 ± 7.01 | 135.74 ± 7.74 | 5.7 | 90 | 177.44 ± 8.08 | 4.5 | 92 | |
| SA | No | nd | 4.45 ± 0.38 | 8.5 | 89 | 46.31 ± 2.73 | 5.9 | 93 | |
| MP | No | nd | 4.69 ± 0.37 | 7.9 | 94 | 44.82 ± 3.87 | 8.6 | 90 | |
| EP | No | nd | 4.30 ± 0.32 | 7.4 | 86 | 43.19 ± 3.61 | 8.4 | 87 | |
| energy drink with vitamins | ASP | YES | 167.09 ± 3.55 | 171.61 ± 6.26 | 3.7 | 90 | 211.98 ± 7.84 | 3.7 | 90 |
| ACE-K | YES | 202.96 ± 7.29 | 207.29 ± 8.69 | 4.2 | 87 | 249.34 ± 8.26 | 3.3 | 93 | |
| BA | No | nd | 4.61 ± 0.39 | 8.5 | 92 | 46.24 ± 3.01 | 6.7 | 93 | |
| SA | YES | 119.41 ± 5.52 | 123.65 ± 7.33 | 5.9 | 85 | 164.98 ± 9.73 | 5.9 | 91 | |
| MP | No | nd | 4.59 ± 0.34 | 7.4 | 92 | 47.77 ± 2.57 | 5.4 | 96 | |
| EP | No | nd | 4.56 ± 0.26 | 5.7 | 91 | 44.71 ± 3.21 | 7.2 | 89 | |
| energy drink with ginseng | ASP | No | nd | 4.45 ± 0.34 | 7.6 | 89 | 45.79 ± 2.82 | 6.1 | 92 |
| ACE-K | YES | 250.13 ± 8.07 | 254.66 ± 9.35 | 3.7 | 91 | 295.53 ± 10.07 | 3.4 | 91 | |
| BA | YES | 128.95 ± 6.90 | 133.57 ± 7.27 | 5.4 | 92 | 174.31 ± 7.73 | 4.4 | 90 | |
| SA | No | nd | 4.71 ± 0.32 | 6.8 | 94 | 43.77 ± 3.84 | 8.7 | 88 | |
| MP | No | nd | 4.58 ± 0.39 | 8.5 | 92 | 42.86 ± 2.97 | 6.9 | 86 | |
| EP | No | nd | 4.57 ± 0.33 | 7.2 | 92 | 44.74 ± 3.58 | 8.0 | 90 | |
| lemon flavoured water, type “light” | ASP | Yes | 80.77 ± 4.98 | 84.99 ± 5.88 | 6.9 | 84 | 125.92 ± 8.33 | 6.6 | 90 |
| ACE-K | No | nd | 4.70 ± 0.37 | 7.9 | 94 | 46.56 ± 4.01 | 8.6 | 93 | |
| BA | No | nd | 4.64 ± 0.33 | 7.1 | 93 | 45.44 ± 3.28 | 7.2 | 91 | |
| SA | No | nd | 4.35 ± 0.38 | 8.6 | 87 | 47.31 ± 2.73 | 5.8 | 95 | |
| MP | No | nd | 4.37 ± 0.30 | 6.9 | 87 | 44.09 ± 3.01 | 6.8 | 88 | |
| EP | No | nd | 4.32 ± 0.24 | 5.5 | 86 | 45.69 ± 3.86 | 8.5 | 91 | |
| lemon flavoured water | ASP | No | nd | 4.82 ± 0.38 | 7.9 | 96 | 43.42 ± 2.33 | 5.4 | 87 |
| ACEK | No | nd | 4.43 ± 0.26 | 5.8 | 89 | 46.56 ± 3.41 | 7.3 | 93 | |
| BA | Yes | 95.71 ± 7.08 | 100.08 ± 7.37 | 7.4 | 87 | 140.44 ± 7.04 | 5.0 | 89 | |
| SA | No | nd | 4.66 ± 0.22 | 4.7 | 93 | 44.35 ± 3.43 | 7.7 | 89 | |
| MP | No | nd | 4.39 ± 0.31 | 7.1 | 88 | 43.68 ± 2.94 | 6.7 | 87 | |
| EP | No | nd | 4.26 ± 0.35 | 8.2 | 85 | 45.55 ± 3.17 | 7.0 | 91 | |
| Analytes | Samples | Extraction Medium | Extraction Technique | Detection | LOD [µg⋅L−1] | RSD [%] | Ref. |
|---|---|---|---|---|---|---|---|
| BA, SA, MP, EP, PP, BP | food | acetone/ TCM | DLLME | GC-MS | 0.15–0.20 * | <5.0 | [13] |
| BA, SA, MP, EP, PP, BP | beverages | 1-decanol | DLLME-SFO | HPLC-DAD | 0.02–0.05 | <5.0 | [14] |
| SA, BA | beverages, soy sauces | menthol | AA-DLLME-SFOD | HPLC-UV | 0.02–0.03 ** | 4.0–8.0 3.0–6.0 | [15] |
| MP, EP, PP, iPP, iBP | beverages | TBACl:OCA | LLME- SFOD | HPLC-UV | 0.15–0.20 ** | <6.88 | [16] |
| BA, MP, EP, PP, BP | waters, beverages, personal care products | 1-octanol | UASEME | HPLC-UV | 0.3–10 | <7.0 | [17] |
| SA, BA | beverages | PDMS/DVB | HS-SPME | GC-FID | 5.8–11.4 | <8.6 | [18] |
| ACE-K, SAC, CYC, ASP, SUC, NHDC | environmental waters | HLB-WAX | TF-SPME | UPLC-MS/MS | 0.004–0.05 | <18.3 | [19] |
| BA, SA, EP, PP, iPP, BP, iBP | beverages, vinegar, quasi-drug drinks | PDMS | SBSE | TD-GC/MS | 0.015–3.3 ** | 0.86–6.0 | [20] |
| ACE-K, SAC, CYC, ASP, SUC, NHDC | environmental waters | Oasis HLB | SPE | LC-MS/MS | - | <10.0 | [21] |
| ACE-K, ASP, BA, SA, MP, PP | functional beverages, flavoured waters | NADES (AcChCl:DcOH) (1:3) | TFME | HPLC-UV | 0.01–0.03 ** | <7.4 | this study |
Disclaimer/Publisher’s Note: The statements, opinions and data contained in all publications are solely those of the individual author(s) and contributor(s) and not of MDPI and/or the editor(s). MDPI and/or the editor(s) disclaim responsibility for any injury to people or property resulting from any ideas, methods, instructions or products referred to in the content. |
© 2024 by the authors. Licensee MDPI, Basel, Switzerland. This article is an open access article distributed under the terms and conditions of the Creative Commons Attribution (CC BY) license (https://creativecommons.org/licenses/by/4.0/).
Share and Cite
Werner, J.; Mysiak, D. Development of Thin Film Microextraction with Natural Deep Eutectic Solvents as ‘Eutectosorbents’ for Preconcentration of Popular Sweeteners and Preservatives from Functional Beverages and Flavoured Waters. Molecules 2024, 29, 4573. https://doi.org/10.3390/molecules29194573
Werner J, Mysiak D. Development of Thin Film Microextraction with Natural Deep Eutectic Solvents as ‘Eutectosorbents’ for Preconcentration of Popular Sweeteners and Preservatives from Functional Beverages and Flavoured Waters. Molecules. 2024; 29(19):4573. https://doi.org/10.3390/molecules29194573
Chicago/Turabian StyleWerner, Justyna, and Daria Mysiak. 2024. "Development of Thin Film Microextraction with Natural Deep Eutectic Solvents as ‘Eutectosorbents’ for Preconcentration of Popular Sweeteners and Preservatives from Functional Beverages and Flavoured Waters" Molecules 29, no. 19: 4573. https://doi.org/10.3390/molecules29194573