Serum Metallothioneins in Childhood Tumours — A Potential Prognostic Marker

Abstract
:1. Introduction
2. Results
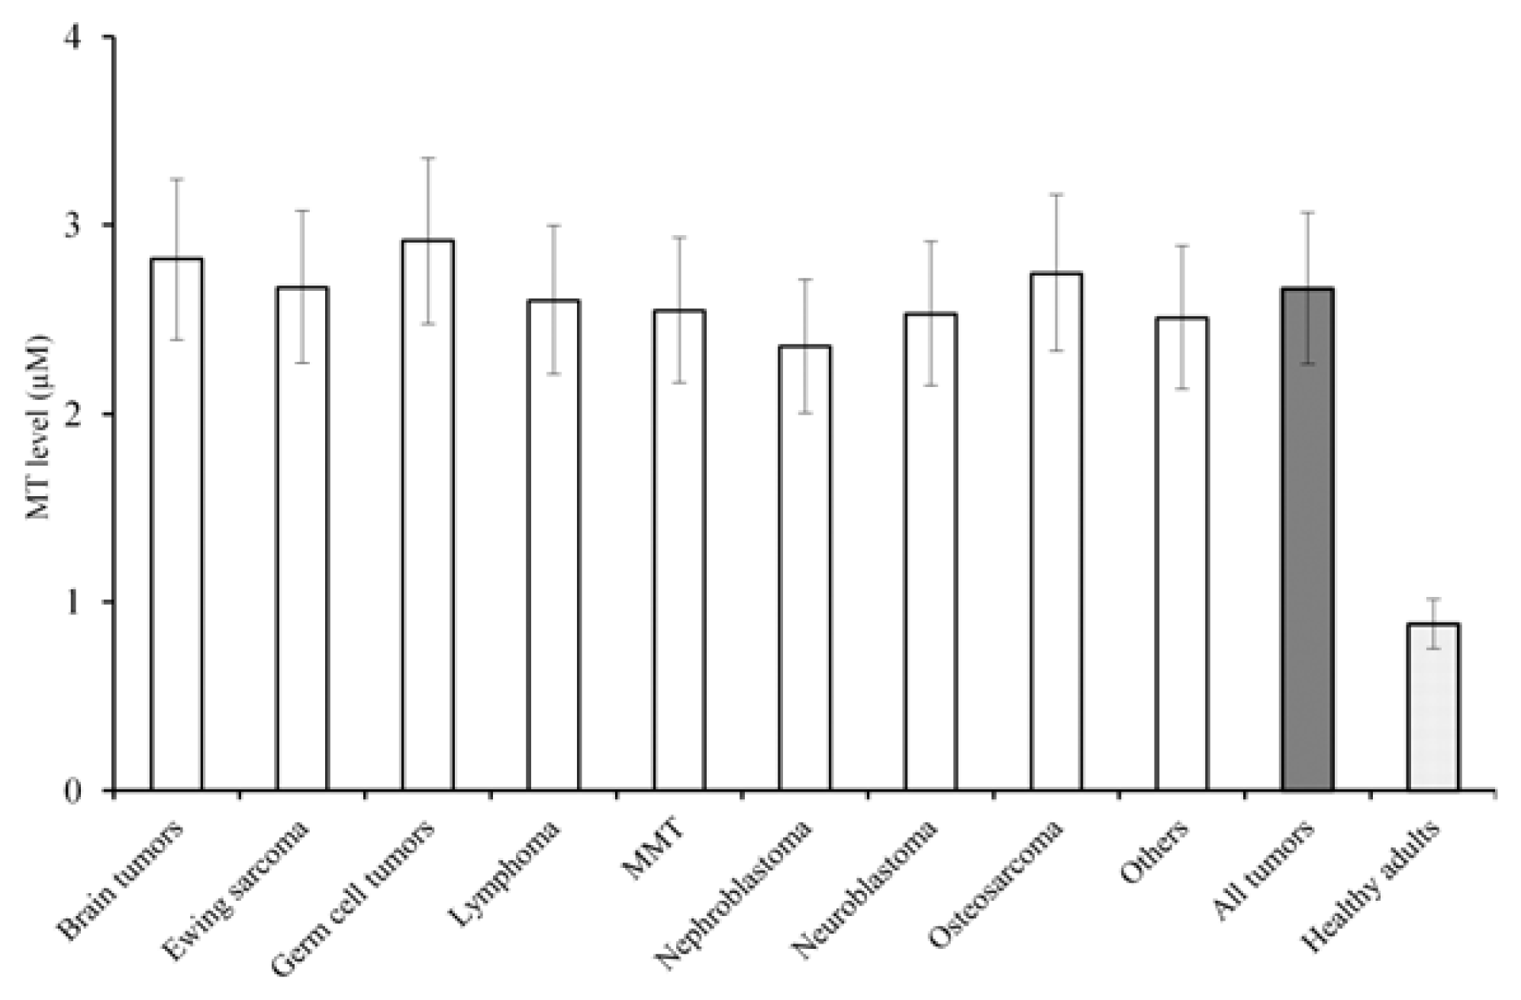
2.1. MT in Serum
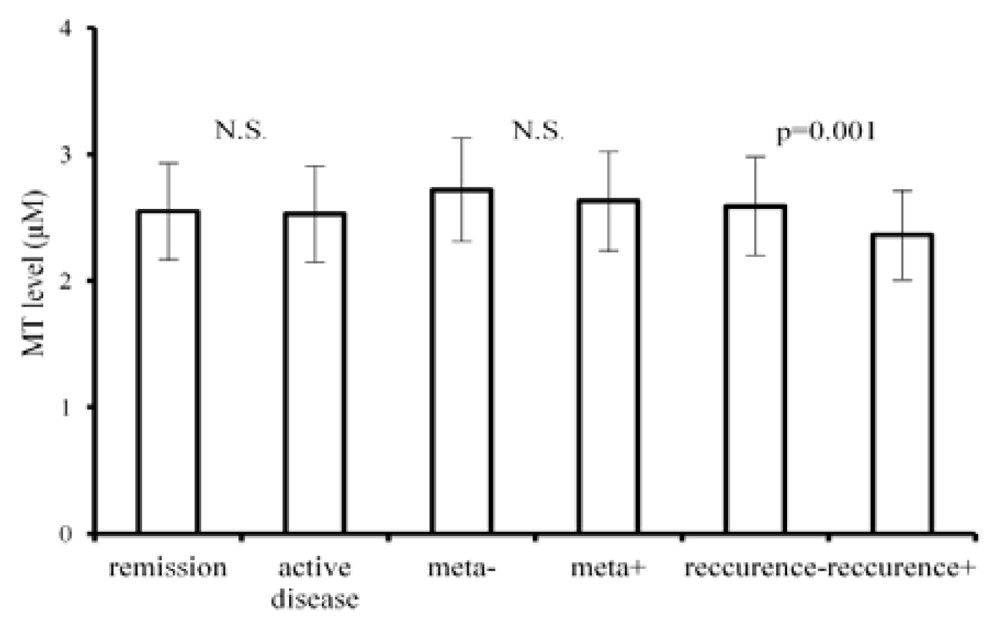
2.2. MT Relationship to Course of the Disease
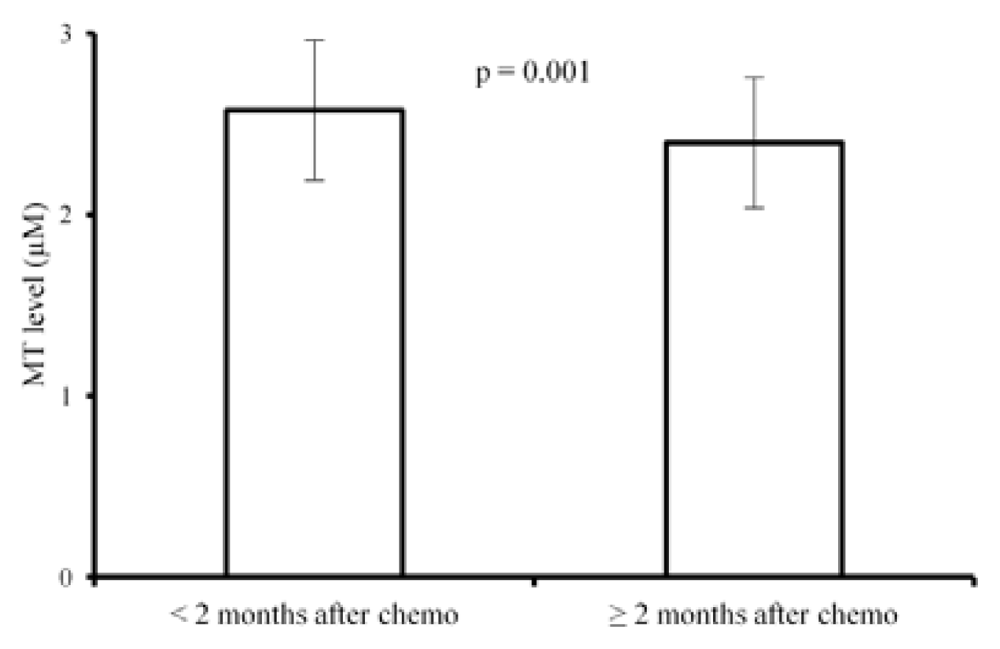
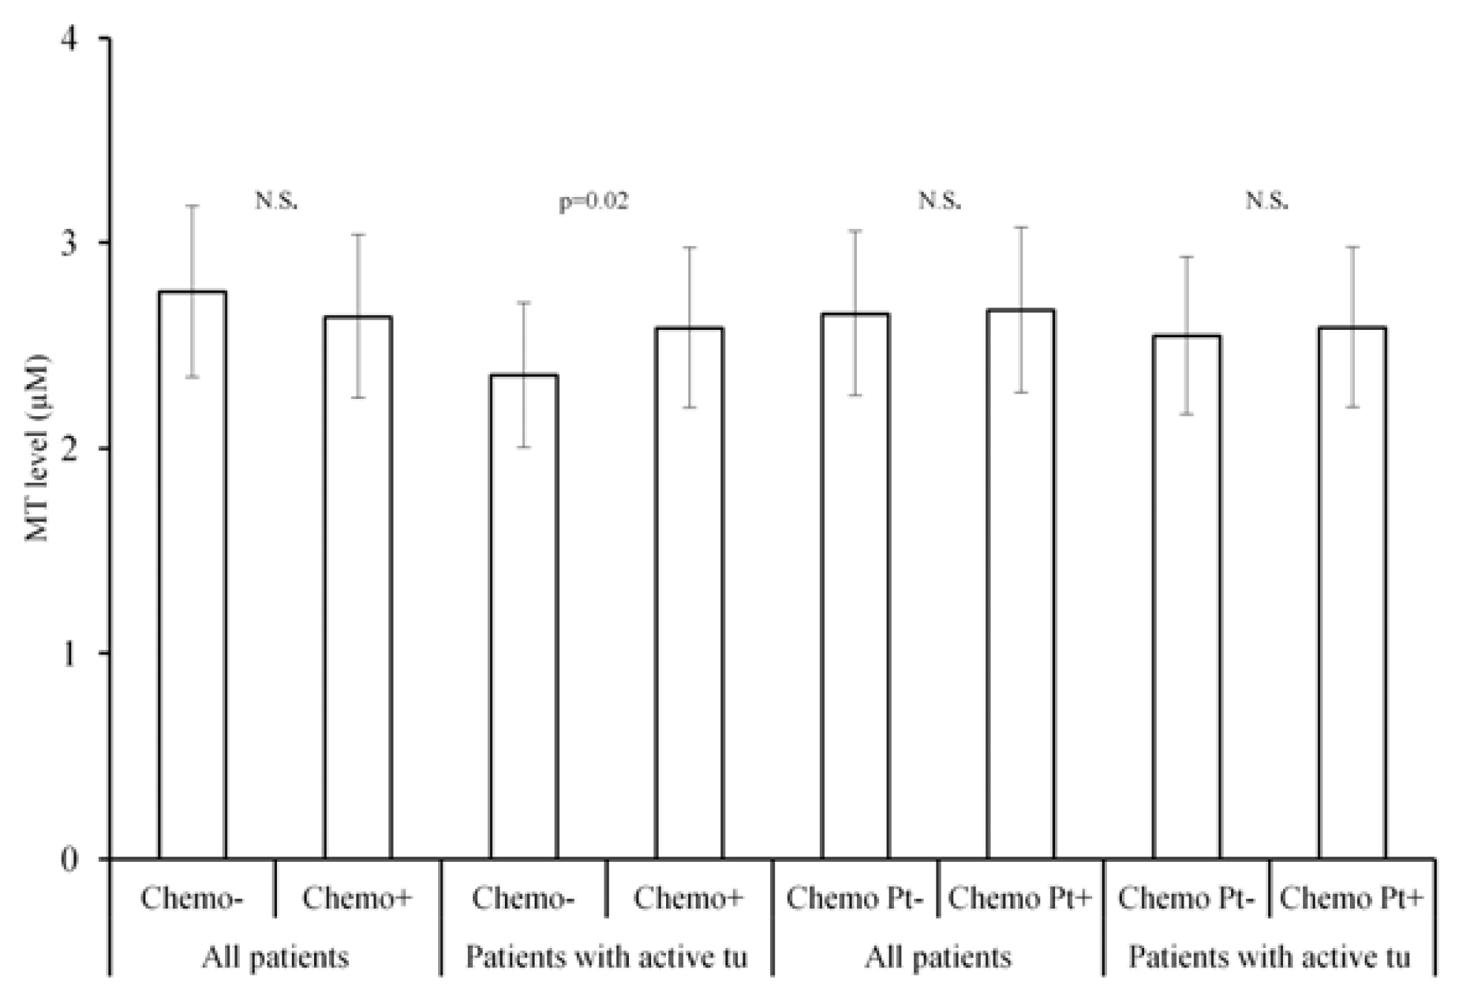
2.3. MT Levels and Chemotherapy
2.4. Correlation of MT Levels with Other Biochemical Parameters
3. Discussion
4. Experimental Section
4.1. Patients
4.2. Determination of Metallothioneins
4.3. Statistical Analysis
5. Conclusions
Acknowledgments
Conflict of Interest
References
- Eckschlager, T.; Adam, V.; Hrabeta, J.; Figova, K.; Kizek, R. Metallothioneins and cancer. Curr. Protein Pept. Sci 2009, 10, 360–375. [Google Scholar]
- Simpkins, C.O. Metallothionein in human disease. Cell. Mol. Biol 2000, 46, 465–488. [Google Scholar]
- Theocharis, S.E.; Margeli, A.P.; Klijanienko, J.T.; Kouraklis, G.P. Metallothionein expression in human neoplasia. Histopathology 2004, 45, 103–118. [Google Scholar]
- Choudhuri, S.; Kramer, K.K.; Berman, N.E.; Dalton, T.P.; Andrews, G.K.; Klaassen, C.D. Constitutive expression of metallothionein genes in mouse brain. Toxicol. Appl. Pharmacol 1995, 131, 144–154. [Google Scholar]
- Faller, P. Neuronal growth-inhibitory factor (metallothionein-3): Reactivity and structure of metal-thiolate clusters. FEBS J 2010, 277, 2921–2930. [Google Scholar]
- Namdarghanbari, M.; Wobig, W.; Krezoski, S.; Tabatabai, N.M.; Petering, D.H. Mammalian metallothionein in toxicology, cancer, and cancer chemotherapy. J. Biol. Inorg. Chem 2011, 16, 1087–1101. [Google Scholar]
- Sutherland, D.E.K.; Stillman, M.J. The “Magic numbers” of metallothionein. Metallomics 2011, 3, 444–463. [Google Scholar]
- Suemori, S.; Shimazawa, M.; Kawase, K.; Satoh, M.; Nagase, H.; Yamamoto, T.; Hara, H. Metallothionein, an endogenous antioxidant, protects against retinal neuron damage in mice. Invest. Ophthalmol. Vis. Sci 2006, 47, 3975–3982. [Google Scholar]
- Michalska, A.E.; Choo, K.H. Targeting and germ-line transmission of a null mutation at the metallothionein i and ii loci in mouse. Proc. Natl. Acad. Sci. USA 1993, 90, 8088–8092. [Google Scholar]
- DeLisle, R.C.; Sarras, M.P.; Hidalgo, J.; Andrews, G.K. Metallothionein is a component of exocrine pancreas secretion: Implications for zinc homeostasis. Am. J. Physiol. Cell. Physiol 1996, 271, C1103–C1110. [Google Scholar]
- Trayhurn, P.; Duncan, J.S.; Wood, A.M.; Beattie, J.H. Metallothionein gene expression and secretion in white adipose tissue. Am. J. Physiol. Regul. Integr. Comp. Physiol 2000, 279, R2329–R2335. [Google Scholar]
- Evering, W.; Haywood, S.; Bremner, I.; Wood, A.M.; Trafford, J. The protective role of metallothionein in copper-overload. 2. Transport and excretion of immunoreactive mt-1 in blood, bile and urine of copper-loaded rats. Chem. Biol. Interact 1991, 78, 297–305. [Google Scholar]
- Maret, W. Metalloproteomics, metalloproteomes, and the annotation of metalloproteins. Metallomics 2010, 2, 117–125. [Google Scholar]
- Suzuki, T.; Suzuki, K.; Nakajima, K.; Otaki, N.; Yamanaka, H. Metallothionein in human seminal plasma. Int. J. Urol 1994, 1, 345–348. [Google Scholar]
- Penkowa, M. Metallothionein i+ii expression and roles during neuropathology in the cns. Dan. Med. Bull 2006, 53, 105–121. [Google Scholar]
- Penkowa, M.; Florit, S.; Giralt, M.; Quintana, A.; Molinero, A.; Carrasco, J.; Hidalgo, J. Metallothionein reduces central nervous system inflammation, neuro degeneration, and cell death following kainic acid-induced epileptic seizures. J. Neurosci. Res 2005, 79, 522–534. [Google Scholar]
- Babula, P.; Masarik, M.; Adam, V.; Eckschlager, T.; Stiborova, M.; Trnkova, L.; Skutkova, H.; Provaznik, I.; Hubalek, J.; Kizek, R. Mammalian metallothioneins: Properties and functions. Metallomics 2012, 4, 739–750. [Google Scholar]
- Takahashi, S. Molecular functions of metallothionein and its role in hematological malignancies. J. Hematol. Oncol 2012, 5, 1–8. [Google Scholar]
- Choi, C.H.; Cha, Y.J.; An, C.S.; Kim, K.J.; Kim, K.C.; Moon, S.P.; Lee, Z.H.; Min, Y.D. Molecular mechanisms of heptaplatin effective against cisplatin-resistant cancer cell lines: Less involvement of metallothionein. Cancer Cell. Int 2004, 4, 1–12. [Google Scholar]
- Hagrman, D.; Goodisman, J.; Dabrowiak, J.C.; Souid, A.K. Kinetic study on the reaction of cisplatin with metallothionein. Drug Metab. Dispos 2003, 31, 916–923. [Google Scholar]
- Takaishi, M.; Sawada, M.; Shimada, A.; Suzuki, J.S.; Satoh, M.; Nagase, H. Protective role of metallothionein in benzo a pyrene-induced DNA damage. J. Toxicol. Sci 2009, 34, 449–458. [Google Scholar]
- Bacolod, M.D.; Fehdrau, R.; Johnson, S.P.; Bullock, N.S.; Bigner, D.D.; Colvin, M.; Friedman, H.S. Bcnu-sequestration by metallothioneins may contribute to resistance in a medulloblastoma cell line. Cancer Chemother. Pharmacol 2009, 63, 753–758. [Google Scholar]
- Krizkova, S.; Fabrik, I.; Adam, V.; Hrabeta, J.; Eckschlager, T.; Kizek, R. Metallothionein—A promising tool for cancer diagnostics. Bratisl. Med. J. Bratisl. Lek. Listy 2009, 110, 93–97. [Google Scholar]
- Samson, S.L.; Gedamu, L. Molecular analyses of metallothionein gene regulation. Prog. Nucleic Acid Res. Mol. Biol 1998, 59, 257–288. [Google Scholar]
- Hynek, D.; Krizkova, S.; Krejcova, L.; Gumulec, J.; Ryvolova, M.; Cernei, N.; Masarik, M.; Adam, V.; Trnkova, L.; Stiborova, M.; et al. Femtogram electroanalytical detection of prostatic specific antigen by brdicka reaction. Int. J. Electrochem. Sci 2012, 7, 1749–1766. [Google Scholar]
- Milnerowicz, H.; Bizon, A. Determination of metallothionein in biological fluids using enzyme-linked immunoassay with commercial antibody. Acta Biochim. Pol 2010, 57, 99–104. [Google Scholar]
- Singh, V.K.; Hanson, J. Assessment of metallothionein and antibodies to metallothionein in normal and autistic children having exposure to vaccine-derived thimerosal. Pediatr. Allergy Immunol 2006, 17, 291–296. [Google Scholar]
- Kruseova, J. University Hospital Motol: Prague, Czech Republic, Unpublished work; 2013.
- Ostrakhovitch, E.A.; Olsson, P.E.; Jiang, S.; Cherian, M.G. Interaction of metallothionein with tumor suppressor p53 protein. FEBS Lett 2006, 580, 1235–1238. [Google Scholar]
- Gibson, R.S.; Hess, S.Y.; Hotz, C.; Brown, K.H. Indicators of zinc status at the population level: A review of the evidence. Br. J. Nutr 2008, 99, S14–S23. [Google Scholar]
- Dutsch-Wicherek, M.; Sikora, J.; Tomaszewska, R. The possible biological role of metallothionein in apoptosis. Front. Biosci 2008, 13, 4029–4038. [Google Scholar]
- Hinkel, A.; Schmidtchen, S.; Palisaar, R.J.; Noldus, J.; Pannek, J. Identification of bladder cancer patients at risk for recurrence or progression: An immunohistochemical study based on the expression of metallothionein. J. Toxicol. Env. Health Part A 2008, 71, 954–959. [Google Scholar]
- Cardoso, S.V.; Silveira, J.B.; Machado, V.D.; De-Paula, A.M.B.; Loyola, A.M.; de Aguiar, M.C.F. Expression of metallothionein and p53 antigens are correlated in oral squamous cell carcinoma. Anticancer Res 2009, 29, 1189–1193. [Google Scholar]
- Lara-Bohorquez, C.; Gonzalez-Campora, R.; Mendoza-Garcia, E.; Rios-Martin, J.J.; Pareja-Megia, M.J.; Lopez-Beltran, A. Tp53, bcl-2. P21(waf1/cip1) and metallothionein as markers of differentiation, response to treatment and prognosis in neuroblastic tumors. Anal. Quant. Cytol. Histol 2008, 30, 105–112. [Google Scholar]
- Peyre, M.; Commo, F.; Dantas-Barbosa, C.; Andreiuolo, F.; Puget, S.; Lacroix, L.; Drusch, F.; Scott, V.; Varlet, P.; Mauguen, A.; et al. Portrait of ependymoma recurrence in children: Biomarkers of tumor progression identified by dual-color microarray-based gene expression analysis. PLoS One 2010, 5, e12932. [Google Scholar]
- Endo-Munoz, L.; Cumming, A.; Sommerville, S.; Dickinson, I.; Saunders, N.A. Osteosarcoma is characterised by reduced expression of markers of osteoclastogenesis and antigen presentation compared with normal bone. Br. J. Cancer 2010, 103, 73–81. [Google Scholar]
- Sauerbrey, A.; Zintl, F.; Volm, M. Expression of metallothionein in initial and relapsed childhood acute lymphoblastic-leukemia. Ann. Hematol 1994, 69, 111–115. [Google Scholar]
- Weinlich, G.; Eisendle, K.; Hassler, E.; Baltaci, M.; Fritsch, P.O.; Zelger, B. Metallothionein— Overexpression as a highly significant prognostic factor in melanoma: A prospective study on 1270 patients. Br. J. Cancer 2006, 94, 835–841. [Google Scholar]
- Weinlich, G. Metallothionein-overexpression as a prognostic marker in melanoma. G. Ital. Dermatol. Venereol 2009, 144, 27–38. [Google Scholar]
- Schmitz, K.J.; Muller, C.I.; Reis, H.; Alakus, H.; Winde, G.; Baba, H.A.; Wohlschlaeger, J.; Jasani, B.; Fandrey, J.; Schmid, K.W. Combined analysis of hypoxia-inducible factor 1 alpha and metallothionein indicates an aggressive subtype of colorectal carcinoma. Int. J. Colorectal Dis 2009, 24, 1287–1296. [Google Scholar]
- Pontes, H.A.R.; Xavier, F.C.D.; da Silva, T.S.P.; Fonseca, F.P.; Paiva, H.B.; Pontes, F.S.C.; Pinto, D.D. Metallothionein and p-akt proteins in oral dysplasia and in oral squamous cell carcinoma: An immunohistochemical study. J. Oral Pathol. Med 2009, 38, 644–650. [Google Scholar]
- Yap, X.L.; Tan, H.Y.; Huang, J.X.; Lai, Y.Y.; Yip, G.W.C.; Tan, P.H.; Bay, B.H. Over-expression of metallothionein predicts chemoresistance in breast cancer. J. Pathol 2009, 217, 563–570. [Google Scholar]
- Grabellus, F.; Sheu, S.Y.; Totsch, M.; Lehmann, N.; Kaiser, G.M.; Jasani, B.; Taeger, G.; Schmid, K.W. Overexpression of the drug resistance-associated protein metallothionein does not correlate with response of sarcomas to isolated limb perfusion treatment. J. Surg. Oncol 2010, 101, 465–470. [Google Scholar]
- Formigare, A.; Irato, P.; Santon, A. Zinc, antioxidant systems and metallothionein in metal mediated-apoptosis: Biochemical and cytochemical aspects. Comp. Biochem. Physiol. C Toxicol. Pharmacol 2007, 146, 443–459. [Google Scholar]
- Hiura, T.; Khalid, H.; Yamashita, H.; Tokunaga, Y.; Yasunaga, A.; Shibata, S. Immunohistochemical analysis of metallothionein in astrocytic tumors in relation to tumor grade, proliferative potential, and survival. Cancer 1998, 83, 2361–2369. [Google Scholar]
- Szelachowska, J.; Dziegiel, P.; Jelen-Krzeszewska, J.; Jelen, M.; Tarkowski, R.; Spytkowska, B.; Matkowski, R.; Kornafel, J. Correlation of metallothionein expression with clinical progression of cancer in the oral cavity. Anticancer Res 2009, 29, 589–595. [Google Scholar]
- Swierzcek, S.; Abuknesha, R.A.; Chivers, I.; Baranovska, I.; Cunningham, P.; Price, R.G. Enzyme-immunoassay for the determination of metallothionein in human urine: Application to environmental monitoring. Biomarkers 2004, 9, 331–340. [Google Scholar]
- Gumulec, J.; Masarik, M.; Krizkova, S.; Hlavna, M.; Babula, P.; Hrabec, R.; Rovny, A.; Masarikova, M.; Sochor, J.; Adam, V.; et al. Evaluation of alpha-methylacyl-CoA racemase, metallothionein and prostate specific antigen as prostate cancer prognostic markers. Neoplasma 2012, 59, 191–200. [Google Scholar]
- Krejcova, L.; Fabrik, I.; Hynek, D.; Krizkova, S.; Gumulec, J.; Ryvolova, M.; Adam, V.; Babula, P.; Trnkova, L.; Stiborova, M.; et al. Metallothionein electrochemically determined using brdicka reaction as a promising blood marker of head and neck malignant tumours. Int. J. Electrochem. Sci 2012, 7, 1767–1784. [Google Scholar]
- Sochor, J.; Hynek, D.; Krejcova, L.; Fabrik, I.; Krizkova, S.; Gumulec, J.; Adam, V.; Babula, P.; Trnkova, L.; Stiborova, M.; et al. Study of metallothionein role in spinocellular carcinoma tissues of head and neck tumours using brdicka reaction. Int. J. Electrochem. Sci 2012, 7, 2136–2152. [Google Scholar]
- Nakayama, A.; Fukuda, H.; Ebara, M.; Hamasaki, H.; Nakajima, K.; Sakurai, H. A new diagnostic method for chronic hepatitis, liver cirrhosis, and hepatocellular carcinoma based on serum metallothionein, copper, and zinc levels. Biol. Pharmacol. Bull 2002, 25, 426–431. [Google Scholar]
- Rickert, C.H.; Paulus, W. Prognosis-related histomorphological and immunohistochemical markers in central nervous system tumors of childhood and adolescence. Acta Neuropathol 2005, 109, 69–92. [Google Scholar]
- Natale, J.E.; Knight, J.B.; Cheng, Y.; Rome, J.E.; Gallo, V. Metallothionein i and ii mitigate age-dependent secondary brain injury. J. Neurosci. Res 2004, 78, 303–314. [Google Scholar]
- Bell, S.G.; Vallee, B.L. The metallothionein/thionein system: An oxidoreductive metabolic zinc link. ChemBioChem 2009, 10, 55–62. [Google Scholar]
- Tsukahara, H. Biomarkers for oxidative stress: Clinical application in pediatric medicine. Curr. Med. Chem 2007, 14, 339–351. [Google Scholar]
- Arvin, L.R.a.A. Chemotherapy-induced immunosupression. Environ. Health Perspect 1982, 43, 4. [Google Scholar]
- Surowiak, P.; Materna, V.; Maciejczyk, A.; Pudelko, M.; Markwitz, E.; Spaczynski, M.; Dietel, M.; Zabel, M.; Lage, H. Nuclear metallothionein expression correlates with cisplatin resistance of ovarian cancer cells and poor clinical outcome. Virchows. Arch 2007, 450, 279–285. [Google Scholar]
- Endo, T.; Yoshikawa, M.; Ebara, M.; Kato, K.; Sunaga, M.; Fukuda, H.; Hayasaka, A.; Kondo, F.; Sugiura, N.; Saisho, H. Immunohistochemical metallothionein expression in hepatocellular carcinoma: Relation to tumor progression and chemoresistance to platinum agents. J. Gastroenterol 2004, 39, 1196–1201. [Google Scholar]
- Suganuma, K.; Kubota, T.; Saikawa, Y.; Abe, S.; Otani, Y.; Furukawa, T.; Kumai, K.; Hasegawa, H.; Watanabe, M.; Kitajima, M.; et al. Possible chemoresistance-related genes for gastric cancer detected by cdna microarray. Cancer Sci 2003, 94, 355–359. [Google Scholar]
- Bacolod, M.D.; Johnson, S.P.; Ali-Osman, F.; Modrich, P.; Bullock, N.S.; Colvin, O.M.; Bigner, D.D.; Friedman, H.S. Mechanisms of resistance to 1,3-bis(2-chloroethyl)-1-nitrosourea in human medulloblastoma and rhabdomyosarcoma. Mol. Cancer Ther 2002, 1, 727–736. [Google Scholar]
- Sunada, F.; Itabashi, M.; Ohkura, H.; Okumura, T. P53 negativity, cdc25b positivity, and metallothionein negativity are predictors of a response of esophageal squamous cell carcinoma to chemoradiotherapy. World J. Gastroenterol 2005, 11, 5696–5700. [Google Scholar]
- Hishikawa, Y.; Abe, S.; Kinugasa, S.; Yoshimura, H.; Monden, N.; Igarashi, M.; Tachibana, M.; Nagasue, N. Overexpression of metallothionein correlates with chemoresistance to cisplatin and prognosis in esophageal cancer. Oncology 1997, 54, 342–347. [Google Scholar]
- Malavolta, M.; Cipriano, C.; Costarelli, L.; Giacconi, R.; Tesei, S.; Muti, E.; Piacenza, F.; Pierpaoli, S.; Larbi, A.; Pawelec, G.; et al. Metallothionein downregulation in very old age: A phenomenon associated with cellular senescence? Rejuv. Res 2008, 11, 455–459. [Google Scholar]
- Bauerly, K.A.; Kelleher, S.L.; Lonnerdal, B. Effects of copper supplementation on copper absorption, tissue distribution, and copper transporter expression in an infant rat model. Am. J. Physiol. Gastrointest. Liver Physiol 2005, 288, G1007–1014. [Google Scholar]
- Wong, H.R.; Shanley, T.P.; Sakthivel, B.; Cvijanovich, N.; Lin, R.; Allen, G.L.; Thomas, N.J.; Doctor, A.; Kalyanaraman, M.; Tofil, N.M.; et al. Genome-level expression profiles in pediatric septic shock indicate a role for altered zinc homeostasis in poor outcome. Physiol. Genomics 2007, 30, 146–155. [Google Scholar]
- Cvijanovich, N.Z.; King, J.C.; Flori, H.R.; Gildengorin, G.; Wong, H.R. Zinc homeostasis in pediatric critical illness. Pediatr. Crit. Care Med 2009, 10, 29–34. [Google Scholar]
- Erk, M.; Ivankovic, D.; Raspor, B.; Pavicic, J. Evaluation of different purification procedures for the electrochemical quantification of mussel metallothioneins. Talanta 2002, 57, 1211–1218. [Google Scholar]
- Ryvolova, M.; Krizkova, S.; Adam, V.; Beklova, M.; Trnkova, L.; Hubalek, J.; Kizek, R. Analytical methods for metallothionein detection. Curr. Anal. Chem 2011, 7, 243–261. [Google Scholar]
- Ryvolova, M.; Adam, V.; Kizek, R. Analysis of metallothionein by capillary electrophoresis. J. Chromatogr. A 2012, 1226, 31–42. [Google Scholar]
- Fabrik, I.; Krizkova, S.; Huska, D.; Adam, V.; Hubalek, J.; Trnkova, L.; Eckschlager, T.; Kukacka, J.; Prusa, R.; Kizek, R. Employment of electrochemical techniques for metallothionein determination in tumor cell lines and patients with a tumor disease. Electroanalysis 2008, 20, 1521–1532. [Google Scholar]
- Adam, V.; Baloun, J.; Fabrik, I.; Trnkova, L.; Kizek, R. An electrochemical detection of metallothioneins at the zeptomole level in nanolitre volumes. Sensors 2008, 8, 2293–2305. [Google Scholar]
- Raspor, B. Elucidation of the mechanism of the brdicka reaction. J. Electroanal. Chem 2001, 503, 159–162. [Google Scholar]
- Adam, V.; Petrlova, J.; Wang, J.; Eckschlager, T.; Trnkova, L.; Kizek, R. Zeptomole electrochemical detection of metallothioneins. PLoS One 2010, 5, e11441. [Google Scholar]
- Krizkova, S.; Adam, V.; Eckschlager, T.; Kizek, R. Using of chicken antibodies for metallothionein detection in human blood serum and cadmium-treated tumour cell lines after dot- and electroblotting. Electrophoresis 2009, 30, 3726–3735. [Google Scholar]
- Krizikova, S.F.I; Adam, V.; Kukacka, J.; Prusa, R.; Chavis, G.J.; Trnkova, L.; Strnadel, J.; Horak, V.; Kizek, R. Utilizing of adsorptive transfer stripping tecchnique brdicka reaction for determination of metallothioneins level in melanoma cells, blood serum and tissues. Sensor 2008, 8, 3106–3122. [Google Scholar]


| Correlations | |||||
|---|---|---|---|---|---|
| MT | ANL | CRP | Hgb | ||
| MT | Pearson r | 1 | −0.252 ** | 0.009 | 0.132 # |
| Sig. (2-tailed) | - | 0.001 | 0.912 | 0.085 | |
| N | 172 | 171 | 152 | 171 | |
| ANL | Pearson r | −0.252 ** | 1 | −0.126 | −0.040 |
| Sig.(2-tailed) | 0.001 | - | 0.119 | 0.599 | |
| N | 171 | 174 | 154 | 174 | |
| CRP | Pearson r | 0.009 | −0.126 | 1 | 0.039 |
| Sig. (2-tailed) | 0.912 | 0.119 | - | 0.635 | |
| N | 152 | 154 | 154 | 154 | |
| Hgb | Pearson r | 0.132 | −0.040 | 0.039 | 1 |
| Sig. (2-tailed) | 0.085 | 0.599 | 0.635 | - | |
| N | 171 | 174 | 154 | 174 | |
| Crea | Pearson r | 0.273 | −0.381 | 0.170 | 0.445 |
| Sig. (2-tailed) | 0.003 | 0.000002 | 0.036 | 0.000001 | |
| N | 170 | 173 | 153 | 173 | |
| Diagnosis | No. of pat. | Median age | Minimum age | Maximum age | Recurrence | Metastatic | Chemotherapy/Pt cytostaic ** |
|---|---|---|---|---|---|---|---|
| Neuroblastoma | 33 | 1 y 8 m | 1 m | 15 y | 3 | 24 | 30/24 |
| Brain tumours | 27 | 9 y 2 m | 8 m | 15 y 4 m | 3 | 3 * | 27/16 |
| Lymphoma | 24 | 15 y 10 m | 9 m | 18 y 4 m | 2 | / | 24/0 |
| Ewing sarcoma | 20 | 12 y 7 m | 1 y 5 m | 18 y 3 m | 0 | 3 | 20/0 |
| Germ cell tumours | 14 | 16 y 4 m | 6 m | 19 y 6 m | 1 | 10 | 14/14 |
| Osteosarcoma | 12 | 13 y 1 m | 6 y 5 m | 16 y 11 m | 1 | 3 | 12/12 |
| Soft tissue sarcoma | 12 | 10 y 8 m | 1 y 8 m | 16 y 6 m | 1 | 1 | 12/0 |
| Nephroblastoma | 7 | 1 y 9 m | 9 m | 6 y 10 m | 1 | 3 | 7/2 |
| Other malignant tumours | 23 | 16 y 4 m | 6 m | 19 y 6 m | 0 | 9 | 16/2 |
| All | 172 | 9 y 11 m | 1 m | 19 y 6 m | 12 | 56 | 162/70 |
© 2013 by the authors; licensee MDPI, Basel, Switzerland This article is an open access article distributed under the terms and conditions of the Creative Commons Attribution license ( http://creativecommons.org/licenses/by/3.0/).
Share and Cite
Kruseova, J.; Hynek, D.; Adam, V.; Kizek, R.; Prusa, R.; Hrabeta, J.; Eckschlager, T. Serum Metallothioneins in Childhood Tumours — A Potential Prognostic Marker. Int. J. Mol. Sci. 2013, 14, 12170-12185. https://doi.org/10.3390/ijms140612170
Kruseova J, Hynek D, Adam V, Kizek R, Prusa R, Hrabeta J, Eckschlager T. Serum Metallothioneins in Childhood Tumours — A Potential Prognostic Marker. International Journal of Molecular Sciences. 2013; 14(6):12170-12185. https://doi.org/10.3390/ijms140612170
Chicago/Turabian StyleKruseova, Jarmila, David Hynek, Vojtech Adam, Rene Kizek, Richard Prusa, Jan Hrabeta, and Tomas Eckschlager. 2013. "Serum Metallothioneins in Childhood Tumours — A Potential Prognostic Marker" International Journal of Molecular Sciences 14, no. 6: 12170-12185. https://doi.org/10.3390/ijms140612170