
Evaluation of Appropriate Reference Genes for Reverse Transcription-Quantitative PCR Studies in Different Tissues of a Desert Poplar via Comparision of Different Algorithms

 ,
,
Abstract
:
1. Introduction
2. Results
2.1. RNA Quality and PCR Specificity


| Gene Name | Phytozome v9.1 GI (P. trichocarpa) | Primer Sequences (5′–3′, Forward/Reverse) | PCR Efficiency |
|---|---|---|---|
| 60S a | Potri.007G093700 | AGGTGAACTCTTGATGCTTCGTCTT/CTTCTCTTCCATTGCCTGTCCAACT | 1.972 |
| Actin a | Potri.006G192700 | AAGATTCCGTTGTCCAGAGGTCCT/GAACATAGTAGAGCCACCACTGAGAAC | 2.027 |
| EF1α a | Potri.006G130900 | TCCGTCTTCCACTTCAGGATGTCT/GTCACGACCATACCAGGCTTCAG | 1.896 |
| eIF-5A a | Potri.018G107300 | TCGGACGAGGAGCACCACTT/TGCAAGGACGGTTCTTGATGACTAT | 1.965 |
| GAPDH a | Potri.010G055400 | ATGAAGGACTGGAGAGGTGGAAGG/CACAGTAGGAACACGGAAGGACATT | 1.904 |
| GIIα a | DQ388455.1 d | CTCTCATTGAGCCGGCAAAT/CCCCCCTTCAAGCATAAGG | 2.009 |
| HIS a | Potri.005G072300 | ACTGCTCGTAAGTCTACTGGAGG/GCGGTAACGGTGAGGCTTCTTC | 1.968 |
| RP a | Potri.001G342500 | GTTACACGCTGGATGTGGACTTG/AACCACCTGTTCTTGCCTGTCTT | 1.935 |
| TUB a | Potri.003G126800 | GGAGGTGGAACTGGATCAGGAATG/GGCATTGTAAGGCTCAACCACTGT | 1.914 |
| UBQ a | Potri.014G115100 | AGACCTACACCAAGCCCAAGAAGAT/CCAGCACCGCACTCAGCATTAG | 2.097 |
| PeCOBL4 b | Potri.004G117200 | GCACTTACTCACAATTCATGGCAAG/TTGGCAACCGCACGCACAA | 1.887 |
| PeFLA12-1 b | Potri.009G012100 | TTATCTTGTTATTCTGGCTCCTCTTCCTC/TGTCTGAGTCGCTGCTGGTG | 1.944 |
| PeFLA12-2 b | Potri.009G012200 | TGGAATAACAATCCTGGCACCAACTG/GCTCAGTCTTGTCTTCATCGCTTAG | 2.031 |
| PeFLA12-3 b | Potri.012G015000 | ACTTACCAATACAAGCGTATCGGCAAT/TGGAGCAGGAGCAAGAGGTTTAGG | 2.074 |
| PeFLA12-4 b | Potri.004G210600 | ACTTCACTGTCTTCGTCCGCCTAAT/CCAACTCAGTCTTGTCTTCATCGCTT | 2.049 |
| PeHKT1 c | Potri.018G132200 | TCTTGGTGCTCTTCGTGGTTATGATG/CAAAGATGGCTAAGGTAGATAAAGGTGAG | 2.054 |
| PeKUP3 c | Potri.014G144900 | CAATCAACAAGCAGCCGATGAGG/GGAGTAAGCACGCCATCACCTATG | 1.978 |
| PeNhaD1 c | JX981308 d | GGACTCTTCTTTGGGTGGTTGGTTT/GCTTGCGGTATTCTGATGGAGGTAC | 1.954 |
| PeNHX2 c | Potri.014G134900 | GACACGGTGGATTATCTAGGCTTGG/CTCGAGGTGATGTGTGAGAGGTC | 2.062 |
2.2. Cq Value Distribution and Expression Profile of the Ten Reference Genes
2.3. Statistical and Bioinformatical Analyses of Gene Expression Stability Using ΔCt, NormFinder, geNorm, RankAggreg and GrayNorm
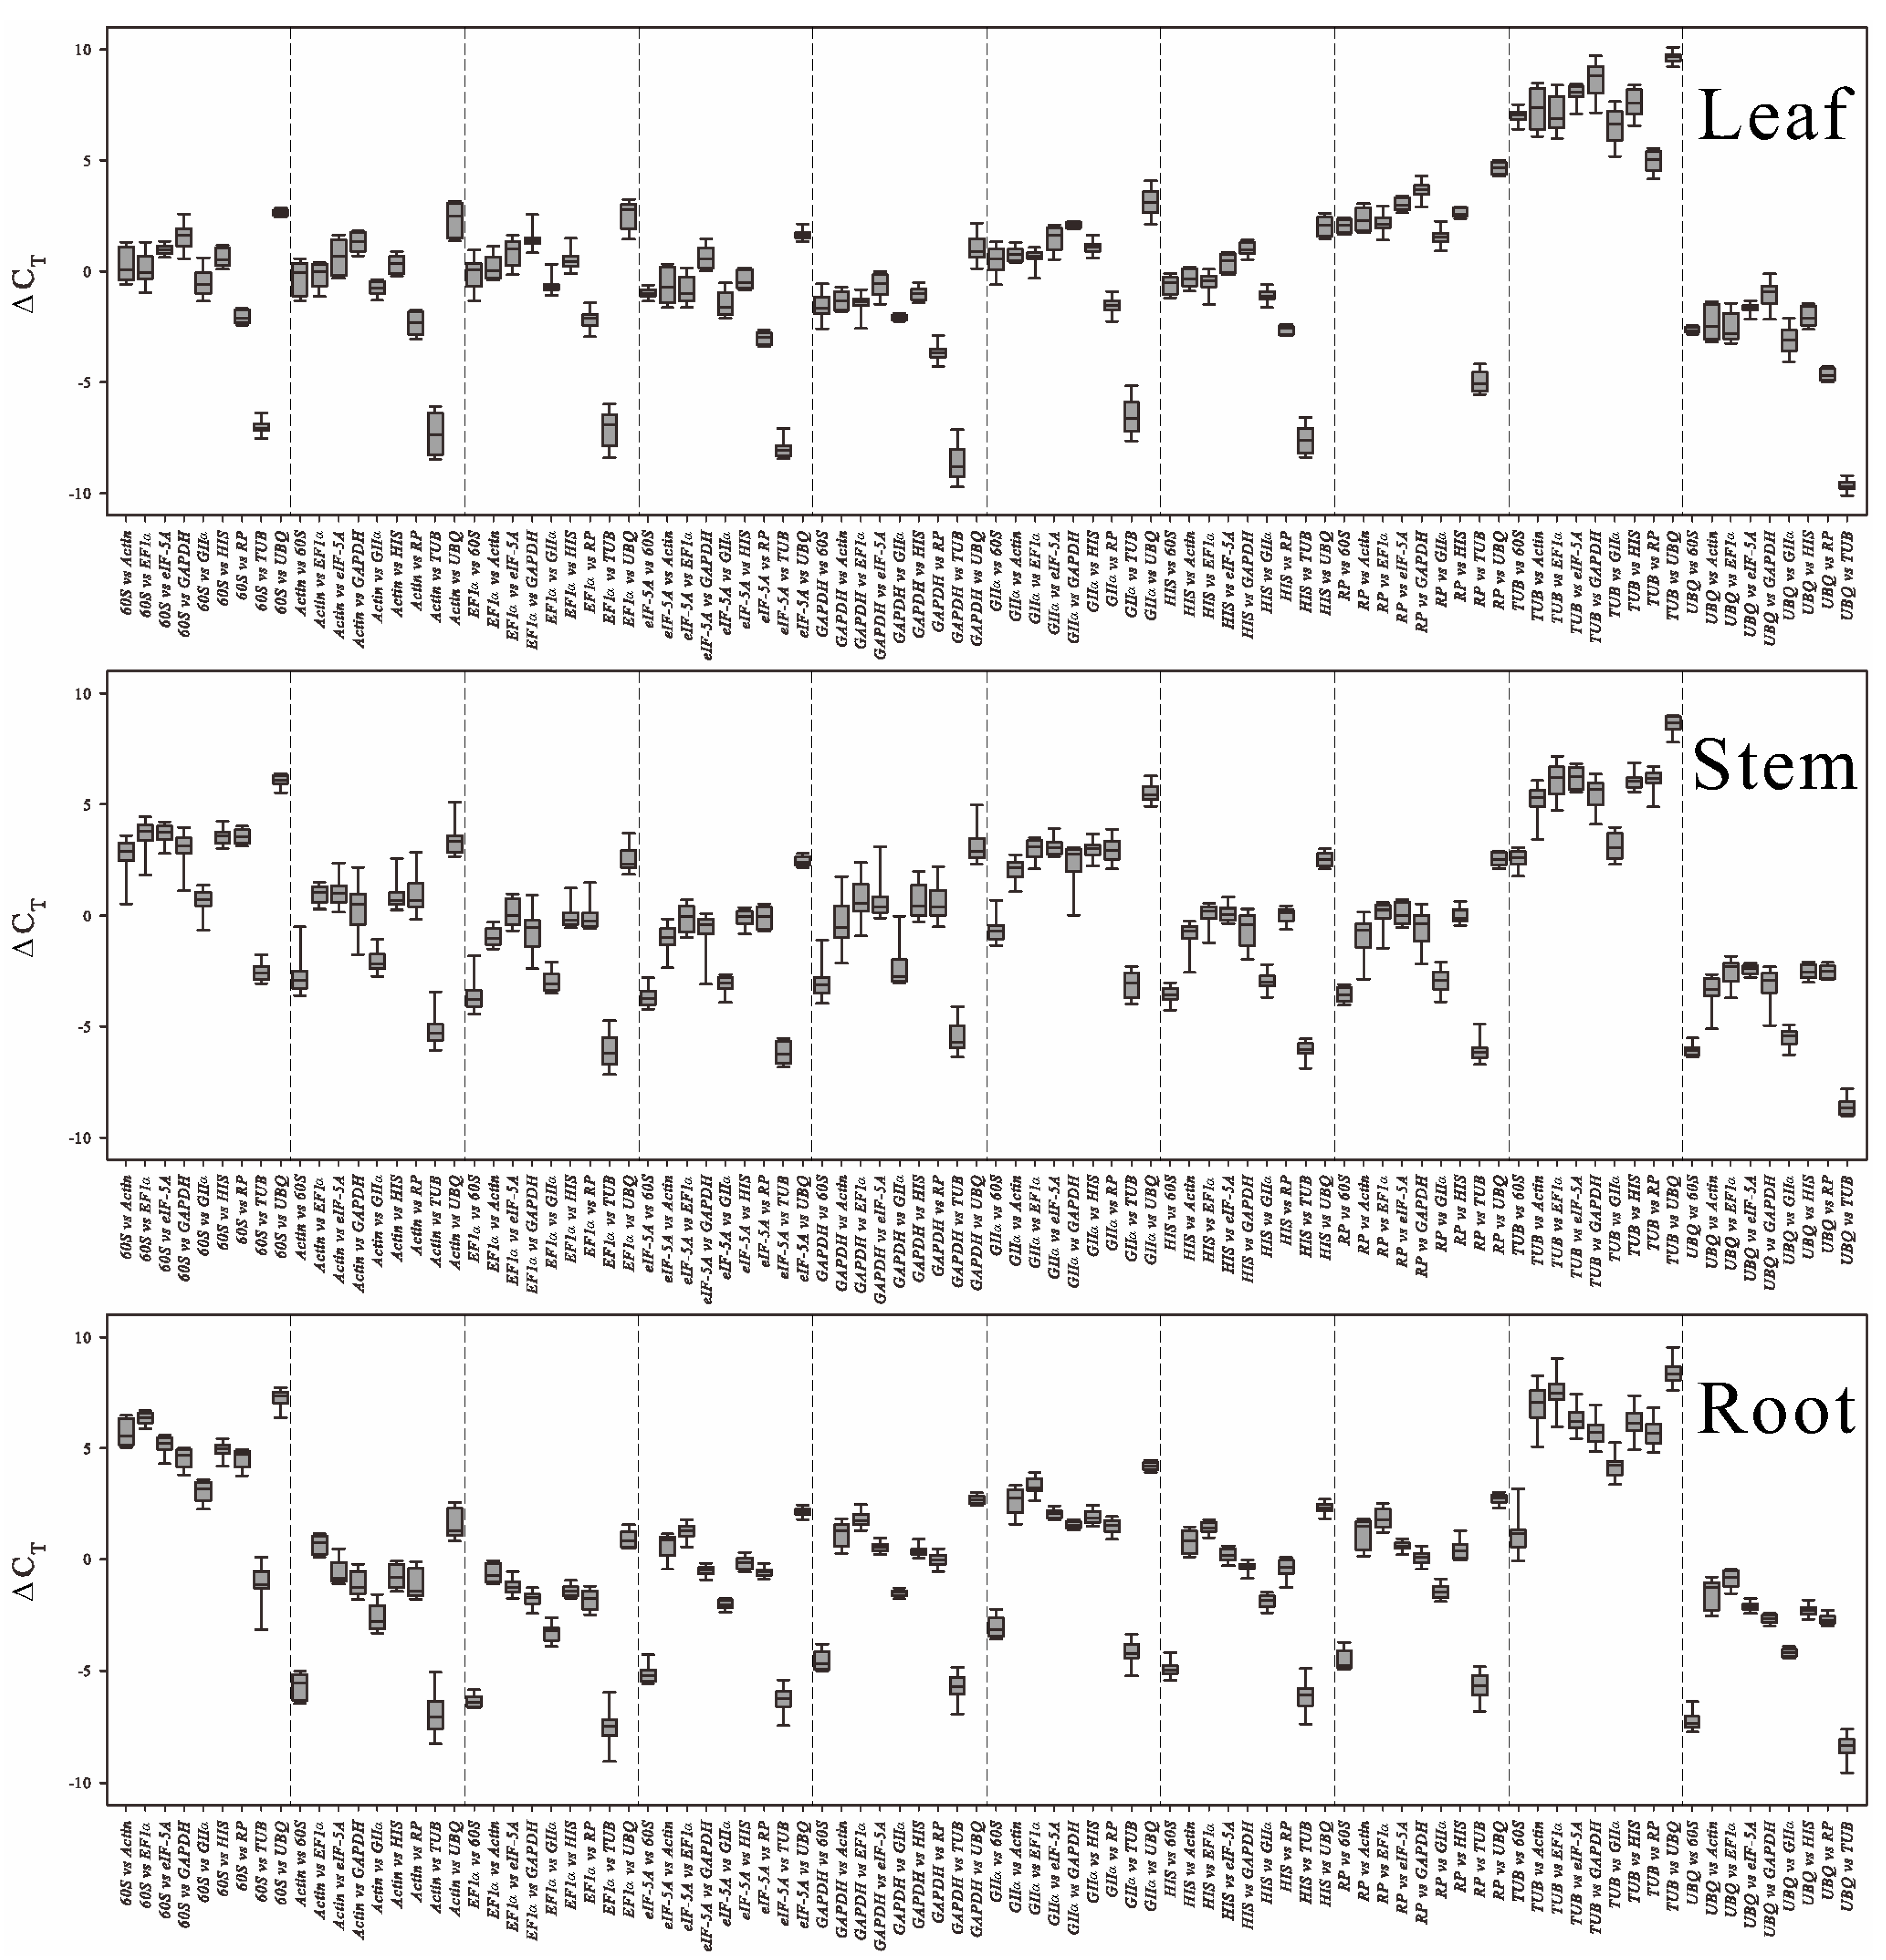
2.3.1. ΔCt Algorithm


| Rank (Position) | Leaf | Stem | Root | |||
|---|---|---|---|---|---|---|
| Gene | Stab | Gene | Stab | Gene | Stab | |
| 1 | RP | 0.384 | UBQ | 0.517 | UBQ | 0.366 |
| 2 | HIS | 0.407 | HIS | 0.547 | eIF-5A | 0.369 |
| 3 | eIF-5A | 0.464 | eIF-5A | 0.577 | GAPDH | 0.385 |
| 4 | UBQ | 0.465 | RP | 0.612 | GIIα | 0.399 |
| 5 | 60S | 0.472 | 60S | 0.621 | HIS | 0.403 |
| 6 | GIIα | 0.494 | TUB | 0.627 | RP | 0.431 |
| 7 | GAPDH | 0.519 | GIIα | 0.660 | EF1α | 0.441 |
| 8 | Actin | 0.610 | EF1α | 0.689 | 60S | 0.503 |
| 9 | EF1α | 0.615 | Actin | 0.816 | Actin | 0.636 |
| 10 | TUB | 0.655 | GAPDH | 1.012 | TUB | 0.772 |

2.3.2. Normfinder
| Rank (Position) | Leaf | Stem | Root | |||
|---|---|---|---|---|---|---|
| Gene | Stab | Gene | Stab | Gene | Stab | |
| 1 | RP | 0.024 | UBQ | 0.048 | eIF-5A | 0.031 |
| 2 | HIS | 0.031 | HIS | 0.071 | GAPDH | 0.040 |
| 3 | eIF-5A | 0.087 | eIF-5A | 0.082 | UBQ | 0.042 |
| 4 | 60S | 0.098 | TUB | 0.108 | GIIα | 0.053 |
| 5 | GIIα | 0.110 | GIIα | 0.118 | HIS | 0.055 |
| 6 | UBQ | 0.112 | RP | 0.120 | RP | 0.073 |
| 7 | GAPDH | 0.114 | 60S | 0.132 | EF1α | 0.078 |
| 8 | EF1α | 0.140 | EF1α | 0.132 | 60S | 0.116 |
| 9 | Actin | 0.155 | Actin | 0.218 | Actin | 0.171 |
| 10 | TUB | 0.164 | GAPDH | 0.241 | TUB | 0.206 |
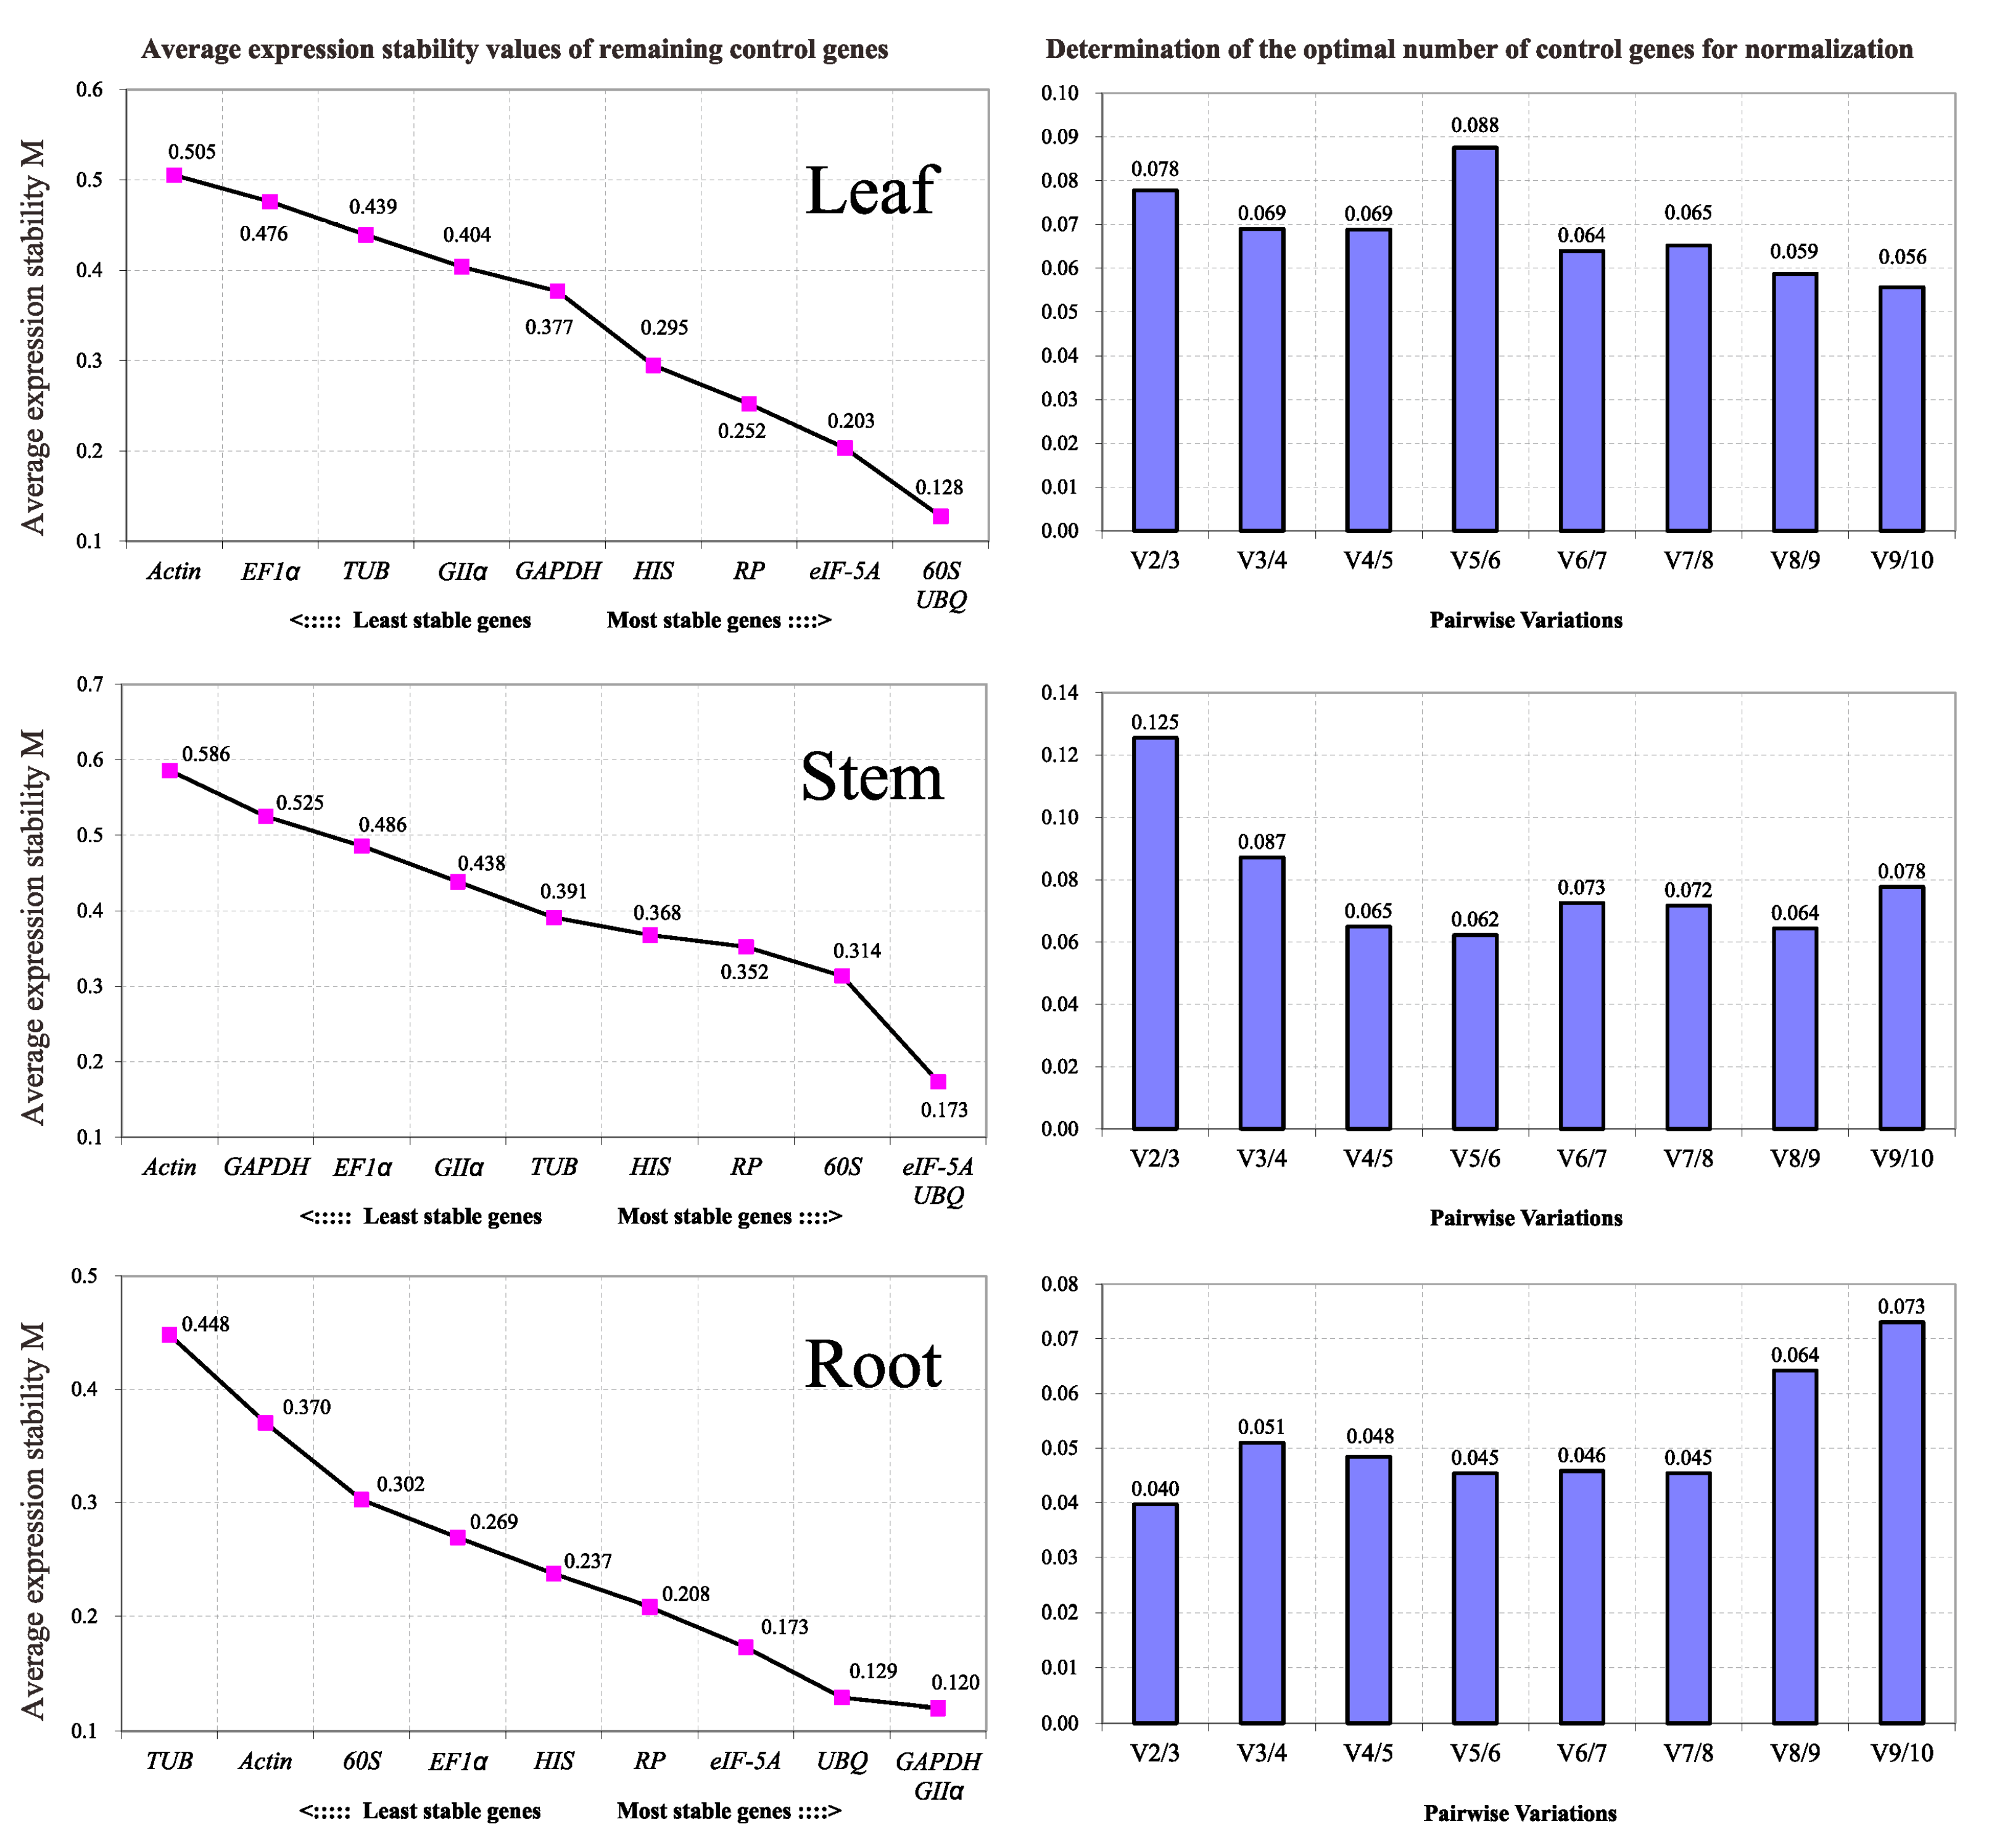
2.3.3. geNorm
2.3.4. RankAggreg
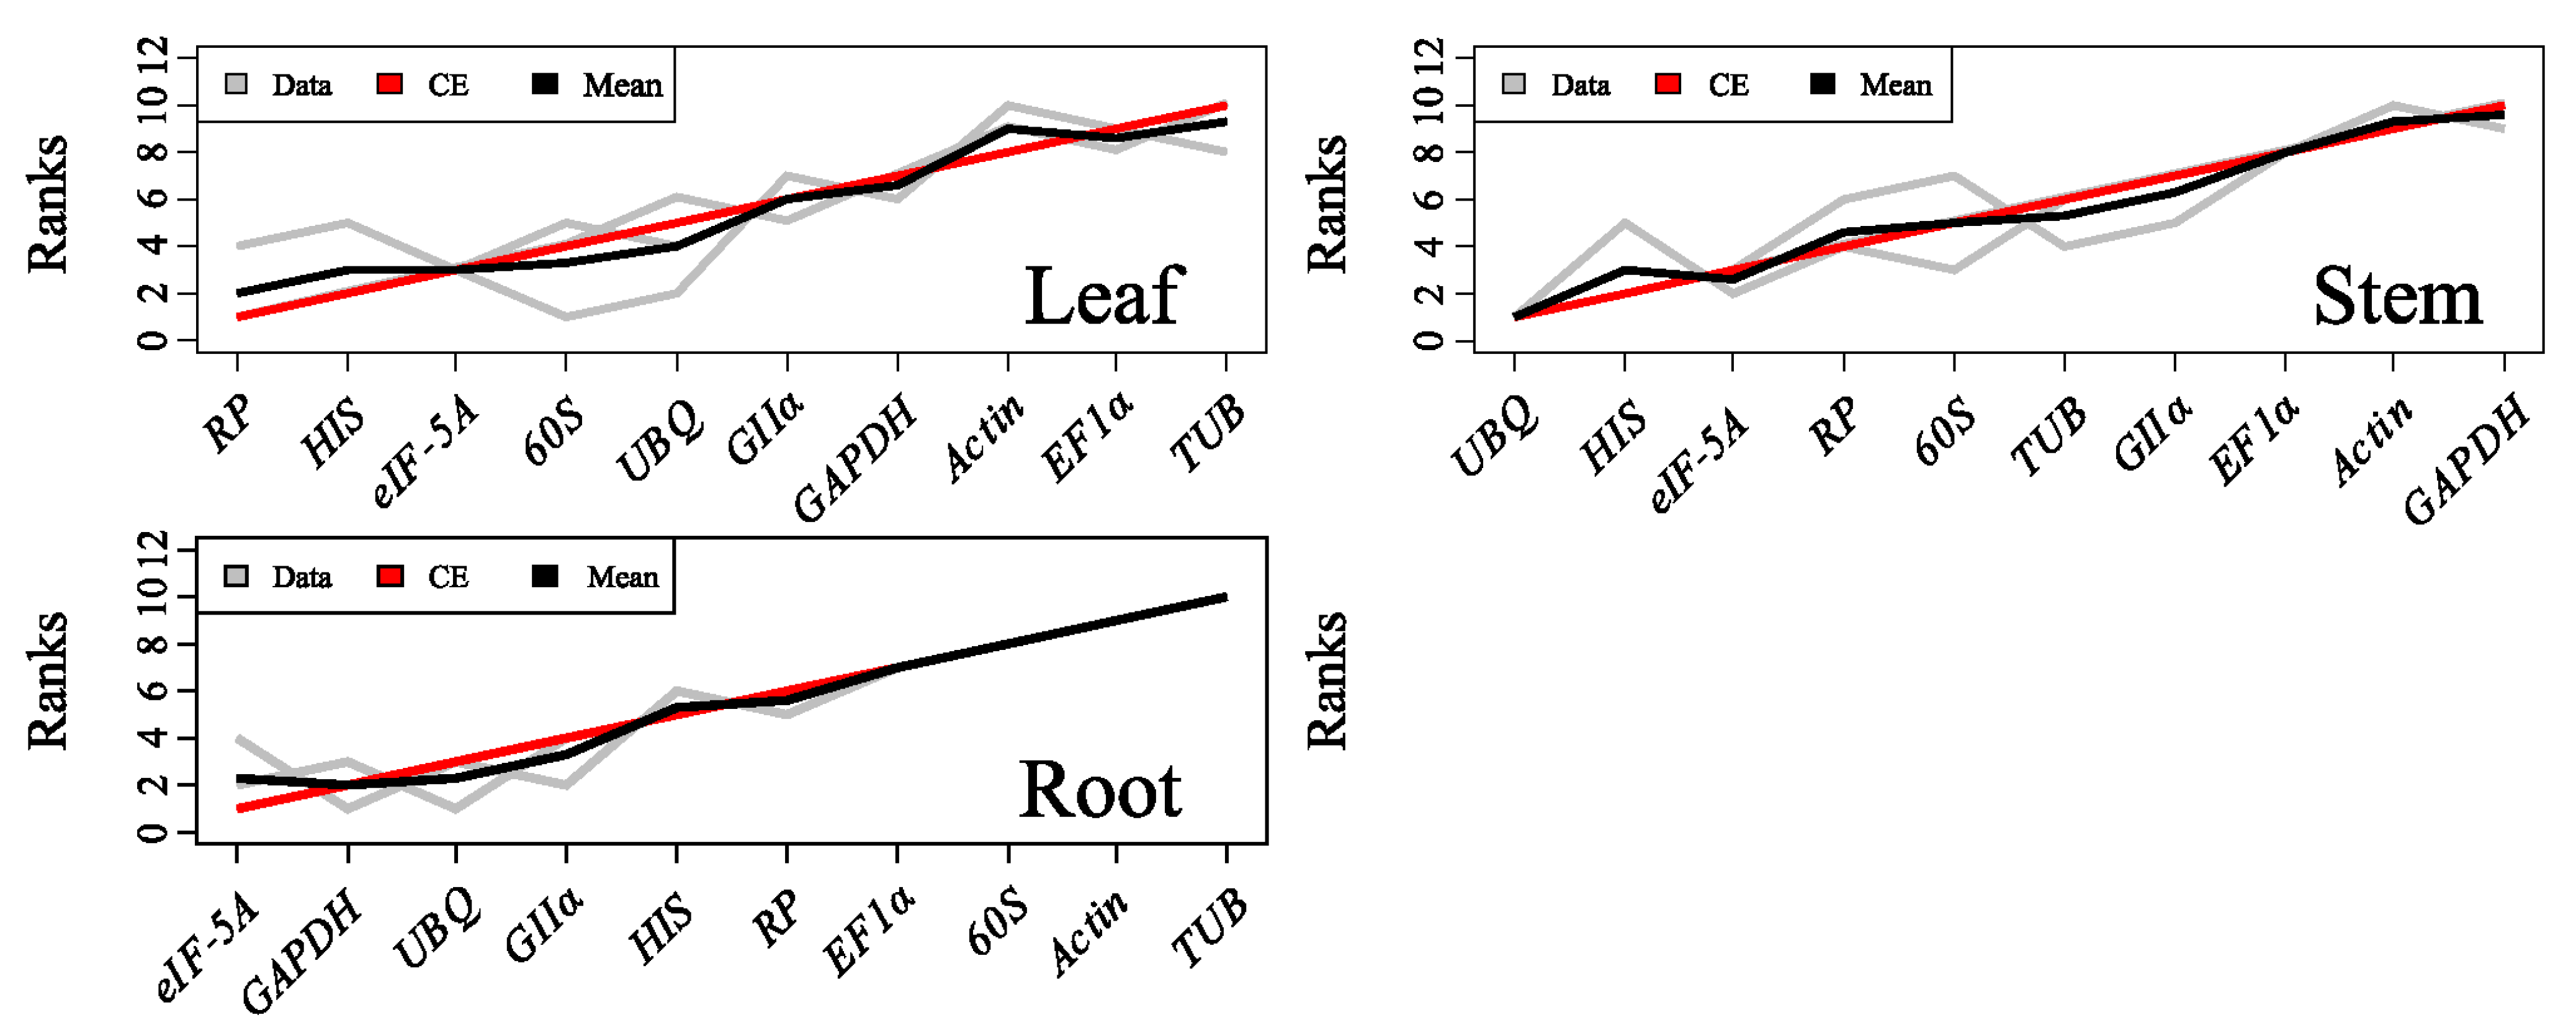
2.3.5. GrayNorm
| Algorithms | Different Tissues | ||
|---|---|---|---|
| Leaf | Stem | Root | |
| Δ Ct | RP + HIS + eIF-5A | UBQ + HIS + eIF-5A | UBQ + eIF-5A + GAPDH |
| NormFinder | RP + HIS + eIF-5A | UBQ + HIS + eIF-5A | UBQ + eIF-5A + GAPDH |
| geNorm | 60S + UBQ + eIF-5A | eIF-5A + UBQ + 60S + RP + HIS + TUB | GAPDH + GIIα + UBQ |
| RankAggreg | RP + HIS + eIF-5A | UBQ + HIS + eIF-5A | UBQ + eIF-5A + GAPDH |
| GrayNorm | EF1α + HIS + RP | 60S + RP + eIF-5A + GAPDH | Actin + EF1α + GAPDH + RP + UBQ |
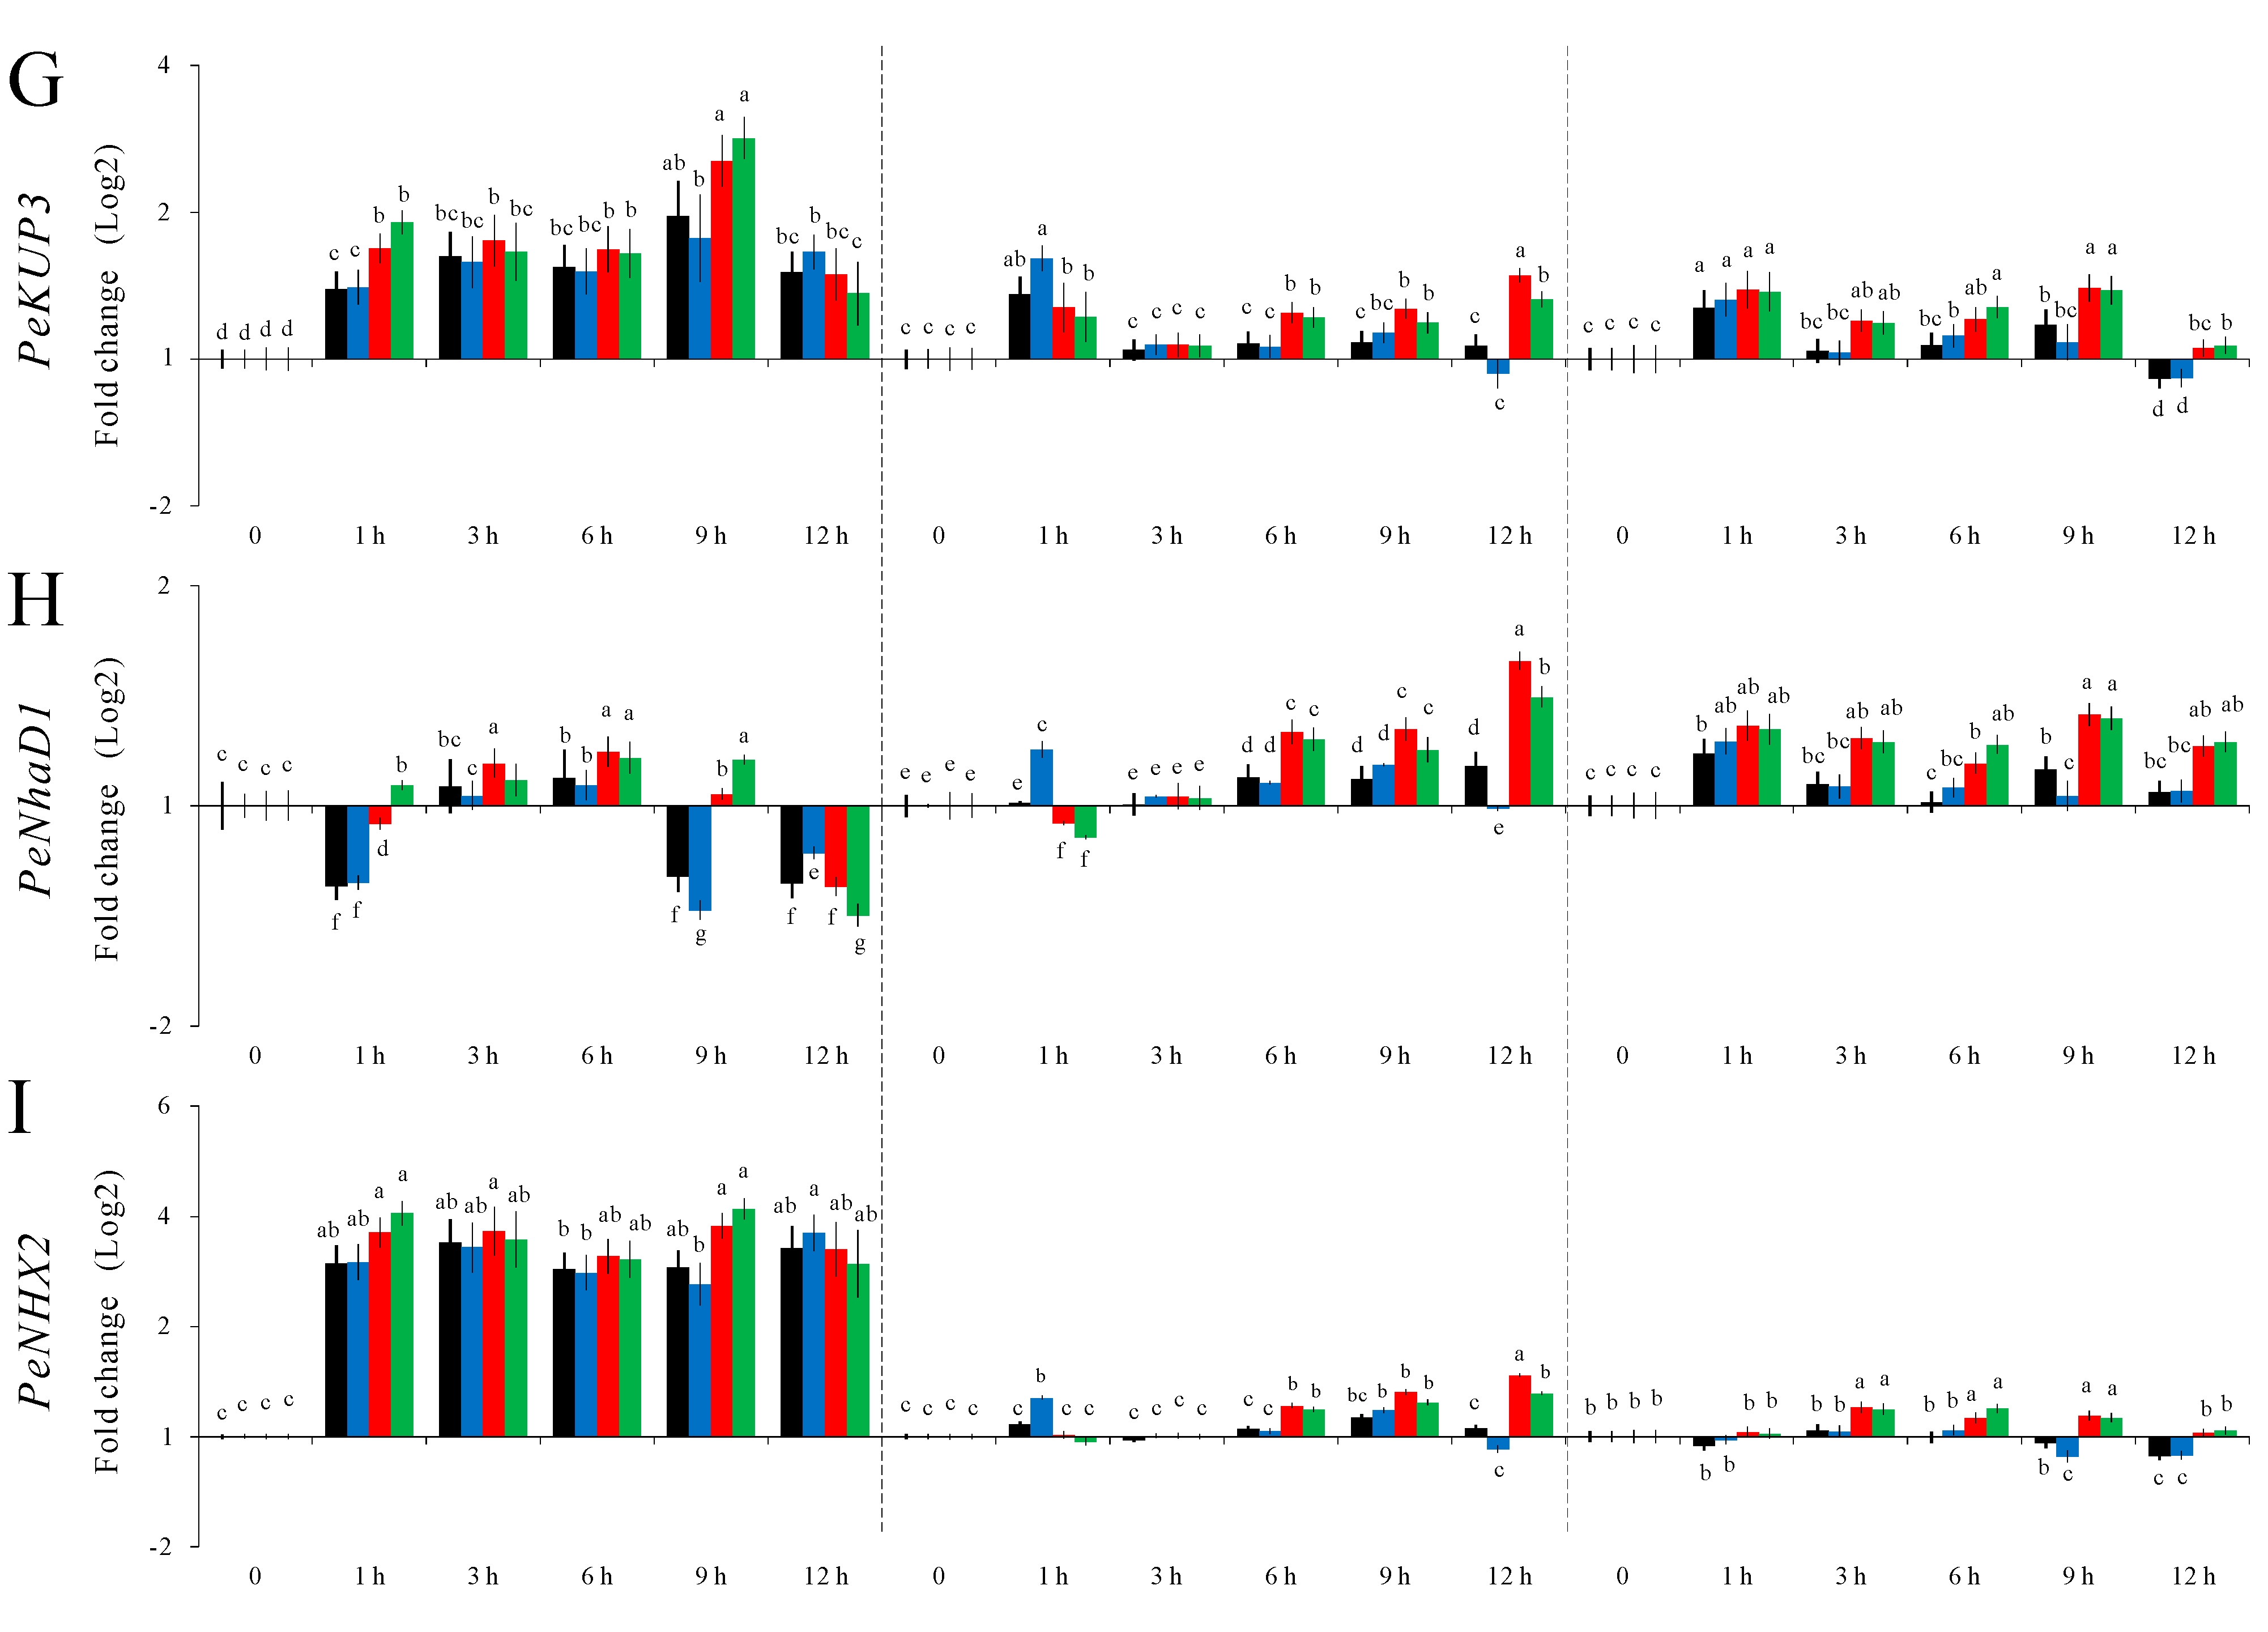
2.4. Validation of the Stability of Selected P. euphratica Reference Genes via Differential Gene Expression Analysis of Nine Putatively Salt Responsive Genes


3. Discussion
4. Experimental Section
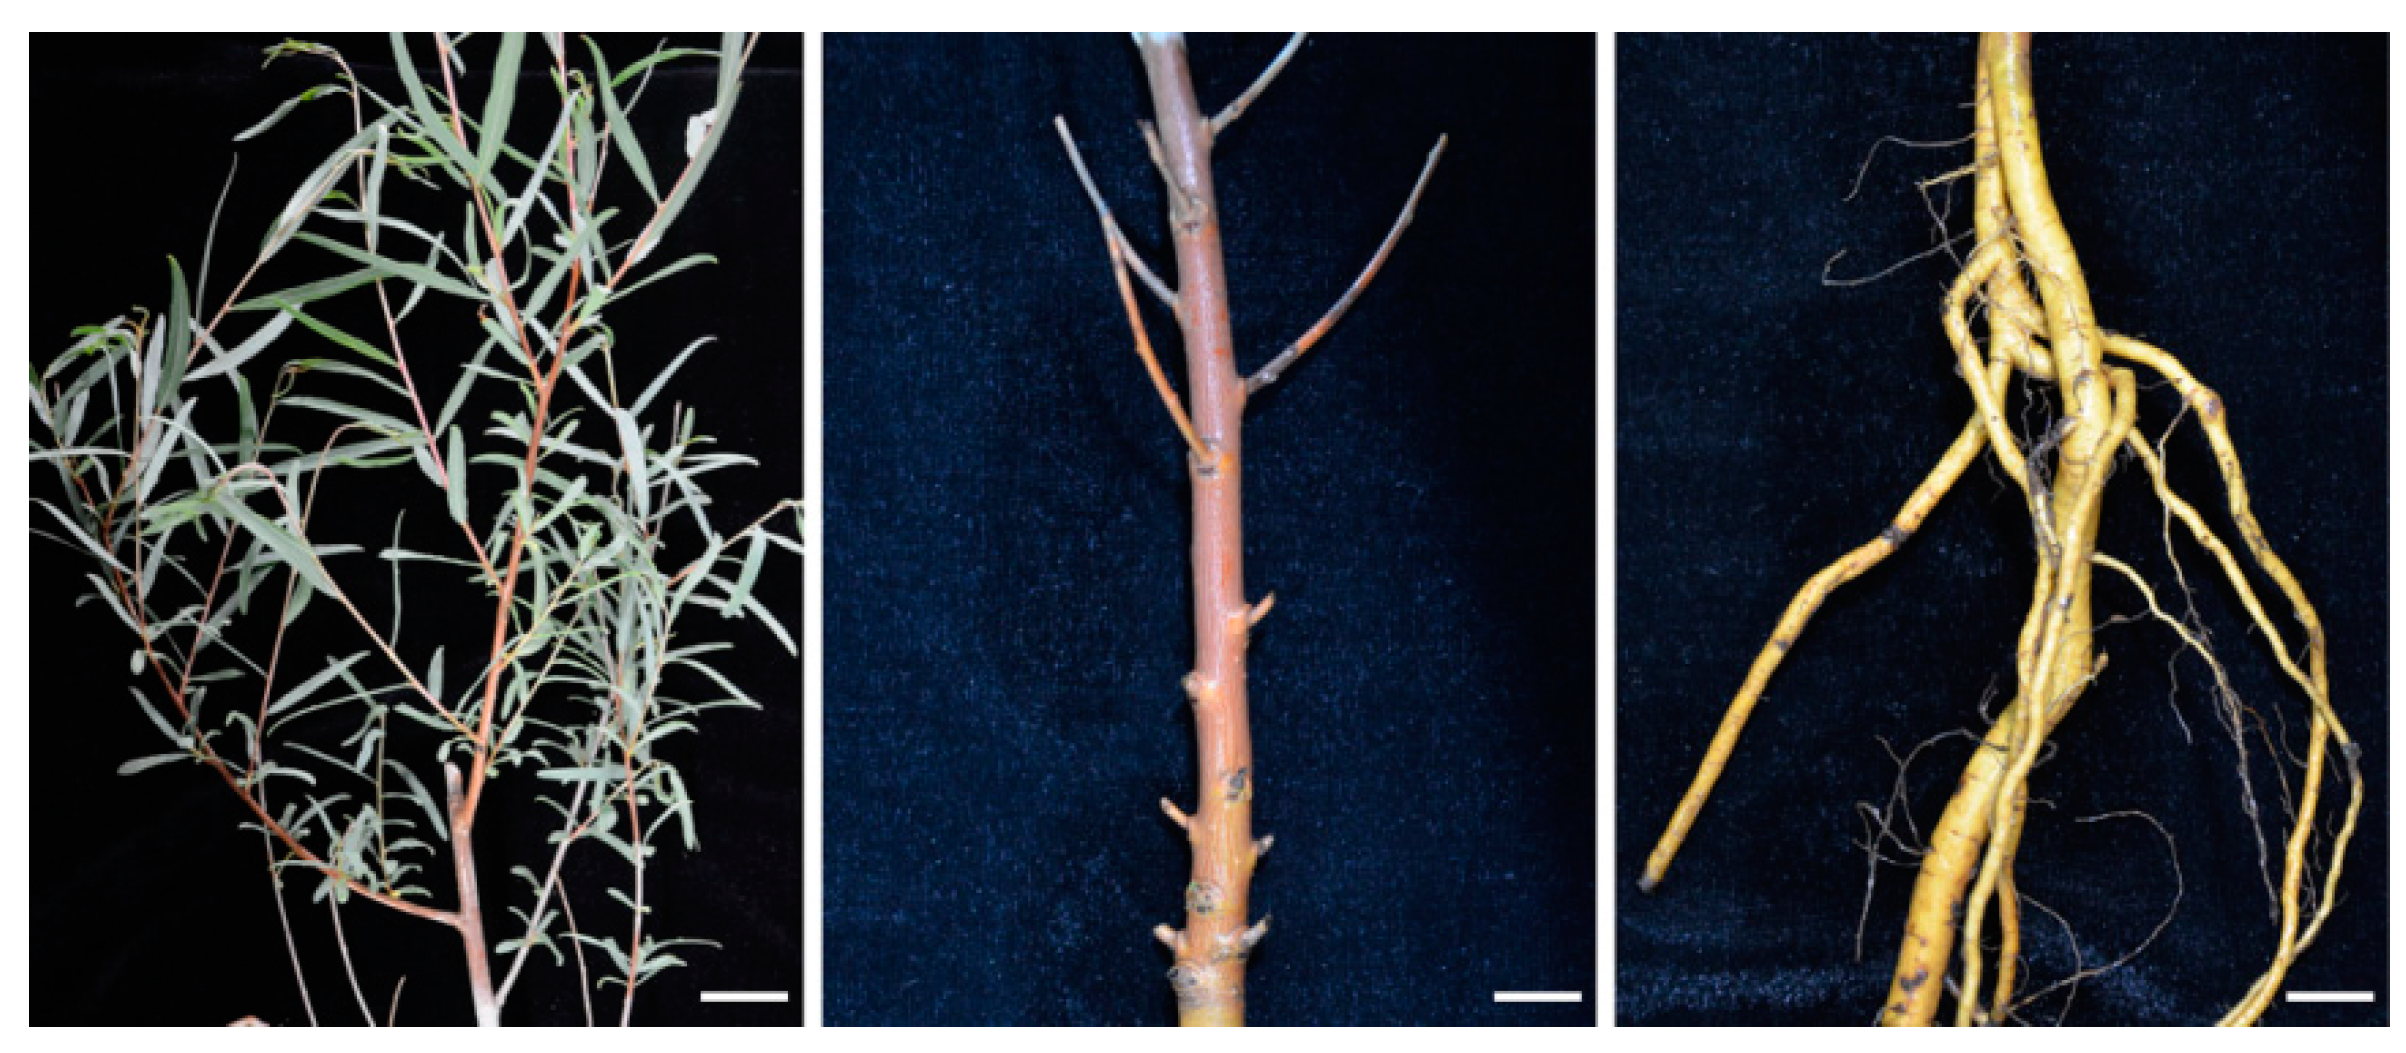
4.1. Plant Materials and Salt Stress Treatment
4.2. RNA Extraction, Quality Control, and cDNA Preparation
4.3. Selection of P. euphratica Candidate Reference Genes and Functional Genes, and Primer Design
4.4. RT-qPCR Reaction Conditions
4.5. Determination of Reference Gene Expression Stability Using ΔCt, NormFinder, geNorm and GrayNorm
4.6. Gene Stability Rankings Merged Using RankAggreg
4.7. Expression Analysis of Nine P. euphratica Functional Genes
5. Conclusions
Supplementary Materials
Acknowledgments
Author Contributions
Conflicts of Interest
References
- Clausen, S.; Apel, K. Seasonal changes in the concentration of the major storage protein and its mRNA in xylem ray cells of poplar trees. Plant Mol. Biol. 1991, 17, 669–678. [Google Scholar] [CrossRef] [PubMed]
- Dixit, R.; Trivedi, P.K.; Nath, P.; Sane, P.V. Organization and post-transcriptional processing of the psb B operon from chloroplasts of Populus deltoides. Curr. Genet. 1999, 36, 165–172. [Google Scholar] [CrossRef] [PubMed]
- Hollick, J.B.; Gordon, M.P. Transgenic analysis of a hybrid poplar wound-inducible promoter reveals developmental patterns of expression similar to that of storage protein genes. Plant Physiol. 1995, 109, 73–85. [Google Scholar] [CrossRef] [PubMed]
- Wu, L.; Joshi, C.P.; Chiang, V.L. A xylem-specific cellulose synthase gene from aspen (Populus tremuloides) is responsive to mechanical stress. Plant J. 2000, 22, 495–502. [Google Scholar] [CrossRef] [PubMed]
- Claire, G.; Annaıck, M.; Benedicte, C. Real-time PCR: What relevance to plant studies? J. Exp. Bot. 2004, 55, 1445–1454. [Google Scholar]
- Hong, S.Y.; Seo, P.J.; Yang, M.S.; Xiang, F.; Park, C.M. Exploring valid reference genes for gene expression studies in Brachypodium distachyon by real-time PCR. BMC Plant Biol. 2008, 8, 112. [Google Scholar] [CrossRef] [PubMed]
- Gutierrez, L.; Mauriat, M.; Pelloux, J.; Bellini, C.; van Wuytswinkel, O. Towards a systematic validation of references in real-time RT-PCR. Plant Cell 2008, 20, 1734–1735. [Google Scholar] [CrossRef] [PubMed]
- Huggett, J.; Dheda, K.; Bustin, S.; Zumla, A. Real-time RT-PCR normalisation; Strategies and considerations. Genes Immun. 2005, 6, 279–284. [Google Scholar] [CrossRef] [PubMed]
- Dheda, K.; Huggett, J.F.; Chang, J.S.; Kim, L.U.; Bustin, S.A.; Johnson, M.A.; Rook, G.A.W.; Zumla, A. The implications of using an inappropriate reference gene for real-time reverse transcription PCR data normalization. Anal. Biochem. 2005, 344, 141–143. [Google Scholar] [CrossRef] [PubMed]
- Pfaffl, M.W.; Tichopad, A.; Prgomet, C.; Neuvians, T.P. Determination of stable housekeeping genes, differentially regulated target genes and sample integrity: BestKeeper—Excel-based tool using pair-wise correlations. Biotechnol. Lett. 2004, 26, 509–515. [Google Scholar] [CrossRef] [PubMed]
- Vandesompele, J.; de Preter, K.; Pattyn, F.; Poppe, B.; van Roy, N.; de Paepe, A.; Speleman, F. Accurate normalization of real-time quantitative RT-PCR data by geometric averaging of multiple internal control genes. Genome Biol. 2002, 3. [Google Scholar] [CrossRef] [Green Version]
- Artico, S.; Nardeli, S.M.; Brilhante, O.; Grossi-de-Sa, M.F.; Alves-Ferreira, M. Identification and evaluation of new reference genes in Gossypium hirsutum for accurate normalization of real-time quantitative RT-PCR data. BMC Plant Biol. 2010, 10, 49. [Google Scholar] [CrossRef] [PubMed]
- Czechowski, T.; Stitt, M.; Altmann, T.; Udvardi, M.K.; Scheible, W.R. Genome-wide identification and testing of superior reference genes for transcript normalization in Arabidopsis. Plant Physiol. 2005, 139, 5–17. [Google Scholar] [CrossRef] [PubMed]
- Lee, P.D.; Sladek, R.; Greenwood, C.M.; Hudson, T.J. Control genes and variability: Absence of ubiquitous reference transcripts in diverse mammalian expression studies. Genome Res. 2002, 12, 292–297. [Google Scholar] [CrossRef] [PubMed]
- Schmittgen, T.D.; Zakrajsek, B.A. Effect of experimental treatment on housekeeping gene expression: Validation by real-time, quantitative RT-PCR. J. Biochem. Biophys. Methods 2000, 46, 69–81. [Google Scholar] [CrossRef]
- Suzuki, T.; Higgins, P.J.; Crawford, D.R. Control selection for RNA quantitation. Biotechniques 2000, 29, 332–337. [Google Scholar] [PubMed]
- Thellin, O.; Zorzi, W.; Lakaye, B.; De Borman, B.; Coumans, B.; Hennen, G.; Grisar, T.; Igout, A.; Heinen, E. Housekeeping genes as internal standards: Use and limits. J. Biotechnol. 1999, 75, 291–295. [Google Scholar] [CrossRef]
- Jian, B.; Liu, B.; Bi, Y.; Hou, W.; Wu, C.; Han, T. Validation of internal control for gene expression study in soybean by quantitative real-time PCR. BMC Mol. Biol. 2008, 9, 59. [Google Scholar] [CrossRef] [PubMed]
- Silveira, E.D.; Alves-Ferreira, M.; Guimaraes, L.A.; da Silva, F.R.; Carneiro, V.T. Selection of reference genes for quantitative real-time PCR expression studies in the apomictic and sexual grass Brachiaria brizantha. BMC Plant Biol. 2009, 9, 84. [Google Scholar] [CrossRef] [PubMed]
- Mallona, I.; Lischewski, S.; Weiss, J.; Hause, B.; Egea-Cortines, M. Validation of reference genes for quantitative real-time PCR during leaf and flower development in Petunia hybrida. BMC Plant Biol. 2010, 10, 4. [Google Scholar] [CrossRef] [PubMed]
- Hao, X.; Horvath, D.P.; Chao, W.S.; Yang, Y.; Wang, X.; Xiao, B. Identification and evaluation of reliable reference genes for quantitative real-time PCR analysis in tea plant (Camellia sinensis (L.) O. Kuntze). Int. J. Mol. Sci. 2014, 15, 22155–22172. [Google Scholar] [CrossRef] [PubMed]
- Street, N.R.; Skogstrom, O.; Sjodin, A.; Tucker, J.; Rodriguez-Acosta, M.; Nilsson, P.; Jansson, S.; Taylor, G. The genetics and genomics of the drought response in Populus. Plant J. 2006, 48, 321–341. [Google Scholar] [CrossRef] [PubMed]
- Tuskan, G.A.; Difazio, S.; Jansson, S.; Bohlmann, J.; Grigoriev, I.; Hellsten, U.; Putnam, N.; Ralph, S.; Rombauts, S.; Salamov, A.; et al. The genome of black cottonwood, Populus trichocarpa (torr. & gray). Science 2006, 313, 1596–1604. [Google Scholar] [PubMed]
- Jansson, S.; Douglas, C.J. Populus: A model system for plant biology. Annu. Rev. Plant Biol. 2007, 58, 435–458. [Google Scholar] [CrossRef] [PubMed]
- Wang, B.; Zhang, D. Association of allelic variation in PtoXET16A with growth and wood properties in Populus tomentosa. Int. J. Mol. Sci. 2014, 15, 16949–16974. [Google Scholar] [CrossRef] [PubMed]
- Ma, T.; Wang, J.Y.; Zhou, G.K.; Yue, Z.; Hu, Q.J.; Chen, Y.; Liu, B.B.; Qiu, Q.; Wang, Z.; Zhang, J.; et al. Genomic insights into salt adaptation in a desert poplar. Nat. Commun. 2014, 4. [Google Scholar] [CrossRef]
- Oh, D.H.; Dassanayake, M.; Bohnert, H.J.; Cheeseman, J.M. Life at the extreme: Lessons from the genome. Genome Biol. 2012, 13. [Google Scholar] [CrossRef]
- Gries, D.; Foetzki, A.; Arndt, S.; Bruelheide, H.; Thomas, F.; Zhang, X.; Runge, M. Growth and water relations of Tamarix ramosissima and Populus euphratica on Taklamakan desert dunes in relation to depth to a permanent water table. Plant Cell Environ. 2003, 26, 725–736. [Google Scholar] [CrossRef]
- Brosche, M.; Vinocur, B.; Alatalo, E.R.; Lamminmaki, A.; Teichmann, T.; Ottow, E.A.; Djilianov, D.; Afif, D.; Bogeat-Triboulot, M.B.; Altman, A.; et al. Gene expression and metabolite profiling of Populus euphratica growing in the Negev desert. Genome Biol. 2005, 6. [Google Scholar] [CrossRef] [PubMed]
- Ottow, E.A.; Brinker, M.; Teichmann, T.; Fritz, E.; Kaiser, W.; Brosche, M.; Kangasjarvi, J.; Jiang, X.; Polle, A. Populus euphratica displays apoplastic sodium accumulation, osmotic adjustment by decreases in calcium and soluble carbohydrates, and develops leaf succulence under salt stress. Plant Physiol. 2005, 139, 1762–1772. [Google Scholar] [CrossRef] [PubMed]
- Gu, R.; Fonseca, S.; Puskas, L.G.; Hackler, L., Jr.; Zvara, A.; Dudits, D.; Pais, M.S. Transcript identification and profiling during salt stress and recovery of Populus euphratica. Tree Physiol. 2004, 24, 265–276. [Google Scholar] [CrossRef] [PubMed]
- Janz, D.; Lautner, S.; Wildhagen, H.; Behnke, K.; Schnitzler, J.P.; Rennenberg, H.; Fromm, J.; Polle, A. Salt stress induces the formation of a novel type of “pressure wood” in two Populus species. New Phytol. 2012, 194, 129–141. [Google Scholar] [CrossRef] [PubMed]
- Wang, R.G.; Chen, S.L.; Deng, L.; Fritz, E.; Huttermann, A.; Polle, A. Leaf photosynthesis, fluorescence response to salinity and the relevance to chloroplast salt compartmentation and anti-oxidative stress in two poplars. Trees-Struct. Funct. 2007, 21, 581–591. [Google Scholar] [CrossRef]
- Chen, J.H.; Xia, X.L.; Yin, W.W. Expression profiling and functional characterization of a DREB2-type gene from Populus euphratica. Biochem. Biophys. Res. Commun. 2009, 378, 483–487. [Google Scholar] [CrossRef] [PubMed]
- Han, Y.; Wang, W.; Sun, J.; Ding, M.; Zhao, R.; Deng, S.; Wang, F.; Hu, Y.; Wang, Y.; Lu, Y.; et al. Populus euphratica XTH overexpression enhances salinity tolerance by the development of leaf succulence in transgenic tobacco plants. J. Exp. Bot. 2013, 64, 4225–4238. [Google Scholar] [CrossRef] [PubMed]
- Li, B.; Duan, H.; Li, J.; Deng, X.W.; Yin, W.; Xia, X. Global identification of miRNAs and targets in Populus euphratica under salt stress. Plant Mol. Biol. 2013, 81, 525–539. [Google Scholar] [CrossRef] [PubMed]
- Qin, Y.; Duan, Z.; Xia, X.; Yin, W. Expression profiles of precursor and mature microRNAs under dehydration and high salinity shock in Populus euphratica. Plant Cell Rep. 2011, 30, 1893–1907. [Google Scholar] [CrossRef] [PubMed]
- Qiu, Q.; Ma, T.; Hu, Q.; Liu, B.; Wu, Y.; Zhou, H.; Wang, Q.; Wang, J.; Liu, J. Genome-scale transcriptome analysis of the desert poplar, Populus euphratica. Tree Physiol. 2011, 31, 452–461. [Google Scholar] [CrossRef] [PubMed]
- Ding, M.; Hou, P.; Shen, X.; Wang, M.; Deng, S.; Sun, J.; Xiao, F.; Wang, R.; Zhou, X.; Lu, C.; et al. Salt-induced expression of genes related to Na+/K+ and ROS homeostasis in leaves of salt-resistant and salt-sensitive poplar species. Plant Mol. Biol. 2010, 73, 251–269. [Google Scholar] [CrossRef] [PubMed]
- Xu, M.; Zhang, B.; Su, X.; Zhang, S.; Huang, M. Reference gene selection for quantitative real-time polymerase chain reaction in Populus. Anal. Biochem. 2011, 408, 337–339. [Google Scholar] [CrossRef] [PubMed]
- Wang, H.L.; Chen, J.H.; Tian, Q.Q.; Wang, S.; Xia, X.L.; Yin, W.L. Identification and validation of reference genes for Populus euphratica gene expression analysis during abiotic stresses by quantitative real-time PCR. Physiol. Plant 2014, 152, 529–545. [Google Scholar] [CrossRef] [PubMed]
- Silver, N.; Best, S.; Jiang, J.; Thein, S.L. Selection of housekeeping genes for gene expression studies in human reticulocytes using real-time PCR. BMC Mol. Biol. 2006, 7, 33. [Google Scholar] [CrossRef] [PubMed]
- Andersen, C.L.; Jensen, J.L.; Orntoft, T.F. Normalization of real-time quantitative reverse transcription-PCR data: A model-based variance estimation approach to identify genes suited for normalization, applied to bladder and colon cancer data sets. Cancer Res. 2004, 64, 5245–5250. [Google Scholar] [CrossRef] [PubMed]
- De Almeida, M.R.; Ruedell, C.M.; Ricachenevsky, F.K.; Sperotto, R.A.; Pasquali, G.; Fett-Neto, A.G. Reference gene selection for quantitative reverse transcription-polymerase chain reaction normalization during in vitro adventitious rooting in Eucalyptus globulus Labill. BMC Mol. Biol. 2010, 11, 73. [Google Scholar] [CrossRef] [PubMed]
- Ling, D.; Salvaterra, P.M. Robust RT-qPCR data normalization: Validation and selection of internal reference genes during post-experimental data analysis. PLoS ONE 2011, 6, e17762. [Google Scholar] [CrossRef] [PubMed]
- Remans, T.; Keunen, E.; Bex, G.J.; Smeets, K.; Vangronsveld, J.; Cuypers, A. Reliable gene expression analysis by reverse transcription-quantitative PCR: Reporting and minimizing the uncertainty in data accuracy. Plant Cell 2014, 26, 3829–3837. [Google Scholar] [CrossRef] [PubMed]
- Goncalves, S.; Cairney, J.; Maroco, J.; Oliveira, M.M.; Miguel, C. Evaluation of control transcripts in real-time RT-PCR expression analysis during maritime pine embryogenesis. Planta 2005, 222, 556–563. [Google Scholar] [CrossRef] [PubMed]
- Chang, E.; Shi, S.; Liu, J.; Cheng, T.; Xue, L.; Yang, X.; Yang, W.; Lan, Q.; Jiang, Z. Selection of reference genes for quantitative gene expression studies in Platycladus orientalis (cupressaceae) using real-time PCR. PLoS ONE 2012, 7, e33278. [Google Scholar] [CrossRef] [PubMed]
- De Oliveira, L.A.; Breton, M.C.; Bastolla, F.M.; Camargo Sda, S.; Margis, R.; Frazzon, J.; Pasquali, G. Reference genes for the normalization of gene expression in Eucalyptus species. Plant Cell Physiol. 2012, 53, 405–422. [Google Scholar] [CrossRef] [PubMed]
- Zhang, L.; He, L.L.; Fu, Q.T.; Xu, Z.F. Selection of reliable reference genes for gene expression studies in the biofuel plant Jatropha curcas using real-time quantitative PCR. Int. J. Mol. Sci. 2013, 14, 24338–24354. [Google Scholar] [CrossRef] [PubMed]
- Brunner, A.M.; Yakovlev, I.A.; Strauss, S.H. Validating internal controls for quantitative plant gene expression studies. BMC Plant Biol. 2004, 4, 14. [Google Scholar] [CrossRef] [PubMed] [Green Version]
- Hellemans, J.; Mortier, G.; de Paepe, A.; Speleman, F.; Vandesompele, J. qBase relative quantification framework and software for management and automated analysis of real-time quantitative PCR data. Genome Biol. 2007, 8, R19. [Google Scholar] [CrossRef] [PubMed]
- Xie, F.; Xiao, P.; Chen, D.; Xu, L.; Zhang, B. Mirdeepfinder: A miRNA analysis tool for deep sequencing of plant small RNAs. Plant Mol. Biol. 2012, 80, 75–84. [Google Scholar] [CrossRef] [PubMed]
- GenEx. Multid Analyses. Available online: http://www.multid.se/ (accessed on 18 May 2012).
- Nicot, N.; Hausman, J.F.; Hoffmann, L.; Evers, D. Housekeeping gene selection for real-time RT-PCR normalization in potato during biotic and abiotic stress. J. Exp. Bot. 2005, 56, 2907–2914. [Google Scholar] [CrossRef] [PubMed]
- Jain, M.; Nijhawan, A.; Tyagi, A.K.; Khurana, J.P. Validation of housekeeping genes as internal control for studying gene expression in rice by quantitative real-time PCR. Biochem. Biophys. Res. Commun. 2006, 345, 646–651. [Google Scholar] [CrossRef] [PubMed]
- Narsai, R.; Ivanova, A.; Ng, S.; Whelan, J. Defining reference genes in Oryza sativa using organ, development, biotic and abiotic transcriptome datasets. BMC Plant Biol. 2010, 10, 56. [Google Scholar] [CrossRef] [PubMed]
- Borowski, J.M.; Galli, V.; Messias, R.D.; Perin, E.C.; Buss, J.H.; dos Anjos e Silva, S.D.; Rombaldi, C.V. Selection of candidate reference genes for real-time PCR studies in lettuce under abiotic stresses. Planta 2014, 239, 1187–1200. [Google Scholar] [CrossRef] [PubMed]
- Remans, T.; Smeets, K.; Opdenakker, K.; Mathijsen, D.; Vangronsveld, J.; Cuypers, A. Normalisation of real-time RT-PCR gene expression measurements in Arabidopsis thaliana exposed to increased metal concentrations. Planta 2008, 227, 1343–1349. [Google Scholar] [CrossRef] [PubMed]
- Bogeat-Triboulot, M.B.; Brosche, M.; Renaut, J.; Jouve, L.; Le Thiec, D.; Fayyaz, P.; Vinocur, B.; Witters, E.; Laukens, K.; Teichmann, T.; et al. Gradual soil water depletion results in reversible changes of gene expression, protein profiles, ecophysiology, and growth performance in Populus euphratica, a poplar growing in arid regions. Plant Physiol. 2007, 143, 876–892. [Google Scholar] [CrossRef] [PubMed]
- Zhu, J.K. Salt and drought stress signal transduction in plants. Annu. Rev. Plant Biol. 2002, 53, 247–273. [Google Scholar] [CrossRef] [PubMed]
- Reid, K.E.; Olsson, N.; Schlosser, J.; Peng, F.; Lund, S.T. An optimized grapevine RNA isolation procedure and statistical determination of reference genes for real-time RT-PCR during berry development. BMC Plant Biol. 2006, 6, 27. [Google Scholar] [CrossRef] [PubMed]
- Lovdal, T.; Lillo, C. Reference gene selection for quantitative real-time PCR normalization in tomato subjected to nitrogen, cold, and light stress. Anal. Biochem. 2009, 387, 238–242. [Google Scholar] [CrossRef] [PubMed]
- Willems, E.; Mateizel, I.; Kemp, C.; Cauffman, G.; Sermon, K.; Leyns, L. Selection of reference genes in mouse embryos and in differentiating human and mouse ES cells. Int. J. Dev. Biol. 2006, 50, 627–635. [Google Scholar] [CrossRef] [PubMed]
- Eric A, O.; Andrea, P.; Mikael, B.; Jaakko, K.; Pavel, D.; Christian, Z.; Thomas, T. Molecular characterization of PeNhaD1: The first member of the NhaD Na+/H+ antiporter family of plant origin. Plant Mol. Biol. 2005, 58, 75–88. [Google Scholar]
- Ye, C.Y.; Zhang, H.C.; Chen, J.H.; Xia, X.L.; Yin, W.L. Molecular characterization of putative vacuolar NHX-type Na+/H+ exchanger genes from the salt-resistant tree Populus euphratica. Physiol. Plant 2009, 137, 166–174. [Google Scholar] [CrossRef] [PubMed]
- Nolan, T.; Hands, R.E.; Bustin, S.A. Quantification of mRNA using real-time RT-PCR. Nat. Protoc. 2006, 1, 1559–1582. [Google Scholar] [CrossRef] [PubMed]
- Bustin, S.A.; Benes, V.; Garson, J.A.; Hellemans, J.; Huggett, J.; Kubista, M.; Mueller, R.; Nolan, T.; Pfaffl, M.W.; Shipley, G.L.; et al. The MIQE guidelines: Minimum information for publication of quantitative real-time PCR experiments. Clin. Chem. 2009, 55, 611–622. [Google Scholar] [CrossRef] [PubMed]
- Chang, S.; Puryear, J.; Cairney, J. A simple and efficient method for isolating RNA from pine trees. Plant Mol. Biol. Rep. 1993, 11, 113–116. [Google Scholar] [CrossRef]
- Zeng, F.; Yan, H.; Arndt, S.K. Leaf and whole tree adaptations to mild salinity in field grown Populus euphratica. Tree Physiol. 2009, 29, 1237–1246. [Google Scholar] [CrossRef] [PubMed]
- Chen, S.; Polle, A. Salinity tolerance of Populus. Plant Biol. 2010, 12, 317–333. [Google Scholar] [CrossRef] [PubMed]
- Myburg, A.A.; Grattapaglia, D.; Tuskan, G.A.; Hellsten, U.; Hayes, R.D.; Grimwood, J.; Jenkins, J.; Lindquist, E.; Tice, H.; Bauer, D.; et al. The genome of Eucalyptus grandis. Nature 2014, 510, 356–362. [Google Scholar] [CrossRef] [PubMed] [Green Version]
- Goulao, L.F.; Fortunato, A.S.; Ramalho, J. Selection of reference genes for normalizing quantitative real-time PCR gene expression data with multiple variables in Coffea spp. Plant Mol. Biol. Rep. 2011, 30, 741–759. [Google Scholar] [CrossRef]
- Pihur, V.; Datta, S.; Datta, S. RankAggreg, an R package for weighted rank aggregation. BMC Bioinform. 2009, 10, 62. [Google Scholar] [CrossRef] [PubMed]
- Wu, H.J.; Zhang, Z.; Wang, J.Y.; Oh, D.H.; Dassanayake, M.; Liu, B.; Huang, Q.; Sun, H.X.; Xia, R.; Wu, Y.; et al. Insights into salt tolerance from the genome of Thellungiella salsuginea. Proc. Natl. Acad. Sci. USA 2012, 109, 12219–12224. [Google Scholar] [CrossRef] [PubMed]
- Dassanayake, M.; Oh, D.H.; Haas, J.S.; Hernandez, A.; Hong, H.; Ali, S.; Yun, D.J.; Bressan, R.A.; Zhu, J.K.; Bohnert, H.J.; et al. The genome of the extremophile crucifer Thellungiella parvula. Nat. Genet. 2011, 43, 913–918. [Google Scholar] [CrossRef] [PubMed]
© 2015 by the authors; licensee MDPI, Basel, Switzerland. This article is an open access article distributed under the terms and conditions of the Creative Commons Attribution license (http://creativecommons.org/licenses/by/4.0/).
Share and Cite
Wang, H.-L.; Li, L.; Tang, S.; Yuan, C.; Tian, Q.; Su, Y.; Li, H.-G.; Zhao, L.; Yin, W.; Zhao, R.; et al. Evaluation of Appropriate Reference Genes for Reverse Transcription-Quantitative PCR Studies in Different Tissues of a Desert Poplar via Comparision of Different Algorithms. Int. J. Mol. Sci. 2015, 16, 20468-20491. https://doi.org/10.3390/ijms160920468
Wang H-L, Li L, Tang S, Yuan C, Tian Q, Su Y, Li H-G, Zhao L, Yin W, Zhao R, et al. Evaluation of Appropriate Reference Genes for Reverse Transcription-Quantitative PCR Studies in Different Tissues of a Desert Poplar via Comparision of Different Algorithms. International Journal of Molecular Sciences. 2015; 16(9):20468-20491. https://doi.org/10.3390/ijms160920468
Chicago/Turabian StyleWang, Hou-Ling, Lan Li, Sha Tang, Chao Yuan, Qianqian Tian, Yanyan Su, Hui-Guang Li, Lin Zhao, Weilun Yin, Rui Zhao, and et al. 2015. "Evaluation of Appropriate Reference Genes for Reverse Transcription-Quantitative PCR Studies in Different Tissues of a Desert Poplar via Comparision of Different Algorithms" International Journal of Molecular Sciences 16, no. 9: 20468-20491. https://doi.org/10.3390/ijms160920468