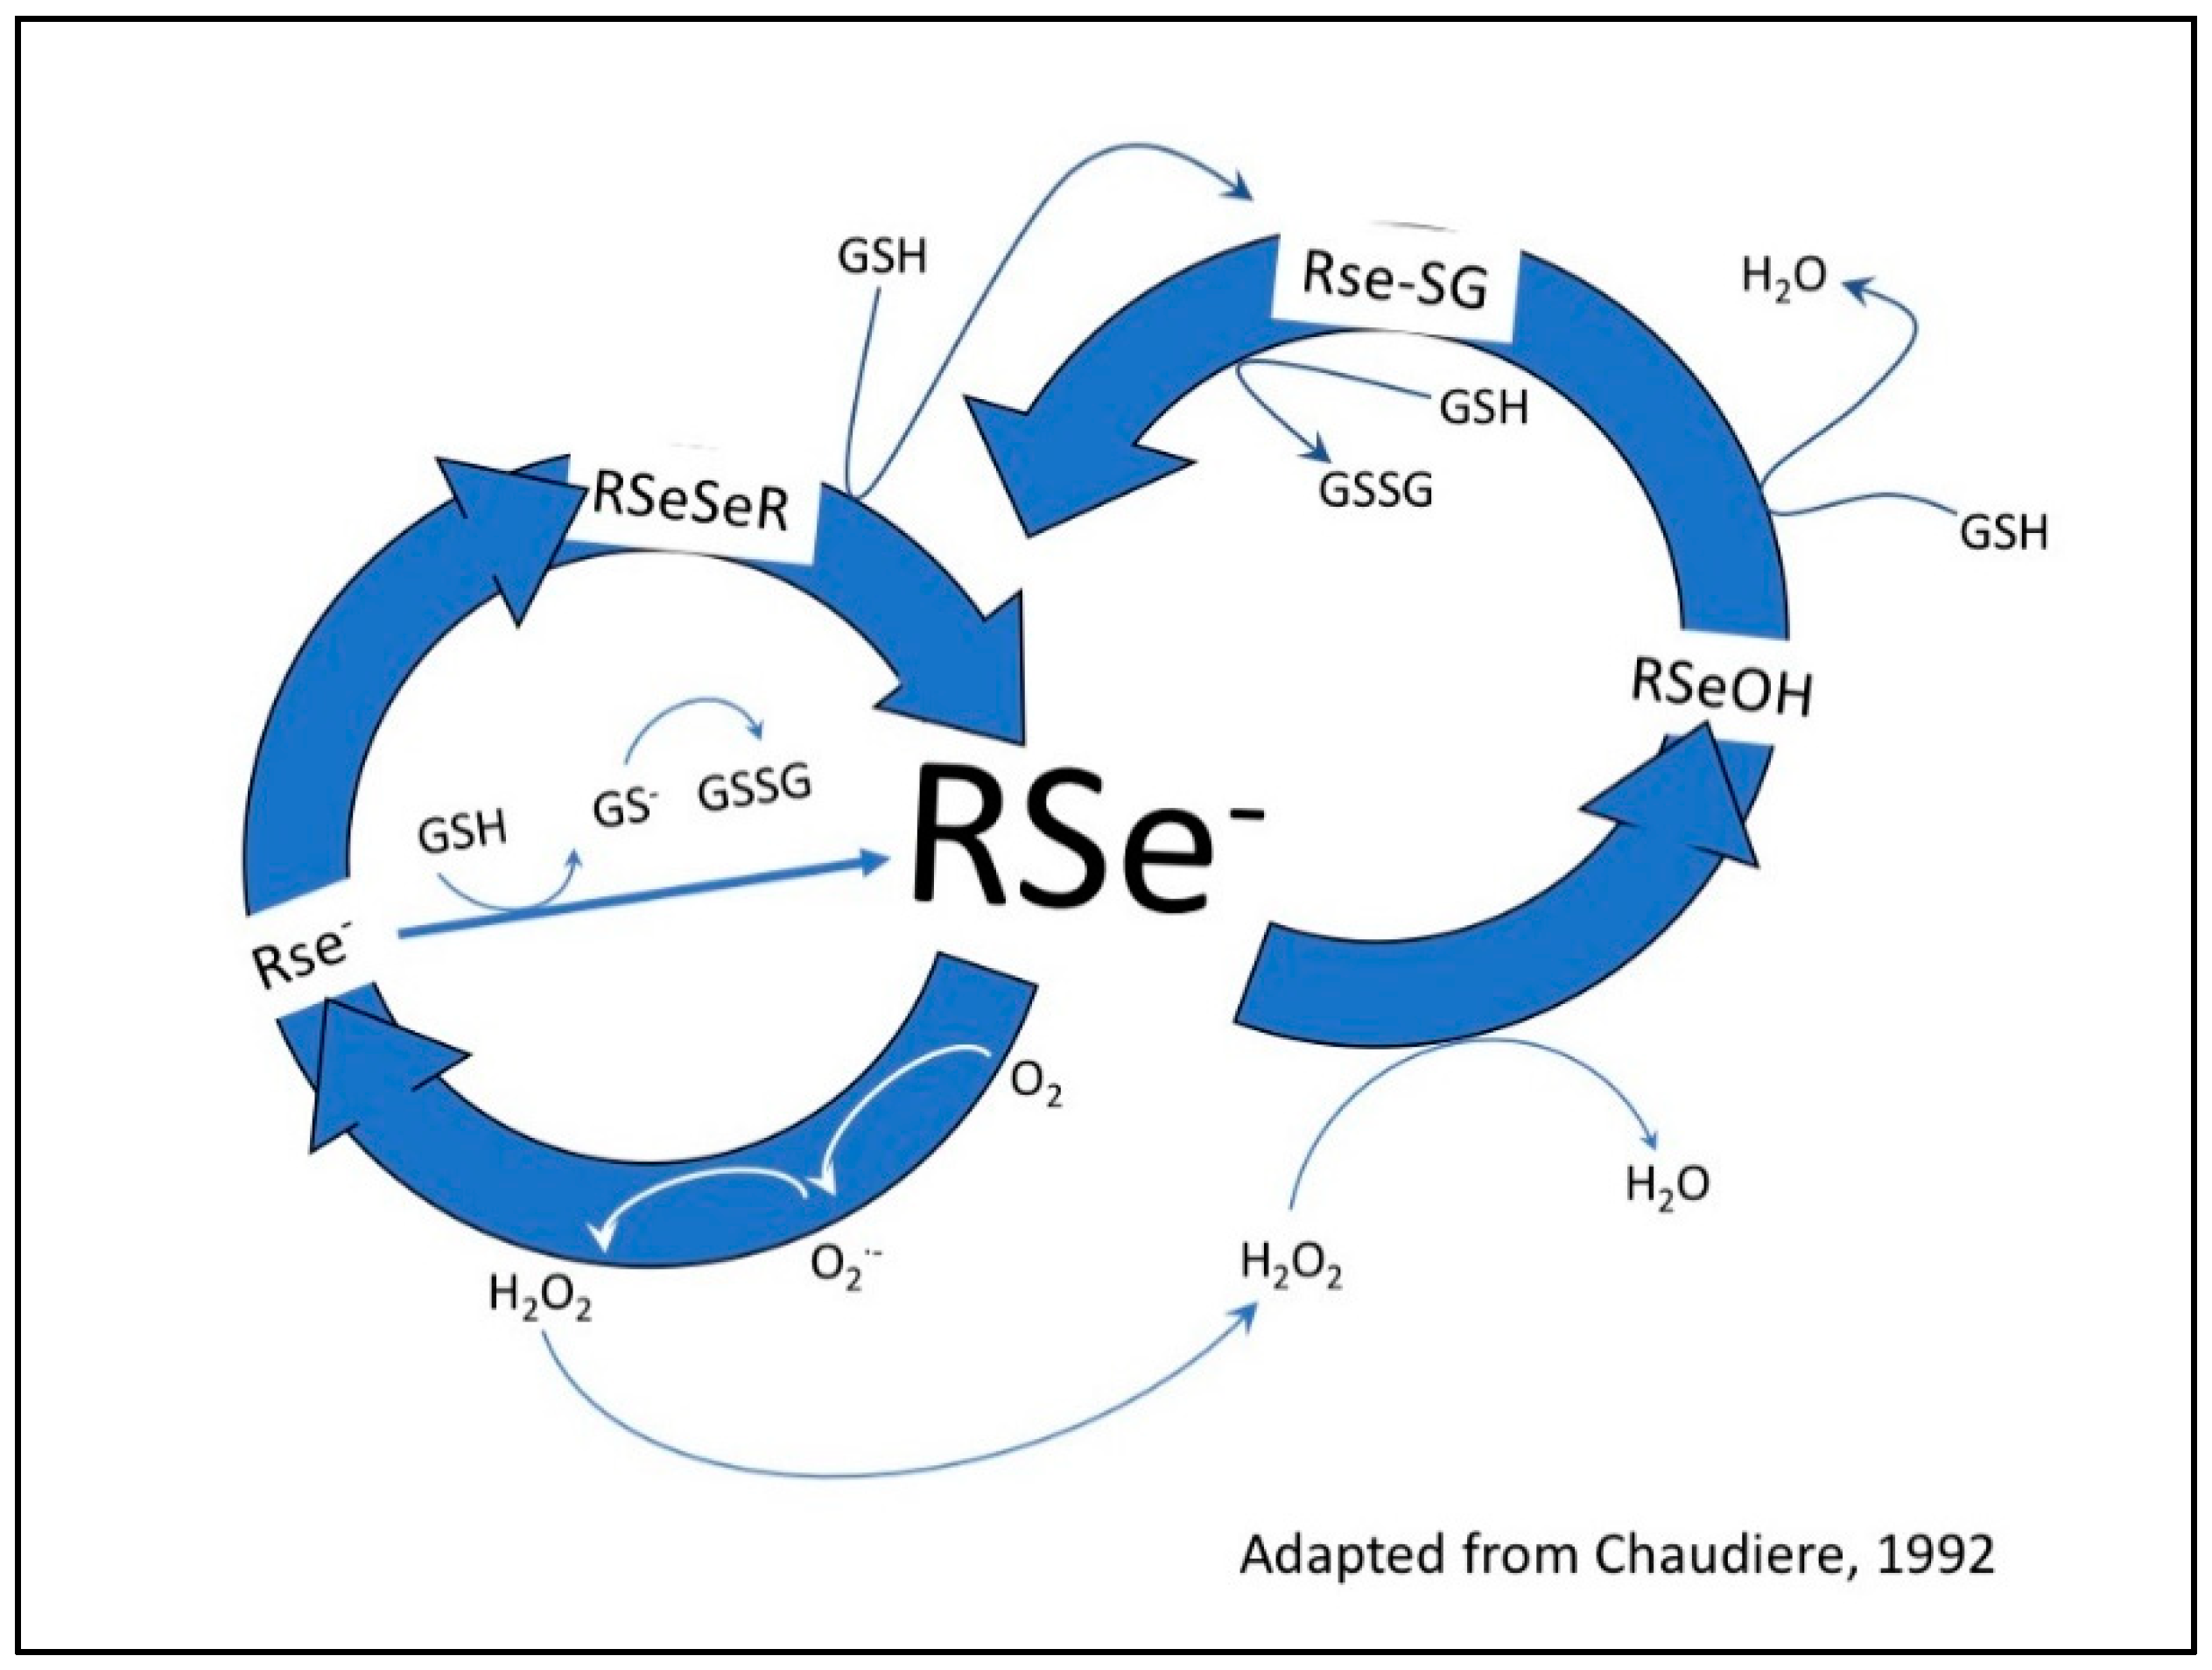
Figure 1.
Redox cycling between selenium compounds and GSH. Glutathione (GSH) and other thiols reduce diselenides (RSeSeR) to selenenylsulfides (RSe-SG) and form the RSe− a catalytic species. The one electron transfer from RSe− to oxygen (O2) yields superoxide (O2•−) and a selenyl radical (RSe−). The superoxide is converted to hydrogen peroxide (H2O2) by superoxide dismutase. The hydrogen peroxide is reduced to water—this is the antioxidant property of glutathione peroxidase (GPx), forming a selenolate (RSeOH), which is associated with decay of the selenyl radical to diselenides. This happens at low concentrations of selenium. At high concentrations, RSe− oxidizes GSH to oxidized glutathione (GSSG), producing superoxide, which in turn depletes the intracellular GSH concentration and the cell is subjected to oxidative stress, the basis of selenium toxicity.
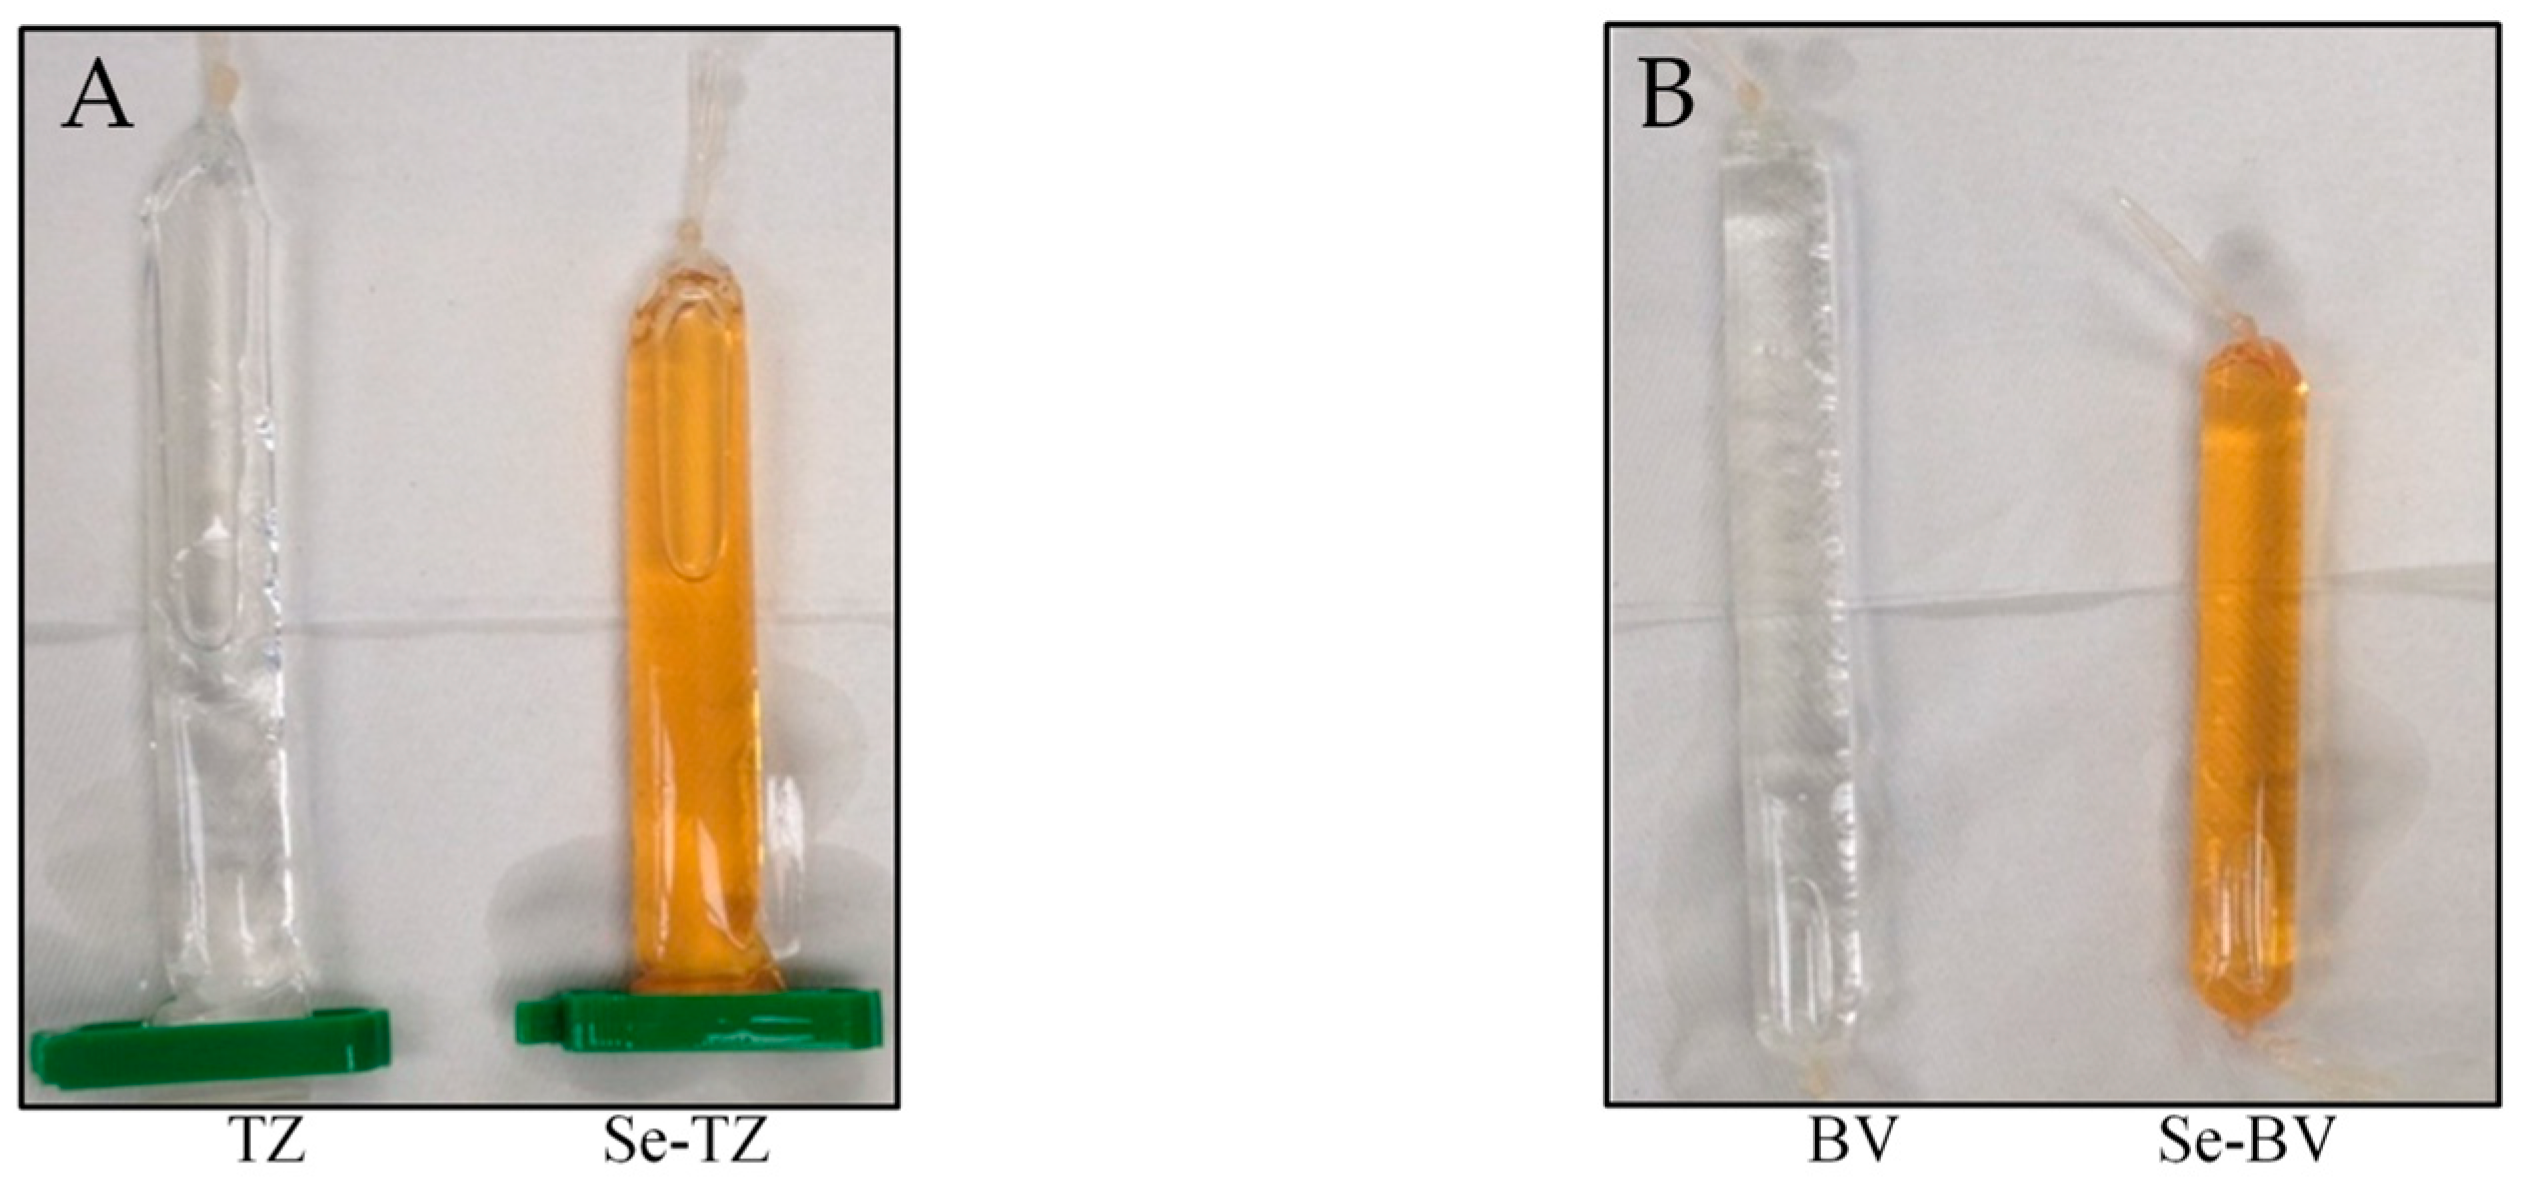
Figure 2.
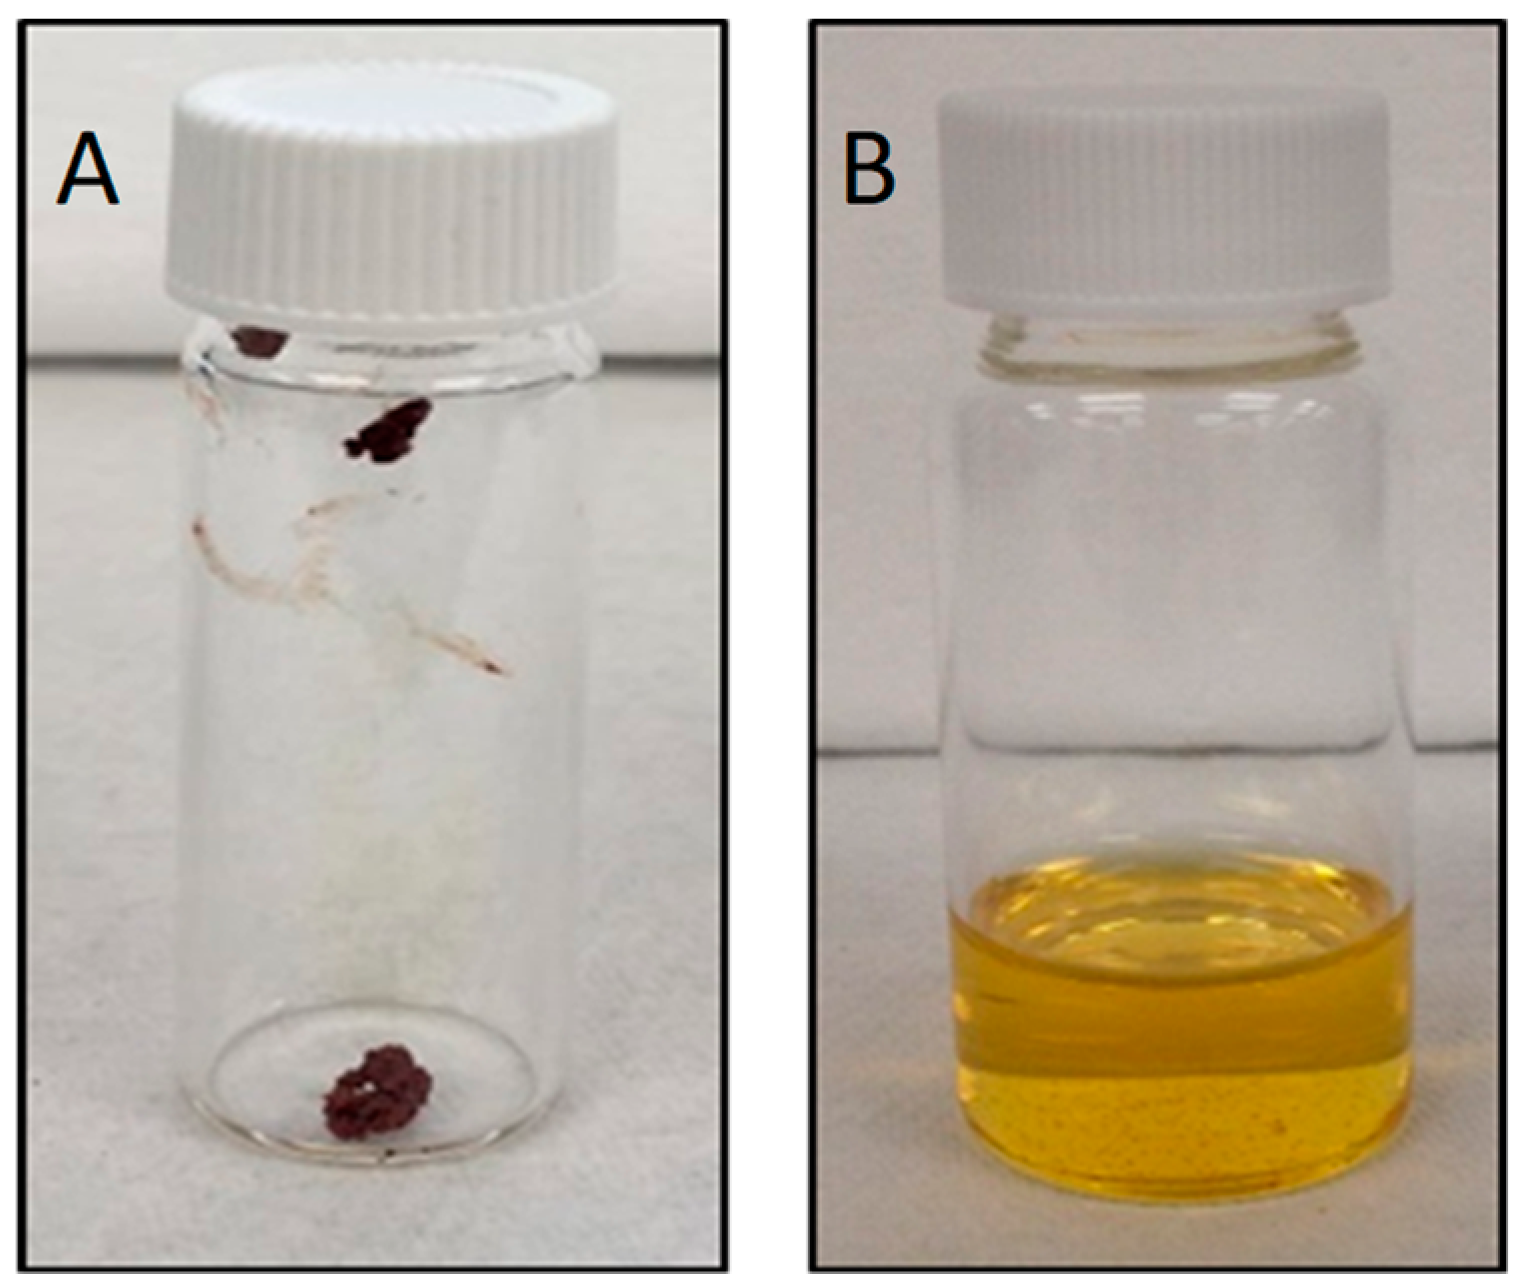
Dialyzed selenium-conjugated antibody products. After 72 h of conjugation time in pH 8.5 borate buffer after 72 h of dialysis against PBS pH 7.4, an orange color was observed for both selenium-antibody reactions. (A) Trastuzumab and Selenotrastuzumab. (B) Bevacizumab and Selenobevacizumab.
Figure 2.
Dialyzed selenium-conjugated antibody products. After 72 h of conjugation time in pH 8.5 borate buffer after 72 h of dialysis against PBS pH 7.4, an orange color was observed for both selenium-antibody reactions. (A) Trastuzumab and Selenotrastuzumab. (B) Bevacizumab and Selenobevacizumab.
Figure 3.
SDS-PAGE of Native and Se-conjugated mAbs under reducing conditions followed by Coomassie Blue R-250 staining. Lane 1: Kadcyla® 20 µg; Lane 2: Marker; Lane 3: BV 5 µg; Lane 4: BV 10 µg; Lane 5: BV 20 µg; Lane 6: Se-BV 5 µg; Lane 7: Se-BV 10 µg; Lane 8: Se-BV 20 µg; Lane 9: TZ 5 µg; Lane 10: TZ 10 µg; Lane 11: TZ 20 µg, Lane 12: Se-TZ 10 µg; Lane 13: Se-TZ 20 µg; Lane 14: Gamma globulin 20 µg. (BV: Bevacizumab, Se-BV: Selenobevacizumab, TZ: Trastuzumab, Se-TZ: Selenotrastuzumab).
Figure 4.
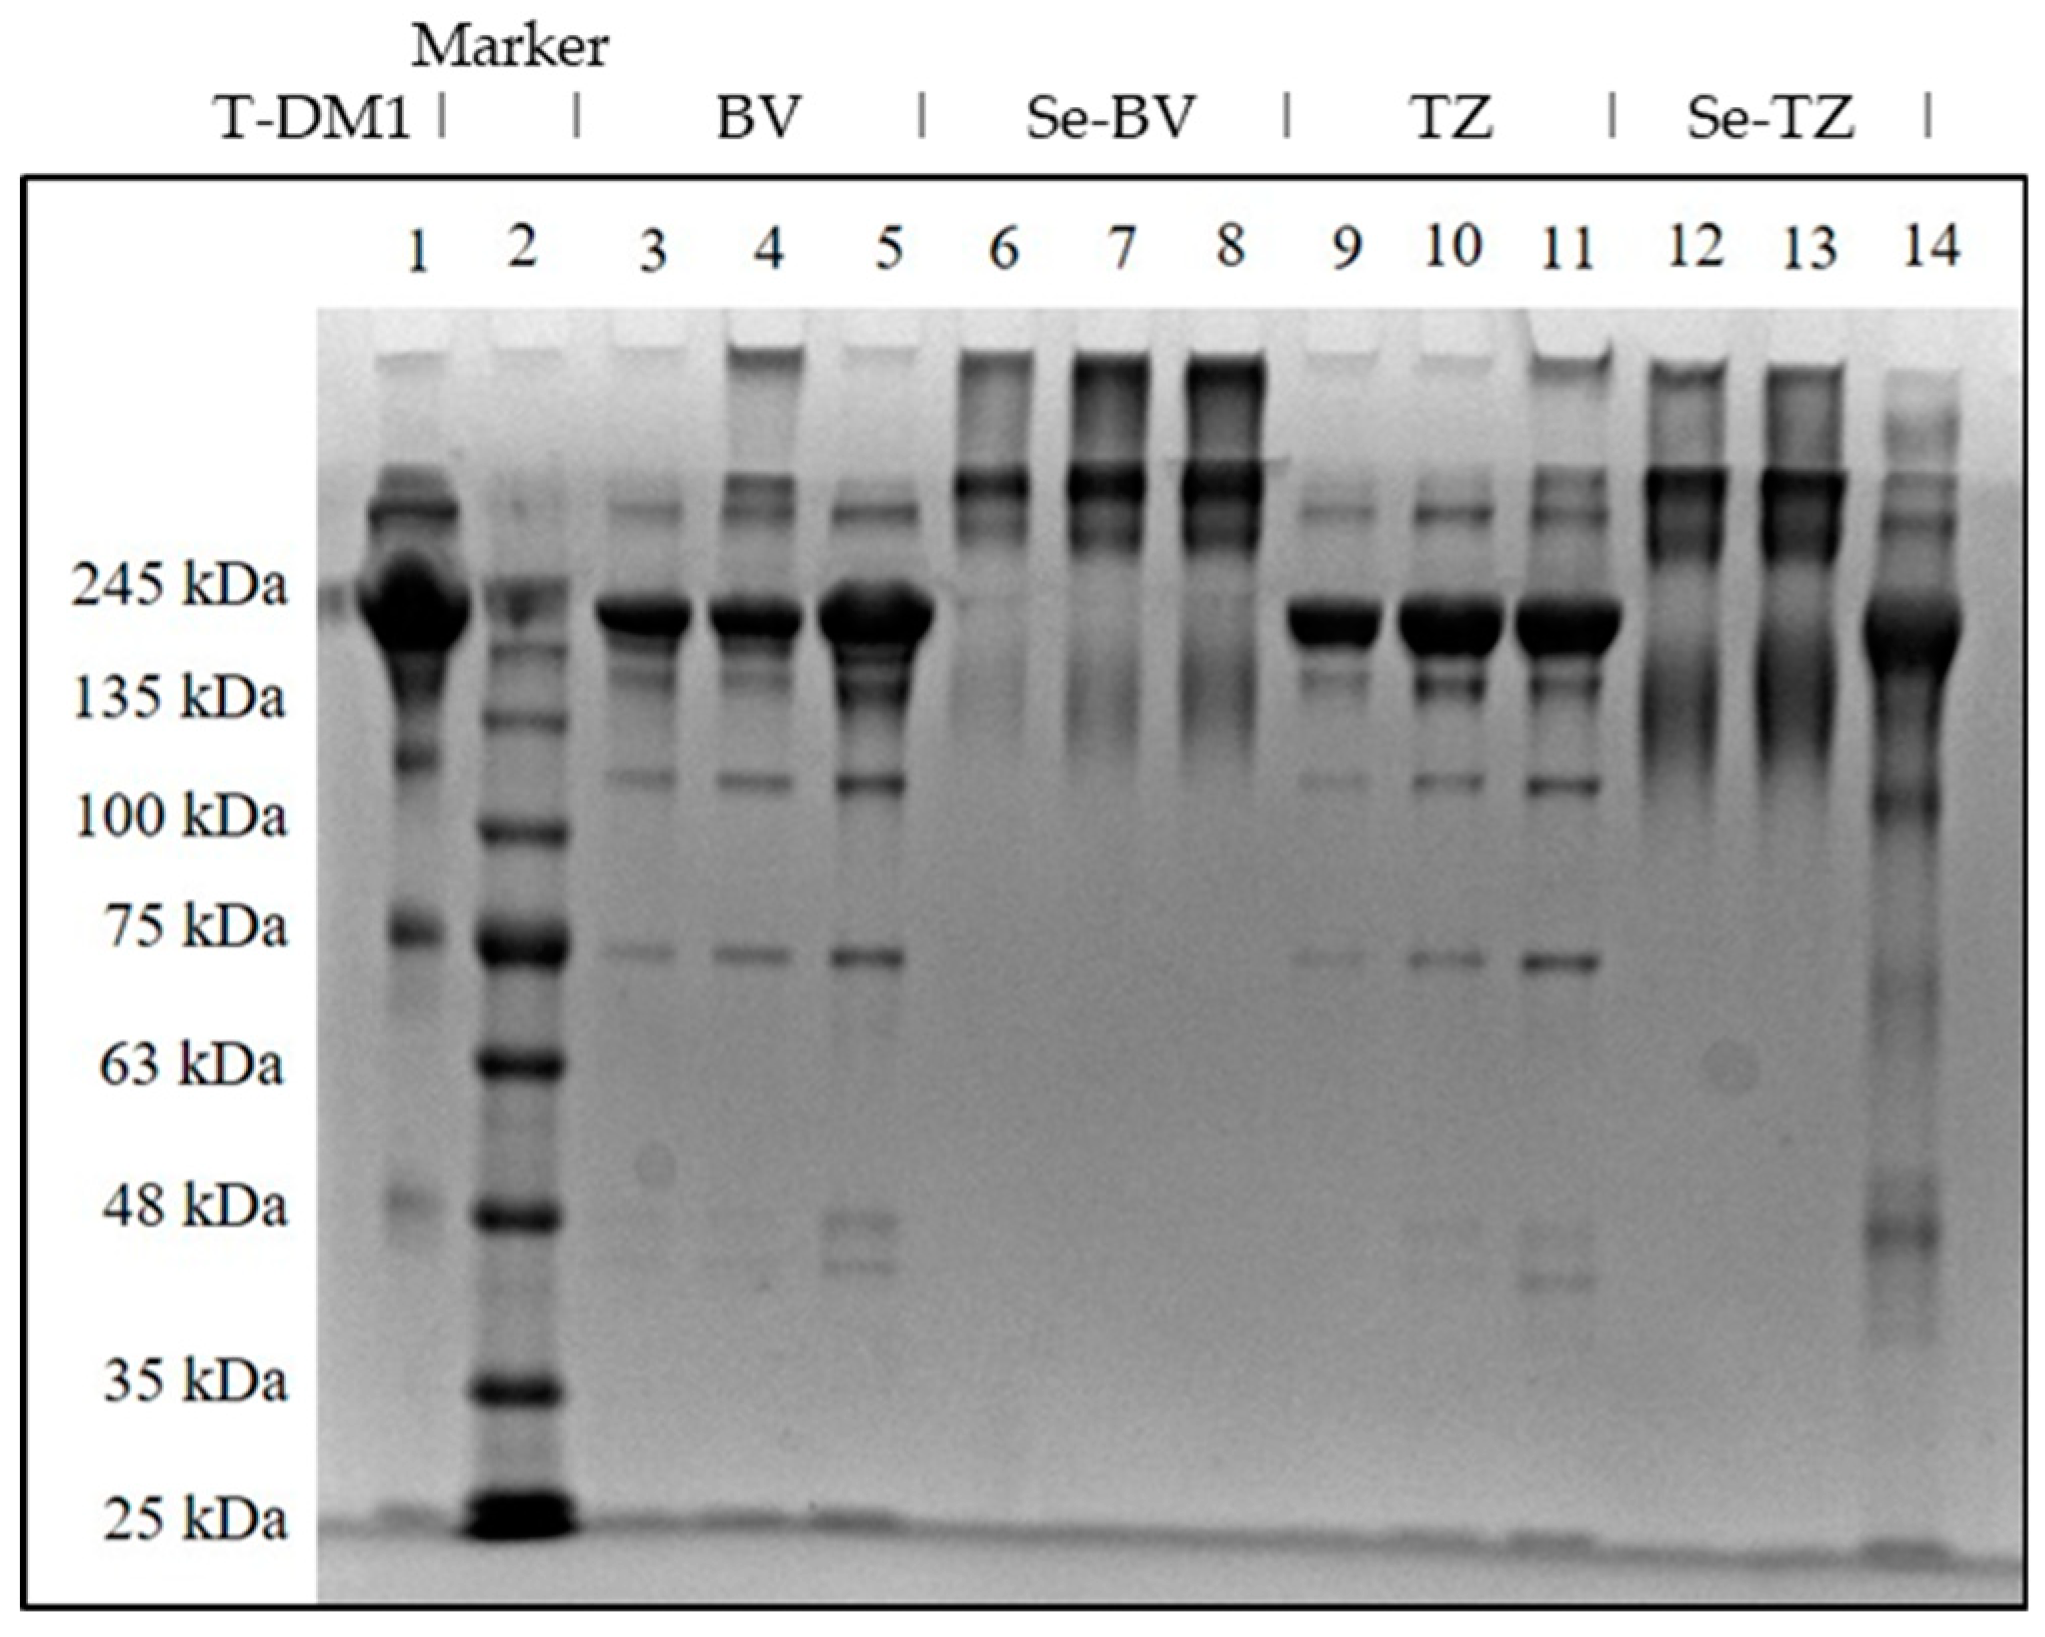
mAb migration on 4–20% Tris-Glycine PAGE gel under non-reducing conditions followed by Coomassie Blue R-250 stain. The image was taken using a Coomassie Blue filter. (A) Lane 1: molecular marker; Lane 2: purified human IgG 10 µg; Lane 3: bovine gamma globulin 5 µg; Lane 4: bovine gamma globulin 10 µg; Lane 5: T-DM1 5 µg; Lane 6: T-DM1 10 µg; Lane 7: BV 5 µg; Lane 8: BV 10 µg; Lane 9: Se-BV 5 µg; Lane 10: Se-BV 10 µg; Lane 11: TZ 5 µg; Lane 12: TZ 10 µg; Lane 13: Se-TZ 5 µg; Lane 14: Se-TZ 10 µg. (B) TZ migration on 4–20% Tris-Glycine PAGE gel under non-reducing conditions with electrophoretic poles reversed followed by Coomassie Blue R-250 stain. Lane 2: Ladder; Lane 3: TZ 5 µg; Lane 4: TZ 10 µg. (BV: Bevacizumab, Se-BV: Selenobevacizumab, TZ: Trastuzumab, Se-TZ: Selenotrastuzumab).
Figure 4.
mAb migration on 4–20% Tris-Glycine PAGE gel under non-reducing conditions followed by Coomassie Blue R-250 stain. The image was taken using a Coomassie Blue filter. (A) Lane 1: molecular marker; Lane 2: purified human IgG 10 µg; Lane 3: bovine gamma globulin 5 µg; Lane 4: bovine gamma globulin 10 µg; Lane 5: T-DM1 5 µg; Lane 6: T-DM1 10 µg; Lane 7: BV 5 µg; Lane 8: BV 10 µg; Lane 9: Se-BV 5 µg; Lane 10: Se-BV 10 µg; Lane 11: TZ 5 µg; Lane 12: TZ 10 µg; Lane 13: Se-TZ 5 µg; Lane 14: Se-TZ 10 µg. (B) TZ migration on 4–20% Tris-Glycine PAGE gel under non-reducing conditions with electrophoretic poles reversed followed by Coomassie Blue R-250 stain. Lane 2: Ladder; Lane 3: TZ 5 µg; Lane 4: TZ 10 µg. (BV: Bevacizumab, Se-BV: Selenobevacizumab, TZ: Trastuzumab, Se-TZ: Selenotrastuzumab).
Figure 5.
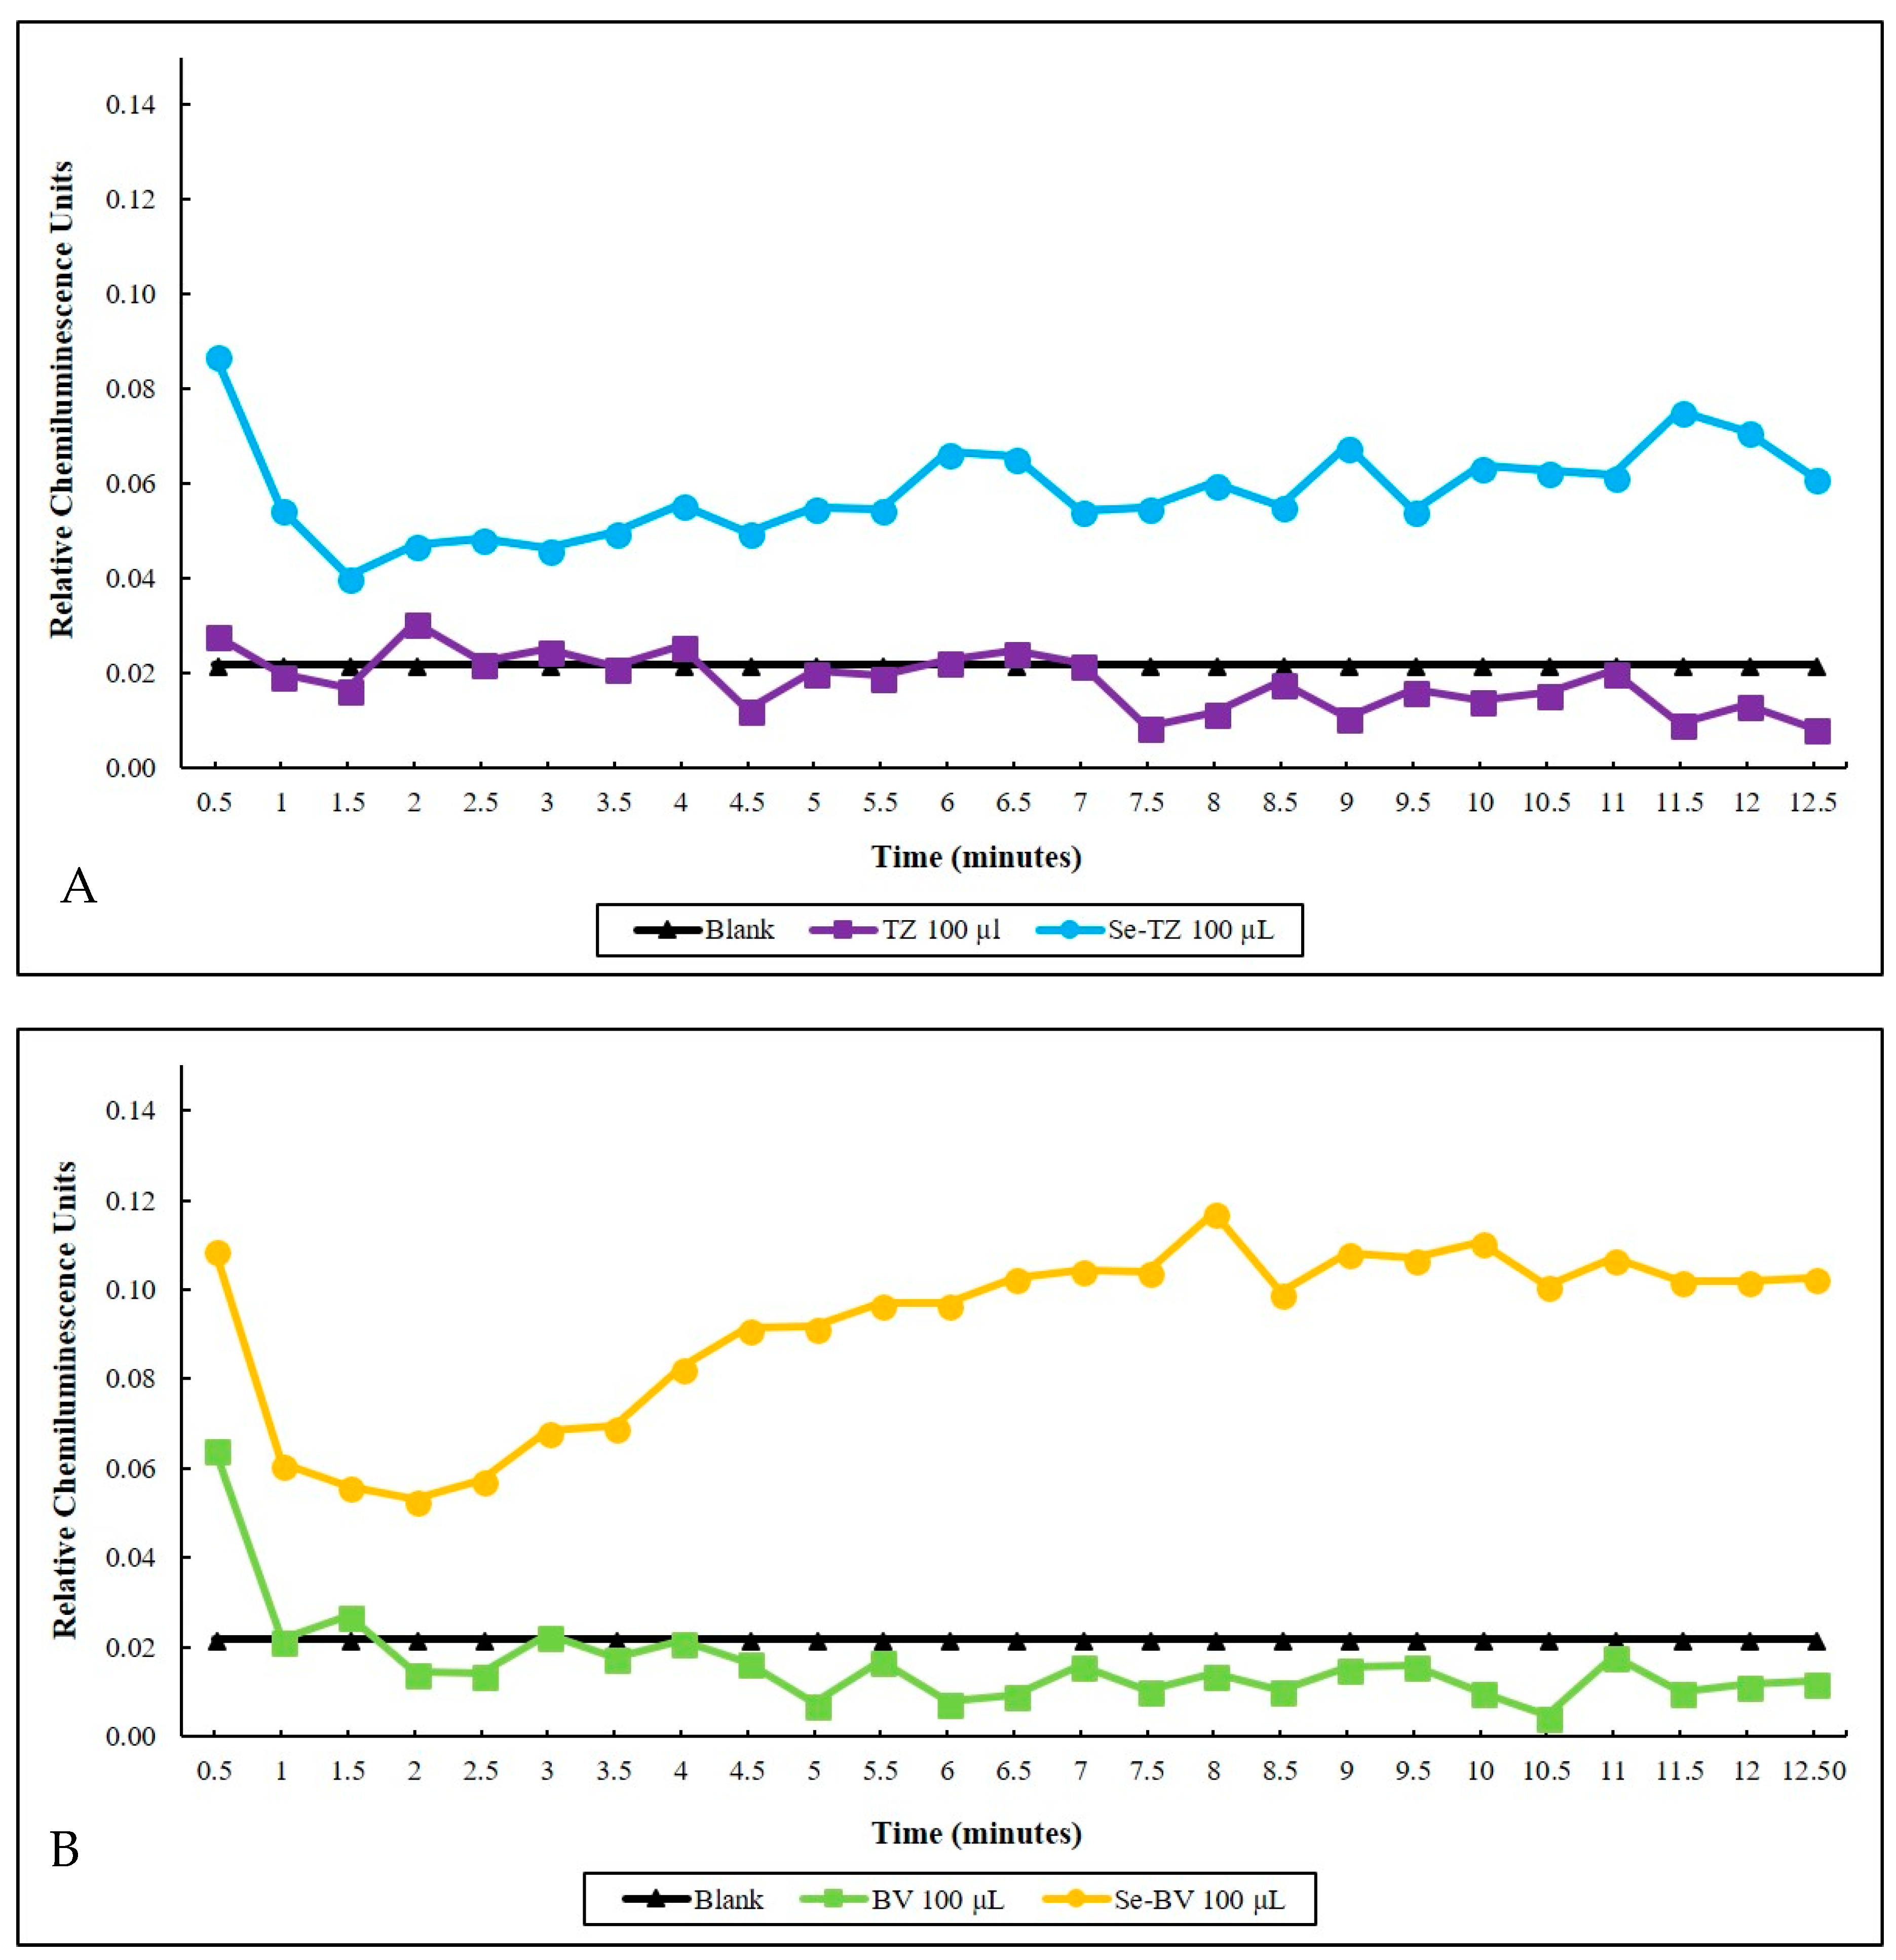
Time-dependent superoxide generation as measured by lucigenin chemiluminescence (CL). (A) Blank 100 µL Trastuzumab and 100 µL of Selenotrastuzumab = 8.8 µg of Se were compared. Proteins alone were further suppressive of the background (Blank CL) due to the slow auto-oxidation of GSH. (B) Blank 100 µL Bevacizumab and 100 µL Selenobevacizumab = 8.1 µg of Se. Proteins and BV alone were further suppressive of the background (Blank CL) due to the slow auto-oxidation of GSH.
Figure 5.
Time-dependent superoxide generation as measured by lucigenin chemiluminescence (CL). (A) Blank 100 µL Trastuzumab and 100 µL of Selenotrastuzumab = 8.8 µg of Se were compared. Proteins alone were further suppressive of the background (Blank CL) due to the slow auto-oxidation of GSH. (B) Blank 100 µL Bevacizumab and 100 µL Selenobevacizumab = 8.1 µg of Se. Proteins and BV alone were further suppressive of the background (Blank CL) due to the slow auto-oxidation of GSH.
Figure 6.
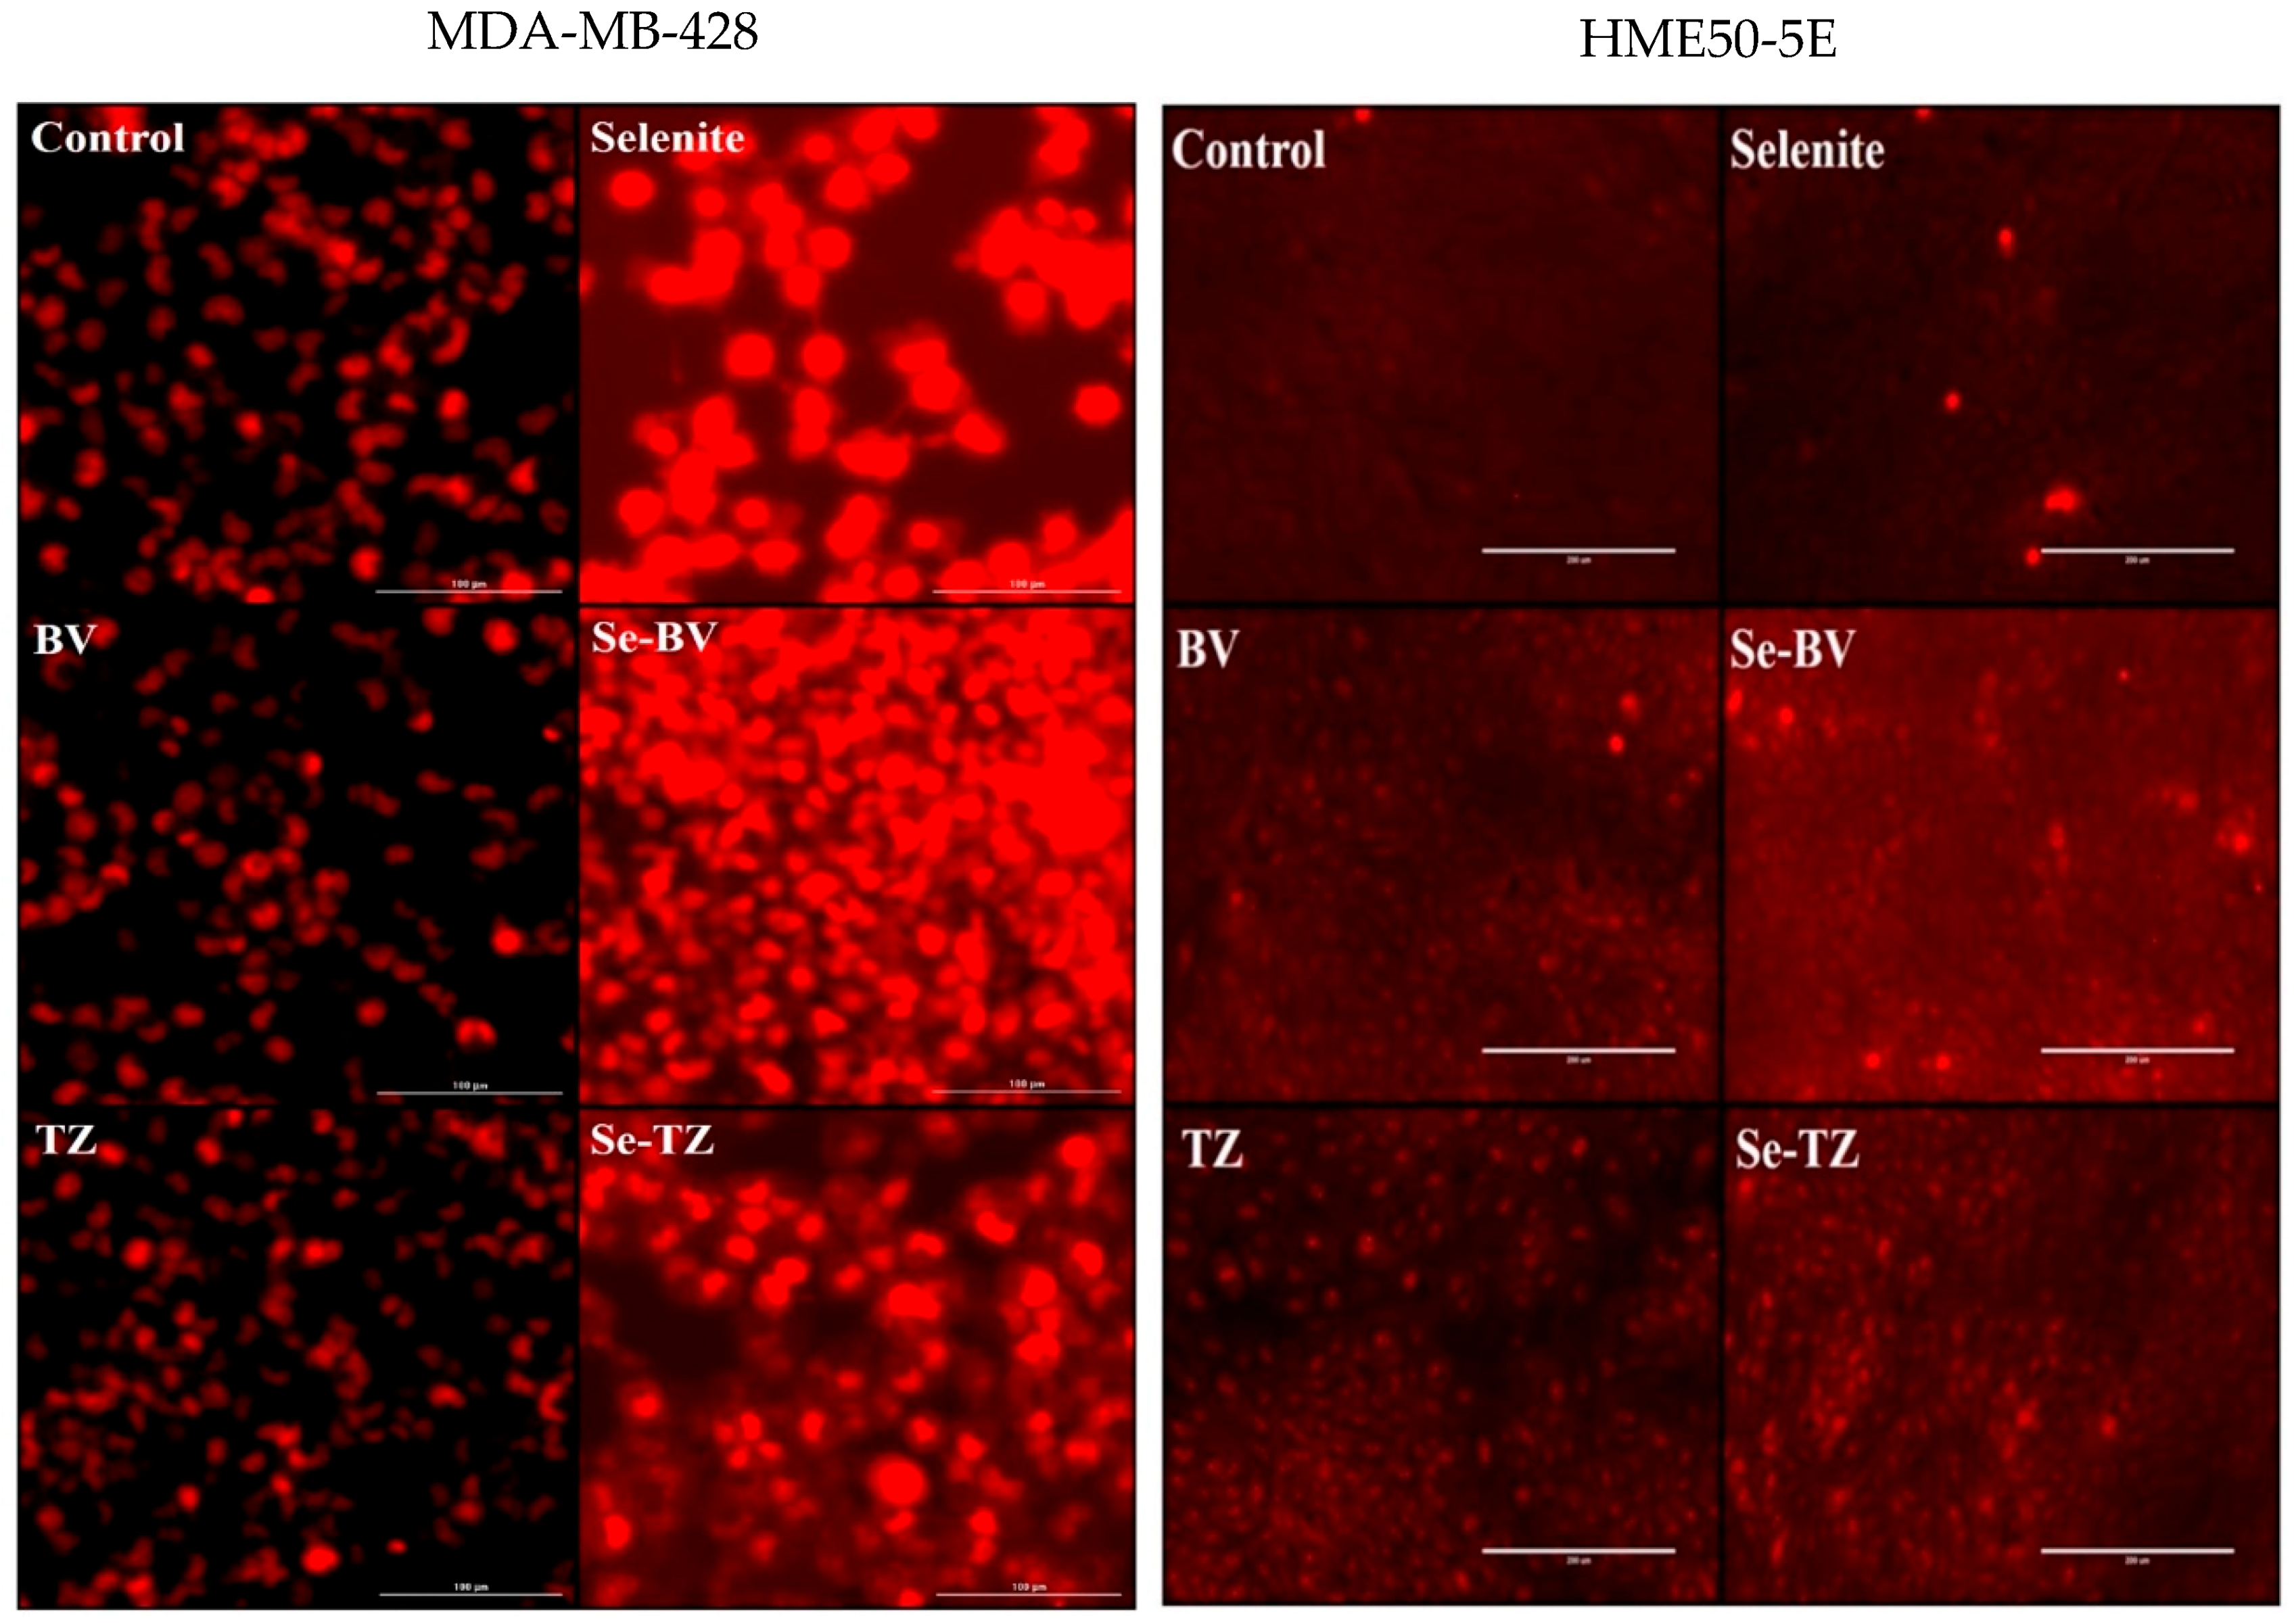
Photomicrographs of intracellular superoxide generation by DHE red florescence from MDA-MB-468 Cells (Left Panels) and HME50-5E cells (Right Panels). Results were photographed after 30 min of treatment with Control, selenite (10 µg Se), BV (153.7 µg protein), Se-BV (10 µg Se and 153.7 µg protein), TZ (131.1 µg protein), and Se-TZ (10 µg Se and 131.1 µg protein).
Figure 6.
Photomicrographs of intracellular superoxide generation by DHE red florescence from MDA-MB-468 Cells (Left Panels) and HME50-5E cells (Right Panels). Results were photographed after 30 min of treatment with Control, selenite (10 µg Se), BV (153.7 µg protein), Se-BV (10 µg Se and 153.7 µg protein), TZ (131.1 µg protein), and Se-TZ (10 µg Se and 131.1 µg protein).
Figure 7.
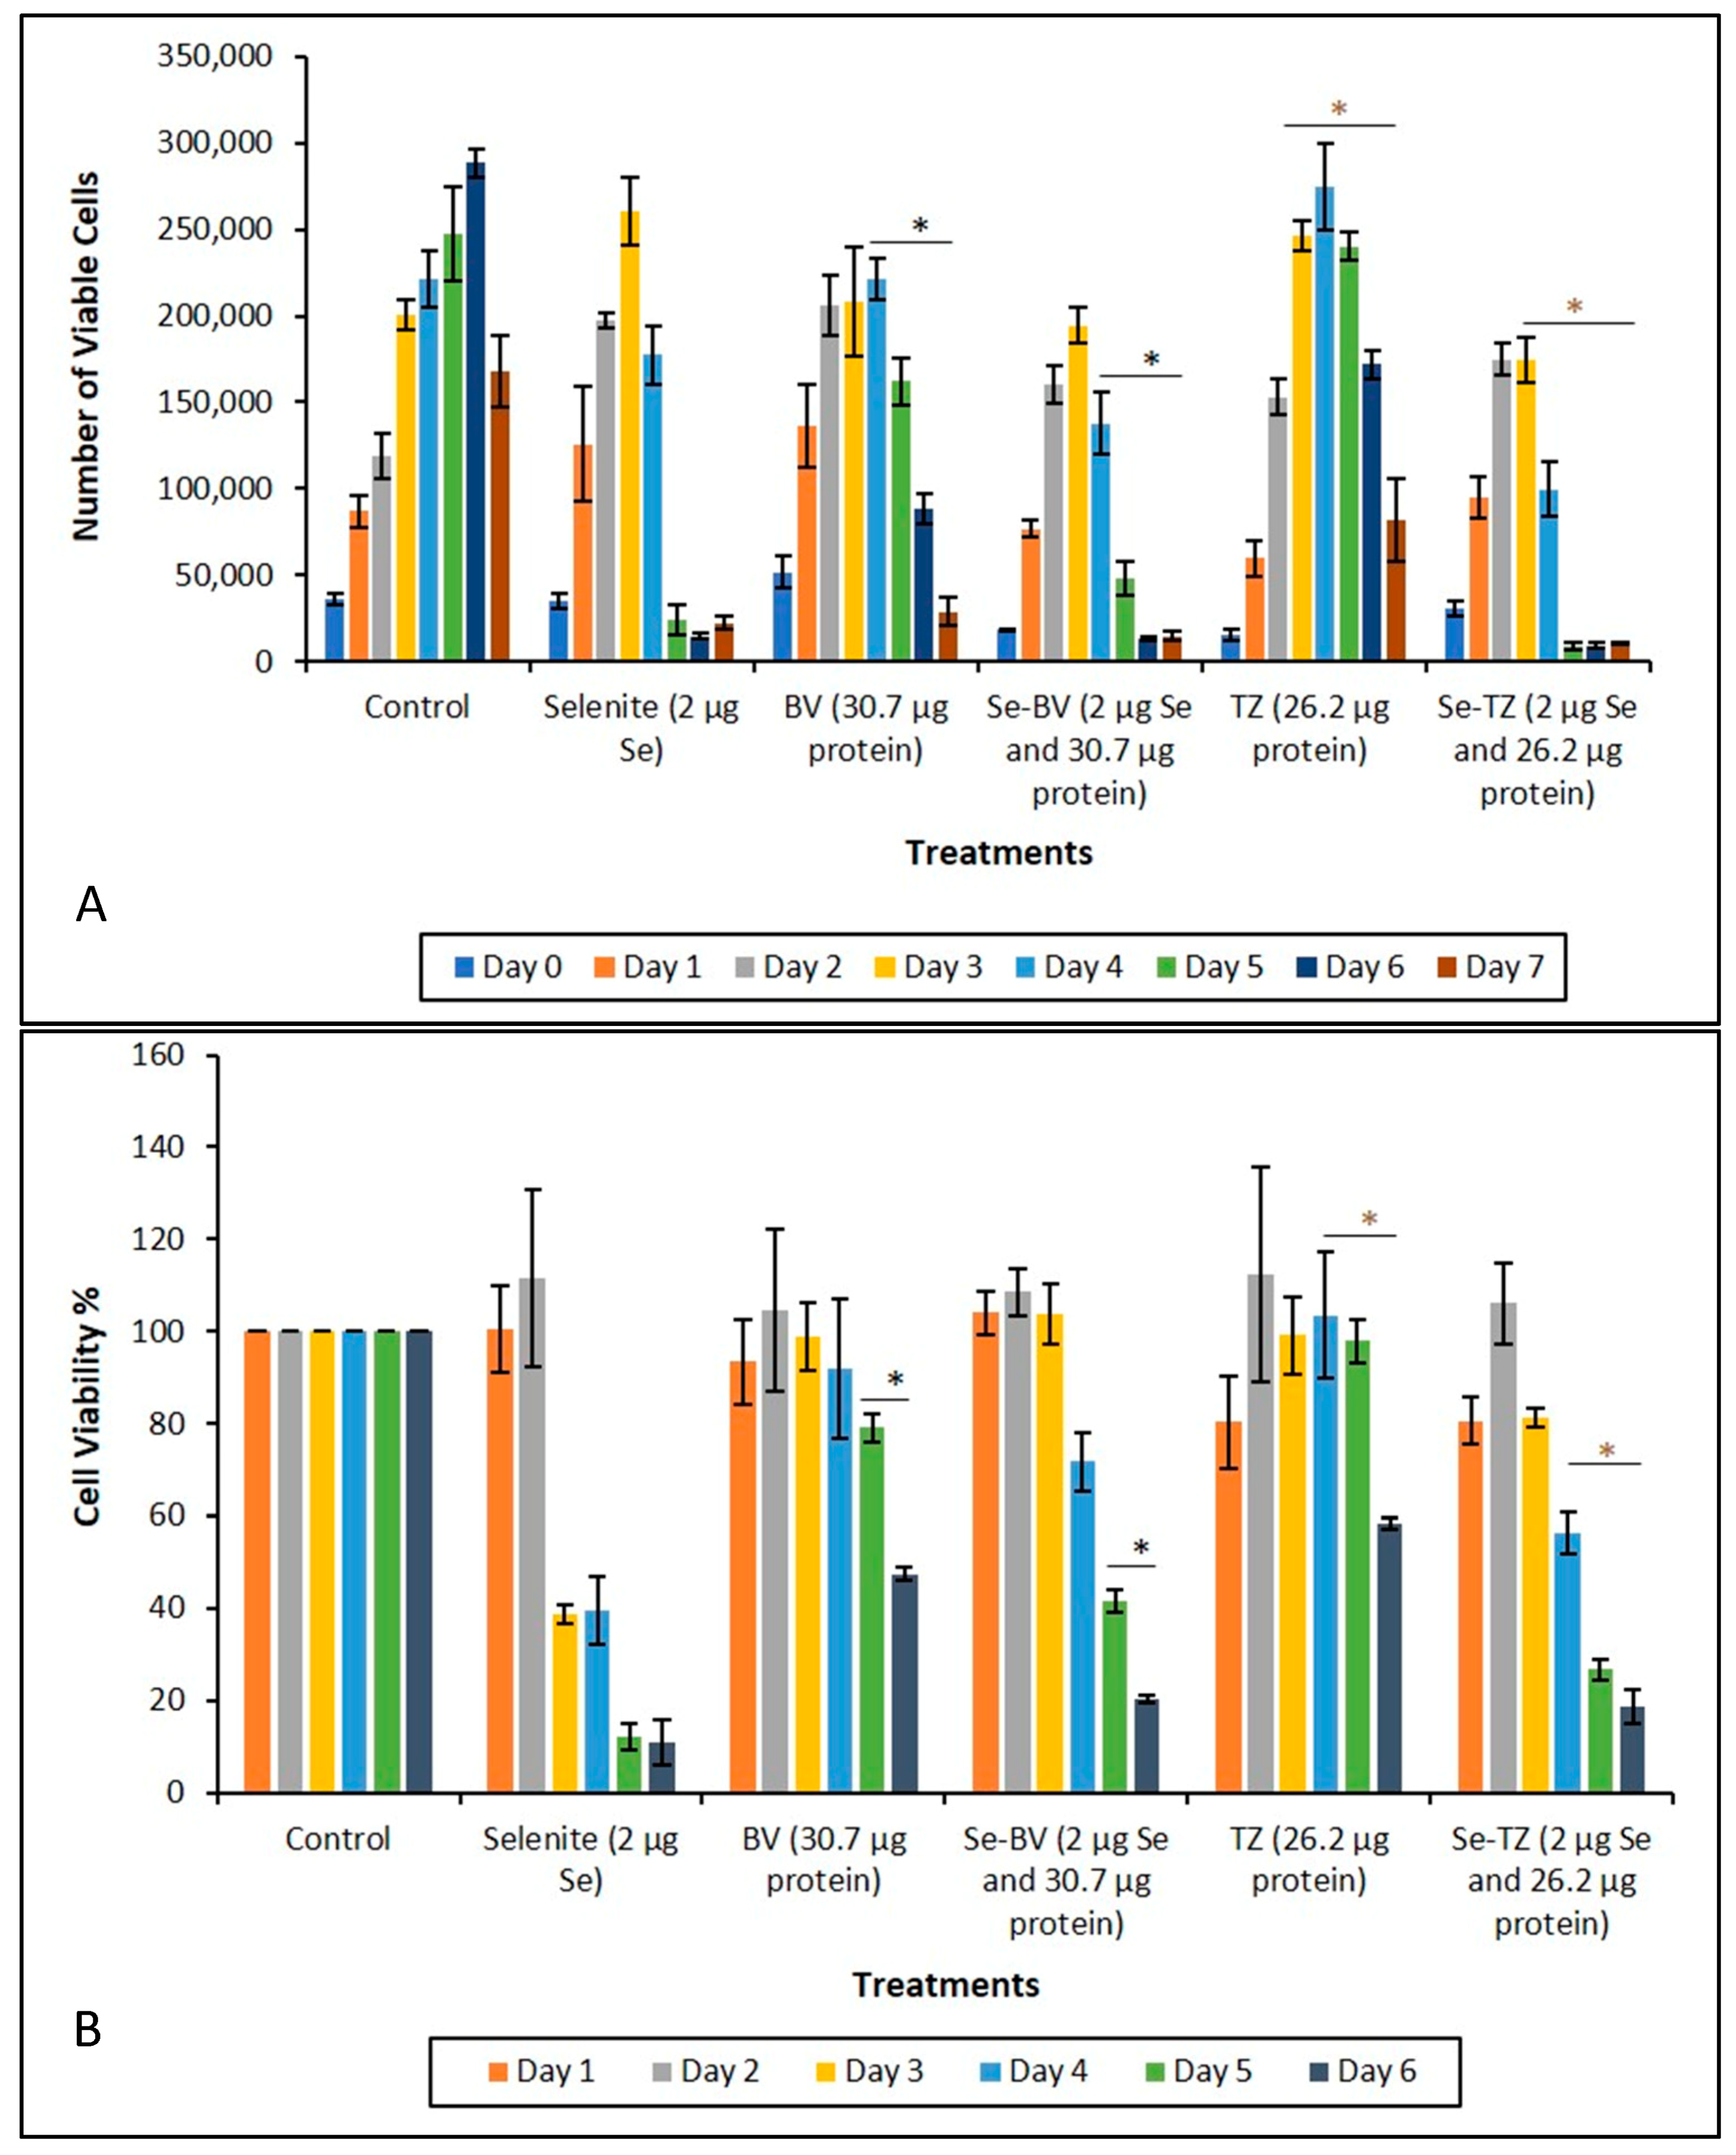
Analysis of cytotoxicity as a function of percent cell viability during treatment. (A) Cytotoxic effects of control, selenite, BV, Se-BV, TZ and Se-TZ Treatments against MDA-MB-468 cells. Forty-thousand cells were seeded in 48-well-plates and treated (Day 0 of treatment). Viable cells were counted for 7 days and analyzed by Trypan Blue exclusion. The data is expressed as Means ± SE (n = 3). Statistical treatments were compared using two sample t-tests. Treatments were considered statistically significant if p ≤ 0.05 and indicated by * (brown color). (B) Growth inhibition of control, selenite, BV, Se-BV, TZ, or Se-TZ treated MDA-MB-468 cells as determined by MTT assay over 6 days. Forty-thousand cells were seeded in 48-well-plates and treated (Day 0 of treatment). The data is expressed as the Means ± SE (n = 3). Treatments were compared using two sample t-tests. Treatments were considered statistically significant if p ≤ 0.05 (represented by * (black color)). Asterisks indicate significant differences between TZ and Se-TZ (A) and BV and Se-BV (B).
Figure 7.
Analysis of cytotoxicity as a function of percent cell viability during treatment. (A) Cytotoxic effects of control, selenite, BV, Se-BV, TZ and Se-TZ Treatments against MDA-MB-468 cells. Forty-thousand cells were seeded in 48-well-plates and treated (Day 0 of treatment). Viable cells were counted for 7 days and analyzed by Trypan Blue exclusion. The data is expressed as Means ± SE (n = 3). Statistical treatments were compared using two sample t-tests. Treatments were considered statistically significant if p ≤ 0.05 and indicated by * (brown color). (B) Growth inhibition of control, selenite, BV, Se-BV, TZ, or Se-TZ treated MDA-MB-468 cells as determined by MTT assay over 6 days. Forty-thousand cells were seeded in 48-well-plates and treated (Day 0 of treatment). The data is expressed as the Means ± SE (n = 3). Treatments were compared using two sample t-tests. Treatments were considered statistically significant if p ≤ 0.05 (represented by * (black color)). Asterisks indicate significant differences between TZ and Se-TZ (A) and BV and Se-BV (B).
![Ijms 19 03352 g007]()
Figure 8.
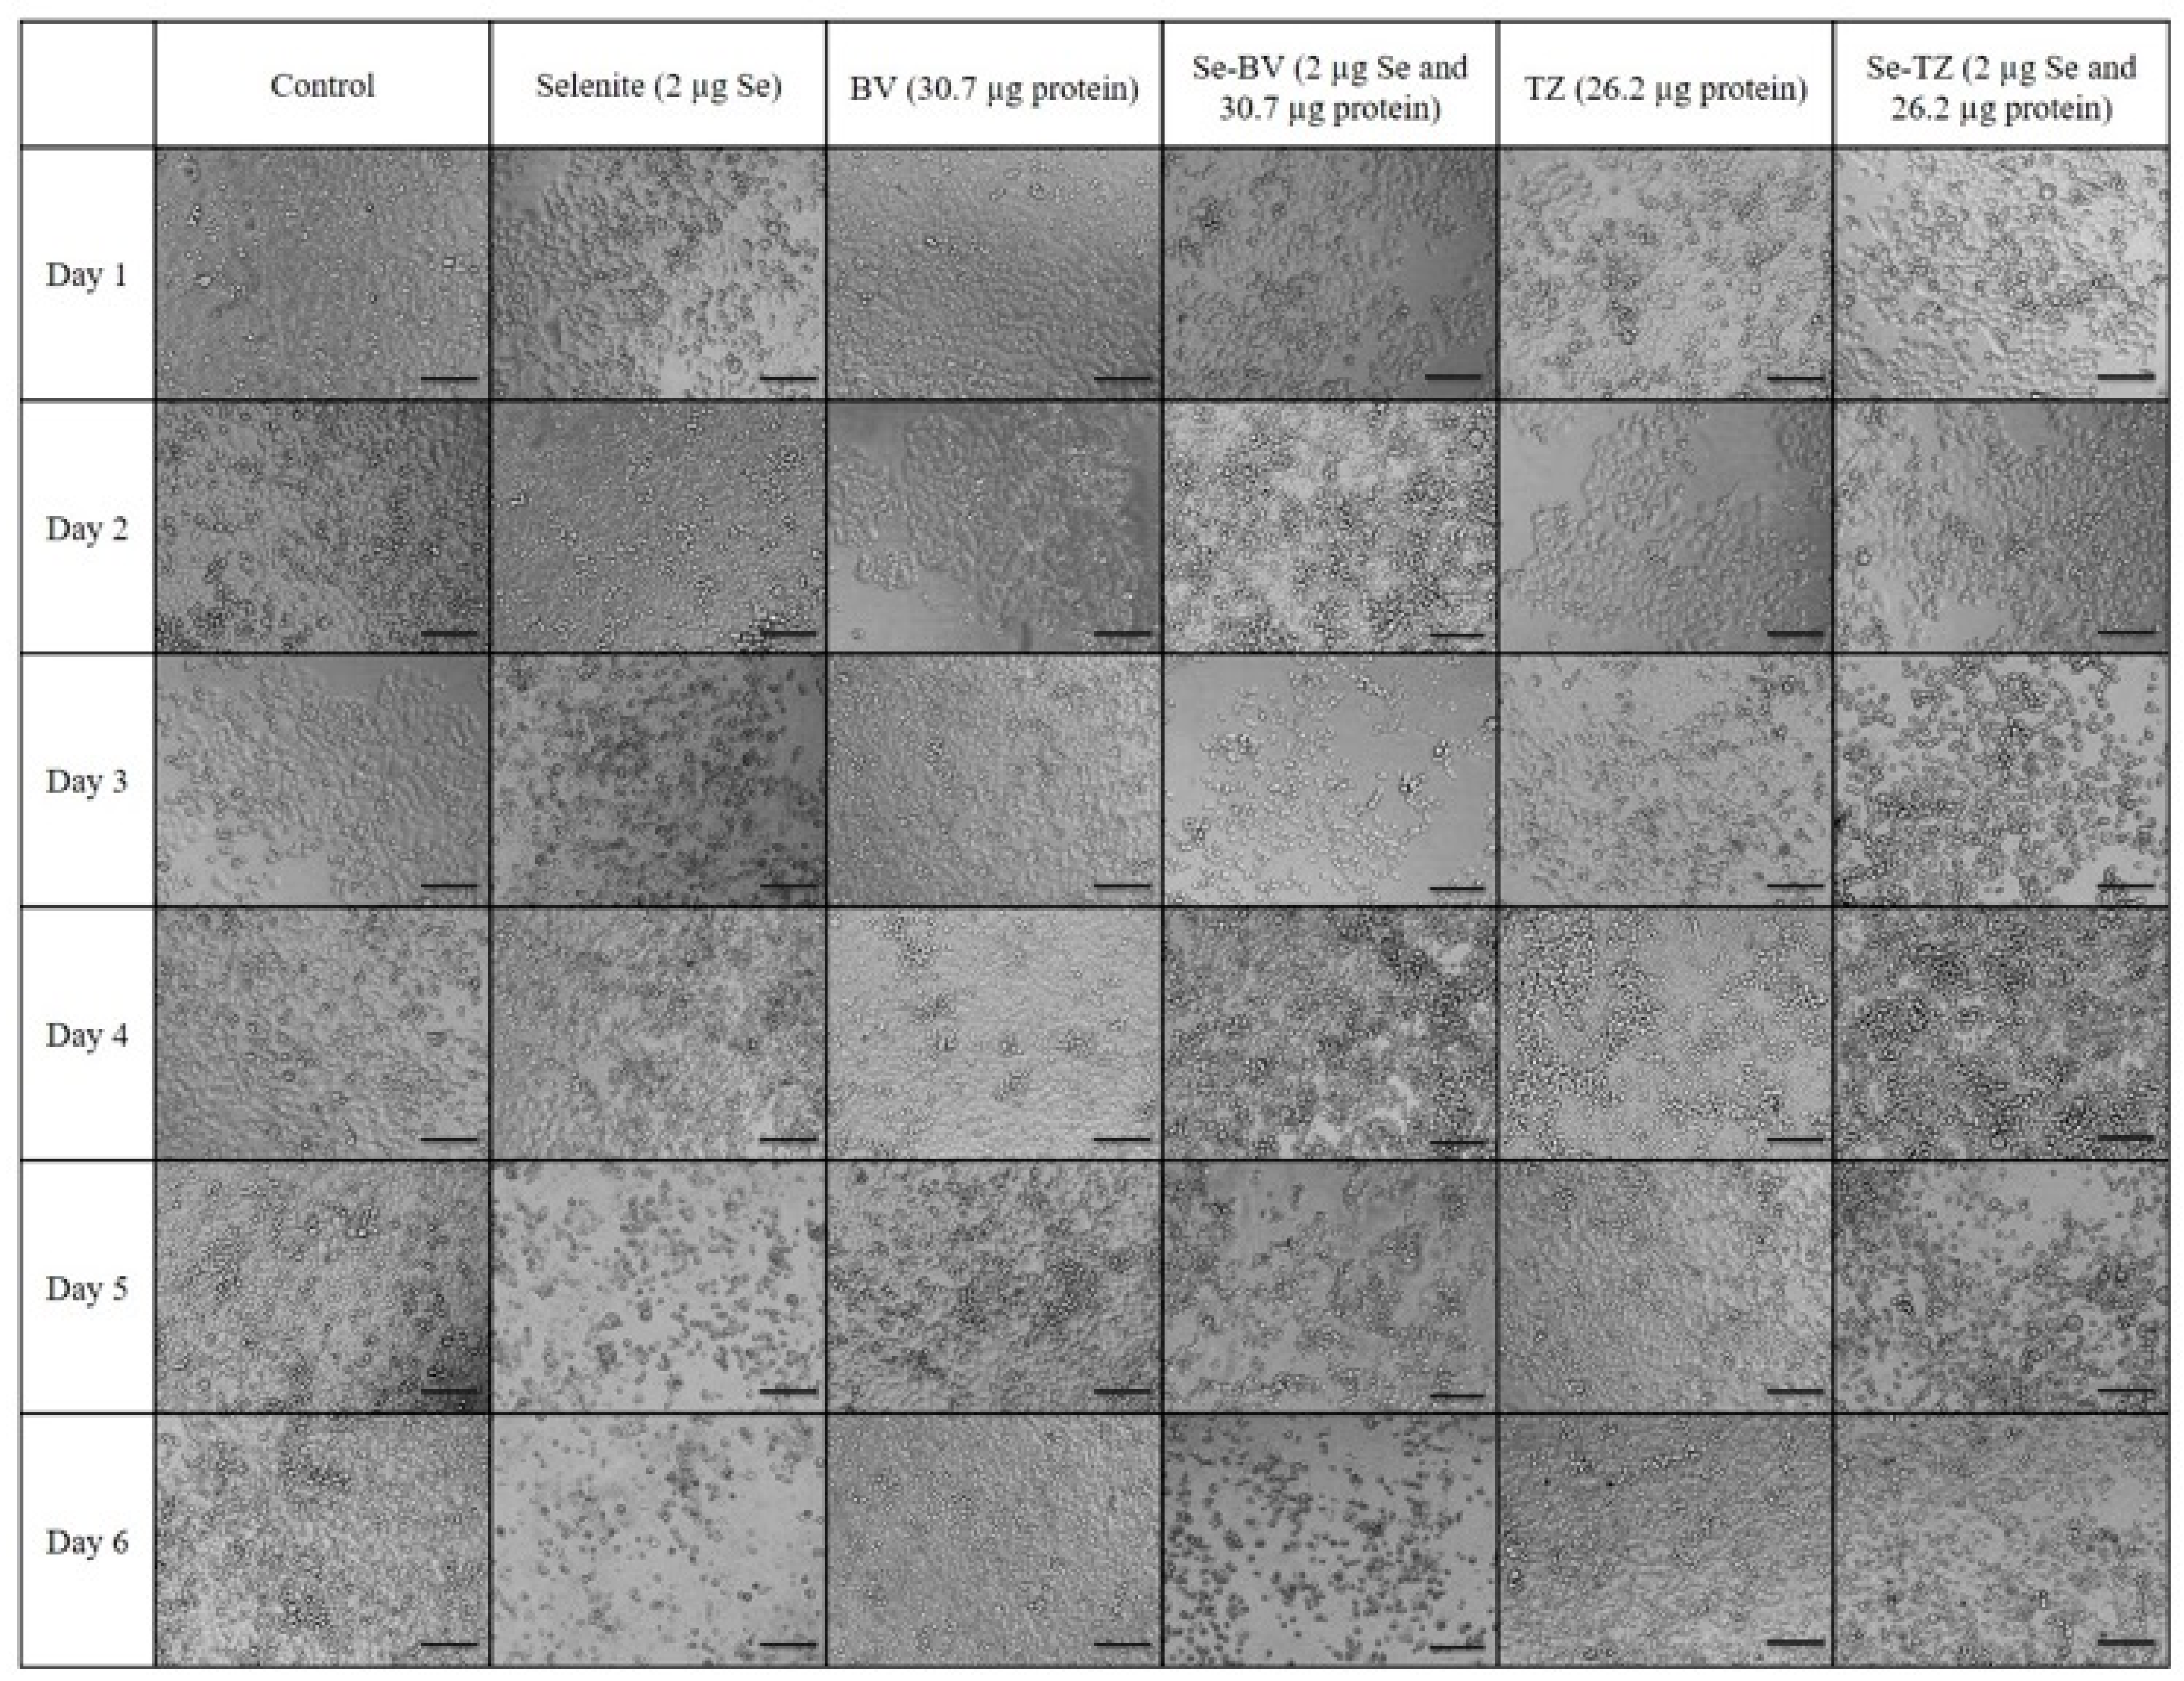
Photomicrographs of the morphological changes observed in control, Selenite, Bevacizumab (BV), Selenobevacizumab (Se-BV), Trastuzumab (TZ) and Selenotrastuzumab-Treated MDA-MB-468 Cells. Treatment of the MDA-MB-468 Cells with Selenite, Se-BV and Se-TZ revealed morphological changes indicative of membrane disruption and decreased cell viability in comparison to the native antibodies BV and TZ. Representative fields of view of MDA-MB-468 cells. Cells were photographed under phase contrast conditions at 20× magnification. Scale bar = 100 µm.
Figure 8.
Photomicrographs of the morphological changes observed in control, Selenite, Bevacizumab (BV), Selenobevacizumab (Se-BV), Trastuzumab (TZ) and Selenotrastuzumab-Treated MDA-MB-468 Cells. Treatment of the MDA-MB-468 Cells with Selenite, Se-BV and Se-TZ revealed morphological changes indicative of membrane disruption and decreased cell viability in comparison to the native antibodies BV and TZ. Representative fields of view of MDA-MB-468 cells. Cells were photographed under phase contrast conditions at 20× magnification. Scale bar = 100 µm.
Figure 9.
Photomicrographs of the morphological changes observed in control, Selenite, Bevacizumab (BV), Selenobevacizumab (Se-BV), Trastuzumab (TZ) and Selenotrastuzumab-treated HME 50-5E Cells. Treatment of HME 50-5E cells with Selenite, Se-BV and Se-TZ did not induce severe morphological cell changes in comparison to those seen in the selenium-treated MDA-MB-468 cells. Representative fields of view of HME50-5E cells. Cells were photographed under phase contrast conditions at 20× magnification. Scale bar = 100 µm.
Figure 10.
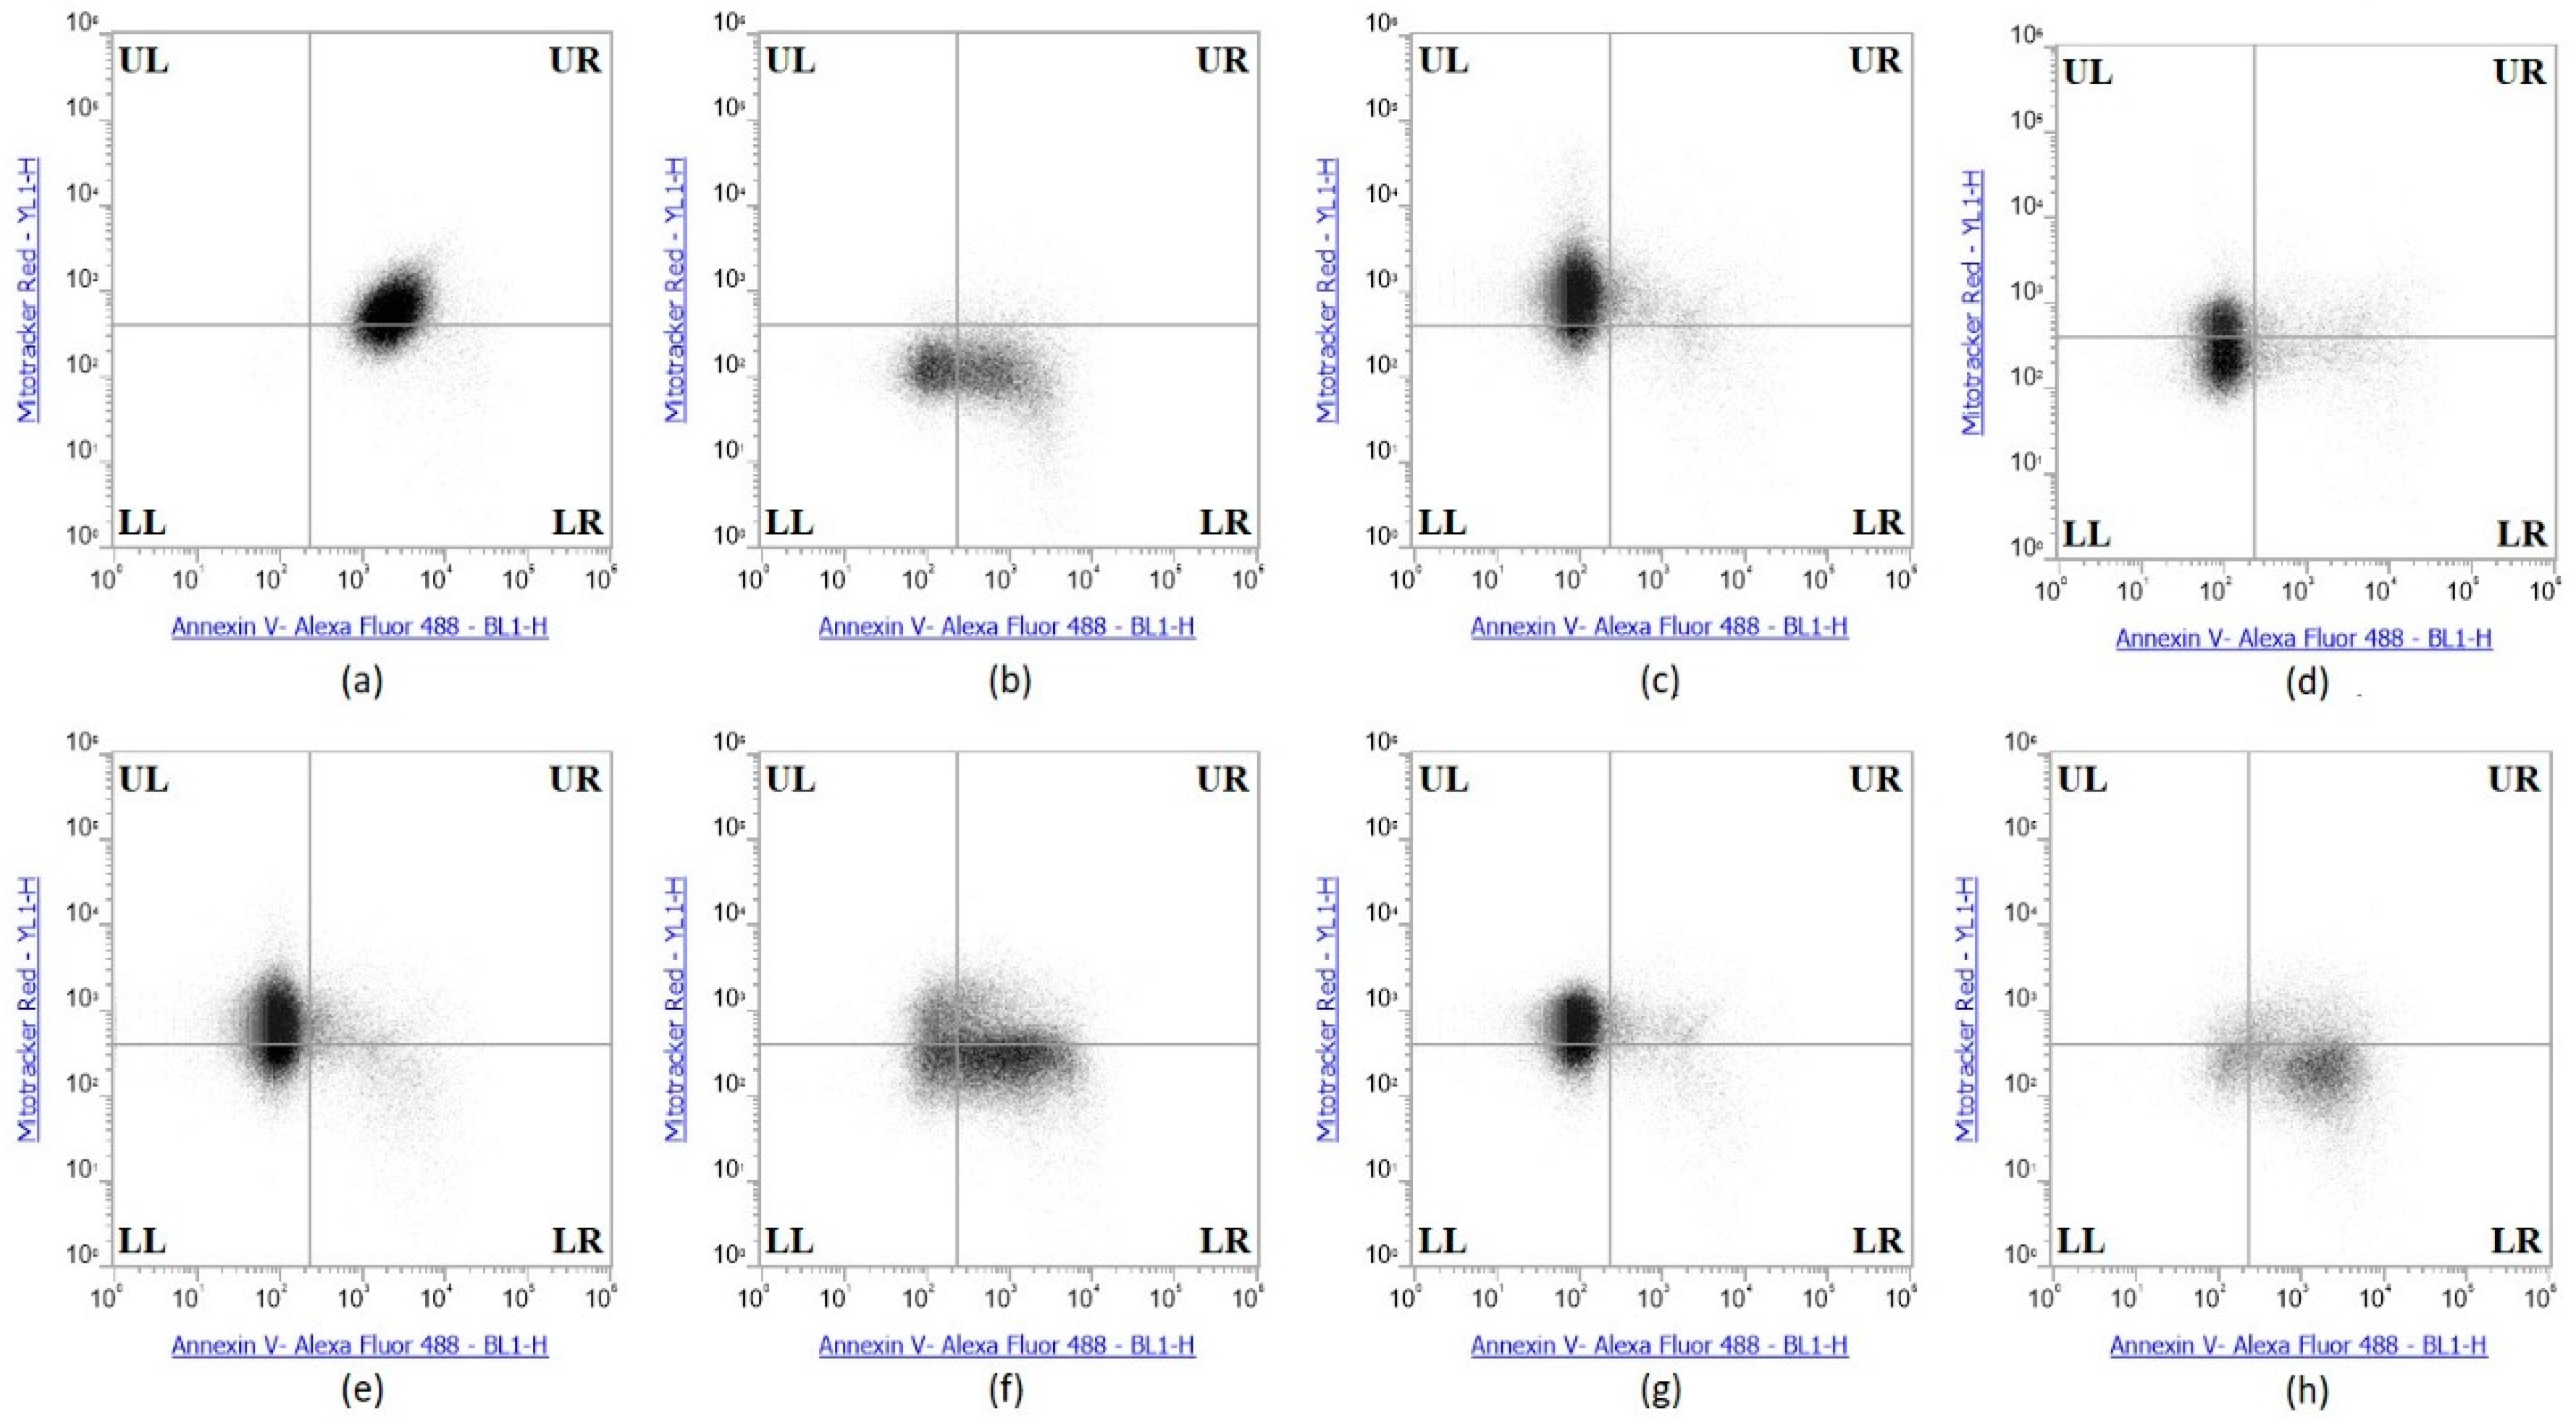
Se-Immunoconjugates induced greater apoptosis than native mAbs in MDA-MB-468 Cells. (a) Sutent (apoptosis control), (b) 0.1% Triton X-100 (necrosis control), (c) Control untreated (d) Selenite, (e) Bevacizumab, (f) Selenobevacizumab, (g) Trastuzumab, (h) Selenotrastuzumab Treatments. MDA-MB-468 cells were stained with Annexin V/MitoTracker Red and subjected to flow cytometric analysis. The four quadrants represent—living cells (Upper Left; UL: Annexin V, MitoTracker Red), early apoptotic (Upper Right; UR: Annexin V, MitoTracker Red), late apoptotic (Lower Right; LR: Annexin V, MitoTracker Red) or necrotic (Lower Left; LL: Annexin V, MitoTracker Red) stages.
Figure 10.
Se-Immunoconjugates induced greater apoptosis than native mAbs in MDA-MB-468 Cells. (a) Sutent (apoptosis control), (b) 0.1% Triton X-100 (necrosis control), (c) Control untreated (d) Selenite, (e) Bevacizumab, (f) Selenobevacizumab, (g) Trastuzumab, (h) Selenotrastuzumab Treatments. MDA-MB-468 cells were stained with Annexin V/MitoTracker Red and subjected to flow cytometric analysis. The four quadrants represent—living cells (Upper Left; UL: Annexin V, MitoTracker Red), early apoptotic (Upper Right; UR: Annexin V, MitoTracker Red), late apoptotic (Lower Right; LR: Annexin V, MitoTracker Red) or necrotic (Lower Left; LL: Annexin V, MitoTracker Red) stages.
Figure 11.
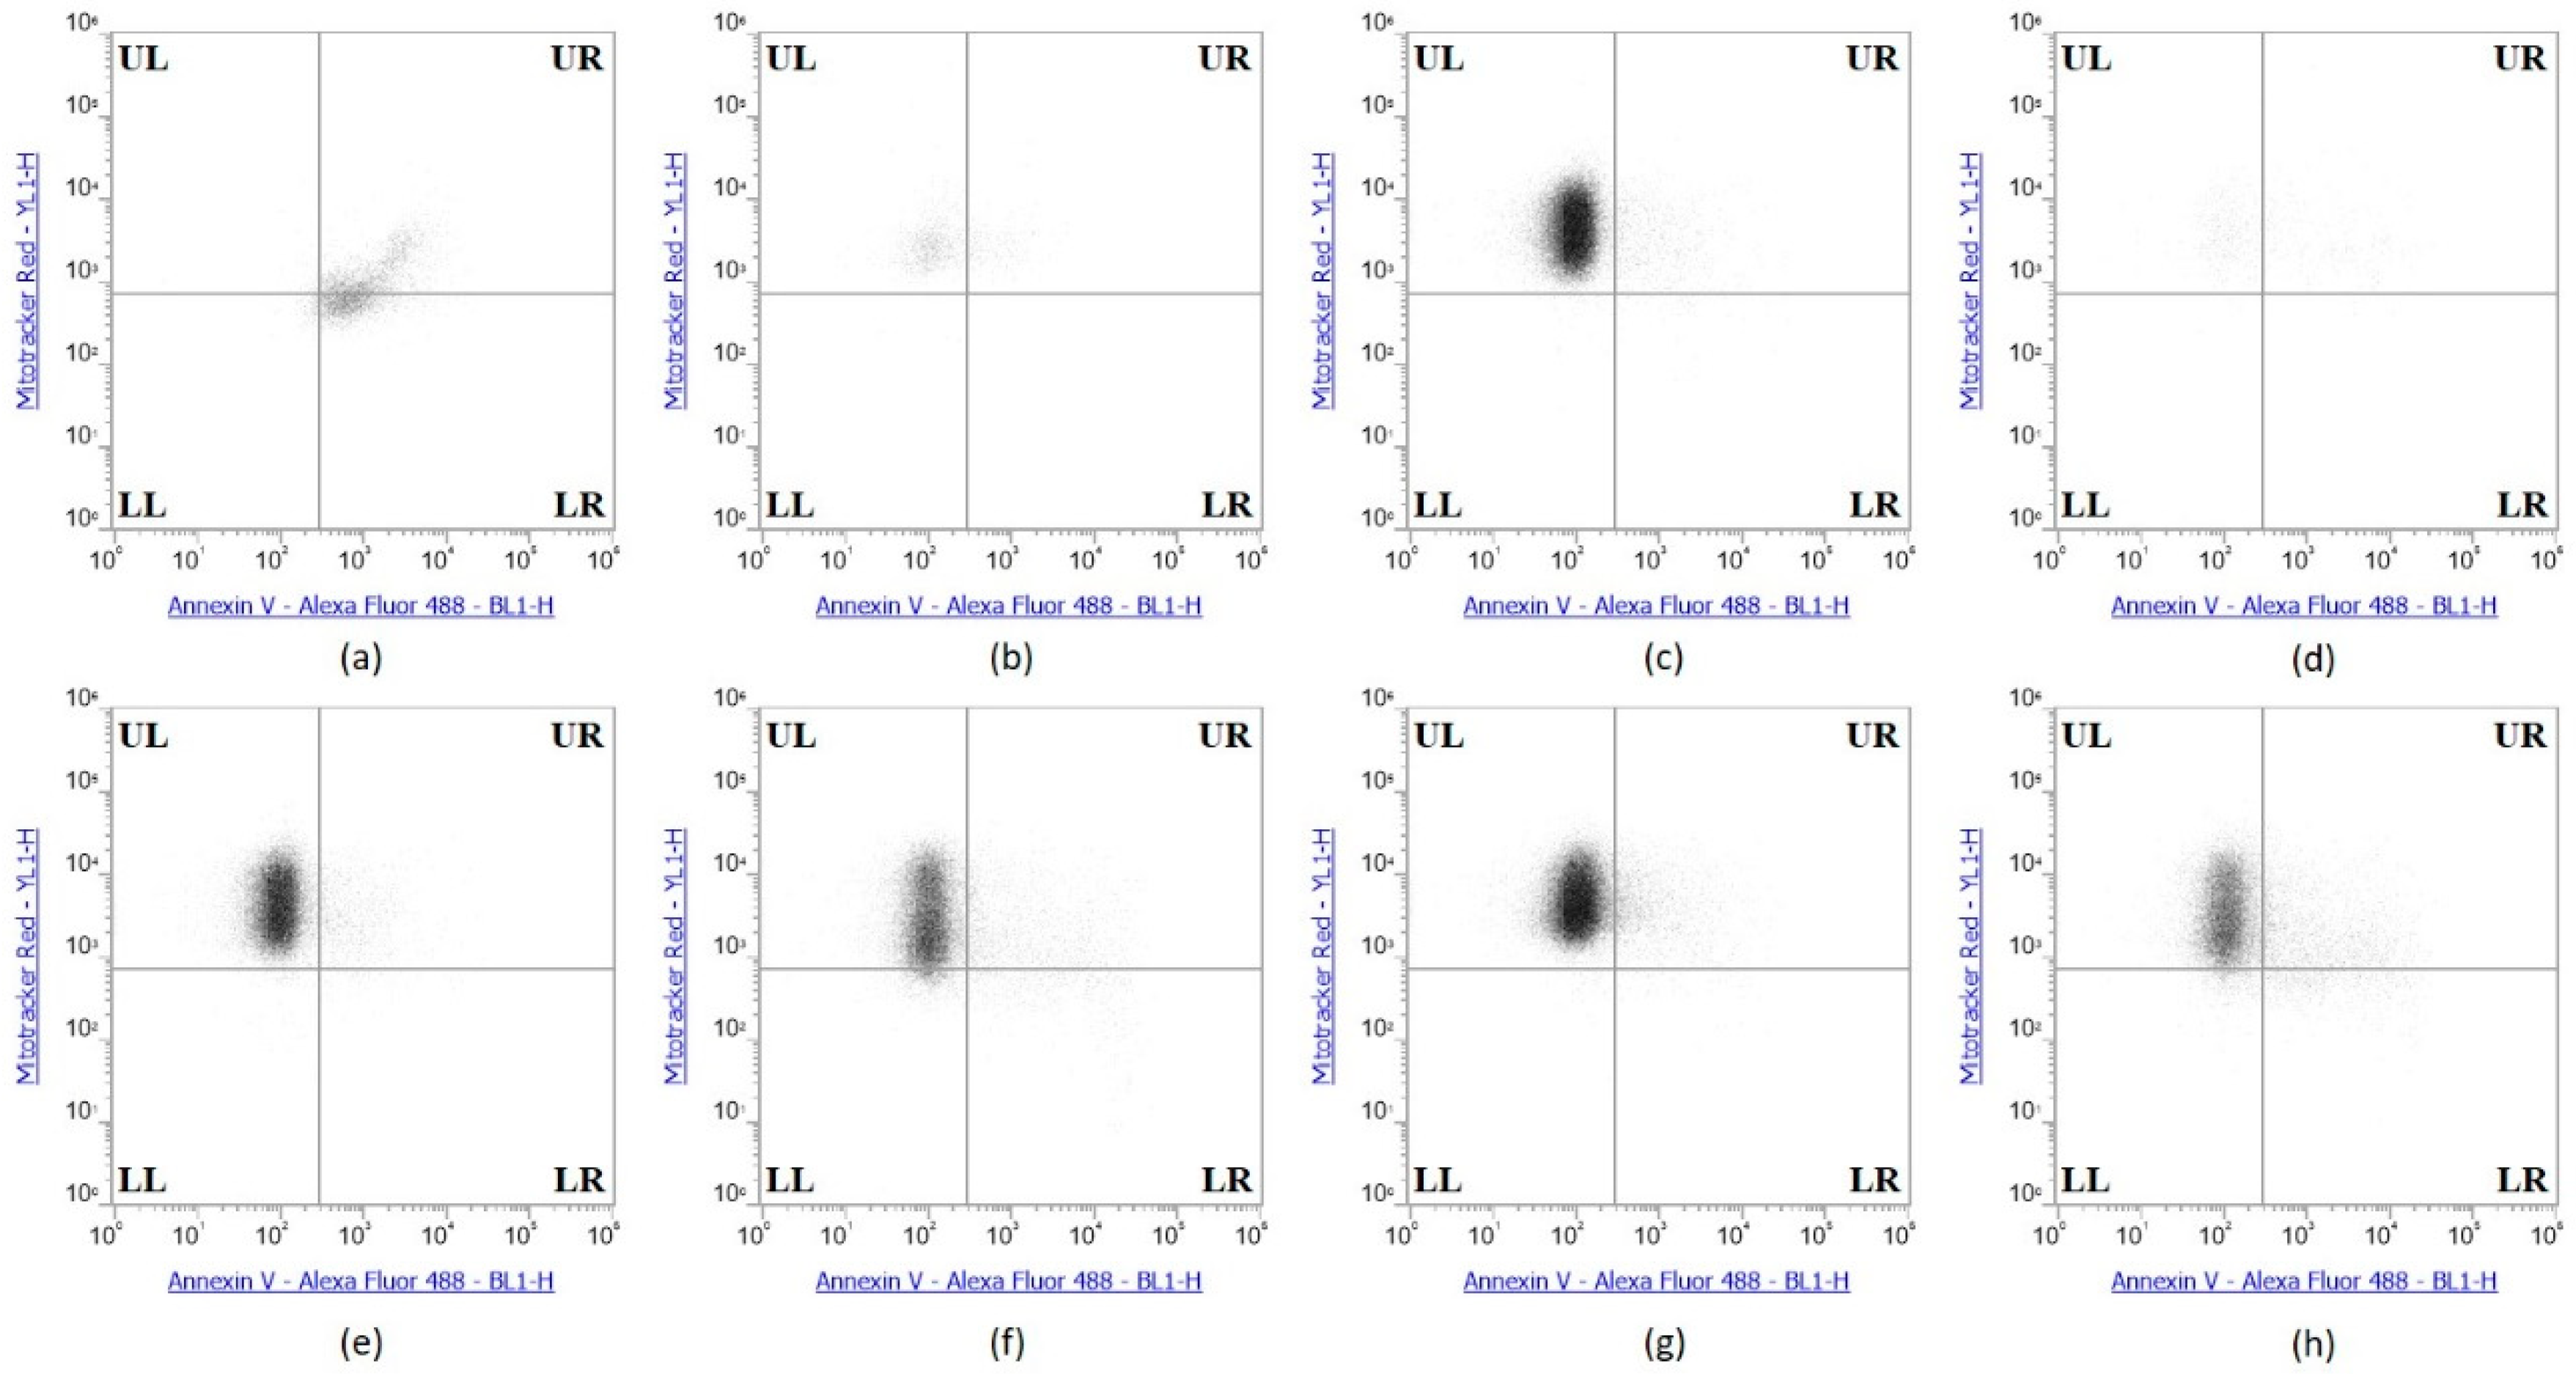
Se-Immunoconjugates induced no apoptosis in HME50-5E Cells. (a) Sutent (apoptosis control), (b) 0.1% Triton X-100 (necrosis) control), (c) Control untreated, (d) Selenite, (e) Bevacizumab, (f) Selenobevacizumab, (g) Trastuzumab, (h) Selenotrastuzumab treatments in HME50-5E cells. HME50-5E cells were stained with Annexin V/PI Mitotracker Red and subjected to flow cytometric analysis. The four quadrants represent—living cells (Upper Left; UL: Annexin V, Mitotracker Red), early apoptotic (Upper Right; UR: Annexin V, Mitotracker Red), late apoptotic (Lower Right; LR: Annexin V, Mitotracker Red) or necrotic (Lower Left; LL: Annexin V, Mitotracker Red) stages.
Figure 11.
Se-Immunoconjugates induced no apoptosis in HME50-5E Cells. (a) Sutent (apoptosis control), (b) 0.1% Triton X-100 (necrosis) control), (c) Control untreated, (d) Selenite, (e) Bevacizumab, (f) Selenobevacizumab, (g) Trastuzumab, (h) Selenotrastuzumab treatments in HME50-5E cells. HME50-5E cells were stained with Annexin V/PI Mitotracker Red and subjected to flow cytometric analysis. The four quadrants represent—living cells (Upper Left; UL: Annexin V, Mitotracker Red), early apoptotic (Upper Right; UR: Annexin V, Mitotracker Red), late apoptotic (Lower Right; LR: Annexin V, Mitotracker Red) or necrotic (Lower Left; LL: Annexin V, Mitotracker Red) stages.
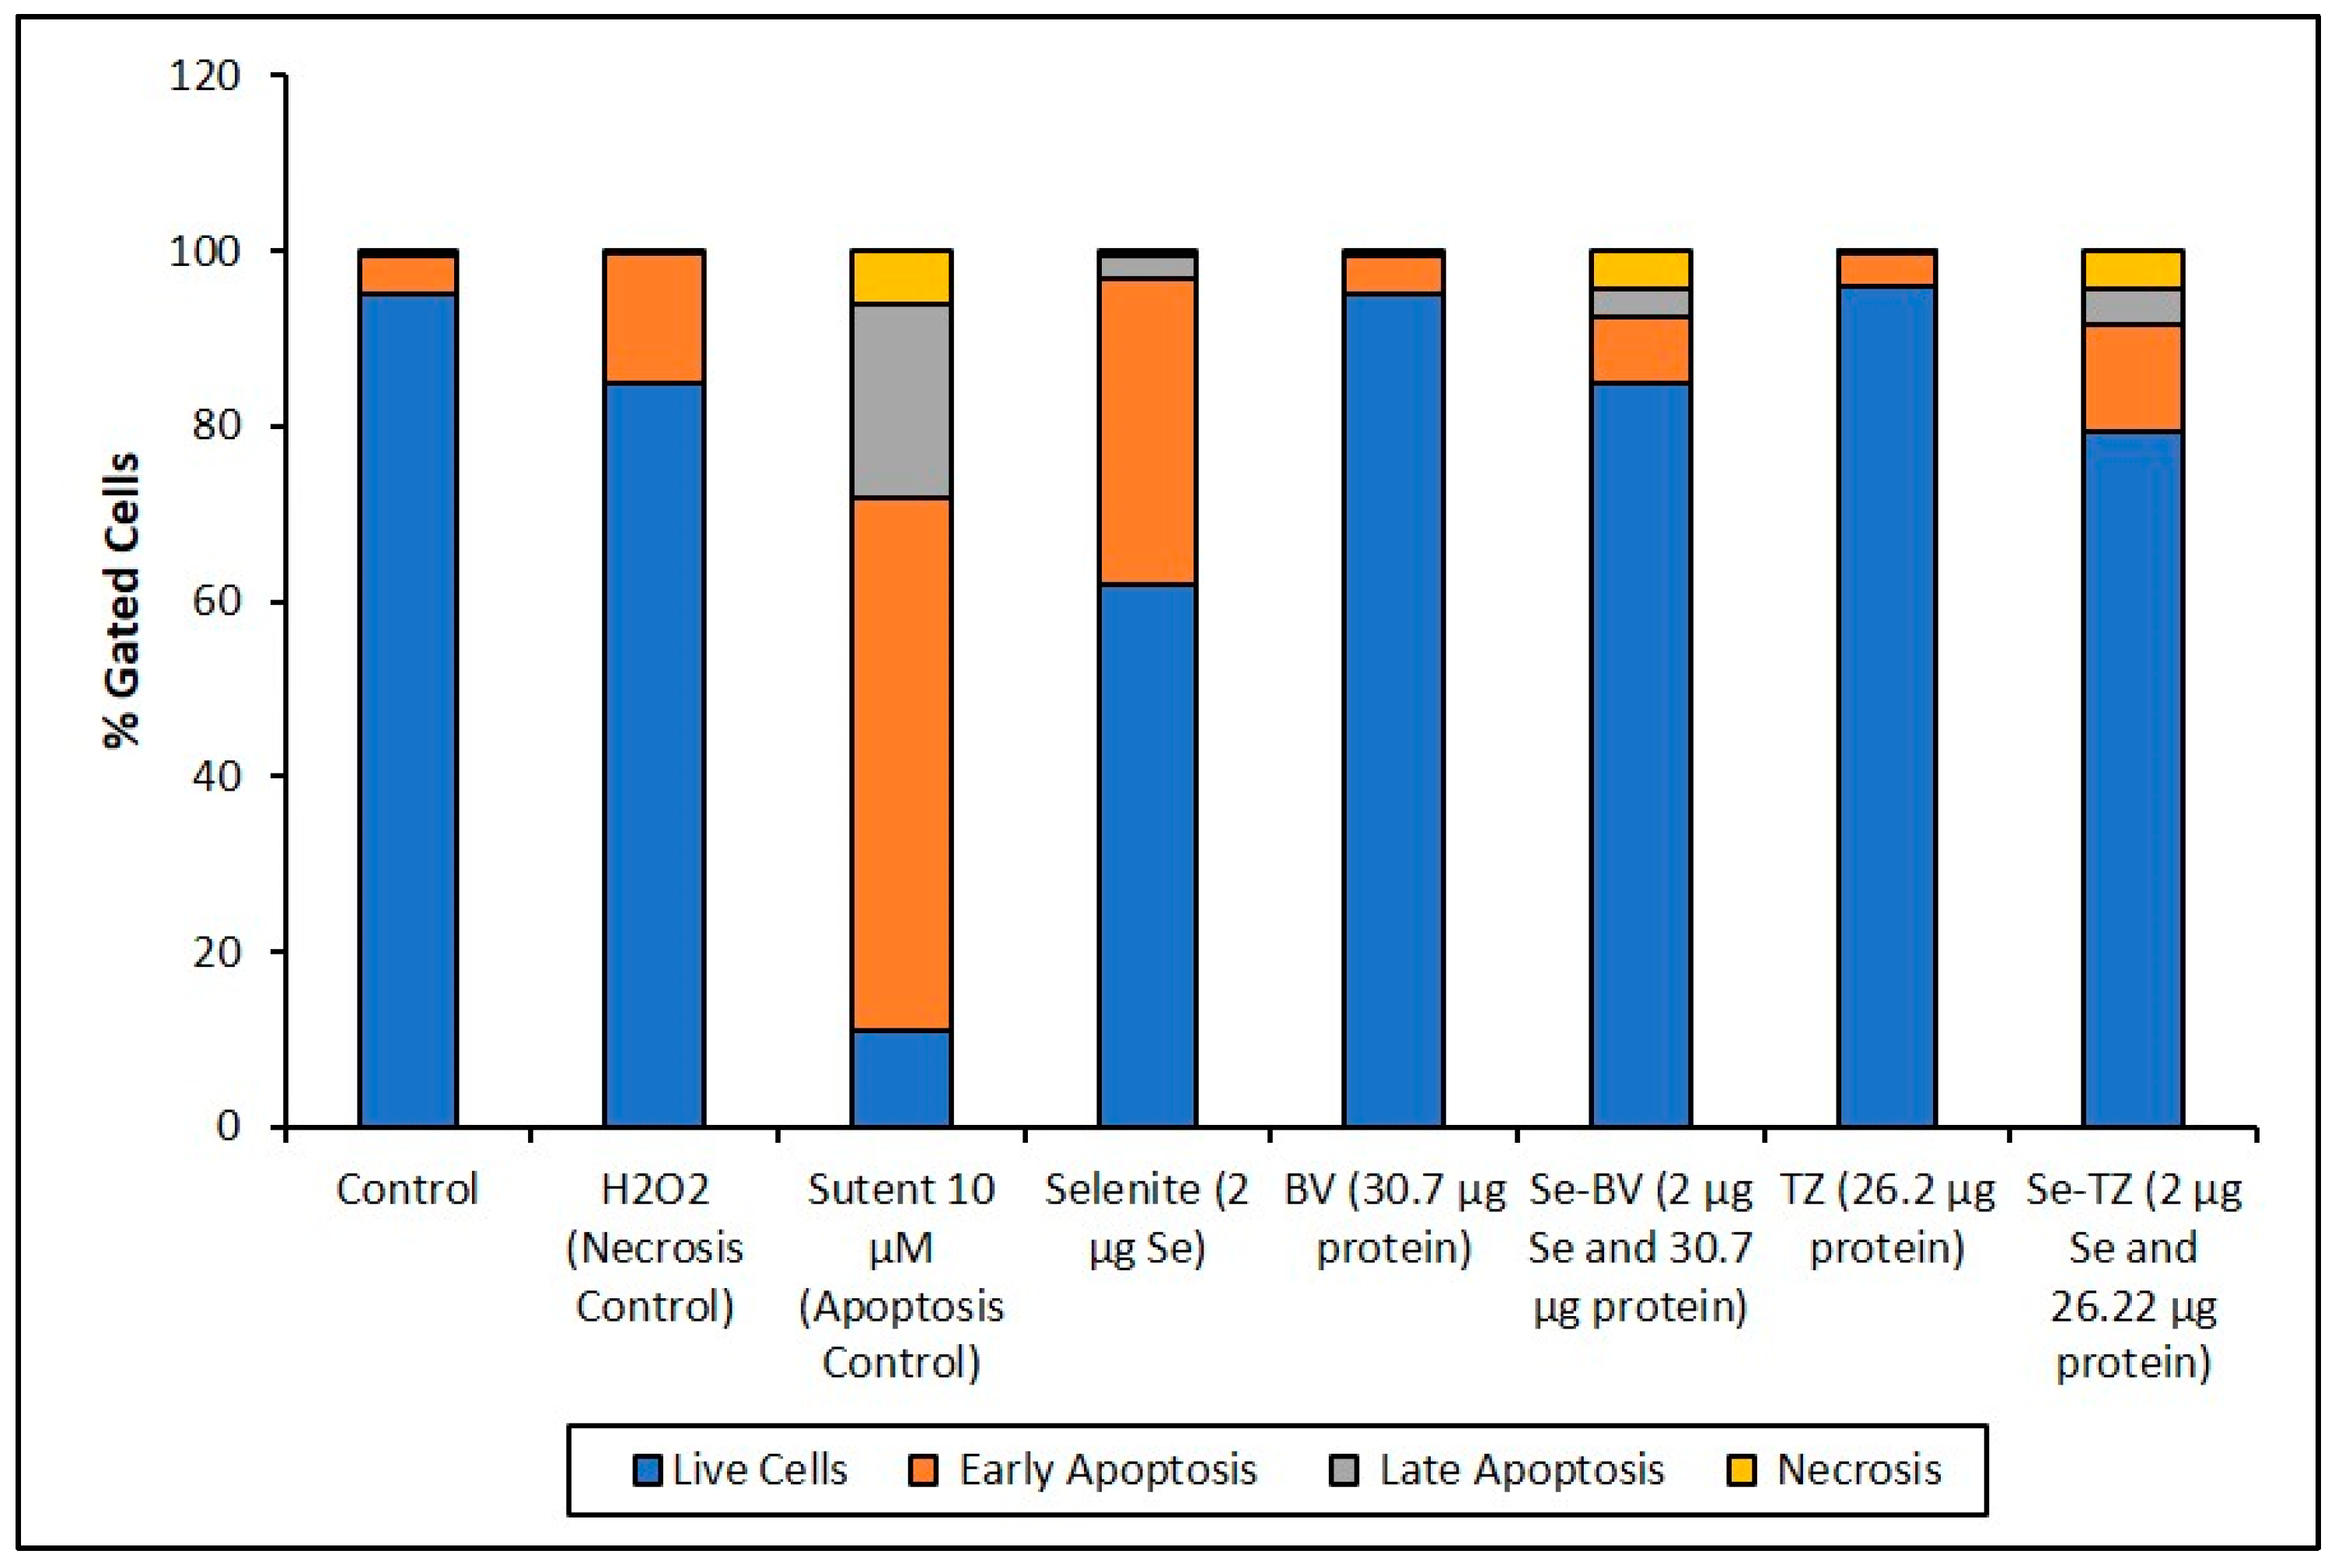
Figure 12.
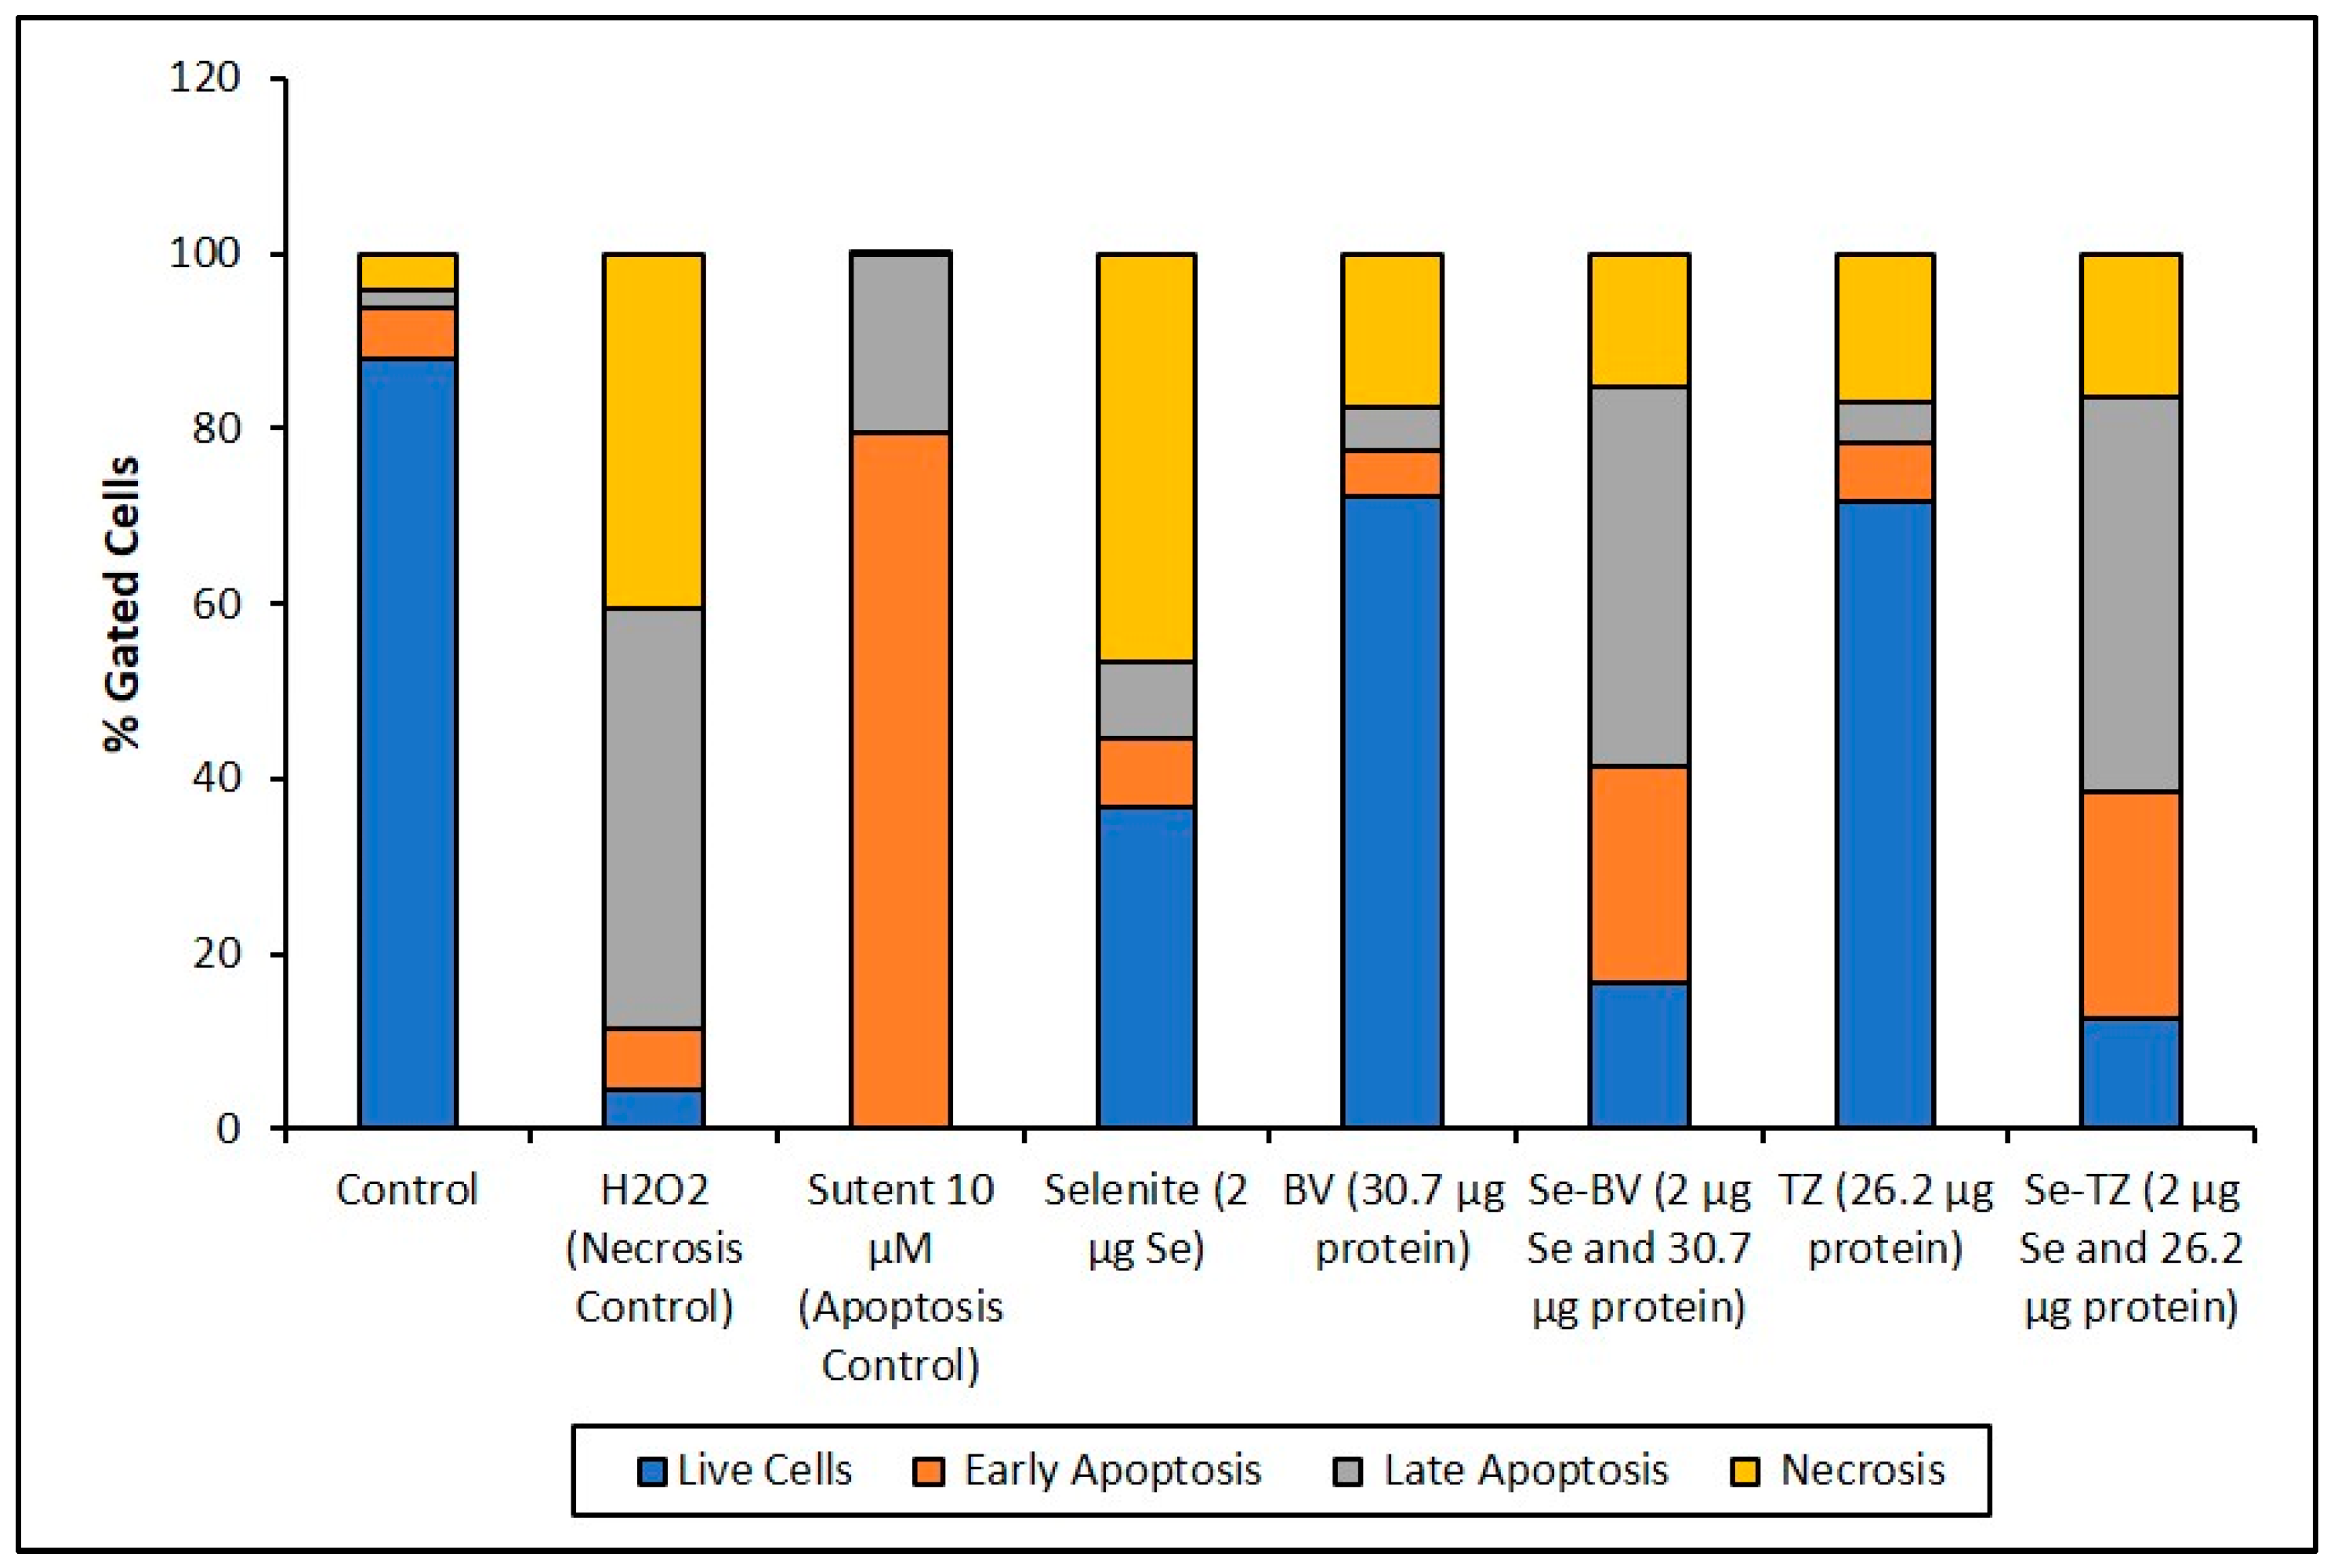
Cell representation (%) within the four quadrants for MDA-MB-468 cell treatments. Percent distribution of MDA-MB-468 apoptotic cells after treatment with H2O2, Sutent, Selenite as Se, Bevacizumab (BV), Selenobevacizumab (Se-BV), Trastuzumab (TZ), or Selenotrastuzumab (Se-TZ). Data is expressed as the Mean (n = 3).
Figure 12.
Cell representation (%) within the four quadrants for MDA-MB-468 cell treatments. Percent distribution of MDA-MB-468 apoptotic cells after treatment with H2O2, Sutent, Selenite as Se, Bevacizumab (BV), Selenobevacizumab (Se-BV), Trastuzumab (TZ), or Selenotrastuzumab (Se-TZ). Data is expressed as the Mean (n = 3).
Figure 13.
Cell representation (%) within the four quadrants for HME50-5E cell treatment. Percent distribution of HME50-5E apoptotic cells after treatment with H2O2, Sutent, Selenite as Se, Bevacizumab (BV), Selenobevacizumab (Se-BV), Trastuzumab (TZ) or Selenotrastuzumab (Se-TZ). Data is expressed as Mean (n = 3).
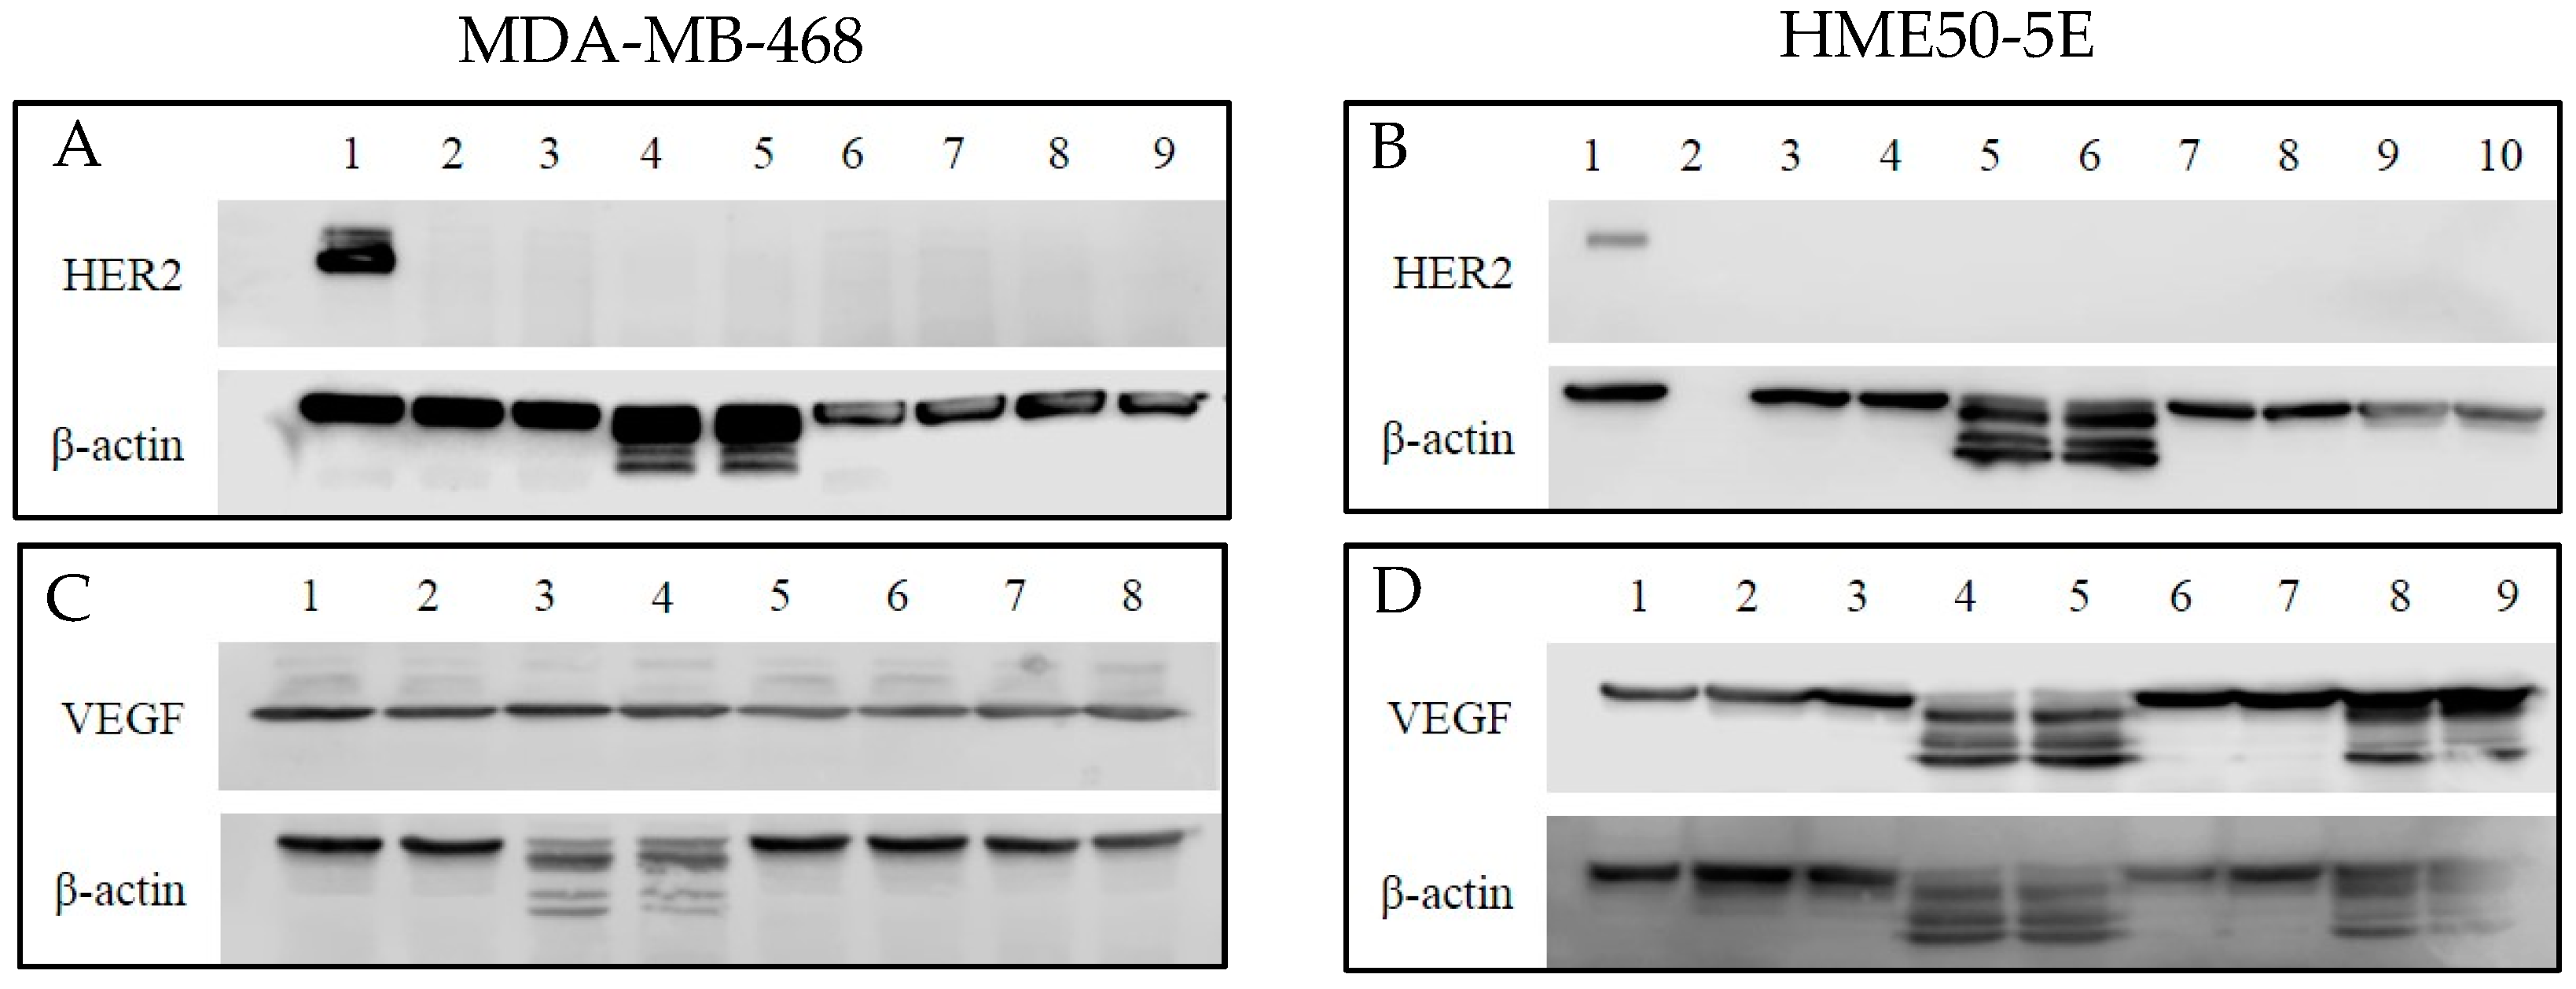
Figure 14.
Western blot analysis of the expression level of human epidermal growth factor 2 (HER2) and vascular endothelial growth factor (VEGF) in MDA-MB-468 and HME50-5E cells treated with Selenite, Trastuzumab (TZ) and Selenotrastuzumab (Se-TZ). Total cell lysates were subjected to SDS-PAGE followed by Western blotting. Membranes were probed with the anti-HER2, anti-VEGF, or anti β-actin antibodies followed by peroxidase conjugated rabbit anti-mouse antibodies and visualization was performed by the enhanced chemiluminescence (ECL) detection system. (A) HER2 and MDA-MD-468 cells. Lane 1: BT474 as HER2 positive loading control; Lanes 2 and 3: Control; Lanes 4 and 5: Selenite (2 µg as Se) treatments; Lanes 6 and 7: TZ (26.22 µg as protein) treatments; Lanes 8 and 9: Se-TZ (2 µg as Se from 26.22 µg as protein) treatments. (B) HER2 and HME50-5E. Lane 1: BT474 as HER2 positive loading control; Lane 2: Molecular weight markers; Lanes 3 and 4: Control; Lanes 5 and 6: Selenite (2 µg as Se) treatments; Lanes 7 and 8: TZ (26.22 µg as protein) treatment; Lanes 9 and 10: Se-TZ (2 µg as Se from 26.22 µg as protein) treatments. (C) VEGF and MDA-MB-468 cells. Lanes 1 and 2: Control; Lanes 3 and 4: Selenite (2 µg Se) treatments; Lanes 5 and 6: BV (30.7 µg protein) treatment; Lanes 7 and 8: Se-BV (2 µg Se from 30.7 µg protein) treatments. (D) VEGF and HME50-5E cells. Lane 1: MDA-MB-468 as VEGF positive loading control; Lanes 2 and 3: Control; Lanes 4 and 5: Selenite (2 µg Se) treatments; Lanes 6 and 7: BV (30.7 µg protein) treatment; Lanes 8 and 9: Se-BV (2 µg Se from 30.7 µg protein) treatments.
![Ijms 19 03352 g014]()
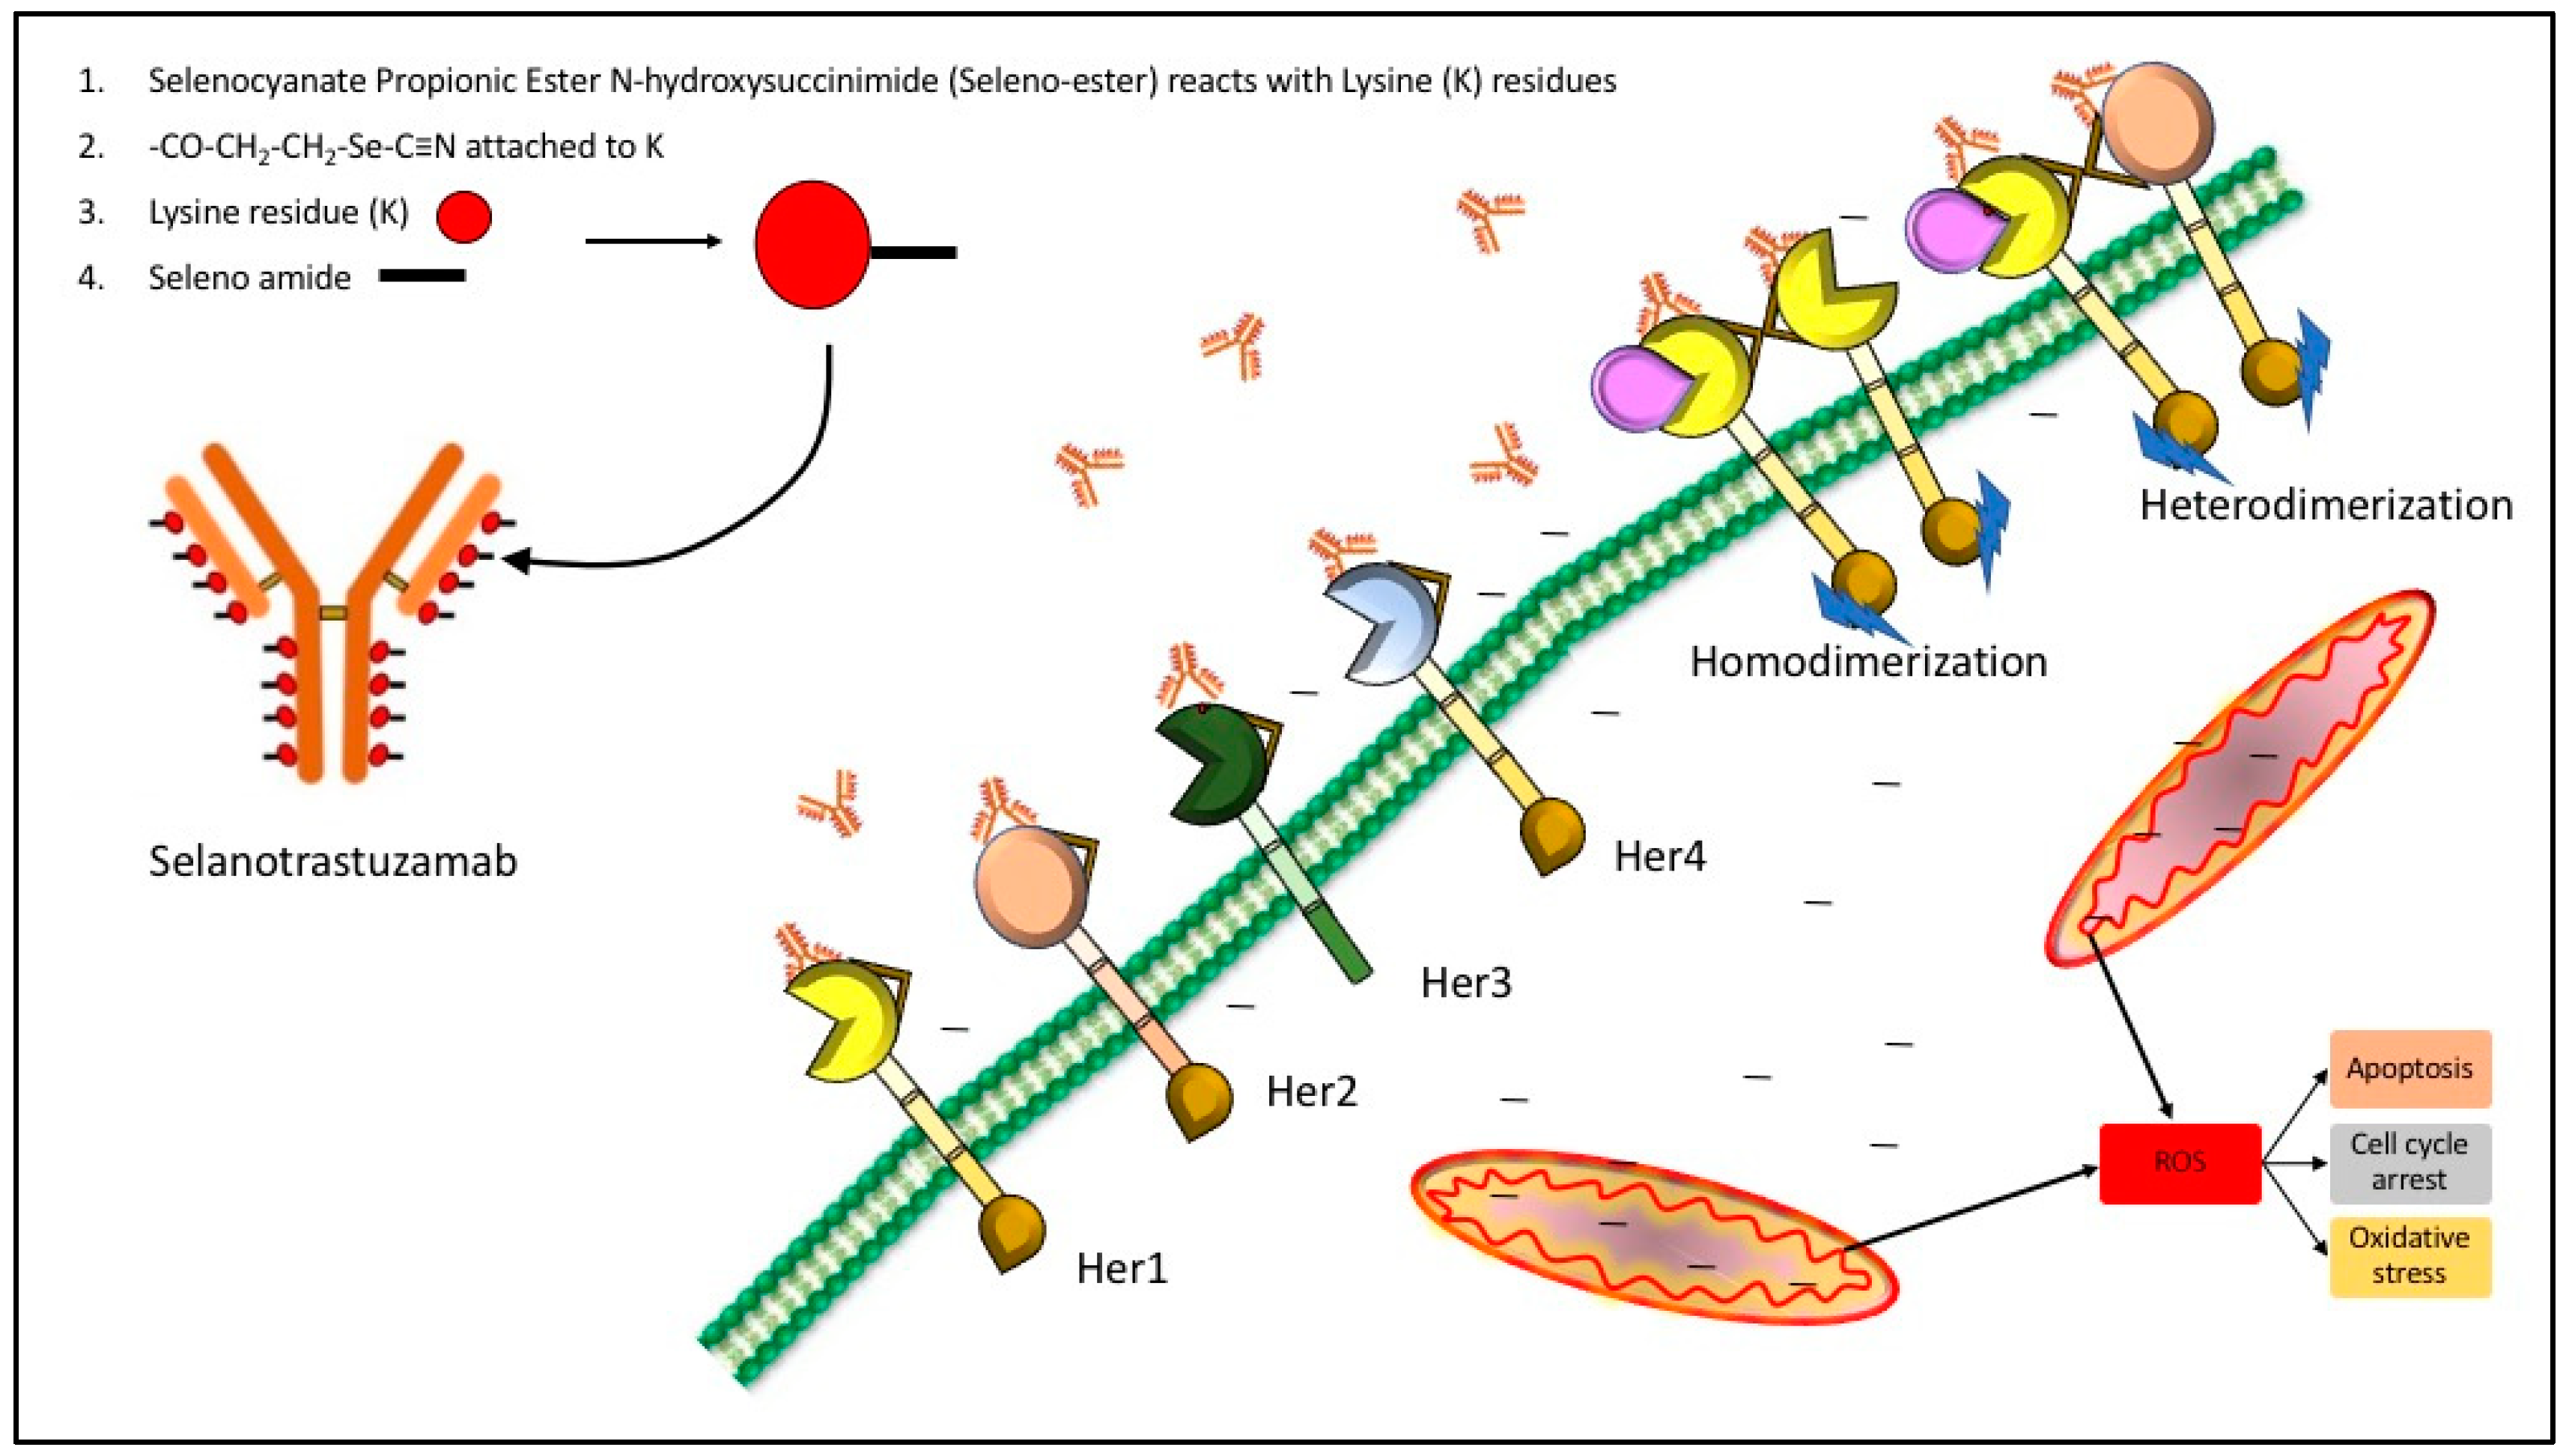
Figure 15.
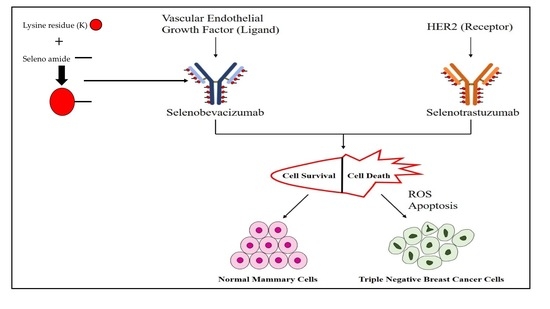
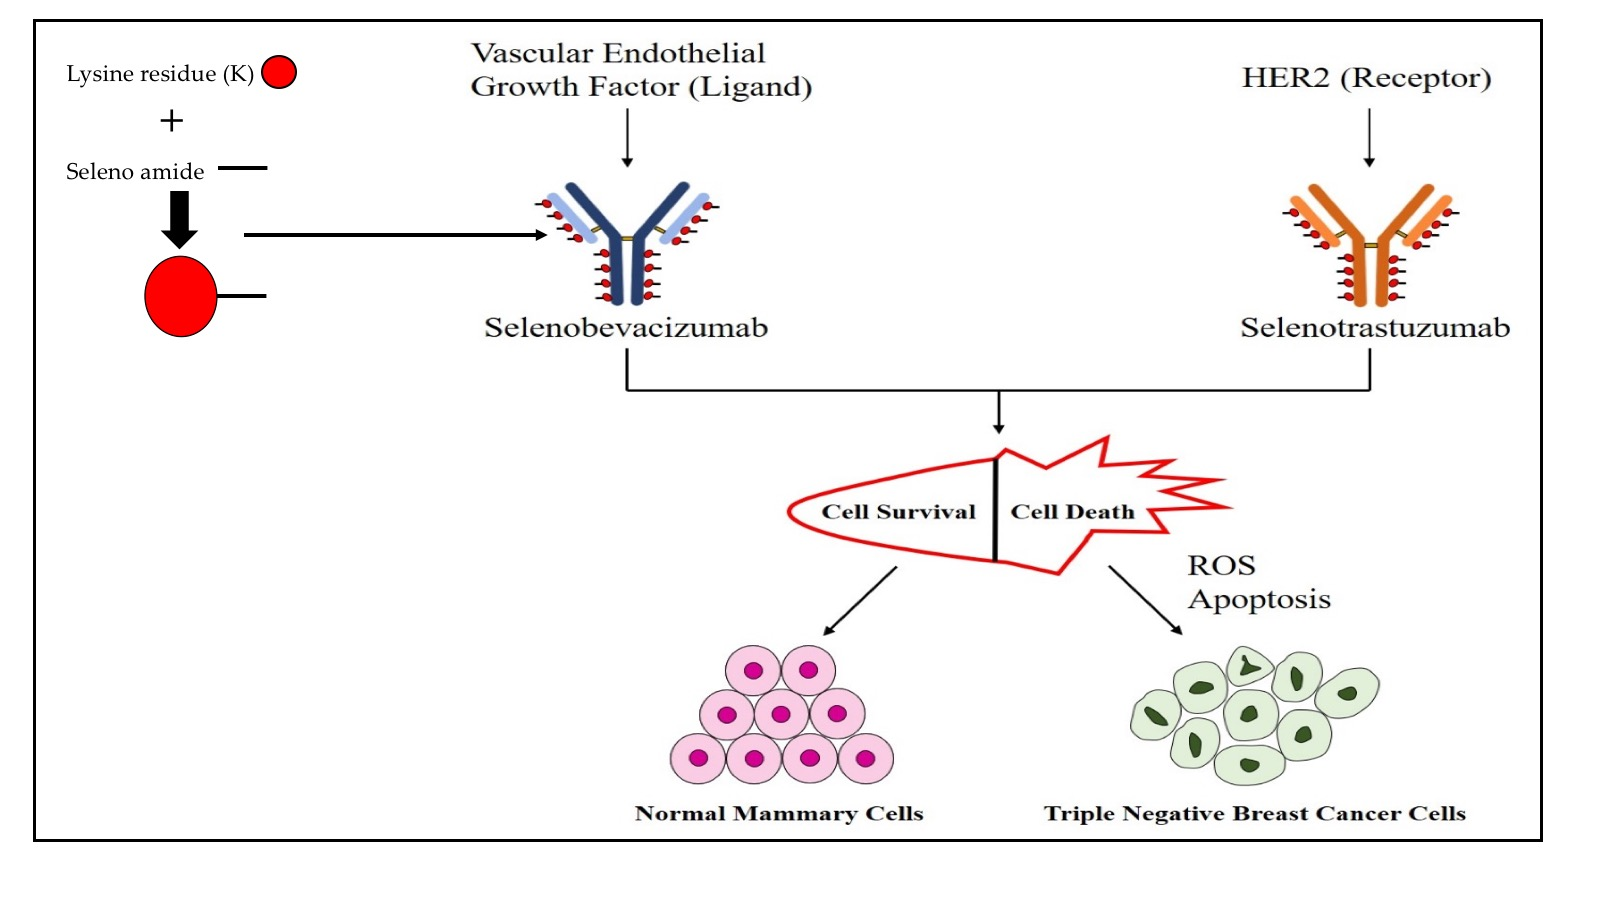
Proposed model of Selanotrastuzamab action. The promiscuity of epidermal growth factor receptor (EGFR) family binding and interaction may be one possible explanation for the observed cytotoxicity in the triple negative breast cancer cells. It is possible for Selanotrastuzamab to interact with other family members, allowing for endocytosis of a critical amount of selenium-bound trastuzumab. The selenium might then become liberated within the cytosol and enter the mitochondria where it disrupts cancer cell metabolism and produces reactive oxygen specieis (ROS).
Figure 15.
Proposed model of Selanotrastuzamab action. The promiscuity of epidermal growth factor receptor (EGFR) family binding and interaction may be one possible explanation for the observed cytotoxicity in the triple negative breast cancer cells. It is possible for Selanotrastuzamab to interact with other family members, allowing for endocytosis of a critical amount of selenium-bound trastuzumab. The selenium might then become liberated within the cytosol and enter the mitochondria where it disrupts cancer cell metabolism and produces reactive oxygen specieis (ROS).
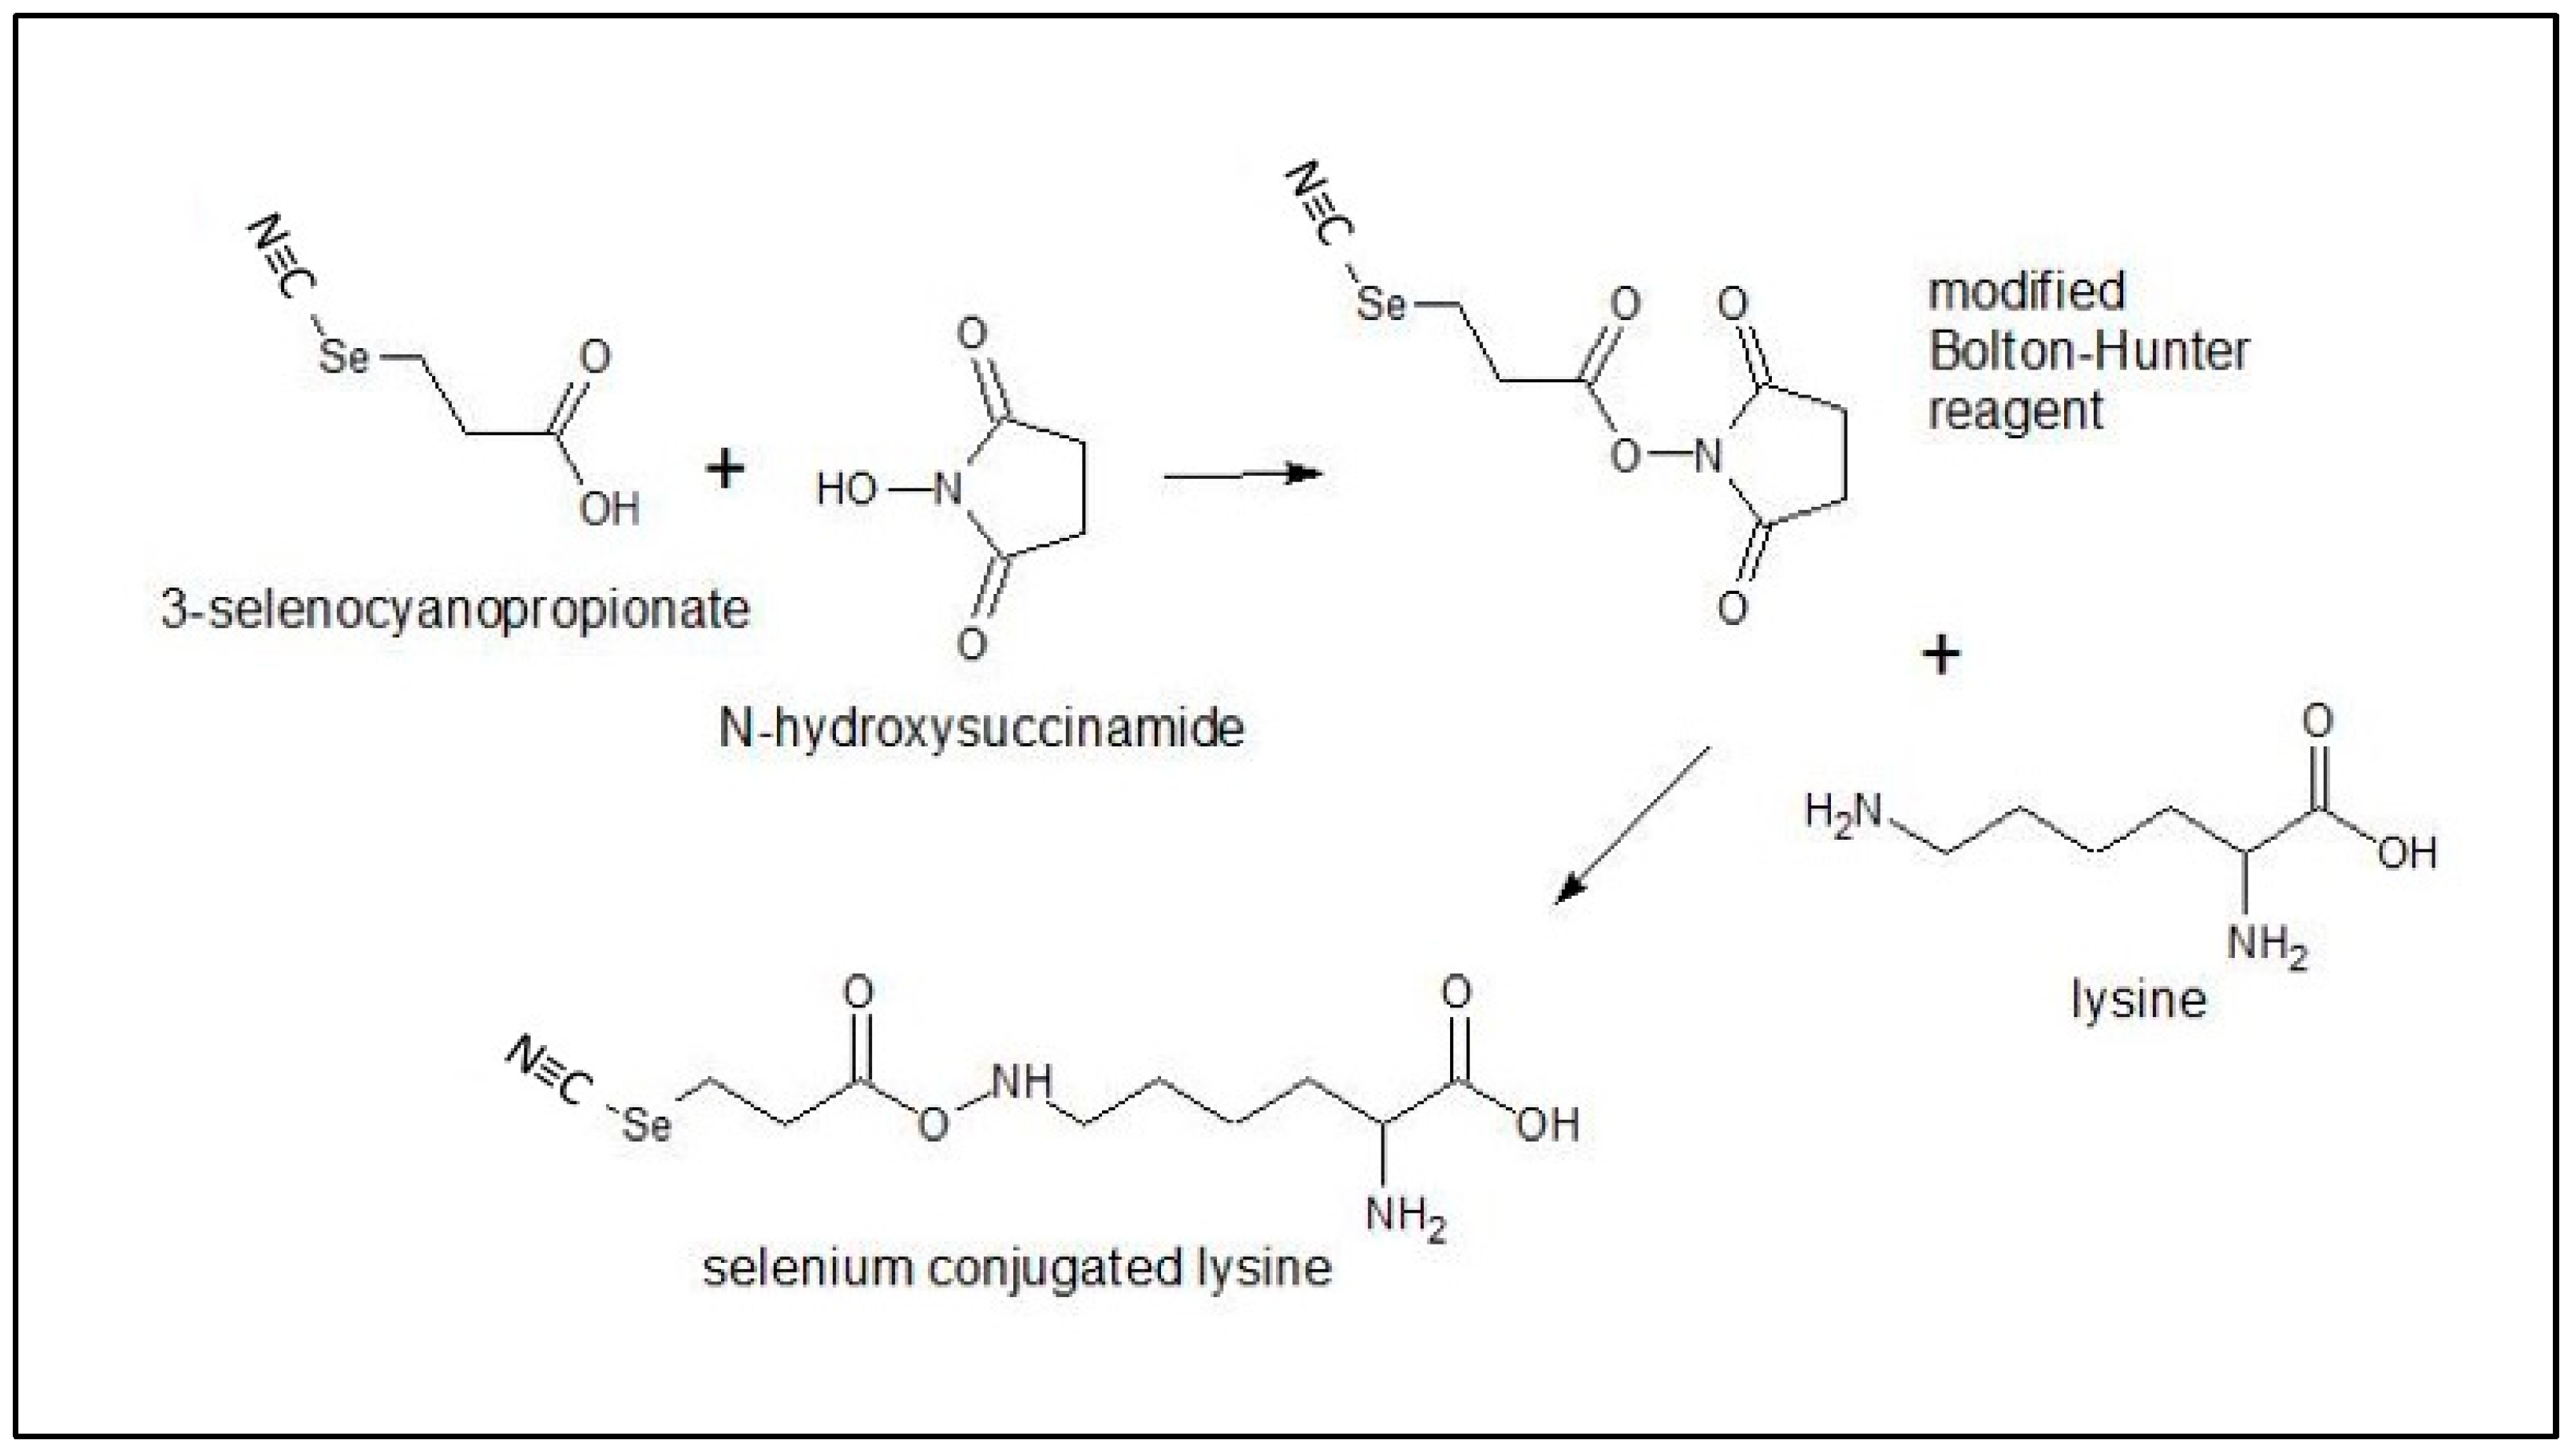
Figure 16.
Generation of the modified Bolton-Hunter reagent for conjugation of selenium to lysine.
Figure 16.
Generation of the modified Bolton-Hunter reagent for conjugation of selenium to lysine.
Table 1.
Selenium and protein concentration of native and selenium immunoconjugates following dialysis.
Table 1.
Selenium and protein concentration of native and selenium immunoconjugates following dialysis.
| | TZ | Se-TZ | BV | Se-BV |
|---|
| Selenium Concentration (mg/L) | <0.0200 | 88.00 | <0.0200 | 81.3 |
| Protein Concentration (mg/mL) | 2.82 | 2.32 | 2.73 | 2.53 |
| Selenium Concentration/ mg of protein (µg/mg) | <0.007 | 38.00 | <0.007 | 32.12 |
Table 2.
ANOVA Results for Cell Viability with Se-TZ Treatment for MDA-MB-468 Cells.
Table 2.
ANOVA Results for Cell Viability with Se-TZ Treatment for MDA-MB-468 Cells.
| Experiment Name | Treatments | Treatment Day | F Value | p Value |
|---|
| Trypan Blue | Control, Selenite, TZ and Se-TZ | Day 1 | F (3,8) = 4 | 0.052 |
| Trypan Blue | Control, Selenite, TZ and Se-TZ | Day 1 | F (3,8) = 12.52 | 0.0022 |
| Trypan Blue | Control, Selenite, TZ and Se-TZ | Day 2 | F (3,8) = 105.45 | 0.0000009 |
| Trypan Blue | Control, Selenite, TZ and Se-TZ | Day 3 | F (3,8) = 164.18 | 0.00000015 |
| Trypan Blue | Control, Selenite, TZ and Se-TZ | Day 4 | F (3,8) = 58.78 | 0.0000085 |
| Trypan Blue | Control, Selenite, TZ and Se-TZ | Day 5 | F (3,8) = 427.72 | 0.00000000361 |
| Trypan Blue | Control, Selenite, TZ and Se-TZ | Day 6 | F (3,8) = 242.71 | 0.0000000341 |
| Trypan Blue | Control, Selenite, TZ and Se-TZ | Day 7 | F (3,8) = 5.5 | 0.0241 |
Table 3.
ANOVA Results for Cell Metabolism with Se-TZ Treatment for MDA-MB-468 Cells.
Table 3.
ANOVA Results for Cell Metabolism with Se-TZ Treatment for MDA-MB-468 Cells.
| Experiment Name | Treatments | Treatment Day | F Value | p Value |
|---|
| MTT | Control, Selenite, TZ and Se-TZ | Day 1 | F (3,8) = 2.41 | 0.142 |
| MTT | Control, Selenite, TZ and Se-TZ | Day 2 | F (3,8) = 0.19 | 0.9018 |
| MTT | Control, Selenite, TZ and Se-TZ | Day 3 | F (3,8) = 2.13 | 0.175 |
| MTT | Control, Selenite, TZ and Se-TZ | Day 4 | F (3,8) = 6.19 | 0.013 |
| MTT | Control, Selenite, TZ and Se-TZ | Day 5 | F (3,8) = 45.69 | 0.000022 |
| MTT | Control, Selenite, TZ and Se-TZ | Day 6 | F (3,8) = 58.78 | 0.00000857 |
Table 4.
ANOVA Results for Cell Viability with Se-BV Treatment for MDA-MB-468 Cells.
Table 4.
ANOVA Results for Cell Viability with Se-BV Treatment for MDA-MB-468 Cells.
| Experiment Name | Treatments | Treatment Day | F Value | p Value |
|---|
| Trypan Blue | Control, Selenite, BV and Se-BV | Day 0 | F (3,8) = 6.24 | 0.0173 |
| Trypan Blue | Control, Selenite, BV and Se-BV | Day 1 | F (3,8) = 15.43 | 0.0010909 |
| Trypan Blue | Control, Selenite, BV and Se-BV | Day 2 | F (3,8) = 71.05 | 0.00000415 |
| Trypan Blue | Control, Selenite, BV and Se-BV | Day 3 | F (3,8) = 33.96 | 0.000067 |
| Trypan Blue | Control, Selenite, BV and Se-BV | Day 4 | F (3,8) = 69.1 | 0.000004 |
| Trypan Blue | Control, Selenite, BV and Se-BV | Day 5 | F (3,8) = 50.47 | 0.000015 |
| Trypan Blue | Control, Selenite, BV and Se-BV | Day 6 | F (3,8) = 40.38 | 0.000035 |
| Trypan Blue | Control, Selenite, BV and Se-BV | Day 7 | F (3,8) = 2.79 | 0.1096 |
Table 5.
ANOVA Results for Cell Metabolism with Se-BV Treatment for MDA-MB-468 Cells.
Table 5.
ANOVA Results for Cell Metabolism with Se-BV Treatment for MDA-MB-468 Cells.
| Experiment Name | Treatments | Treatment Day | F Value | p Value |
|---|
| MTT | Control, Selenite, BV and Se-BV | Day 1 | F (3,8) = 0.41 | 0.7479 |
| MTT | Control, Selenite, BV and Se-BV | Day 2 | F (3,8) = 0.15 | 0.9278 |
| MTT | Control, Selenite, BV and Se-BV | Day 3 | F (3,8) = 0.1 | 0.9594 |
| MTT | Control, Selenite, BV and Se-BV | Day 4 | F (3,8) = 2.02 | 0.1894 |
| MTT | Control, Selenite, BV and Se-BV | Day 5 | F (3,8) = 29.58 | 0.000111 |
| MTT | Control, Selenite, BV and Se-BV | Day 6 | F (3,8) = 69.38 | 0.0000045 |


