Article

Systematic Identification and Characterization of O-Methyltransferase Gene Family Members Involved in Flavonoid Biosynthesis in Chrysanthemum indicum L.

Institute of Chinese Medicinal Materials, Nanjing Agricultural University, Nanjing 210095, China
*
Author to whom correspondence should be addressed.
Int. J. Mol. Sci. 2024, 25(18), 10037; https://doi.org/10.3390/ijms251810037
Submission received: 17 August 2024 / Revised: 10 September 2024 / Accepted: 10 September 2024 / Published: 18 September 2024
(This article belongs to the Section Bioactives and Nutraceuticals)

Abstract

:
Chrysanthemum indicum L. capitulum is an enriched source of flavonoids with broad-ranging biological activities, mainly due to their anti-inflammatory, anti-cancer, immune regulation, anti-microbial activity, hepatoprotective, and neuroprotective effects. The O-methylation of various secondary metabolites has previously been demonstrated to be mainly catalyzed by S-adenosyl-L-methionine-dependent O-methyltransferase (OMT) proteins encoded by the OMT gene family. However, limited comprehensive study was published on the OMT gene family, especially the CCoAOMT subfamily, involved in the O-methylation of flavonoids in Chrysanthemum. Here, we analyzed the spatiotemporal expression patterns of C. indicum OMT genes in leaf and flower at different developmental stages. Transcriptome sequencing and qRT-PCR analysis showed that COMTs were mainly highly expressed in capitulum, especially in full bloom, while CCoAOMTs were mainly highly expressed in leaves. Correlation analysis of OMT gene expression and flavonoids accumulation revealed that four OMTs (CHR00029120, CHR00029783, CHR00077404, and CHR00078333) were putatively involved in most methylated flavonoids biosynthesis in the capitulum. Furthermore, we identified a true CCoAOMT enzyme, CiCCoAOMT1, and found that it catalyzed O-methylation of quercetin and luteolin at the 3′-OH position. In summary, this work provides an important theoretical basis for further research on the biological functions of OMTs in C. indicum.

Graphical Abstract

1. Introduction

Chrysanthemum indicum L. is an economically important multi-purpose horticultural crop with medicinal and ornamental value. It is rich in flavonoids, and more than 60 methoxy flavonoids have been identified, among which chrysoeriol, acacetin, linarin, apigenin, and luteolin are the main anti-inflammatory components of C. indicum [1,2]. Flavonoids are widely distributed secondary metabolites in plants, with diverse biological activities, and are beneficial to human health. Plant flavonoids are important medicinal components [3], and their biological functions are closely related to chemical structures. O-methylation modification can increase the stability, protein affinity, and bioavailability of flavonoids, thereby enhancing their medicinal activities. Studies have confirmed that O-methylated flavonoids exhibit stronger antioxidant [4], anti-inflammatory [5], anti-cancer functions [6], higher bioavailability [7], and more medicinal value.
The O-methylation modification of plant flavonoids is catalyzed by S-adenosyl-L-methionine (SAM)-dependent O-methyltransferase gene (OMT) (EC 2.1.1). According to protein molecular weight and cation dependence, the plant OMT family can generally be classified as two distinct subfamilies, caffeoyl-CoA O-methyltransferase (CCoAOMT) and caffeic acid O-methyltransferase (COMT) [8]. The number of members of the COMT subfamily is relatively large, and the molecular weight of its protein subunits sizes is generally between 38 and 43 kDa, often forming homodimers, and the catalysis does not depend on cations [9,10]. The currently reported flavonoid OMT (FOMT) primarily belong to this subfamily [11]. The CCoAOMT subfamily has relatively few members, and its protein subunits sizes are relatively lower (23–30 kDa) and are mostly cation-dependent. Some of CCoAOMTs specifically catalyze caffeoyl-CoA, a key enzyme in the lignin biosynthesis pathway [12,13]. Based on substrate preference, the CCoAOMT subfamily is classified into two subgroups: phenylpropanoid and flavonoid O-methyltransferase (PFOMT) and true CCoAOMT. PFOMT, also known as CCoAOMT-like, has pronounced substrate preferences for caffeoyl-CoA and flavonoids, with special reference to anthocyanins and flavonols [14,15]. Although the true CCoAOMT subgroup is responsible for lignin biosynthesis, several members have been reported to be able to methylate flavonoids, such as IiOMT1 from Isatis indigotica [16], MpalOMT3 from Marchantia paleacea [17], and OsOMT26 from Oryza sativa [18].
OMT gene family member identification and functional characterization have been performed in multiple plant species such as Arabidopsis thaliana [19], Citrus [20], Glycine max (L.) Merr. [21], Plagiochasma appendiculatum [22], Ocimum basilicum [23], Vitis vinifera [24], and Arachis hypogaea [25]. The OMT proteins of different species have high homology, especially those with the same catalytic site and from the same family or genus. Consequently, using phylogenetic trees and functional identification, potential genes for flavonoid O-methylation can be predicted in silico [26]. Up to now, several OMT genes have been proved to be related to the methylation of flavonoids in the family Aizoaceae. For example, CtMROMT purified from safflower seeds has been demonstrated to methylate apigenin efficiently into acacetin [27]. Similar findings were found in other plants. Pa4′OMT (Plagiochasma appendiculatum) is a multifunctional OMT that contributes to converting flavonoids such as luteolin, naringenin, kaempferol, quercetin, genistein, scutellarein, and genkwanin to the corresponding methylation products [28]. CmCCoAOMT1 (caffeoyl-CoA O-methyltransferase 1) in Chrysanthemum morifolium and CgCOMT (caffeic acid 3-O-methyltransferase) in Chrysanthemum grandiflorum (Ramat.) Kitamura may be related to lignin synthesis [29,30]. The methoxylated flavonoid chrysoeriol serves as a quality evaluation indicator for C. indicum. Some progress has been made in the study of CiFNSII [31] and RhaT [32] involved in flavone biosynthesis. However, few studies have performed a comprehensive investigation of CCoAOMTs involved in the biosynthesis of methoxylated flavonoid in C. indicum.
In this study, we investigated the OMT gene family at the genome-wide level and potential members involved in flavonoids methylation in C. indicum based on published Chrysanthemum genome sequences. Moreover, we analyzed transcriptome data on C. indicum and identified a true CCoAOMT enzyme, CiCCoAOMT1, catalyzing O-methylation of flavonoids at the 3′-OH position in vitro and in vivo assays. The research results conduce to understand the characteristics of the OMT gene family in C. indicum, in particular, and provide useful information for screening the members involved in O-methylated flavonoids synthesis.

2. Results

2.1. Identification and Sequence Analysis of OMT Genes in C. indicum

In the Chrysanthemum genome, 31 and 48 genes encoding CCoAOMTs and COMTs, respectively, were identified and named as CiCOMTs, CiCCoAOMTs. All sequence characteristics were evaluated and the details are summarized in Table S1. The amino acids number of the COMT proteins ranged from 192 to 447, while those of CCoAOMT proteins ranged from 175 to 305. The MW of COMT proteins varied between 21.14 and 50.00 kDa and the pI varied between 4.67 and 8.25, whereas for CCoAOMT proteins, the MW varied from 20.24 to 35.43 kDa, and the pI varied from 4.50 to 9.88. The instability index of COMTs varied from 22.31 to 44.77. The instability indices of COMTs and CCoAOMTs were similar, ranging from 22.31 to 44.77 and 24.98 to 44.28, respectively. The number of negative GRAVY for COMT and CCoAOMT proteins is 32 (67%) and 33 (97%), respectively, indicating that they are mostly hydrophilic proteins. COMT and CCoAOMT genes tended to consist of two exons, with methylation domains about 210 bp in length. According to the predicted subcellular localization results, OMTs were mostly localized in the cytoplasm, while a few were located in the chloroplast, cytoskeleton, endoplasmic reticulum, or nucleus.

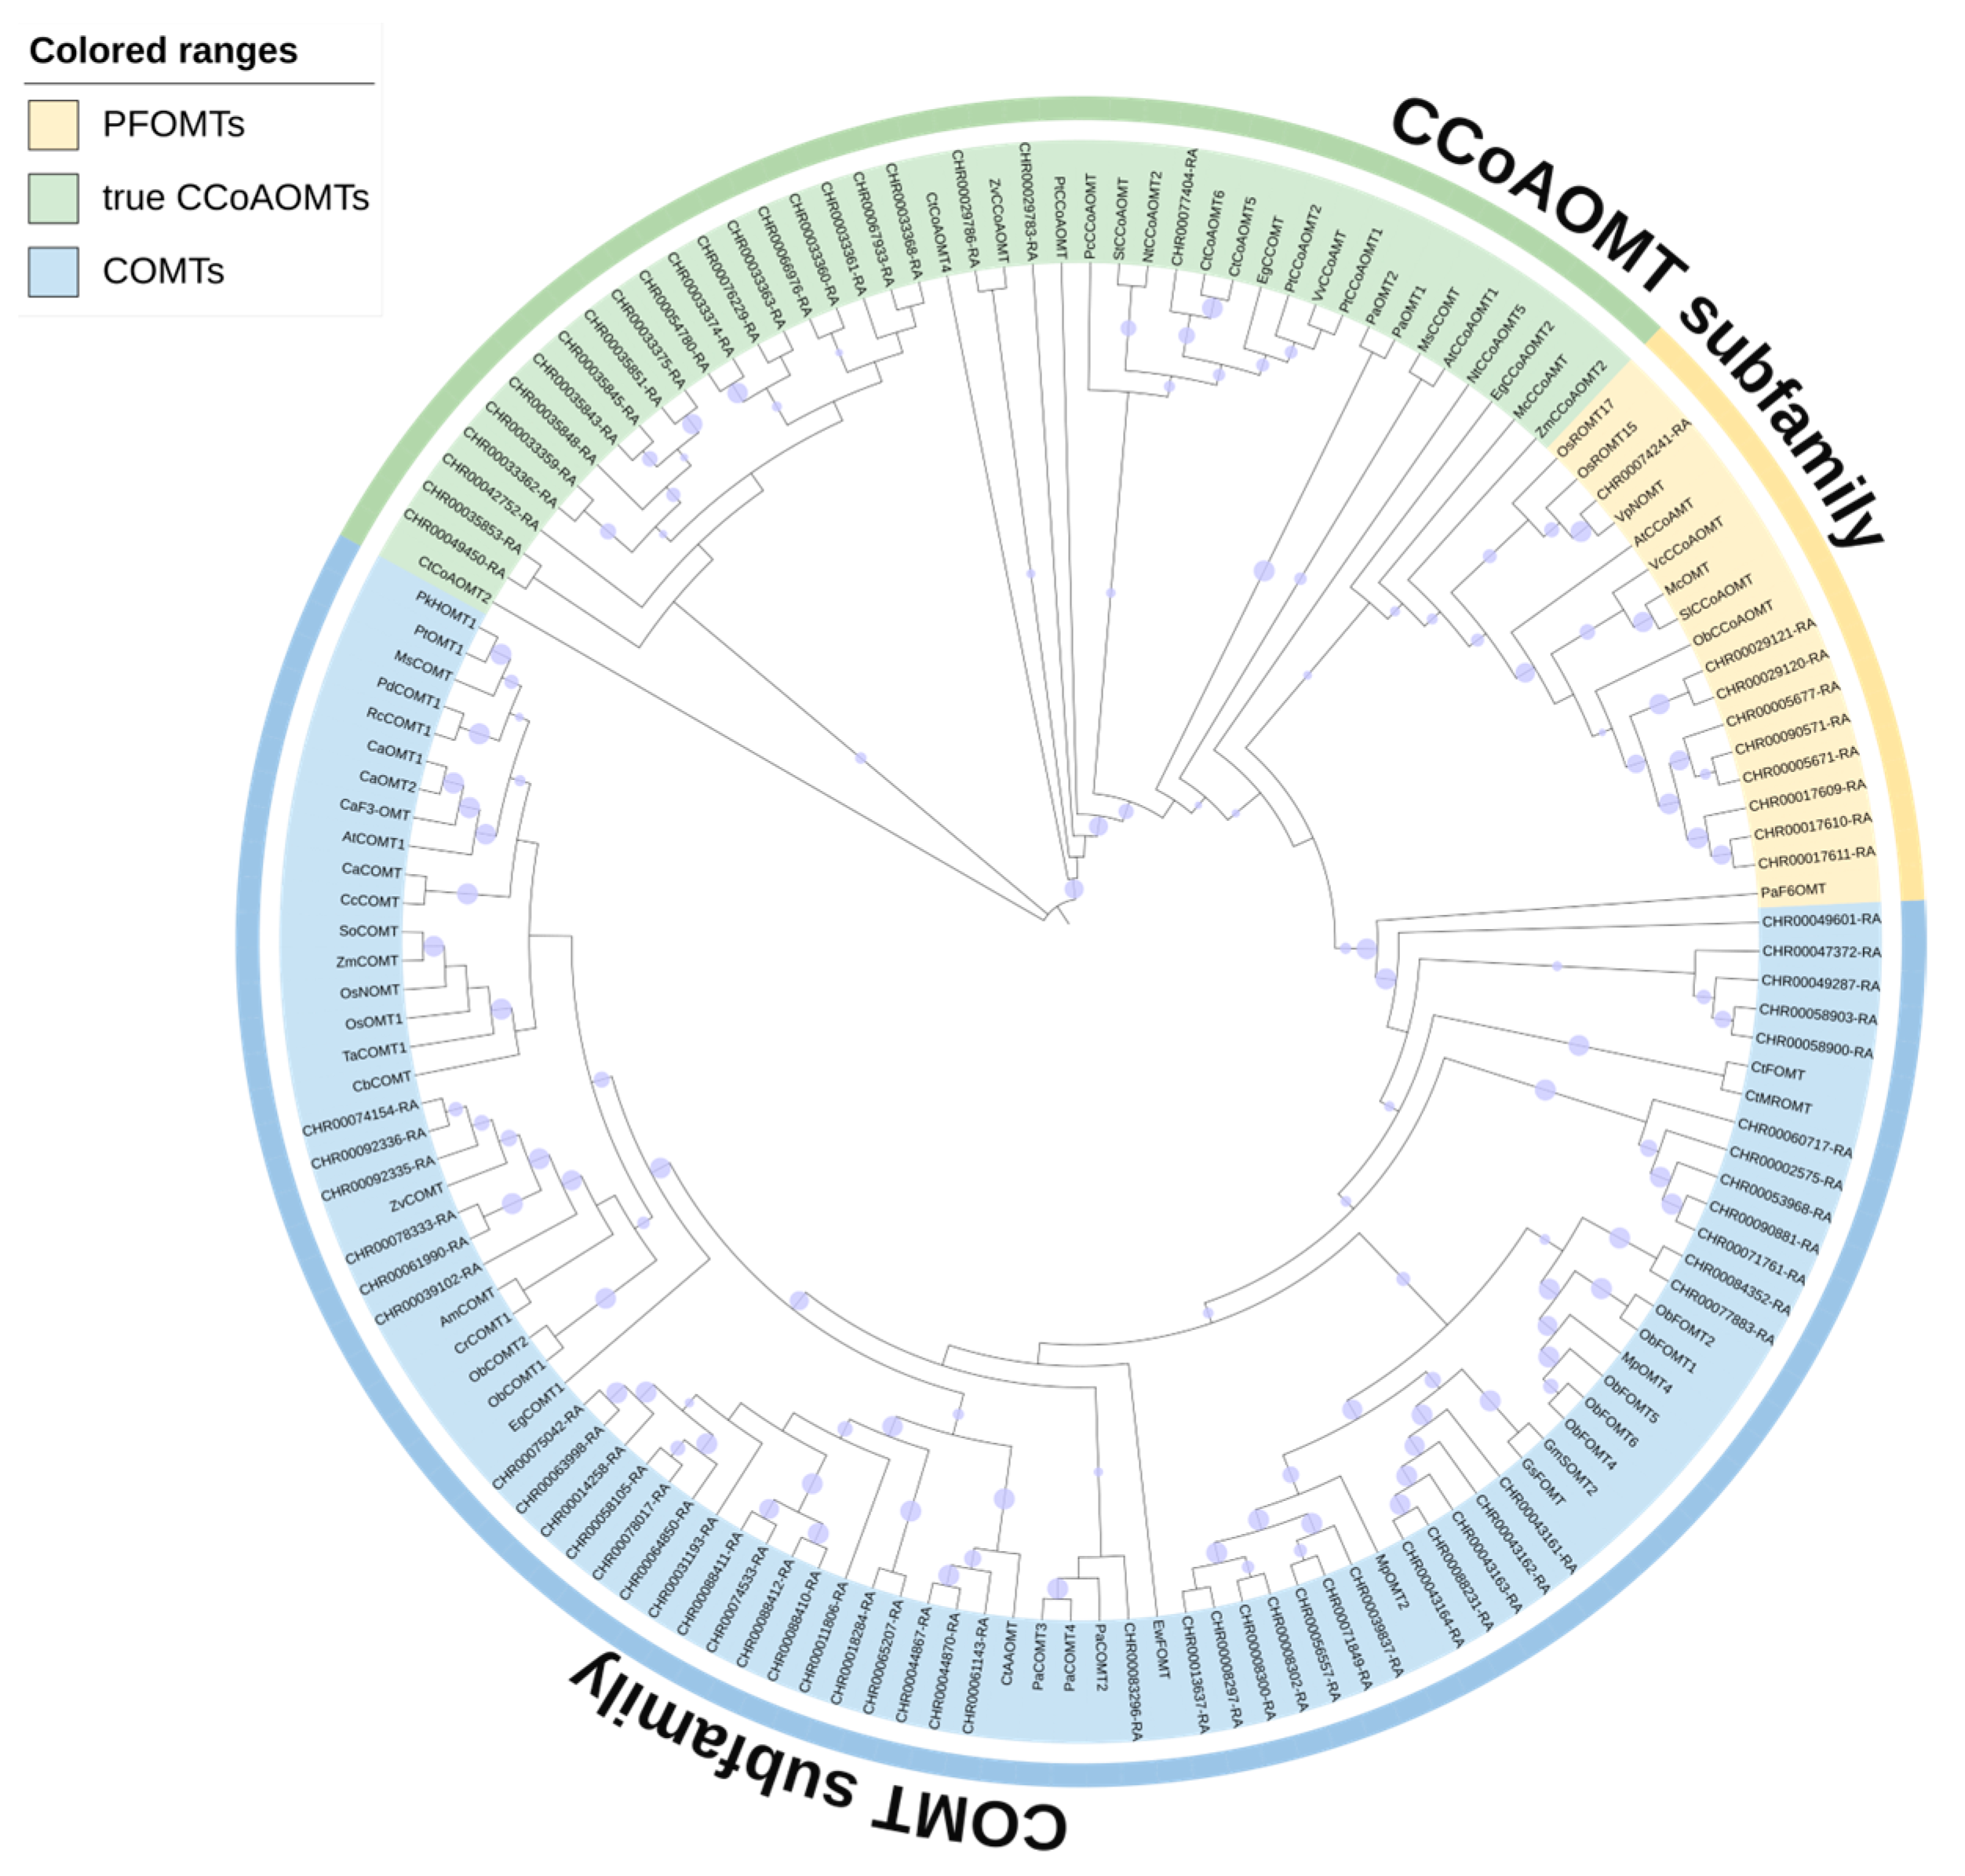
2.2. Phylogenetic Analysis of OMTs

An unrooted phylogenetic tree (Figure 1) was constructed using the full-length protein sequences found in C. indicum, Arabidopsis thaliana, Oryza sativa, Ocimum basilicum, etc., to explore the evolution of the OMT family. The corresponding bootstrap values are represented by a purple circle on the clade (bootstrap value > 50 is displayed, and the size of the circle indicates the high and low values).
The phylogenetic tree clearly shows that OMT proteins are divided into two subfamilies based on their sequence similarity and topology, including the COMT subfamily (blue shading) and the CCoAOMT subfamily, of which 79 C. indicum OMTs are distributed in the two subfamilies. The CCoAOMT subfamily of the reference species can be further divided into the PFOMT subgroup (yellow shading) and the true CCoAOMT subgroup (green shading). Inferred from the homology between species, the C. indicum CCoAOMTs in yellow and green shadows may have correspondingly similar biological activities. The C. indicum OMTs were spaced in distribution from other plant OMTs on the phylogenetic tree, indicating that the OMT family is highly conserved during plant evolution.

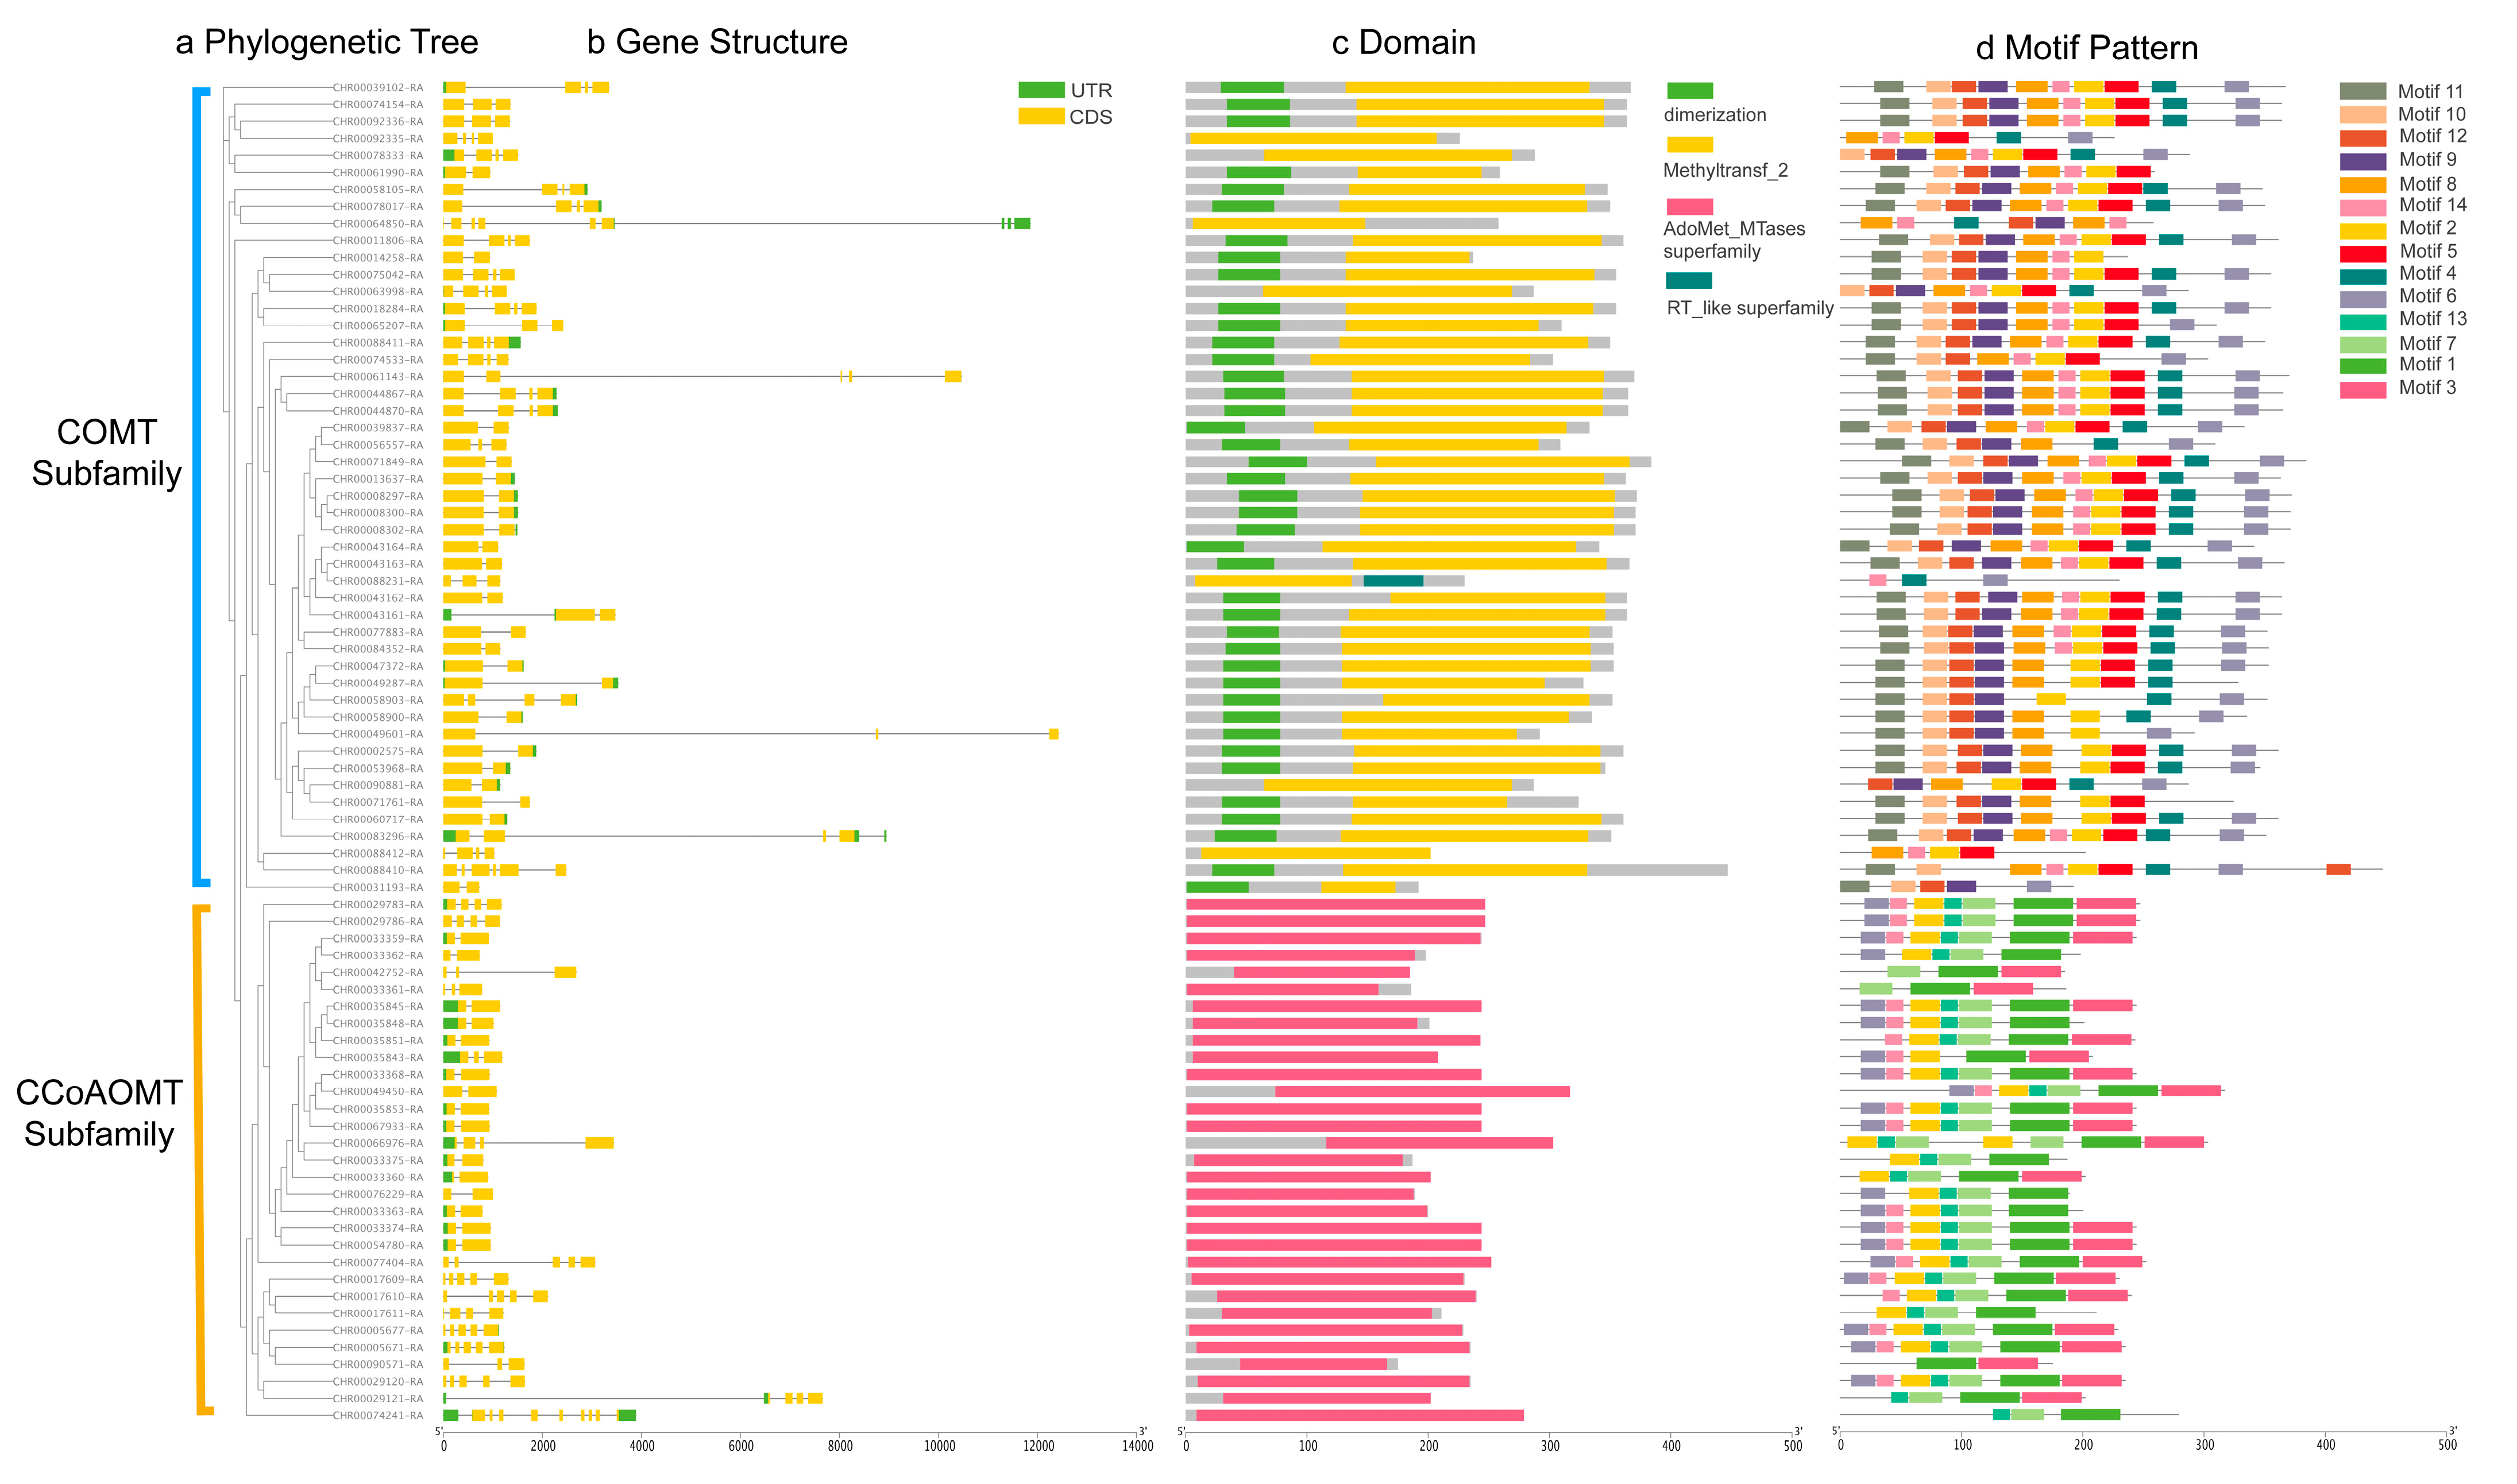
2.3. Gene Structure and Protein Conserved Motifs of C. indicum OMT Genes Family

The phylogenetic tree of C. indicum OMTs was interactively analyzed with its gene structure and protein structure, and the differences in gene structure and protein structure were explored from an evolutionary perspective. Consistent with the results of the evolutionary relationship analysis in Section 2.2, the OMT family can be clearly divided into two clades: the COMT subfamily and the CCoAOMT subfamily (Figure 2a). The Chrysanthemum genome was assembled to the scaffold level, with a contig N50 of 130.7 kb, which is much larger than 10 kb, indicating good contiguity [33]. Gene structure analysis revealed that the exons and introns count in OMT genes are varied (Figure 2b). Exon numbers of CiCCoAOMTs ranged from 4 to 10, while those of CiCOMTs ranged from 2 to 9. Both of them typically contained two exons and one intron. Due to the limitation of genome assembly to the scaffold level, chromosomal locations analysis cannot be performed, and intron–exon patterns reflect the OMTs gene structure to some extent. Despite exon sizes being fairly conserved, the length of untranslated regions varied greatly.
Conserved domain analysis showed that the amino acid sequences of CiCOMT proteins were relatively long, and they all contained the conserved domain Methyltransf_2 (Pfam: pfam00891) of O-methyltransferase. The N-terminus of most CiCOMT members contained a dimerization domain (Pfam: pfam 08100), which plays an important role in the formation of protein dimers. In addition, COMT member CHR00088231 also contains an RT_like superfamily domain. CiCCoAOMT proteins have relatively short amino acid sequences and contains only one domain, the AdoMet_Mtases superfamily, which is a conserved domain of class I methyltransferases (Figure 2c).
Fourteen conserved motifs were identified and labeled as motifs 1–14 (Figure 2d, Table 1). Based on MEME results, the majority of CiCOMT proteins contained ten conserved motifs. However, some proteins such as CHR00088231 only had motifs 4, 6, and 14. The number of motifs found in CiCCoAOMT was relatively small, among which motif 7 is completely conserved. CiCCoAOMT proteins were widely distributed with motifs 1, 3, and 13, indicating that these motifs may be important for the function of the protein.
According to these findings, OMTs have different structural patterns, and members of the same group have similar exon–intron architecture and motifs composition.

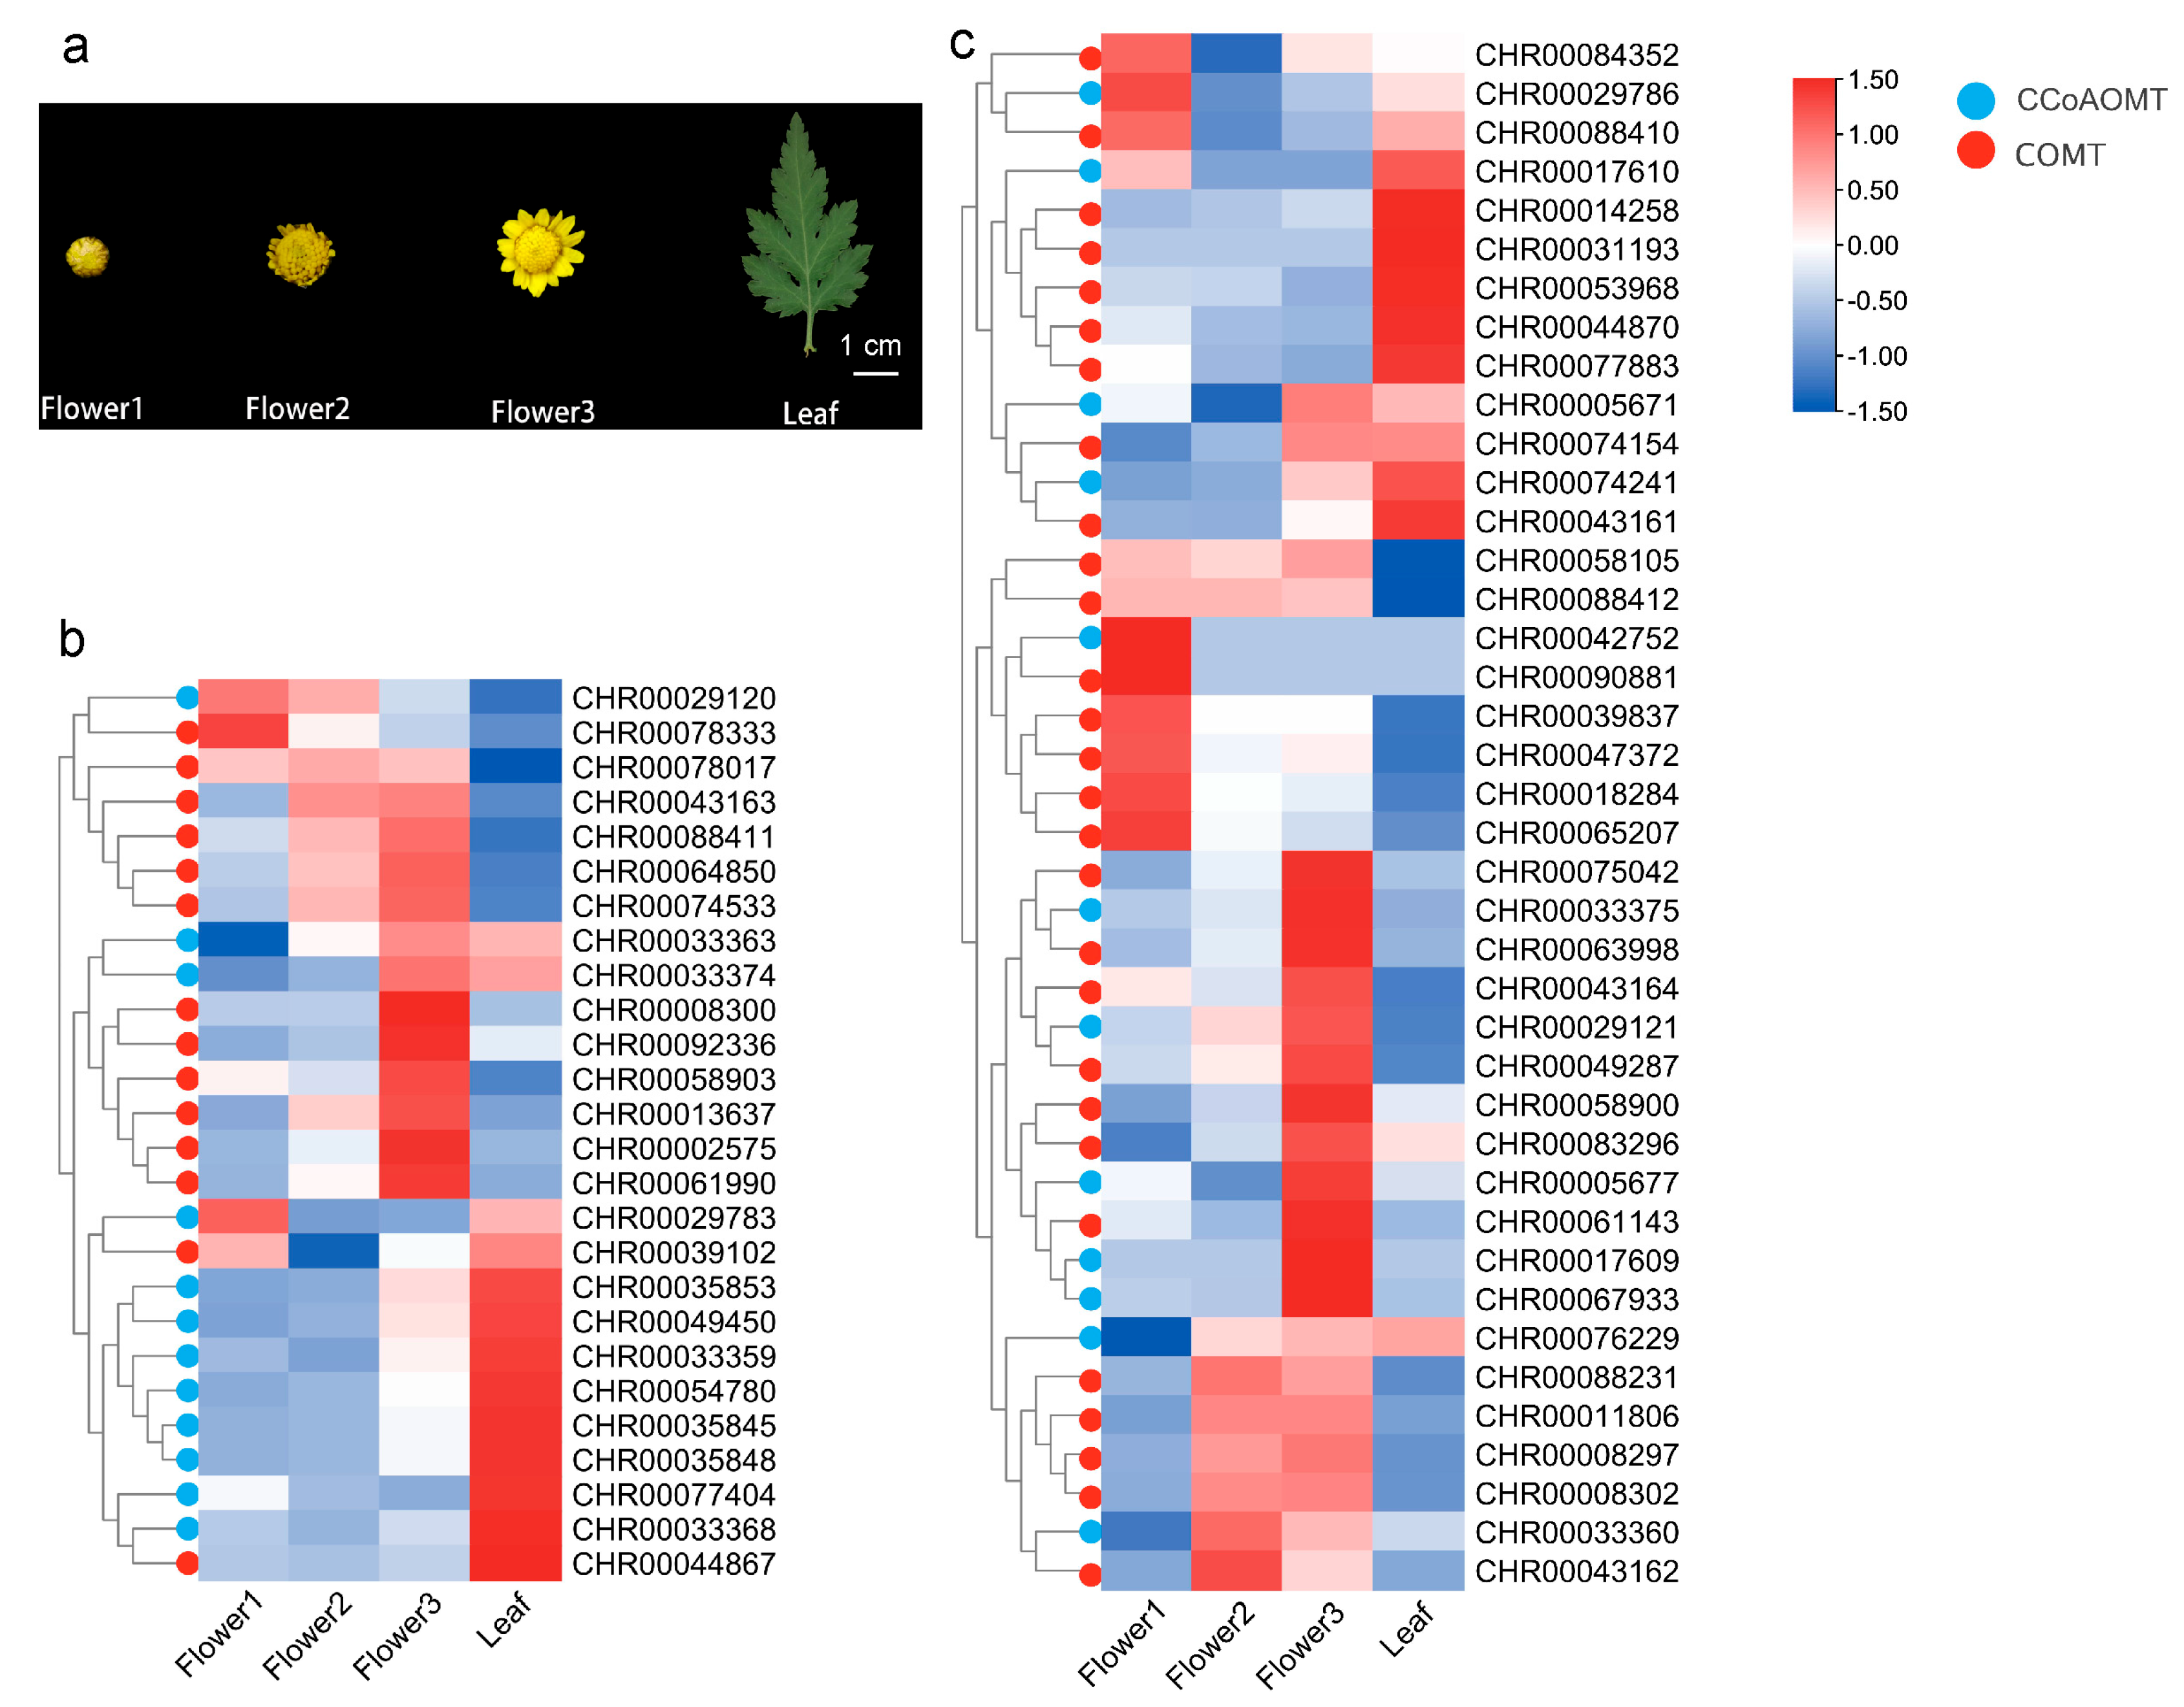
2.4. Expression Patterns of C. indicum OMTs Based on the RNA-seq Data

Looking into the expression profiles of C. indicum OMT genes is essential to determine how they affect the synthesis of flavonoids. The RNA-Seq data of the capitulum and leaves of C. indicum (Figure 3a) were used to explore spatiotemporal expression patterns of OMTs. The heatmap hierarchical clustering analysis (Figure 3b) revealed that across the observed samples, the expression profiles of OMT members differed greatly. Among them, twenty-six OMT genes (33% of all C. indicum OMT genes) were expressed in relatively high abundance (FPKM > 10 for at least one stage), including fourteen COMTs and twelve CCoAOMTs. Only nine OMT genes with the highest expression abundance (FPKM > 50 for at least one stage) were CHR00013637, CHR00029783, CHR00033359, CHR00039102, CHR00043163, CHR00064850, CHR00074533, CHR00077404, CHR00088411. Most COMTs showed relatively high expression in the capitulum, with the highest transcript levels at the flower3 stage, and were clustered together in the heatmap (Figure 3b). CHR00013637, CHR00002575, CHR00043163, CHR00061990, CHR00074533, and CHR00078333 only showed expression in the capitulum. Most CCoAOMTs showed high expression in leaves, such as CHR00049450, CHR00035853, CHR00033359, CHR00054780, CHR00035845, CHR00035848, CHR00077404, and CHR00033368. There were forty OMT genes (51% of all C. indicum OMT genes) with relatively low expression abundance (FPKM value < 10 at each stage), of which twenty-eight were COMT members and twelve were CCoAOMT members (Figure 3c). Furthermore, no transcript of thirteen OMT genes (16% of all C. in dicum OMT genes) was detected.

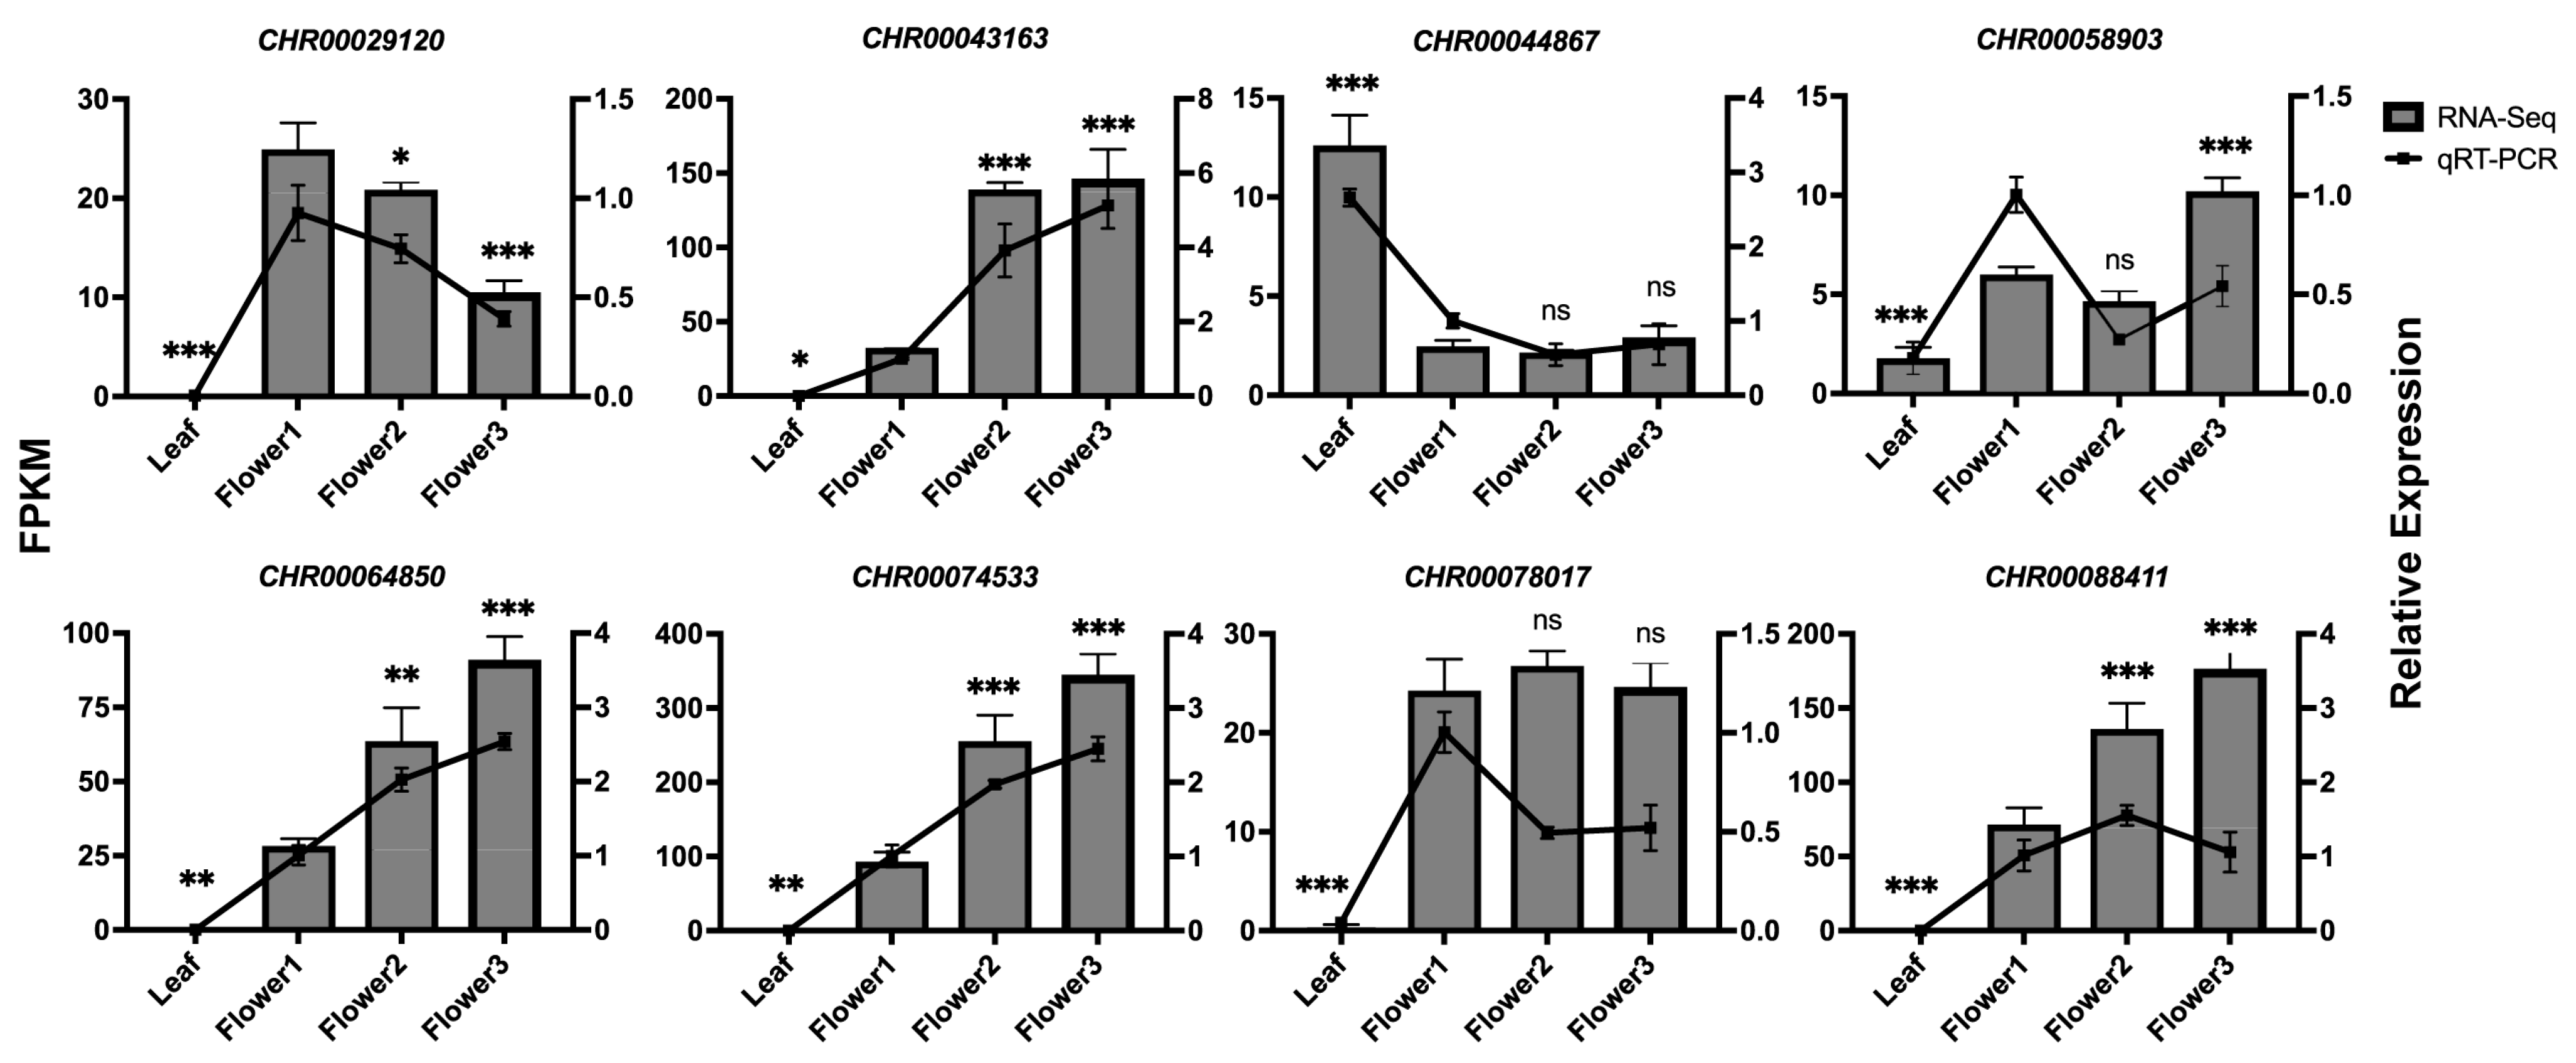
2.5. qRT-PCR Analysis of C. indicum OMTs Expression in Various Tissues

To validate the RNA-seq data, we performed qRT-PCR assays with independent samples collected from the leaves and capitulum at different developmental stages. It has been determined that a small subset of plant CCoAOMTs known as PFOMTs exhibit substrate selectivity for phenylpropanoids such as flavonoids [8]. The percent identity between CHR00029120 (CCoAOMT) and ObCCoAOMT was 61.37%, higher than 50%, as performing Align Sequences Protein BLAST in NCBI. Meanwhile, according to the phylogenetic tree (Figure 1), it is speculated that CHR00029120 may be homologous to ObCCoAOMT, which has been characterized by exhibiting a substrate preference for flavonoids. CHR00029120 (CCoAOMT) and a few COMT genes with relatively high transcript levels (FPKM > 50) were chosen based on the study above for qRT-PCR expression detection in different tissues and growing capitulum. The primers for these selected genes are listed in Table S4 and the melting curve shows a single peak (Figure S2), confirming the amplification specificity. The qRT-PCR analysis results are presented in Figure 4. Six OMT genes (CHR00029120, CHR00043163, CHR00064850, CHR00074533, CHR00078017, and CHR00088411) showed a nearly non-detectable transcript level in leaves, i.e., specifically expressed in the capitulum. These genes’ expression patterns could be roughly divided into three categories. Pattern one comprised one gene (CHR00029120) that was downregulated with the capitulum developmental process, reaching a low level at the flower3 stage. Pattern two included four genes (CHR00043163, CHR00064850, CHR00074533, and CHR00088411) that were upregulated during capitulum development and had high transcript levels at the flower3 stage, which was opposite to the pattern one expression trend. Pattern three included one gene (CHR00078017) with a relatively stable transcript concentration throughout capitulum development. In all tissues detected, CHR00044867 and CHR00058903 were constitutively expressed. The former was strikingly upregulated in the leaves, while the latter showed fluctuating expression. The qRT-PCR results for these chosen genes were essentially similar to the RNA-seq results in terms of their expression levels.

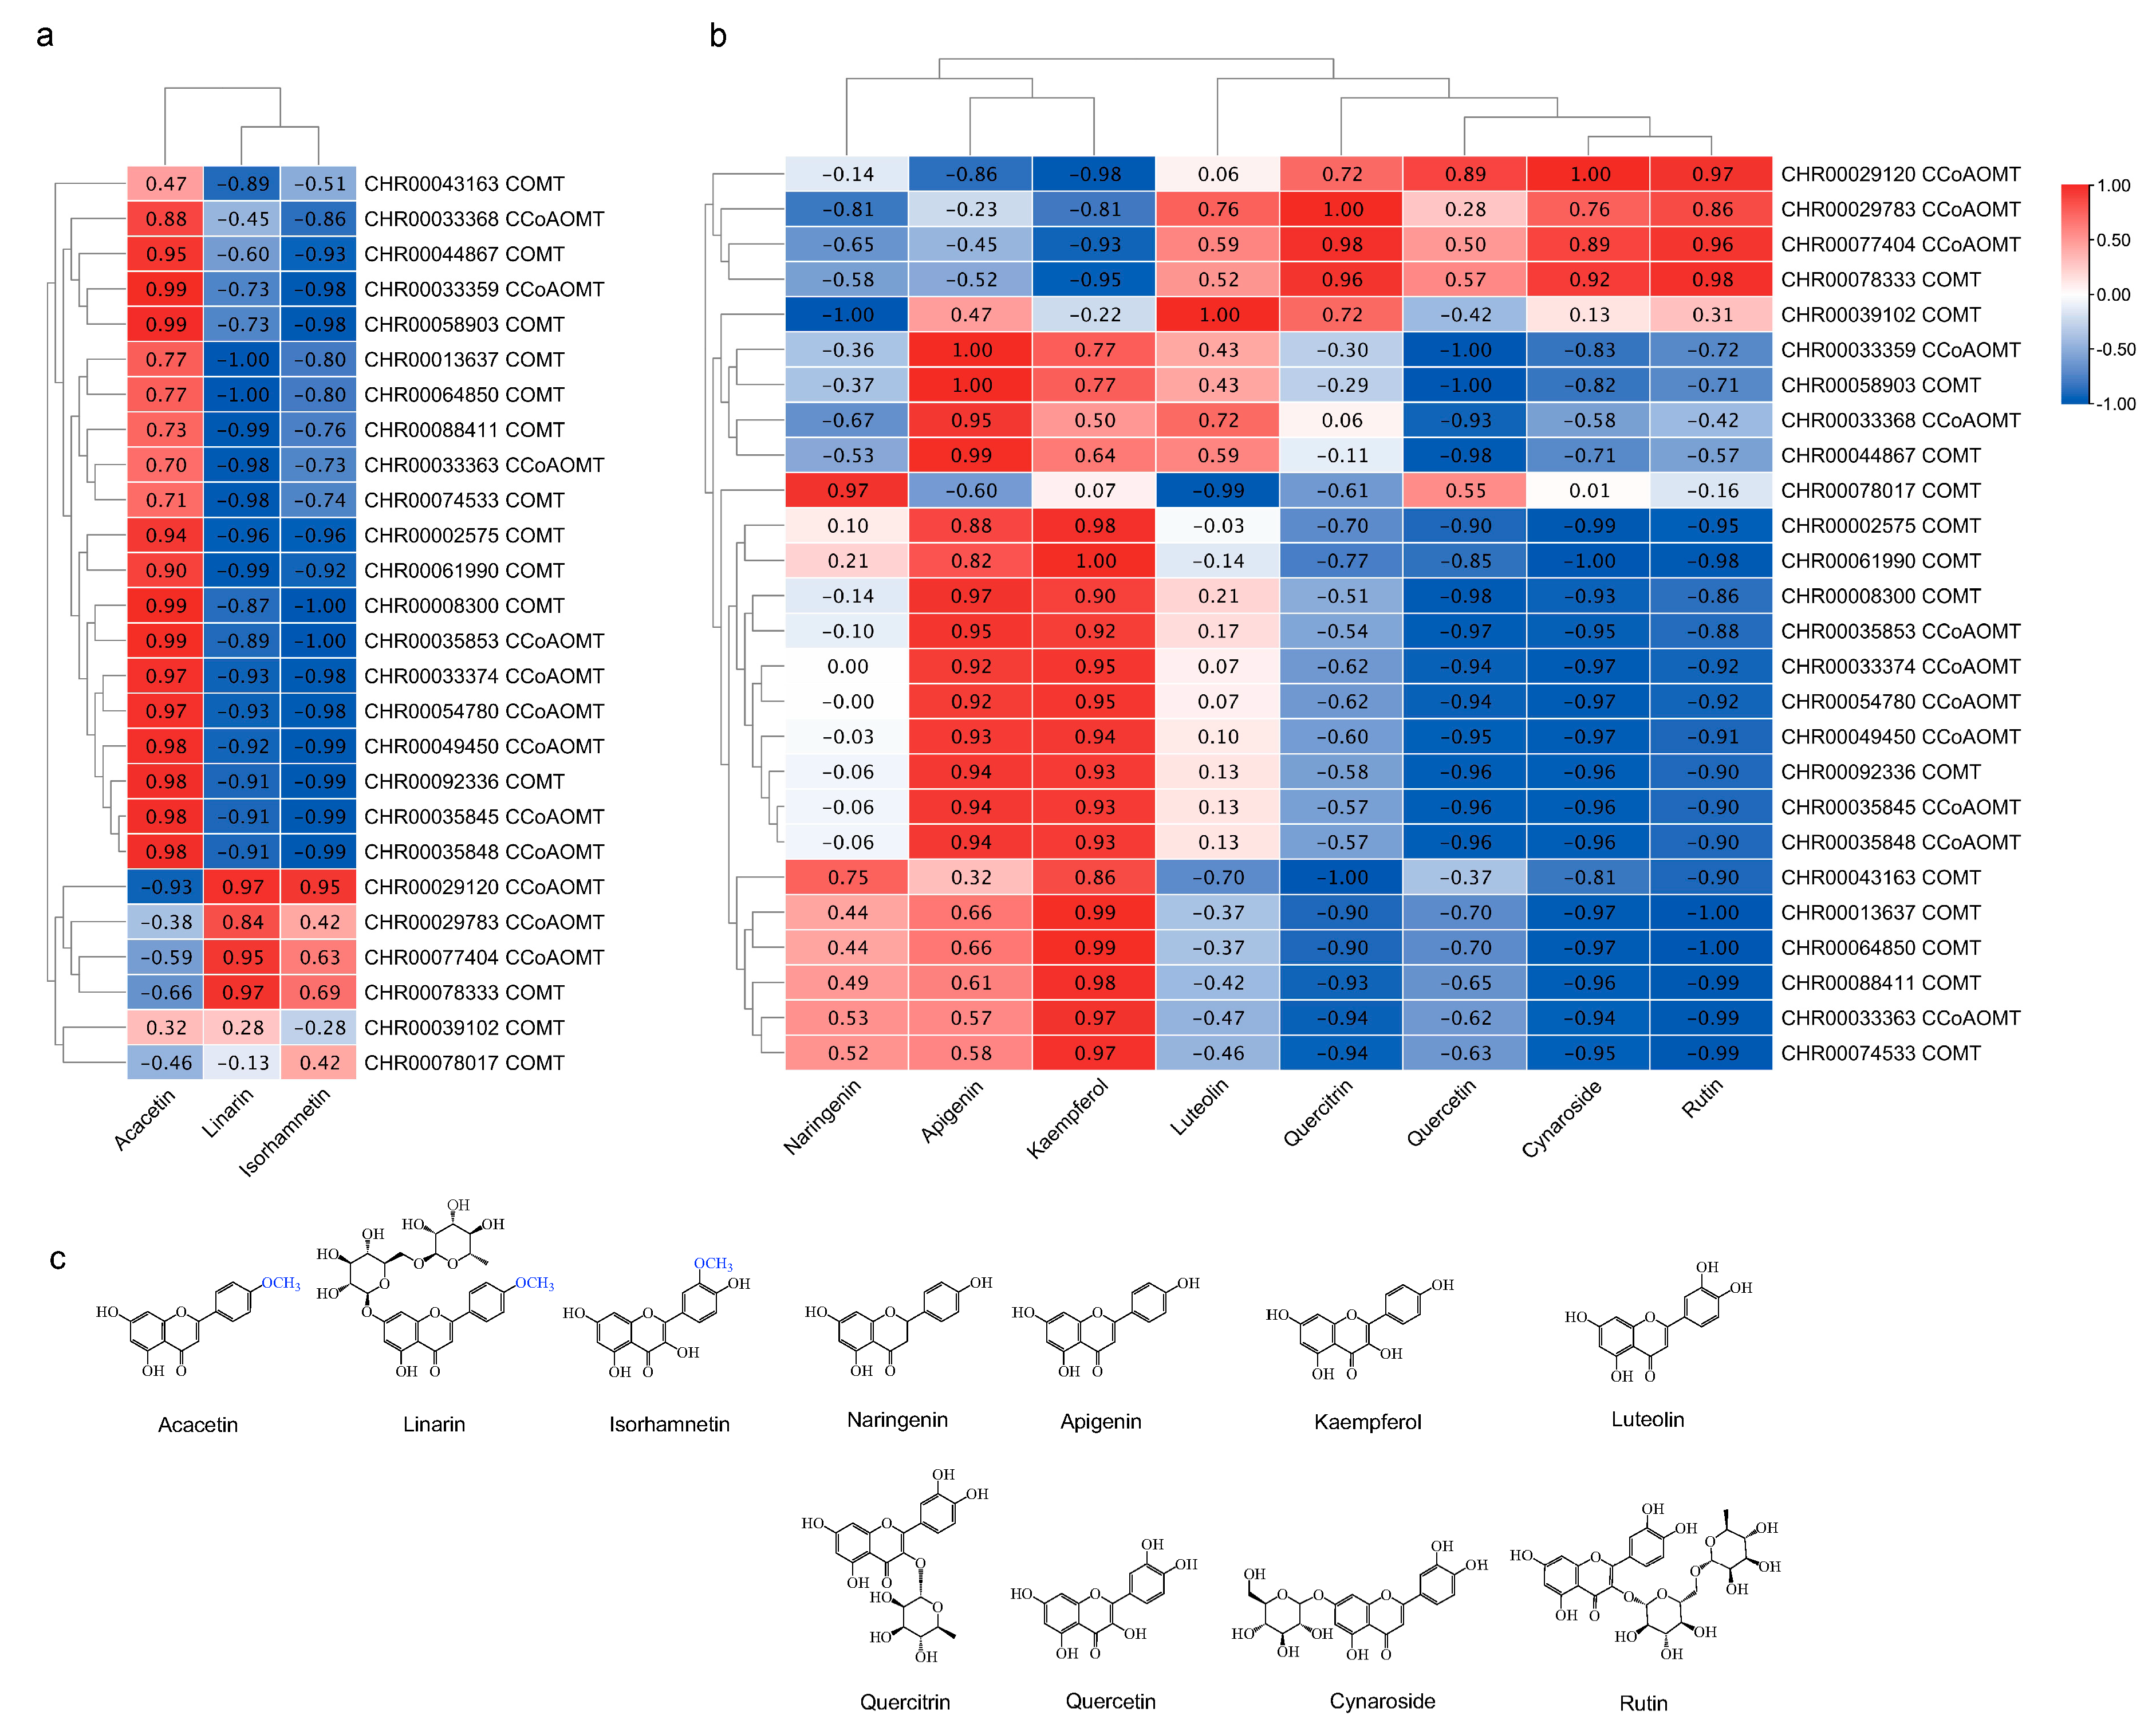
2.6. Identification of OMT Genes Involved in Flavonoids Synthesis during the Development of C. indicum capitulum

To further screen potential OMT genes involved in methylated flavonoid accumulation, we analyzed the Pearson correlation coefficient (r) between methylated flavonoids content and the relative expressions of OMTs, and visualized the data with TBtools; the result is presented in Figure 5a,b. Three methylated flavonoids with anti-inflammatory activity, namely acacetin, linarin, and isorhamnetin, and eight potential methylation substrates, including cynaroside, quercitrin, luteolin, quercetin, apigenin, naringenin, and kaempferol in C. indicum capitulum were tested using UPLC, and rutin was determined by UV spectrophotometry (Figure 5c). The results are presented in Table S5. There were significant differences in its flavonoids content. The highest content was found in the flower1 stage, and the lowest was found in the flower3 stage. Some flavones and flavonols also exhibit similar changes, that is, they were enriched and accumulated in the flower1 stage, while luteolin and quercetin contents were almost similar in each stage. Of the tissues examined, only 26 of 79 OMTs, including 12 CCoAOMTs and 14 COMTs, were expressed at relatively high levels (FPKM >10 in at least one sample). An expression-concentration correlation coefficient of more than 0.7 indicated that the gene may be involved in methylated flavonoid synthesis in the capitulum. According to the results, CHR00029120, CHR00029783, CHR00077404, and CHR00078333 expression levels were highly correlated with linarin, isorhamnetin, and some potential methylation substrates, such as quercitrin, quercetin, rutin, and cynaroside, which were highly accumulated at the flower1 stage. The expression level of CHR00078017 correlated strongly with the accumulation of naringenin, which was highly accumulated at the flower2 stage. The highly expressed OMT genes CHR00043163, CHR00013637, CHR00064850, CHR00088411, and CHR00074533 correlated strongly with the accumulation of kaempferol and apigenin. Moreover, CHR00033359, like the rest of the OMTs, correlated strongly with the accumulation of kaempferol, apigenin, and acacetin, which were highly accumulated at the flower3 stage. CHR00039102 showed a high correlation with luteolin (Figure 5b), and there was no significant difference in the accumulation of luteolin at different capitulum development stages. These data implied that CHR00029120, CH00029783, CHR00077404, and CHR00078333 may play a key role in the synthesis of most flavonoids in C. indicum capitulum, especially methylated flavonoids.

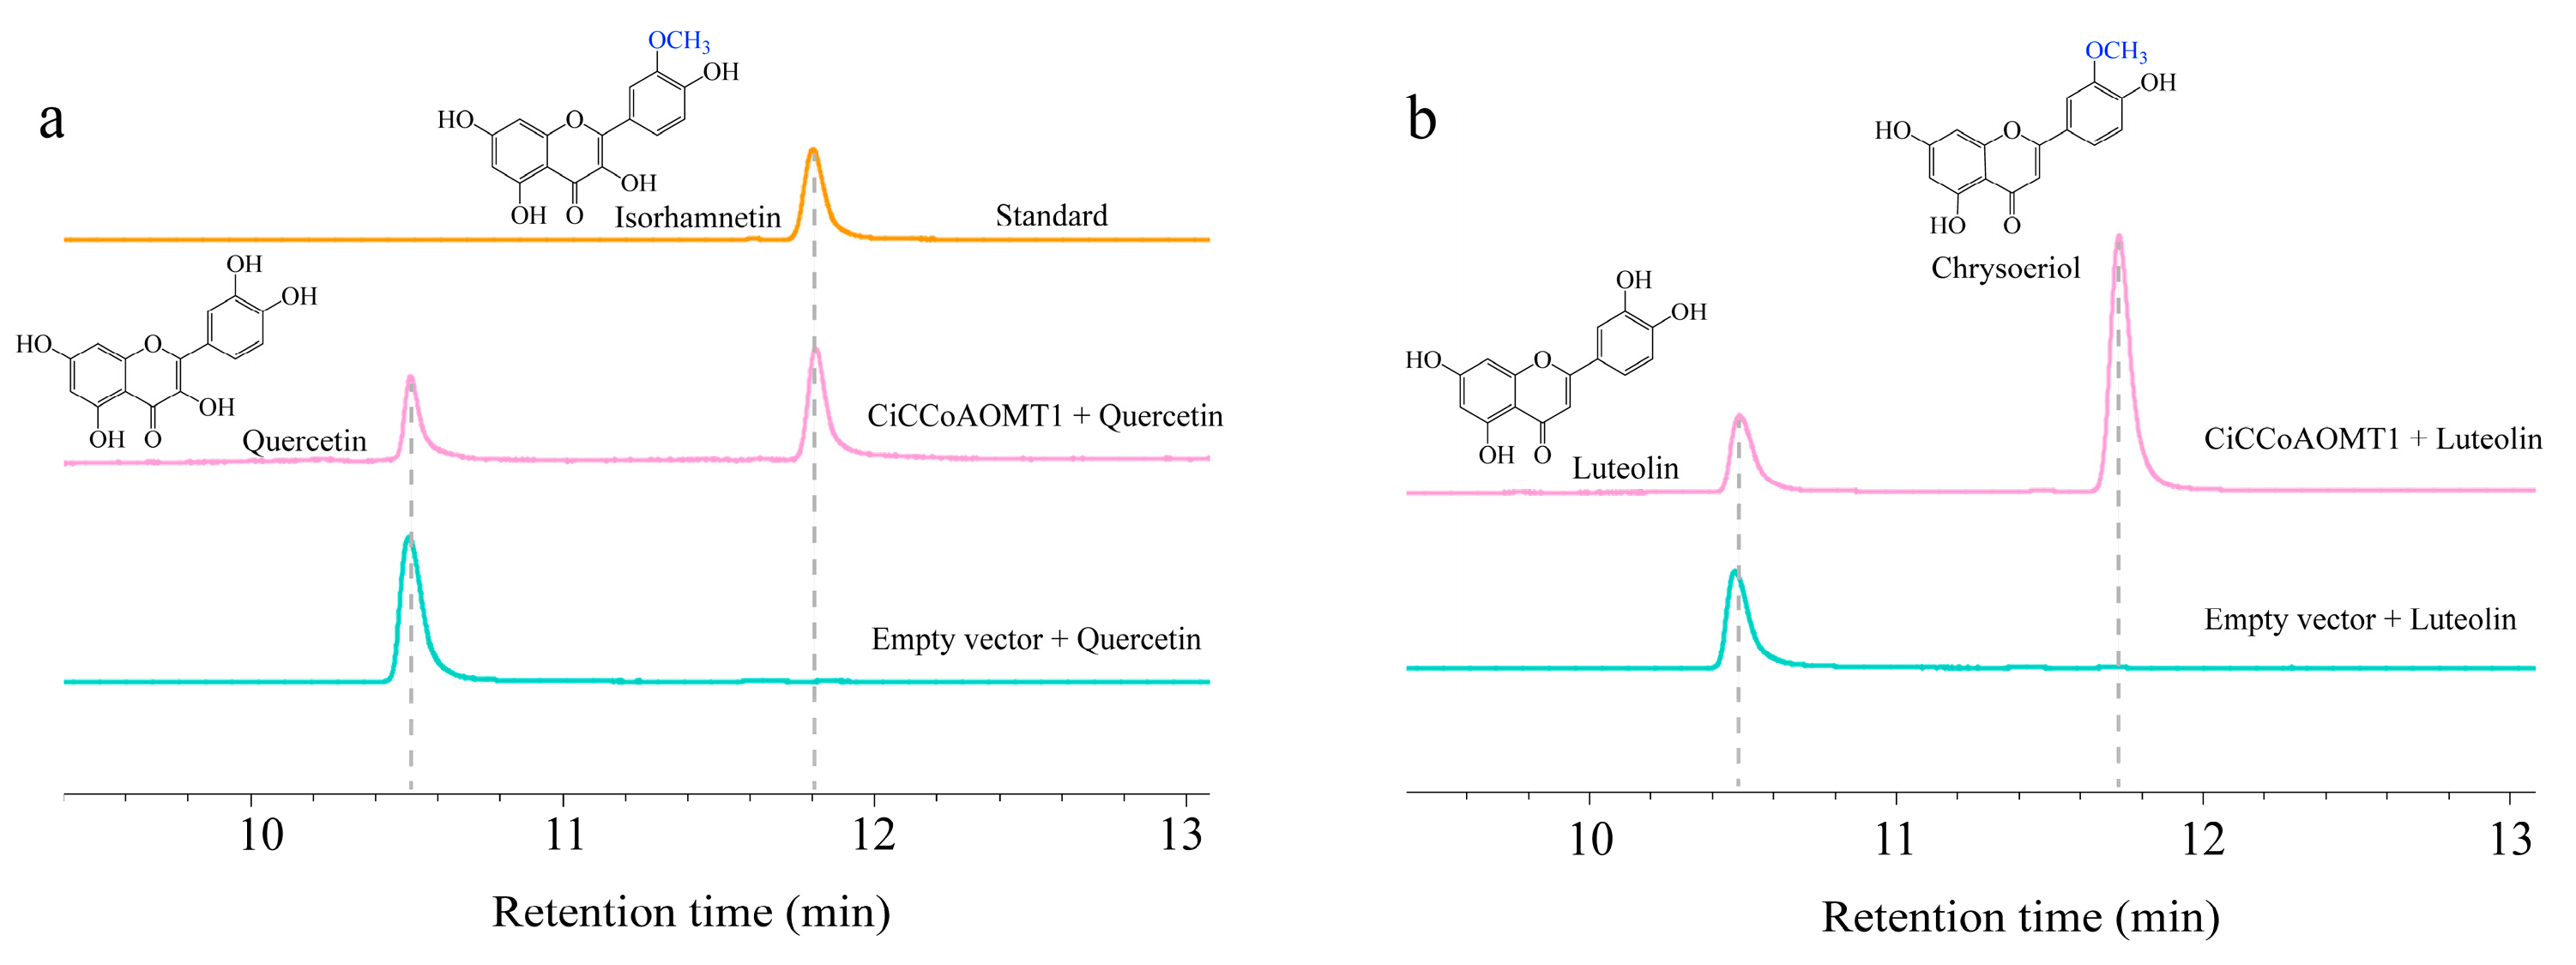
2.7. Heterogeneous Expression of CiCCoAOMT1 in E. coli and In Vitro Enzymatic Activity Assays

The open reading frame (ORF) of CiCCoAOMT1 gene is 744 bp encoding 247 amino acids, and the molecular weight (MW) of predicted protein is 27.8 kDa. The CiCCoAOMT1 protein with a hexahistidine (His)-tag, an S-tag, and a Trx-tag at the N-terminus was highly expressed in E. coli BL21 (DE3). The purified proteins were analyzed by SDS-PAGE and formed a band of about 47 kDa on the gel, which was consistent with the theoretical MW of 50.3 kDa (Figure S3). CiCCoAOMT1 activity was characterized in vitro with a wide range of potential substrates (Figure 5c) in the presence of SAM. As shown in Figure 6, CiCCoAOMT1 efficiently converted quercetin into a single methylated product, isorhamnetin (Figure 6a), and luteolin was presumed to be converted to chrysoeriol (Figure 6b) [15,16]. No methylation product was observed when several other phenolic compounds were used as substrates. The results suggested that the CiCCoAOMT1 could be involved in flavonoid biosynthesis.

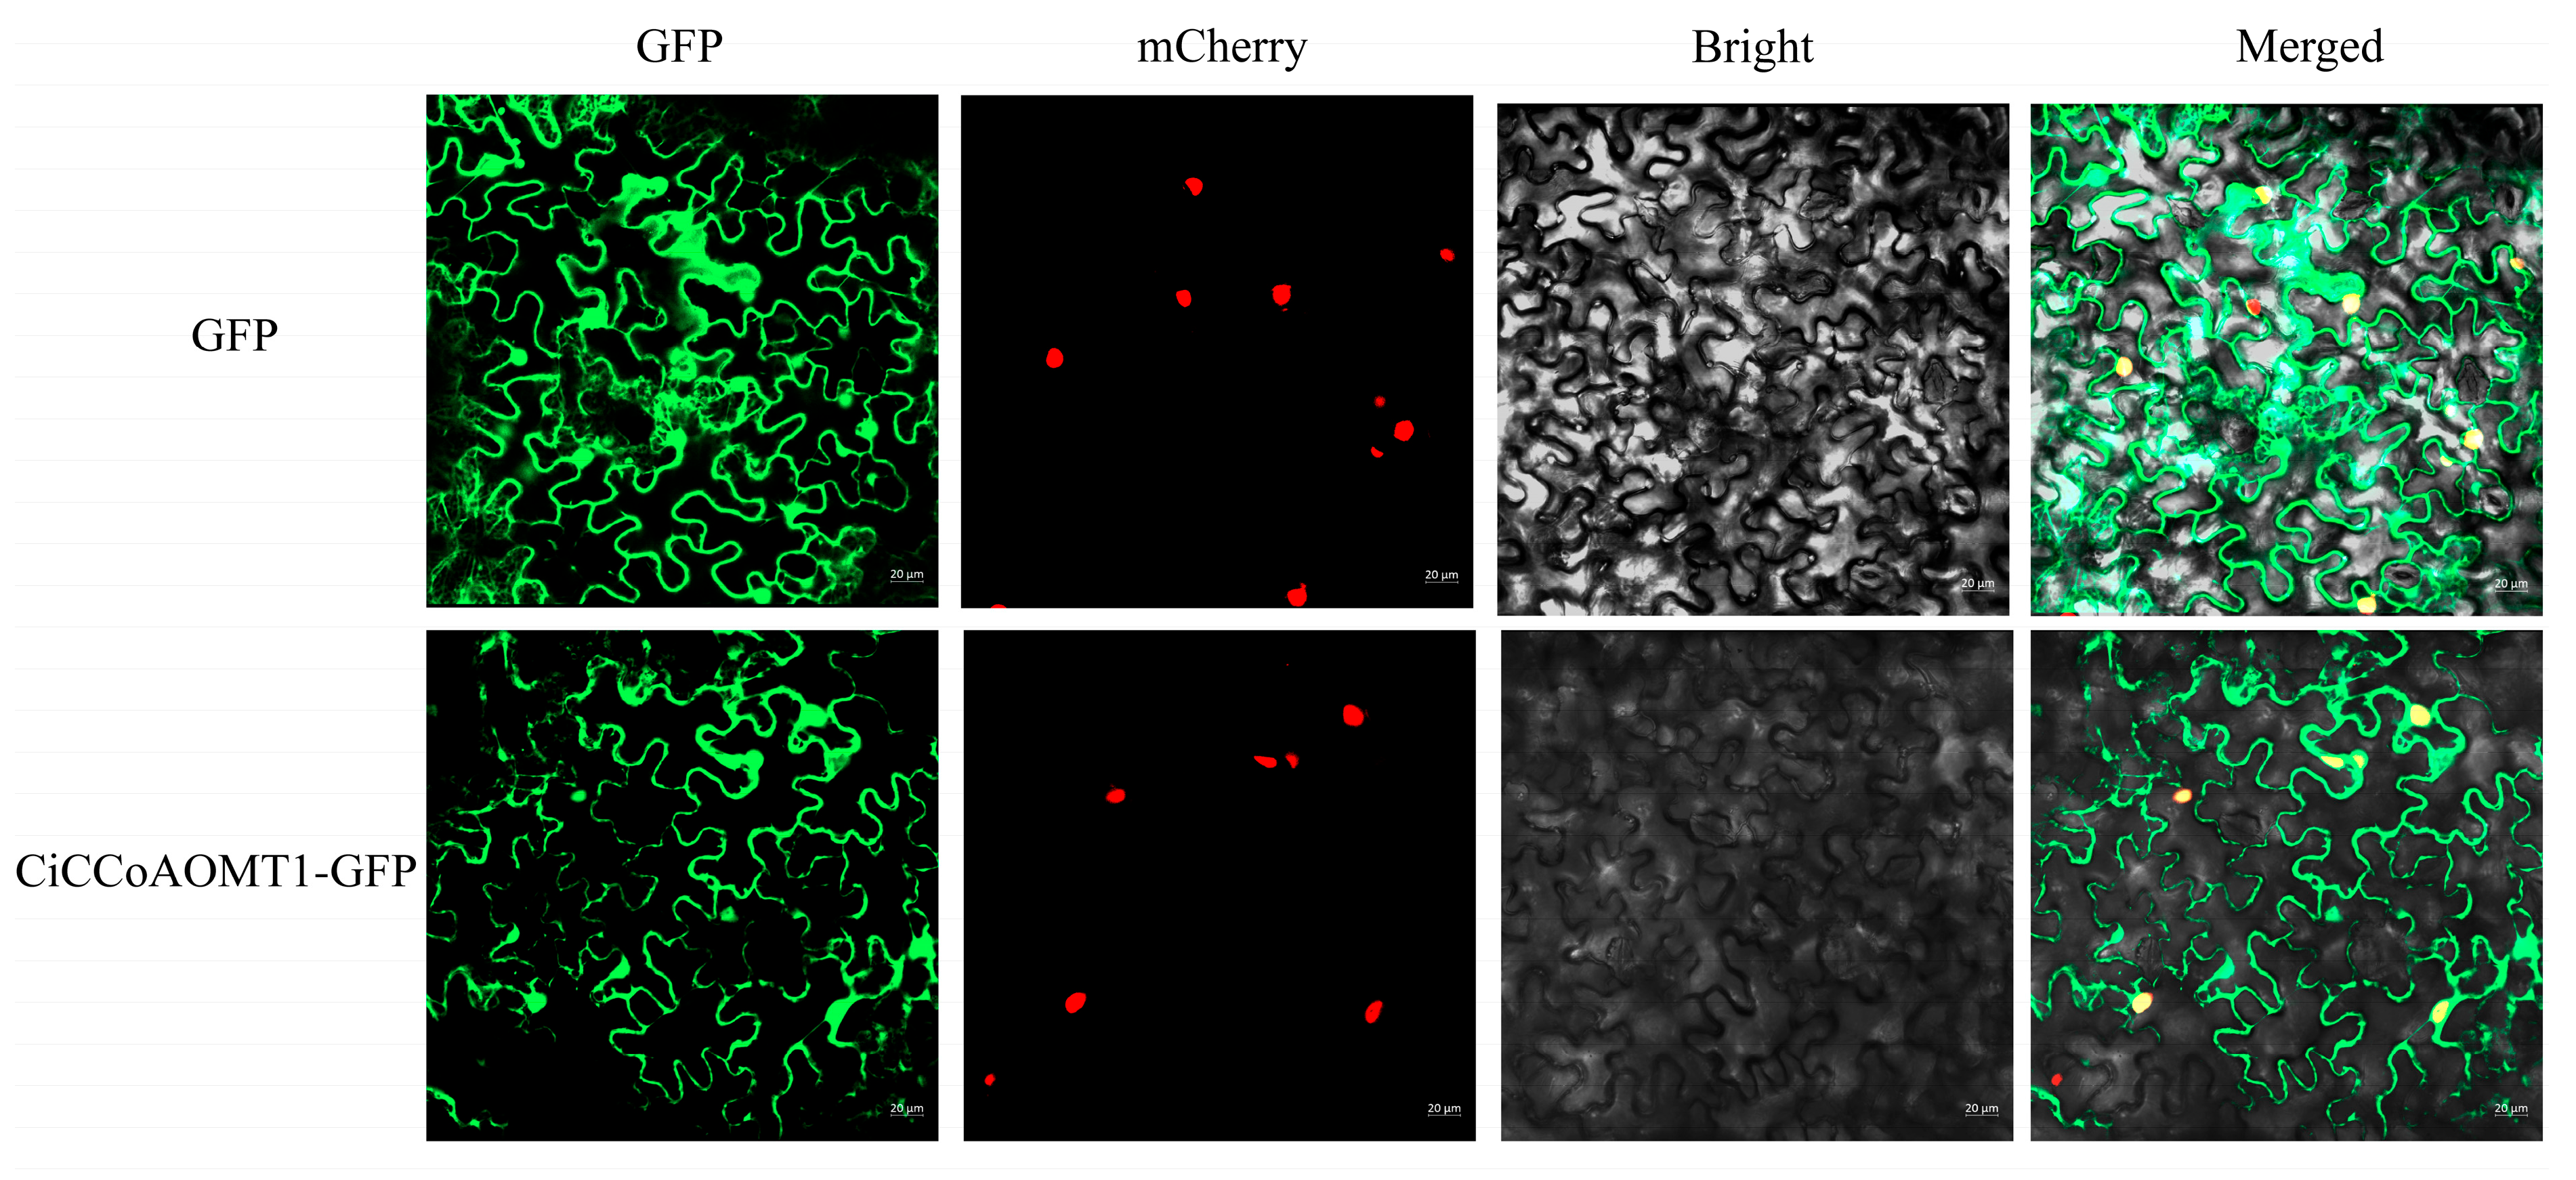
2.8. Subcellular Localization Analysis of CiCCoAOMT1 Protein

To examine the localization of CiCCoAOMT1 in plant cells, recombinant CiCCoAOMT1 with the GFP tag was overexpressed in N. benthamiana. As can be seen from Figure 7, the fluorescence signal distribution pattern of CiCCoAOMT1-GFP fusion protein was similar to that of the empty vector, mainly located in the membrane and nucleus, indicating that CiCCoAOMT1 is a membrane and nuclear localization protein.

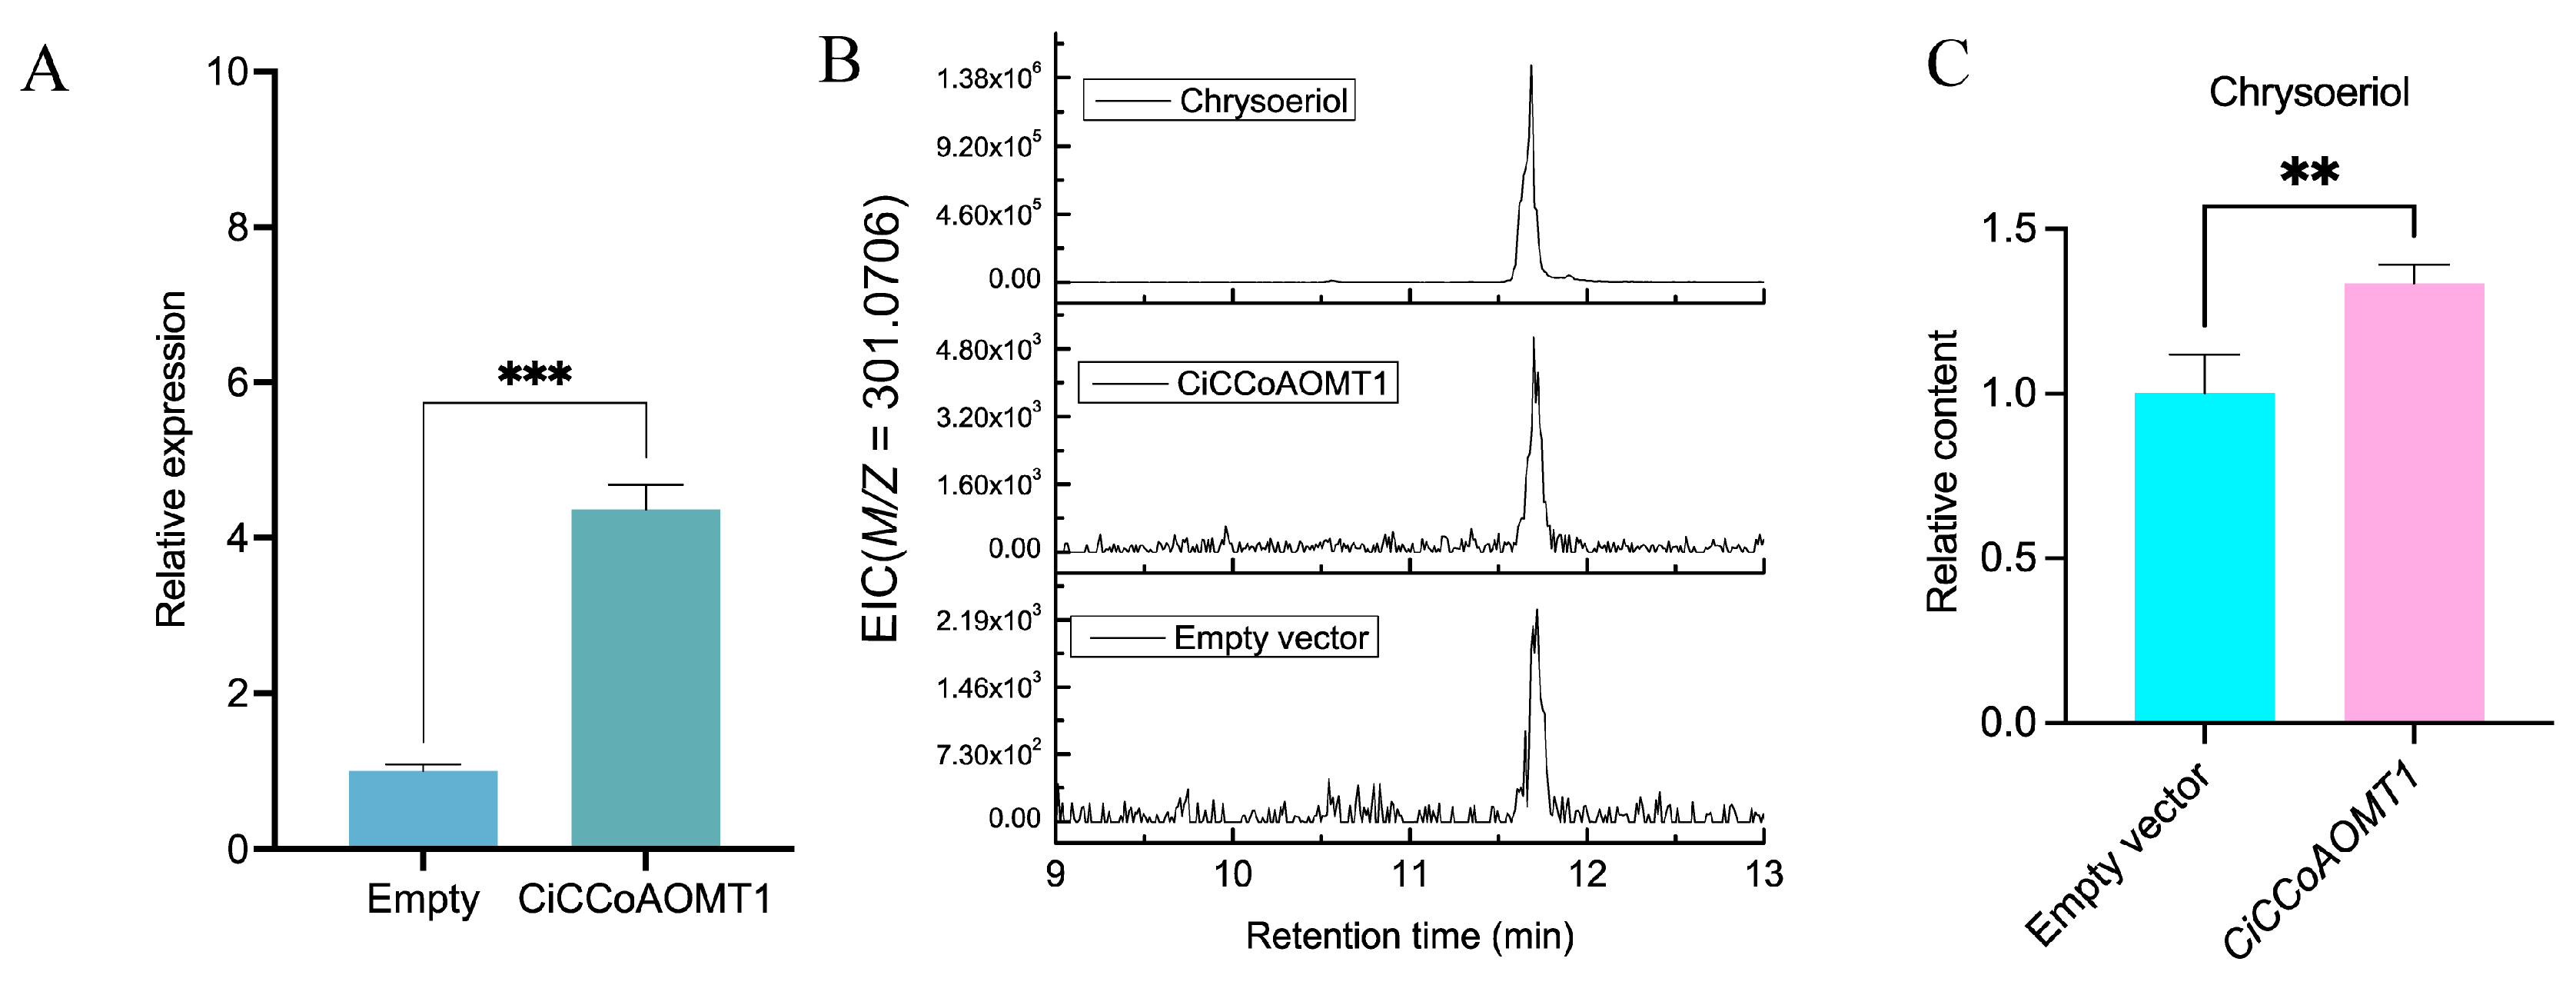
2.9. Overexpression of CiCCoAOMT1 in C. indicum

In order to further study the catalytic activity of CiCCoAOMT1, the leaves of C. indicum tissue culture seedlings were infected with Agrobacterium suspension containing CiCCoAOMT1-pCAMBIA1300-cGFP and empty vector (pCAMBIA1300-cGFP), respectively. Transgenic calli were obtained through genetic transformation processes such as co-culture, decarboxylation, and selective culture. The potential role of CiCCoAOMT1 in flavonoid methylation in vivo was revealed by qRT-PCR and LC-MS metabolite analysis. The results showed that the transcription level of CiCCoAOMT1 was significantly upregulated by 4.4 times compared with the control group (Figure 8A). As expected, the expression of CiCCoAOMT1 in C. indicum resulted in a significant accumulation of methoxyflavone. Compared with the control group injected with empty vector, the content of chrysoeriol significantly increased by 1.33-fold (Figure 8C). Taken together, CiCCoAOMT1 is a potential candidate for chrysoeriol production through 3ʹ-O-methylation of piceatannol in the B-ring. However, further CiCCoAOMT1 overexpression transgenic lines in vivo were still needed to investigate its role in the biosynthesis of methylated flavonoids in planta.

3. Discussion

OMTs play a significant role in plant secondary metabolism, such as methylating the oxygen atom of flavonoids [34]. The characteristics and functions of some OMT genes have been studied in plants such as Arabidopsis [35,36], soybean [37,38], and wheat [39]. C. indicum is a natural resource rich in flavonoids, which are intimately associated with the medicinal and nutritional value of the capitulum [40]. Taking into account the significance of flavonoids in C. indicum and the lack of information regarding their methylations, this project utilized the Chrysanthemum genome and RNA-seq data to characterize OMT genes related to flavonoid biosynthesis.

3.1. Interspecific Divergence at the Scale of OMTs

There are large differences in the number of OMT members in various species. In this paper, a total of 79 putative OMT members were identified in Chrysanthemum, significantly greater than those in Citrus sinensis (58) [20], V. vinifera (47), A. thaliana (24), and P. trichocarpa (26) [41] according to incomplete statistics, suggesting Chrysanthemum OMTs have undergone expansion. The expansion of the OMT gene family may diversify the mechanisms required for plant adaptation to the environment. Previous studies have shown that COMTs likely assisted in plant terrestrialization and their adaption to terrestrial ecosystems [42]. Whole-genome duplication (WGD) is regarded as the primary driving force for gene family expansion and evolution, validated in model plants Arabidopsis and Populus [43,44,45]. Additionally, the kiwifruit COMTs have undergone two WGD events [46]. Similarly, the PgAOMT family has evolved and expanded primarily through WGD and tandem duplication, resulting in new or non-functionalized PgAOMTs [47]. Research shows that the most recent WGD event occurred in the Chrysanthemum genome approximately 38.8 million years ago [33].

3.2. Phylogenetic Relationship and Classification of OMTs

Phylogenetic analysis of plant OMT protein sequences from different species showed that they were distributed in two major lineages based on functional traits reflecting their substrate specificity, one including CCoAOMT proteins using cateyl-CoA derivatives as substrates, and the other including COMT protein sequences using simple phenols, flavonoids, and alkaloids as substrates [48]. The phylogenetic distribution in this study showed that 135 OMT proteins from Chrysanthemum and other plants were clustered into two groups (Figure 1). Consistent with the characteristic features of the OMT gene family, the COMT subfamily contained more members than the CCoAOMT subfamily, which may explain their multiple functions and participation in a diverse set of physiological functions in plant development. In addition, the distribution characteristics of OMT-binding motifs support this classification with COMT proteins having more motif types (Figure 2d). The results of phylogenetic tree analysis and protein structure analysis of Chrysanthemum OMT genes showed that genes with similar gene structures and protein structures were more closely related in the phylogenetic tree (Figure 2a), which may be closely related to the tandem duplication and chromosome segment duplication during the expansion of Chrysanthemum OMT gene family association [20]. However, some closely related OMT members have large differences in their gene expression patterns. The expression of 11 Chrysanthemum OMT genes was not detected in all the tested tissues, and this phenomenon also existed in some citrus OMT genes [20]. It is speculated that these genes may be loss-of-function or only expressed under certain conditions or at certain developmental stages.

3.3. Tissue-Specificity in OMTs and Flavonoids Accumulation

Differences in the expression patterns of OMT gene family members are generally considered to be related to their specific biological functions. FOMTs identified in sweet basil [23] and tomato [49] typically exhibit tissue-specific, primarily expressed in leaf glandular hairs enriched with methylated flavonoids. While the major role of the CCoAOMT family was originally attributed to lignin biosynthesis, some plant CCoAOMT genes such as VvCCoAOMT4 [24], PaF6OMT [50], ObCCoAOMT [51], and McOMT [14] encode proteins that exhibit a substrate preference for flavonoids. Proteins that are more closely clustered are more likely to have similar functions. Considering the possibility of homology between CHR00029120 (CCoAOMT) and ObCCoAOMT (Figure 1), it is speculated that the two perform similar or related functions. Furthermore, CHR00029120 expression level was indeed highly associated with methoxylated flavonoid linarin and isorhamnetin (Figure 5a). According to the expression heatmap (Figure 3b), CHR00029120 and CHR00029783 were consistently downregulated during capitulum development, as confirmed by qRT-PCR (Figure 4), suggesting that they primarily function at the flower bud stage. It is intriguing that the CHR00029120 transcripts were barely detectable in leaves and were most abundant in the capitulum, demonstrating that some specific O-methylated flavonoids or other secondary metabolites might be formed in the capitulum [20]. However, the specific function still needs further experimental analysis to confirm. In contrast, both CHR00077404 and CHR00077883 showed higher expression levels in leaves. Additionally, only nine OMT genes (three CCoAOMTs, six COMTs) exhibited abundant expression (FPKM > 50) in at least one tissue or developmental stage (Figure 3b). Except for CHR00029783 (CCoAOMT) and CHR00077404 (CCoAOMT), most other genes were only highly correlated with the methoxylated flavonoid acacetin in the correlation analysis (Figure 5a). The differential expression of these OMT genes is particularly important for for us to understand the mechanisms of flavonoids metabolism during capitulum development.

3.4. CiCCoAOMT1 Is Involved in the Methylation of Flavonoids

In the present study, we identified a member of the true CCoAOMT subgroup from C. indicum (CHR00029783) and named it CiCCoAOMT1. CiCCoAOMT1 recombinase showed high affinity and catalytic efficiency for flavonoid substrates in vitro, converting 3′-OH of flavonoids with vicinal hydroxyl groups to the corresponding monomethyl ethers and validated in vivo. Similarly, this catalytic activity has been verified in vivo in several OMTs such as IiOMT1, IiOMT2 and CsCCoAOMT1 from Isatis indigotica [16] and C. sinensis [15], respectively. Combined with the result of protein subcellular localization in N. benthamiana leaf epidermal cells, CiCCoAOMT1 might be involved in the methylation of flavonoids in the cytoplasm of the plant cell. A similar localization pattern was also observed in the true CCoAOMT subgroup, such as VvCCoAOMT4 from V. vinifera [24], and CsCCoAOMT1 from C. sinensis [15].

4. Materials and Methods

4.1. Plant Materials

The capitulum and leaves of C. indicum were used in this study, which were obtained from the C. indicum germplasm resource nursery of Nanjing Agricultural University. There were flower1 (at flower bud stage), flower2 (at the early flowering stage), flower3 (at the full opening stage), leaf (leaves), harvested in November 2021. After freezing in liquid nitrogen, the materials were stored at −80 °C for RNA isolation and flavonoid analysis.

4.2. Acquisition and Analysis of Transcriptome Sequencing

Total RNA was extracted using Plant RNA Purification Reagent (TaKaRa, Beijing, China), and RNA quality was assessed on a Nano 300 micro-spectrophotometer (Allsheng, Hangzhou, China) and 1% agarose gel. Raw reads were obtained by sequencing on the DNBSEQ platform by BGI Shenzhen Co., Ltd., and processed using SOAPnuke (v1.4.0) (https://github.com/BGI-flexlab/SOAPnuke accessed on 20 February 2022) to obtain high-quality clean reads, which were then compared to the Chrysanthemum genome (http://210.22.121.250:8880/asteraceae/homePage accessed on 20 February 2022) using HISAT (v2.1.0) (http://www.ccb.jhu.edu/software/hisat accessed on 20 February 2022). Subsequently, novel transcripts were reconstructed and integrated using StringTie (v1.0.4) (http://ccb.jhu.edu/software/stringtie accessed on 20 February 2022) and Cuffmerge (v2.2.1) (http://cole-trapnell-lab.github.io/cufflinks accessed on 20 February 2022). Protein coding potential prediction was performed using CPC (v0.9-r2) (http://cpc.cbi.pku.edu.cn accessed on 20 February 2022). Finally, the novel transcripts with protein coding potential were added to the reference gene sequence, forming a complete reference sequence. Gene expression levels were calculated using RSEM (v1.2.8) (http://deweylab.biostat.wisc.edu/rsem/rsem-calculate-expression.html accessed on 20 February 2022) based on FPKM (fragments per kilobase of exon model per million mapped fragments).

4.3. Data Sources and Gene Identification of OMTs

Whole-genome proteins sequence files of C. indicum were downloaded from the Chrysanthemum Genomic Database (http://210.22.121.250:8880/asteraceae/homePage accessed on 7 June 2022). Conserved methyltransferase domains were downloaded from Pfam (http://pfam.xfam.org accessed on 7 June 2022) by retrieving PF01596 (CCoAOMT) and PF00891 (COMT) and used as Hidden Markov Model (HMM) queries to search potential C. indicum OMT proteins with an e-value cutoff of 10−6 [52]. The integrity of the sequence feature domains was verified by NCBI Batch CD-search (https://www.ncbi.nlm.nih.gov/Structure/bwrpsb/bwrpsb.cgi accessed on 17 June 2022) and the SMART (http://smart.embl-heidelberg.de accessed on 17 June 2022) online database, and sequences without the target domains were removed. The physical and chemical properties of all C. indicum OMT gene families were available online on ExPASY (https://web.expasy.org/protparam/ accessed on 17 June 2022) [53], including molecular weight (MW), isoelectric point (PI), instability index, and the grand average of hydropathicity (GRAVY) values. The prediction of subcellular localization of the identified OMT proteins was performed with WoLF PSORT [54].

4.4. Sequence Alignment and Phylogenetic Analysis

The phylogenetic relationships of the identified 79 Chrysanthemum OMTs with 56 OMTs from other species such as mouse-ear cress, safflower, rice, and sweet basil was explored. These identified OMT protein sequences were utilized to perform multiple sequence alignment analysis with MAFFT version 7 (https://mafft.cbrc.jp/alignment/server/index.html accessed on 17 June 2022). The unrooted phylogenetic tree was constructed using the neighbor-joining (NJ) algorithm based on 1000 bootstrap replicates, visualized and annotated at iTOL (https://itol.embl.de/ accessed on 20 June 2022). The OMT protein sequences of other species were downloaded from the Unified Protein Database (https://www.uniprot.org accessed on 20 June 2022), and the UniProt entries (Accessed on 20 June 2022) for these OMTs are given in Table S2.

4.5. Exon–Intron Structure and Conserved Motif Analysis

The C. indicum OMTs phylogenetic tree was constructed according to the method in 4.4. The GFF3 format file containing DNA and CDS position information was downloaded from the Chrysanthemum genome database (https://cbcb.cdutcm.edu.cn/AGD/genome/details/?id=0005 accessed on 7 June 2022) to analyze the exon-intron structure. To further identify and analyze the protein conserved motifs of the C. indicum OMT family members, the Multiple EM for Motif Elicitation (MEME) (https://meme-suite.org/meme/tools/meme accessed on 20 June 2022) [55] was employed with the parameters that the maximum motif number was 14, and other parameters are default settings. Finally, TBtools (v 1.09876) was used to interactively visualize the above analysis results.

4.6. Expression Analyses of C. indicum OMT Gene Family Members

The abundances of transcripts were assessed by fragments per kilobase of transcript per million (FPKM) value mapped reads to quantify gene expression. FPKM values were visualized as heat maps using TBtools (version 1.098). FPKM values for OMT genes are provided in Table S3.

4.7. Total RNA Extraction and qRT-PCR Analysis

The total RNA extraction process and extraction stage are consistent with those in Section 2.2. Primer 5.0 was used to design primers (Table S4), and cDNA was synthesized from RNA using the TSINGKE TSK301S Goldenstar™ RT6 cDNA Synthesis Kit (Tsingke Biotechnology Co., Ltd., Beijing, China). GAPDH (registration number KC508619) and EF1α (registration number KF305681) were selected as the internal reference gene [56,57]. qRT-PCR analysis was conducted on a StepOnePlus™ Real-Time PCR System (Thermo Fisher Scientific, MA, USA) according to the instructions of the PrimeScript™ RT reagent Kit with gDNA Eraser (Takara Biomedical Technology (Beijing) Co., Ltd., Beijing, China). The correlative expression data were calculated according to the 2−(∆∆CT) method with three biological repeats of each sample.

4.8. Correlation Analysis

Ultra-performance liquid chromatography (UPLC) was used for the content determination of 11 flavonoids. The samples were dried at 60 °C and ground into powder. Powder samples (0.5 g) were immersed in methanol (50 mL) for 30 min and then processed by ultrasonic extraction for 30 min. The extract was filtered by a 0.22 µm microporous nylon filter. Then, 2 µL of the filtrate was run on a Acquity UPLC (Waters Corporation, Milford, MA, USA) system with an ACQUITY UPLC HSS T3 column (2.1 × 100 mm, 1.8 µm, Waters Corporation, Milford, MA, USA). Acetonitrile (solvent A) and 0.1% phosphate solution (solvent B) comprised the mobile phase, and the gradient elution procedure was set up as follows: 0 min, 0% A/100% B; 3 min, 0% A/100% B; 5 min, 25% A/75% B, 8 min, 45% A/55% B; 15.5 min, 27% A/73% B; and 18.5 min, 0% A/100% B. The detection wavelength was set at 350 nm, and the flow rate was performed at 0.2 mL/min. The standards were purchased from Shanghai Yuanye Bio-Technology Co., Ltd. (Shanghai, China), including chlorogenic acid (B20782, 327-97-9), isochlorogenic acid A (B21539, 2450-53-5), caffeic acid (B20660, 331-39-5), apigenin (B20981, 520-36-5), luteolin (B20888, 491-70-3), acacetin (B20627, 480-44-4), linarin (B20860, 480-36-4), cynaroside (B20887, 5373-11-5), quercetin (B20527, 117-39-5), quercitrin (B20526, 522-12-3), kaempferol (B21126, 520-18-3), isorhamnetin (B21554, 480-19-3), and naringenin (B21596, 480-41-1). Statistical analysis was conducted using Microsoft Excel (version 2019). We explored the correlation between OMT gene expression and flavonoid concentrations using Pearson correlation coefficient analysis. The results were visualized with TBtools (version 1.098).

4.9. Heterologous Expression, and Purification of Recombinant CiCCoAOMT1 Proteins

The full coding sequence (CDS) of CHR00029783, named CiCCoAOMT1, was amplified using specific primers (Table S4), then inserted into the pET32a vector at the BamHI/XhoI sites. After sequencing confirmation, the CiCCoAOMT1-pET32a construct was transferred into Escherichia coli strain BL21 (DE3) for fusion protein expression. Transformants harboring CiCCoAOMT1-pET32a were cultivated until the OD600 reached 0.6 at 37 °C, and then induced with 0.5 mM isopropyl β-D-thiogalactoside (IPTG) at 16 °C for 24 h. The induced bacterial cells were harvested by centrifugation and then washed with cold 1× PBS buffer, resuspended, and sonicated on ice. Recombinant protein was purified by Ni-NTA gravity column (Sangon Biotech, Shanghai, China), and transferred to storage buffer (50 mM Tris-HCl, pH 8.0) using an Amicon-Ultra-0.5 Ultracel-10k membrane, and stored at −80 °C for further analysis.

4.10. Enzyme Assays and Analysis of C. indicum OMT Reaction Products

The enzymatic reactions (100 μL) included Tris–HCl buffer (50 mM, pH 8.0), 500 μM SAM, 200 μM substrate, and 25 μL of purified protein solution (2.5 mg/mL). The reactions were incubated at 37 °C for 2 h and quenched with the addition of double volume of methanol. The mixtures were filtered through 0.22 μm nylon columns and analyzed by HPLC.

4.11. Subcellular Localization

The coding regions of CiCCoAOMT1 without the stop codon were constructed on the plant expression vector pCAMBIA1300-GFP. The recombinant construct (CiCCoAOMT1-GFP) and the empty vector (pCAMBIA1300-GFP) were transferred into Agrobacterium tumefaciens strains GV3101. The positive clones were cultured in liquid LB medium and then resuspended in MES buffer (10 mM MES, 10 mM MgCl2, 150 μM acetosyringone, pH 5.6) till OD600 reached 0.8. The suspension was infiltrated into Nicotiana benthamiana leaves after 2 h incubation. Images were captured by a Zeiss LSM800 confocal microscope 2 d after.

4.12. Overexpression of CiCCoAOMT1 in C. indicum In Vivo

A. tumefaciens strains EHA105 carrying the plasmid vector with CiCCoAOMT1-GFP genes were grown in LB (lysogeny broth) medium at 28 °C to OD600  =  0.6, and then centrifuged at 6000× g for 10 min and resuspended in an equal volume of MS (Murashige and Skoog) liquid medium as the infection solution. The empty vector pCAMBIA1300-cGFP was used as a control. The leaves of C. indicum tissue-culture seedlings cultured for about 35 days were used for infiltration, and inoculated on pre-culture medium (MS + 6-BA (6-Benzylaminopurine) 0.5 mg/L + NAA (1-Naphthylacetic acid) 1.0 mg/L) for 3 days in the dark. The leaf discs were immersed in the suspension for 10 min, and then placed on the co-cultured medium (MS + 6-BA 0.5 mg/L + NAA 1.0 mg/L + AS (Acetosyringone) 100 μM), and kept in the dark. After 2 days, the leaf discs were switched to be placed on the primary screening medium (MS + 6-BA 0.5 mg/L + NAA 1.0 mg/L + Carb 350 mg/L). When there was no A. tumefaciens outbreak after 7 days, the leaf discs were transferred to the screening medium 1 (MS + 6-BA 0.5 mg/L + NAA 1.0 mg/L + Carb 160 mg/L + Hyg 10 mg/L), and subcultured every 15 days. When no A. tumefaciens was observed, the leaf discs could be placed on the screening medium 2 (MS + 6-BA 0.5 mg/L + NAA 1.0 mg/L + Carb 80 mg/L + Hyg 8 mg/L). It lasted for about one month without A. tumefaciens outbreak. The screened calluses were collected, frozen in liquid nitrogen, and stored at −80 °C to analyze the gene expression and metabolites by qRT-PCR and HPLC-QTOF-MS.

4.13. Statistical Analyses

Statistical analysis was conducted using Microsoft Excel (version 2019). Data were obtained with three replicates. Figures exhibition was performed in GraphPad Prism (version 8).

5. Conclusions

In our study, a total of 79 OMTs were identified throughout the Chrysanthemum genome. The proteins encoded by these genes were distributed in two groups of the phylogenetic tree, which was supported by gene cluster analysis and conserved motifs distribution characteristics. RNA-Seq and qRT-PCR analysis suggested that these OMT genes exhibited tissue expression differences. Moreover, we found that COMTs were highly expressed in the capitulum, especially in full bloom, while CCoAOMTs were highly expressed in leaves. Additionally, we identified a true CCoAOMT enzyme, CiCCoAOMT1, and found that it catalyzes O-methylation of quercetin and luteolin at the 3′-OH position. The systematic exploration of the Chrysanthemum OMT gene family in this work provides clues to understanding the process of flavonoids O-methylation and regulation in C. indicum, as well as new ideas for screening C. indicum germplasm.

Supplementary Materials

The following supporting information can be downloaded at: https://www.mdpi.com/article/10.3390/ijms251810037/s1.

Author Contributions

Conceptualization, M.Z. and T.W.; Writing—original draft preparation, M.Z.; Writing—review and editing, T.W., F.Y. and Y.S.; Visualization, M.Z.; Funding acquisition, Q.G. All authors have read and agreed to the published version of the manuscript.

Funding

This research was funded the National Drug Standard Improvement Research Project of China (Grant No. 2021Z013) and Jiangsu Provincial Modern Agricultural Industry Technology System Construction Project (Grant No. JATS [2022] 461, JATS [2022] 291).

Institutional Review Board Statement

Not applicable.

Informed Consent Statement

Not applicable.

Data Availability Statement

No new data were created or analyzed in this study. Data sharing is not applicable to this article.

Conflicts of Interest

The authors declare no conflicts of interest.

References

  1. Pei, R.; Liu, X.; Bolling, B. Flavonoids and gut health. Curr. Opin. Biotechnol. 2020, 61, 153–159. [Google Scholar] [CrossRef] [PubMed]
  2. Shao, Y.; Sun, Y.; Li, D.; Chen, Y. Chrysanthemum indicum L.: A Comprehensive Review of its Botany, Phytochemistry and Pharmacology. Am. J. Chin. Med. 2020, 48, 871–897. [Google Scholar] [CrossRef] [PubMed]
  3. Wang, T.Y.; Li, Q.; Bi, K.S. Bioactive flavonoids in medicinal plants: Structure, activity and biological fate. Asian J. Pharm. Sci. 2018, 13, 12–23. [Google Scholar] [CrossRef] [PubMed]
  4. Kim, S.Y.; Jin, C.Y.; Kim, C.H.; Yoo, Y.H.; Choi, S.H.; Kim, G.Y.; Yoon, H.M.; Park, H.T.; Choi, Y.H. Isorhamnetin alleviates lipopolysaccharide-induced inflammatory responses in BV2 microglia by inactivating NF-kappaB, blocking the TLR4 pathway and reducing ROS generation. Int. J. Mol. Med. 2019, 43, 682–692. [Google Scholar] [CrossRef] [PubMed]
  5. Rasquel-Oliveira, F.S.; Manchope, M.F.; Staurengo-Ferrari, L.; Ferraz, C.R.; Saraiva-Santos, T.; Zaninelli, T.H.; Fattori, V.; Artero, N.A.; Badaro-Garcia, S.; de Freitas, A.; et al. Hesperidin methyl chalcone interacts with NFkappaB Ser276 and inhibits zymosan-induced joint pain and inflammation, and RAW 264.7 macrophage activation. Inflammopharmacology 2020, 28, 979–992. [Google Scholar] [CrossRef] [PubMed]
  6. Bernini, R.; Crisante, F.; Ginnasi, M.C. A convenient and safe O-methylation of flavonoids with dimethyl carbonate (DMC). Molecules 2011, 16, 1418–1425. [Google Scholar] [CrossRef]
  7. Wen, X.; Walle, T. Methylated flavonoids have greatly improved intestinal absorption and metabolic stability. Drug Metab. Dispos. 2006, 34, 1786–1792. [Google Scholar] [CrossRef]
  8. Joshi, C.P.; Chiang, V.L. Conserved sequence motifs in plant S-adenosyl-L-methionine-dependent methyltransferases. Plant Mol. Biol. 1998, 37, 663–674. [Google Scholar] [CrossRef]
  9. Zubieta, C.; Kota, P.; Ferrer, J.-L.; Chen, J.; Dixon, R.A.; Noel, J.P. Structural basis for the modulation of lignin monomer methylation by caffeic acid/5-hydroxyferulic acid 3/5-O-methyltransferase. Plant Cell 2002, 14, 1265–1277. [Google Scholar] [CrossRef]
  10. Ibrahim, R.K.; Bruneau, A.; Bantignies, B. Plant O-methyltransferases: Molecular analysis, common signature and classification. Plant Mol. Biol. 1998, 36, 1–10. [Google Scholar] [CrossRef]
  11. Berim, A.; Gang, D.R. Methoxylated flavones: Occurrence, importance, biosynthesis. Phytochem. Rev. 2016, 15, 363–390. [Google Scholar] [CrossRef]
  12. Guo, D.; Chen, F.; Inoue, K.; Blount, J.W.; Dixon, R.A. Downregulation of caffeic acid 3-O methyltransferase and caffeoyl CoA 3-O-methyltransferase in transgenic alfalfa: Impacts on lignin structure and implications for the biosynthesis of G and S lignin. Plant Cell 2001, 13, 73–88. [Google Scholar] [CrossRef] [PubMed]
  13. Ye, Z.H.; Kneusel, R.E.; Matern, U.; Varner, J.E. An alternative methylation pathway in lignin biosynthesis in Zinnia. Plant Cell 1994, 6, 1427–1439. [Google Scholar] [CrossRef] [PubMed]
  14. Ibdah, M.; Zhang, X.H.; Schmidt, J.; Vogt, T. A novel Mg(2+)-dependent O-methyltransferase in the phenylpropanoid metabolism of Mesembryanthemum crystallinum. J. Biol. Chem. 2003, 278, 43961–43972. [Google Scholar] [CrossRef]
  15. Liao, Z.; Liu, X.; Zheng, J.; Zhao, C.; Wang, D.; Xu, Y.; Sun, C. A multifunctional true caffeoyl coenzyme A O-methyltransferase enzyme participates in the biosynthesis of polymethoxylated flavones in citrus. Plant Physiol. 2023, 192, 2049–2066. [Google Scholar] [CrossRef] [PubMed]
  16. Tan, Y.; Yang, J.; Jiang, Y.; Sun, S.; Wei, X.; Wang, R.; Bu, J.; Li, D.; Kang, L.; Chen, T.; et al. Identification and characterization of two Isatis indigotica O-methyltransferases methylating C-glycosylflavonoids. Hortic. Res. 2022, 9, uhac140. [Google Scholar] [CrossRef]
  17. Xu, R.X.; Ni, R.; Gao, S.; Fu, J.; Xiong, R.L.; Zhu, T.T.; Lou, H.X.; Cheng, A.X. Molecular cloning and characterization of two distinct caffeoyl CoA O-methyltransferases (CCoAOMTs) from the liverwort Marchantia paleacea. Plant Sci. 2022, 314, 111102. [Google Scholar] [CrossRef]
  18. Sung, S.H.; Kim, B.-G.; Chong, Y.; Ahn, J.-H. Characterization of Phenylpropanoid O-Methyltransferase from Rice: Molecular Basis for the Different Reactivity Toward Different Substrates. J. Plant Biol. 2011, 54, 314–320. [Google Scholar] [CrossRef]
  19. Fellenberg, C.; Milkowski, C.; Hause, B.; Lange, P.R.; Bottcher, C.; Schmidt, J.; Vogt, T. Tapetum-specific location of a cation-dependent O-methyltransferase in Arabidopsis thaliana. Plant J. 2008, 56, 132–145. [Google Scholar] [CrossRef]
  20. Liu, X.; Luo, Y.; Wu, H.; Xi, W.; Yu, J.; Zhang, Q.; Zhou, Z. Systematic analysis of O-methyltransferase gene family and identification of potential members involved in the formation of O-methylated flavonoids in Citrus. Gene 2016, 575, 458–472. [Google Scholar] [CrossRef]
  21. Zhao, K.; Yu, K.; Fu, X.; Zhao, X.; Xia, N.; Zhan, Y.; Zhao, X.; Han, Y.; Santalla, M. Genome-wide identification and expression profile analysis of the OMT gene family in response to cyst nematodes and multi-abiotic stresses in soybean. Crop Pasture Sci. 2022, 73, 1279–1290. [Google Scholar] [CrossRef]
  22. Xu, R.X.; Gao, S.; Zhao, Y.; Lou, H.X.; Cheng, A.X. Functional characterization of a Mg(2+)-dependent O-methyltransferase with coumarin as preferred substrate from the liverwort Plagiochasma appendiculatum. Plant Physiol. Biochem. 2016, 106, 269–277. [Google Scholar] [CrossRef]
  23. Berim, A.; Hyatt, D.C.; Gang, D.R. A set of regioselective O-methyltransferases gives rise to the complex pattern of methoxylated flavones in sweet basil. Plant Physiol. 2012, 160, 1052–1069. [Google Scholar] [CrossRef]
  24. Lu, S.; Zhuge, Y.; Hao, T.; Liu, Z.; Zhang, M.; Fang, J. Systematic analysis reveals O-methyltransferase gene family members involved in flavonoid biosynthesis in grape. Plant Physiol. Biochem. 2022, 173, 33–45. [Google Scholar] [CrossRef]
  25. Cai, T.; Sharif, Y.; Zhuang, Y.; Yang, Q.; Yang, Q.; Chen, X.; Chen, K.; Chen, Y.; Gao, M.; Dang, H.; et al. In-silico identification and characterization of O-methyltransferase gene family in peanut (Arachis hypogaea L.) reveals their putative roles in development and stress tolerance. Front. Plant Sci. 2023, 14, 1145624. [Google Scholar]
  26. Chen, J.H.; Li, X.M.; Yang, W.Y.; Liu, J. Research progress of plant O-methoxide flavonoids and O-methyltransferases. Nat. Prod. Res. Dev. 2021, 33, 1072–1079. [Google Scholar] [CrossRef]
  27. Umezawa, T.; Ragamustari, S.K.; Nakatsubo, T.; Wada, S.; Li, L.; Yamamura, M.; Sakakibara, N.; Hattori, T.; Suzuki, S.; Chiang, V.L. A lignan O-methyltransferase catalyzing the regioselective methylation of matairesinol in Carthamus tinctorius. Plant Biotechnol. 2013, 30, 97–109. [Google Scholar] [CrossRef]
  28. Liu, H.; Xu, R.-X.; Gao, S.; Cheng, A.-X. The Functional Characterization of a Site-Specific Apigenin 4′-O-methyltransferase Synthesized by the Liverwort Species Plagiochasma appendiculatum. Molecules 2017, 22, 759. [Google Scholar] [CrossRef]
  29. Wang, Y.; Sheng, L.; Zhang, H.; Du, X.; An, C.; Xia, X.; Chen, F.; Jiang, J.; Chen, S. CmMYB19 Over-Expression Improves Aphid Tolerance in Chrysanthemum by Promoting Lignin Synthesis. Int. J. Mol. Sci. 2017, 18, 619. [Google Scholar] [CrossRef]
  30. Lv, G.; Tang, D.; Chen, F.; Sun, Y.; Fang, W.; Guan, Z.; Liu, Z.; Chen, S. The anatomy and physiology of spray cut chrysanthemum pedicels, and expression of a caffeic acid 3-O-methyltransferase homologue. Postharvest. Biol. Technol. 2011, 60, 244–250. [Google Scholar] [CrossRef]
  31. Jiang, Y.; Ji, X.; Duan, L.; Ye, P.; Yang, J.; Zhan, R.; Chen, W.; Ma, D. Gene mining and identification of a flavone synthase II involved in flavones biosynthesis by transcriptomic analysis and targeted flavonoid profiling in Chrysanthemum indicum L. Ind. Crop. Prod. 2019, 134, 244–256. [Google Scholar] [CrossRef]
  32. Wu, Q.W.; Wei, M.; Feng, L.F.; Ding, L.; Wei, W.K.; Yang, J.F.; Lin, X.J.; Liang, H.L.; Zhan, R.T.; Ma, D.M. Rhamnosyltransferases involved in the biosynthesis of flavone rutinosides in Chrysanthemum species. Plant Physiol. 2022, 190, 2122–2136. [Google Scholar] [CrossRef] [PubMed]
  33. Song, C.; Liu, Y.; Song, A.; Dong, G.; Zhao, H.; Sun, W.; Ramakrishnan, S.; Wang, Y.; Wang, S.; Li, T.; et al. The Chrysanthemum nankingense Genome Provides Insights into the Evolution and Diversification of Chrysanthemum Flowers and Medicinal Traits. Mol. Plant 2018, 11, 1482–1491. [Google Scholar] [CrossRef]
  34. Kim, B.G.; Sung, S.H.; Chong, Y.; Lim, Y.; Ahn, J.H. Plant flavonoid O. -methyltransferases: Substrate specificity and application. J. Plant Biol. 2010, 53, 321–329. [Google Scholar] [CrossRef]
  35. Kishimoto, K.; Matsui, K.; Ozawa, R.; Takabayashi, J. Volatile C6-aldehydes and Allo-ocimene activate defense genes and induce resistance against Botrytis cinerea in Arabidopsis thaliana. Plant Cell Physiol. 2005, 46, 1093–1102. [Google Scholar] [CrossRef]
  36. Byeon, Y.; Lee, H.Y.; Lee, K.; Back, K. Caffeic acid O-methyltransferase is involved in the synthesis of melatonin by methylating N-acetylserotonin in Arabidopsis. J. Pineal Res. 2014, 57, 219–227. [Google Scholar] [CrossRef]
  37. Zhang, X.; Chen, B.; Wang, L.; Ali, S.; Guo, Y.; Liu, J.; Wang, J.; Xie, L.; Zhang, Q. Genome-wide identification and characterization of caffeic acid O-Methyltransferase gene family in soybean. Plants 2021, 10, 2816. [Google Scholar] [CrossRef] [PubMed]
  38. Kim, B.G.; Lee, H.J.; Park, Y.; Lim, Y.; Ahn, J.H. Characterization of an O-methyltransferase from soybean. Plant Physiol. Biochem. 2006, 44, 236–241. [Google Scholar] [CrossRef]
  39. Bhuiyan, N.H.; Selvaraj, G.; Wei, Y.; King, J. Gene expression profiling and silencing reveal that monolignol biosynthesis plays a critical role in penetration defence in wheat against powdery mildew invasion. J. Exp. Bot. 2009, 60, 509–521. [Google Scholar] [CrossRef]
  40. Zou, Q.; Guo, Q.; Wang, T.; Chen, J.; Yang, F.; Yang, C. Comparison of metabolome characteristics and screening of chemical markers in Chrysanthemum indicum from different habitats. Physiol. Mol. Biol. Plants 2022, 28, 65–76. [Google Scholar] [CrossRef]
  41. Barakat, A.; Choi, A.; Yassin, N.B.M.; Park, J.S.; Sun, Z.; Carlson, J.E. Comparative genomics and evolutionary analyses of the O-methyltransferase gene family in Populus. Gene 2011, 479, 37–46. [Google Scholar] [CrossRef]
  42. Zhao, D.; Yao, Z.; Zhang, J.; Zhang, R.; Mou, Z.; Zhang, X.; Li, Z.; Feng, X.; Chen, S.; Reiter, R.J. Melatonin synthesis genes N-acetylserotonin methyltransferases evolved into caffeic acid O-methyltransferases and both assisted in plant terrestrialization. J. Pineal Res. 2021, 71, e12737. [Google Scholar] [CrossRef] [PubMed]
  43. Taylor, J.S.; Raes, J. Duplication and divergence: The evolution of new genes and old ideas. Annu. Rev. Genet. 2004, 38, 615–643. [Google Scholar] [CrossRef]
  44. Tuskan, G.A.; Difazio, S.; Jansson, S.; Bohlmann, J.; Grigoriev, I.; Hellsten, U.; Putnam, N.; Ralph, S.; Rombauts, S.; Salamov, A.; et al. The genome of black cottonwood, Populus trichocarpa (Torr. & Gray). Science 2006, 313, 1596–1604. [Google Scholar] [CrossRef] [PubMed]
  45. Moore, R.C.; Purugganan, M.D. The early stages of duplicate gene evolution. Proc. Natl. Acad. Sci. USA 2003, 100, 15682–15687. [Google Scholar] [CrossRef] [PubMed]
  46. Huang, S.; Ding, J.; Deng, D.; Tang, W.; Sun, H.; Liu, D.; Zhang, L.; Niu, X.; Zhang, X.; Meng, M.; et al. Draft genome of the kiwifruit Actinidia chinensis. Nat. Commun. 2013, 4, 2640. [Google Scholar] [CrossRef]
  47. Zhang, X.; Yuan, W.; Zhao, Y.; Ren, Y.; Zhao, X.; Yuan, Z. Genome-Wide Identification and Evolutionary Analysis of AOMT Gene Family in Pomegranate (Punica granatum). Agronomy 2021, 11, 318. [Google Scholar] [CrossRef]
  48. Lam, K.C.; Ibrahim, R.K.; Behdad, B.; Dayanandan, S. Structure, function, and evolution of plant O-methyltransferases. Genome 2007, 50, 1001–1013. [Google Scholar] [CrossRef] [PubMed]
  49. Schmidt, A.; Li, C.; Shi, F.; Jones, A.D.; Pichersky, E. Polymethylated myricetin in trichomes of the wild tomato species Solanum habrochaites and characterization of trichome-specific 3’/5’- and 7/4’-myricetin O-methyltransferases. Plant Physiol. 2011, 155, 1999–2009. [Google Scholar] [CrossRef]
  50. Liu, H.; Xu, R.X.; Zhang, X.S.; Zhu, T.T.; Lou, H.X.; Cheng, A.X. The identification and functional characterization of three liverwort class I O-methyltransferases. Phytochemistry 2019, 159, 190–198. [Google Scholar] [CrossRef]
  51. Berim, A.; Gang, D.R. Characterization of two candidate flavone 8-O-methyltransferases suggests the existence of two potential routes to nevadensin in sweet basil. Phytochemistry 2013, 92, 33–41. [Google Scholar] [CrossRef]
  52. El-Gebali, S.; Mistry, J.; Bateman, A.; Eddy, S.R.; Luciani, A.; Potter, S.C.; Qureshi, M.; Richardson, L.J.; Salazar, G.A.; Smart, A.; et al. The Pfam protein families database in 2019. Nucleic Acids Res. 2019, 47, 427–432. [Google Scholar] [CrossRef]
  53. Duvaud, S.; Gabella, C.; Lisacek, F.; Stockinger, H.; Ioannidis, V.; Durinx, C. Expasy, the Swiss Bioinformatics Resource Portal, as designed by its users. Nucleic Acids Res. 2021, 49, 216–227. [Google Scholar] [CrossRef]
  54. Horton, P.; Park, K.J.; Obayashi, T.; Fujita, N.; Harada, H.; Adams-Collier, C.J.; Nakai, K. WoLF PSORT: Protein localization predictor. Nucleic Acids Res. 2007, 35, 585–587. [Google Scholar] [CrossRef]
  55. Bailey, T.L.; Johnson, J.; Grant, C.E.; Noble, W.S. The MEME Suite. Nucleic Acids Res. 2015, 43, 39–49. [Google Scholar] [CrossRef]
  56. Shen, G.M.; Jiang, H.B.; Wang, X.N.; Wang, J.J. Evaluation of endogenous references for gene expression profiling in different tissues of the oriental fruit fly Bactrocera dorsalis (Diptera: Tephritidae). BMC Mol. Biol. 2010, 11, 76. [Google Scholar] [CrossRef]
  57. Gu, C.; Chen, S.; Liu, Z.; Shan, H.; Luo, H.; Guan, Z.; Chen, F. Reference gene selection for quantitative real-time PCR in Chrysanthemum subjected to biotic and abiotic stress. Mol. Biotechnol. 2011, 49, 192–197. [Google Scholar] [CrossRef]
Figure 1. Phylogenetic relationships of OMTs in different species. Subclades are marked by different backgrounds. The blue arc represents COMT subfamily; green and yellow arcs represent CCoAOMT subfamily. UniProt entries for these OMTs are given in Table S2.
Ijms 25 10037 g001
Figure 2. Phylogenetic relationship, gene structure, and motif analysis of C. indicum OMTs. (a) Phylogenetic tree. (b) Gene structure analysis. Exons (CDS, coding sequence) and introns are represented by the yellow box and the grey line, respectively. The green box represents UTR (untranslated region). (c) Conserved domain prediction. The protein length can be estimated using the scale at the bottom. (d) Conserved motif prediction. Motifs 1–14 are indicated by the different color boxes.
Ijms 25 10037 g002
Figure 3. Expression pattern of OMTs in different capitulum development stages and leaves of C. indicum. (a) C. indicum tissues. Flower1–3, respectively, correspond to flower bud stage, early flowering stage, full opening stage. Heatmap display of C. indicum OMTs with relatively high transcript levels (FPKM > 10) (b) and with relatively low transcript levels (FPKM < 10) (c). The original data of the RNA-seq are shown in Table S3, and the hierarchical clustering analysis (Figure S1) shows its reproducibility and reliability. The color scale from blue to red color represents Z-score-normalized gene expression levels from low to high. Dendrograms on the left side of the heat map show the hierarchical clustering between genes. At the tip of the cluster tree, CiCOMTs and CiCCoAOMTs are marked with red and blue circle dots, respectively.
Ijms 25 10037 g003
Figure 4. Quantitative expression and relative expression levels of OMTs in capitulum at different development stages and leaves of C. indicum. The gene name appears at the top of each histogram and tissues appear at the bottom. The relative expression level of each gene in flower1 is set to 1. Error bar means standard deviation (SD) among three independent replicates. * p < 0.05, ** p < 0.01, *** p < 0.001, ns means no significance.
Ijms 25 10037 g004
Figure 5. Screening of C. indicum OMT genes involved in flavonoid accumulation in the capitulum. (a) Correlation analysis heatmap between methylated flavonoid concentrations content and the expression of C. indicum OMT genes (FPKM > 10 in at least one sample) based on Pearson correlation coefficient (r). (b) Correlation analysis heatmap between potential methylation substrates content and the expression of OMT genes based on Pearson correlation coefficient (r). (c) Flavonoid structure. Methylation sites are marked in blue.
Ijms 25 10037 g005
Figure 6. UPLC chromatograms of the reactions of CiCCoAOMT1 with different flavones substrates including quercetin (a) and luteolin (b). Substrates incubated with the empty vector (pET32a) are indicated in cyan. Substrates utilized by recombinant CiCCoAOMT1 are indicated in red. Authentic compounds of methylated products are indicated in yellow. OCH3 in blue color represents the methylation site. The interrupted line points to the retention time of the compound.
Ijms 25 10037 g006
Figure 7. Subcellular localization of CiCCoAOMT1 in N. benthamiana. GFP, GFP channel; mCherry, RFP channel; Bright, blight field channel; Merged, merged image of the GFP, mCherry, and Bright channels. Scale bars are 20 μm.
Ijms 25 10037 g007
Figure 8. Overexpression analysis of CiCCoAOMT1 in C. indicum. (A) The expression pattern of CiCCoAOMT1. (B) LC-MS extracted ion chromatograms (EIC) of C. indicum with CiCCoAOMT1 or empty vector. (C) Changes in the chrysoeriol content after overexpression of CiCCoAOMT1 gene. Data are mean ± standard deviation of three biological replicates. ** p < 0.01, *** p < 0.001 (1-tailed paired t-test).
Ijms 25 10037 g008
Table 1. Discovered motifs in the amino sequences of C. indicum OMTs.
No. MotifLogoE-ValueSitesWidth
1Ijms 25 10037 i0011.3 × 10−11993050
2Ijms 25 10037 i0022.1 × 10−7447025
3Ijms 25 10037 i0035.5 × 10−8512450
4Ijms 25 10037 i0041.1 × 10−5504021
5Ijms 25 10037 i0051.2 × 10−5853929
6Ijms 25 10037 i0068.4 × 10−5456221
7Ijms 25 10037 i0071.4 × 10−5442728
8Ijms 25 10037 i0081.1 × 10−4984227
9Ijms 25 10037 i0091.1 × 10−3074025
10Ijms 25 10037 i0107.3 × 10−2974321
11Ijms 25 10037 i0111.5 × 10−3103225
12Ijms 25 10037 i0123.4 × 10−2734521
13Ijms 25 10037 i0137.0 × 10−2612715
14Ijms 25 10037 i0141.8 × 10−2265615
Sites, the number of sequences containing the motif; Width, the sequence length of the motif, measured in bp.
Disclaimer/Publisher’s Note: The statements, opinions and data contained in all publications are solely those of the individual author(s) and contributor(s) and not of MDPI and/or the editor(s). MDPI and/or the editor(s) disclaim responsibility for any injury to people or property resulting from any ideas, methods, instructions or products referred to in the content.

