
Review of Applications of β-Cyclodextrin as a Chiral Selector for Effective Enantioseparation


Abstract
:1. Introduction
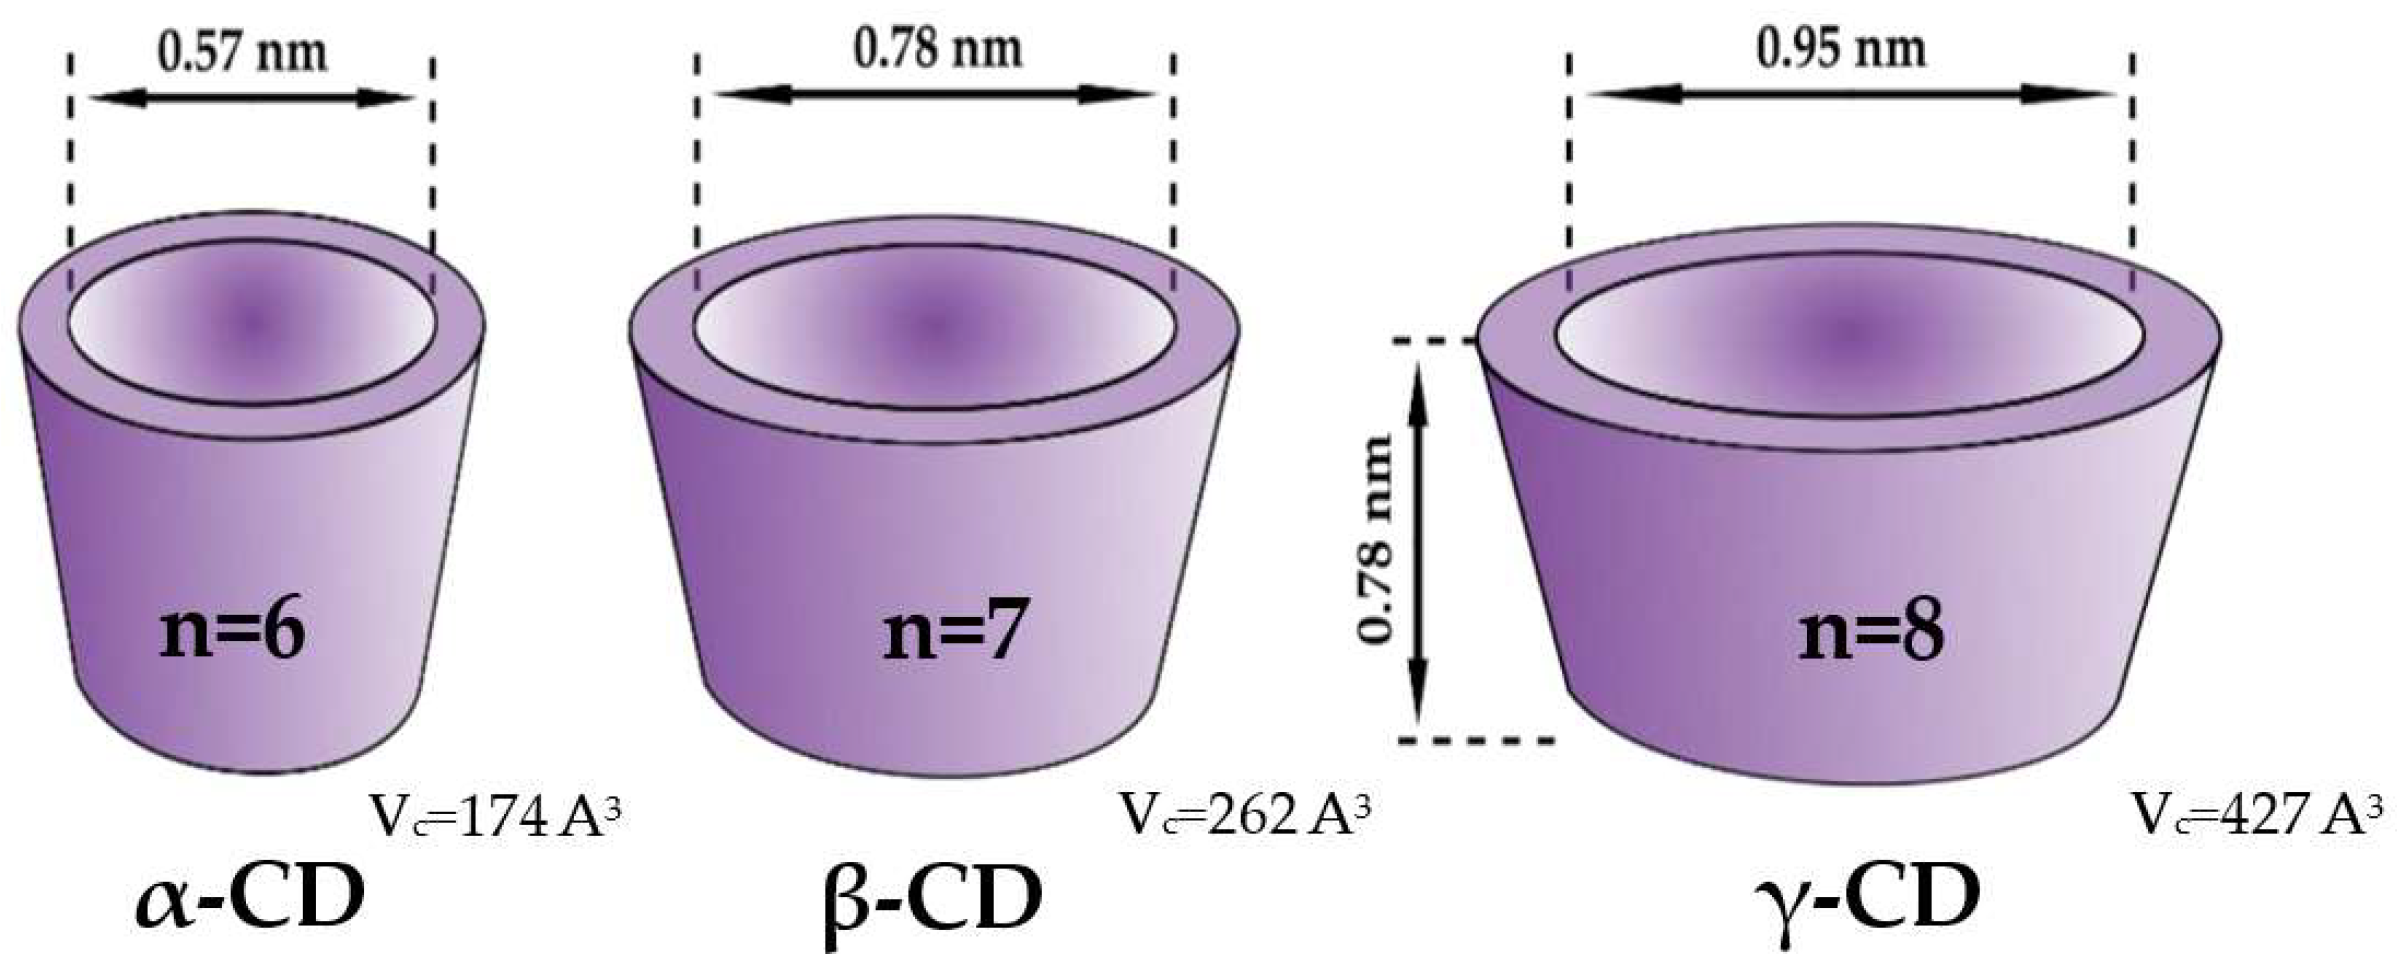
2. Cyclodextrins as Chiral Selectors—Why β-CD Is the Most Popular One
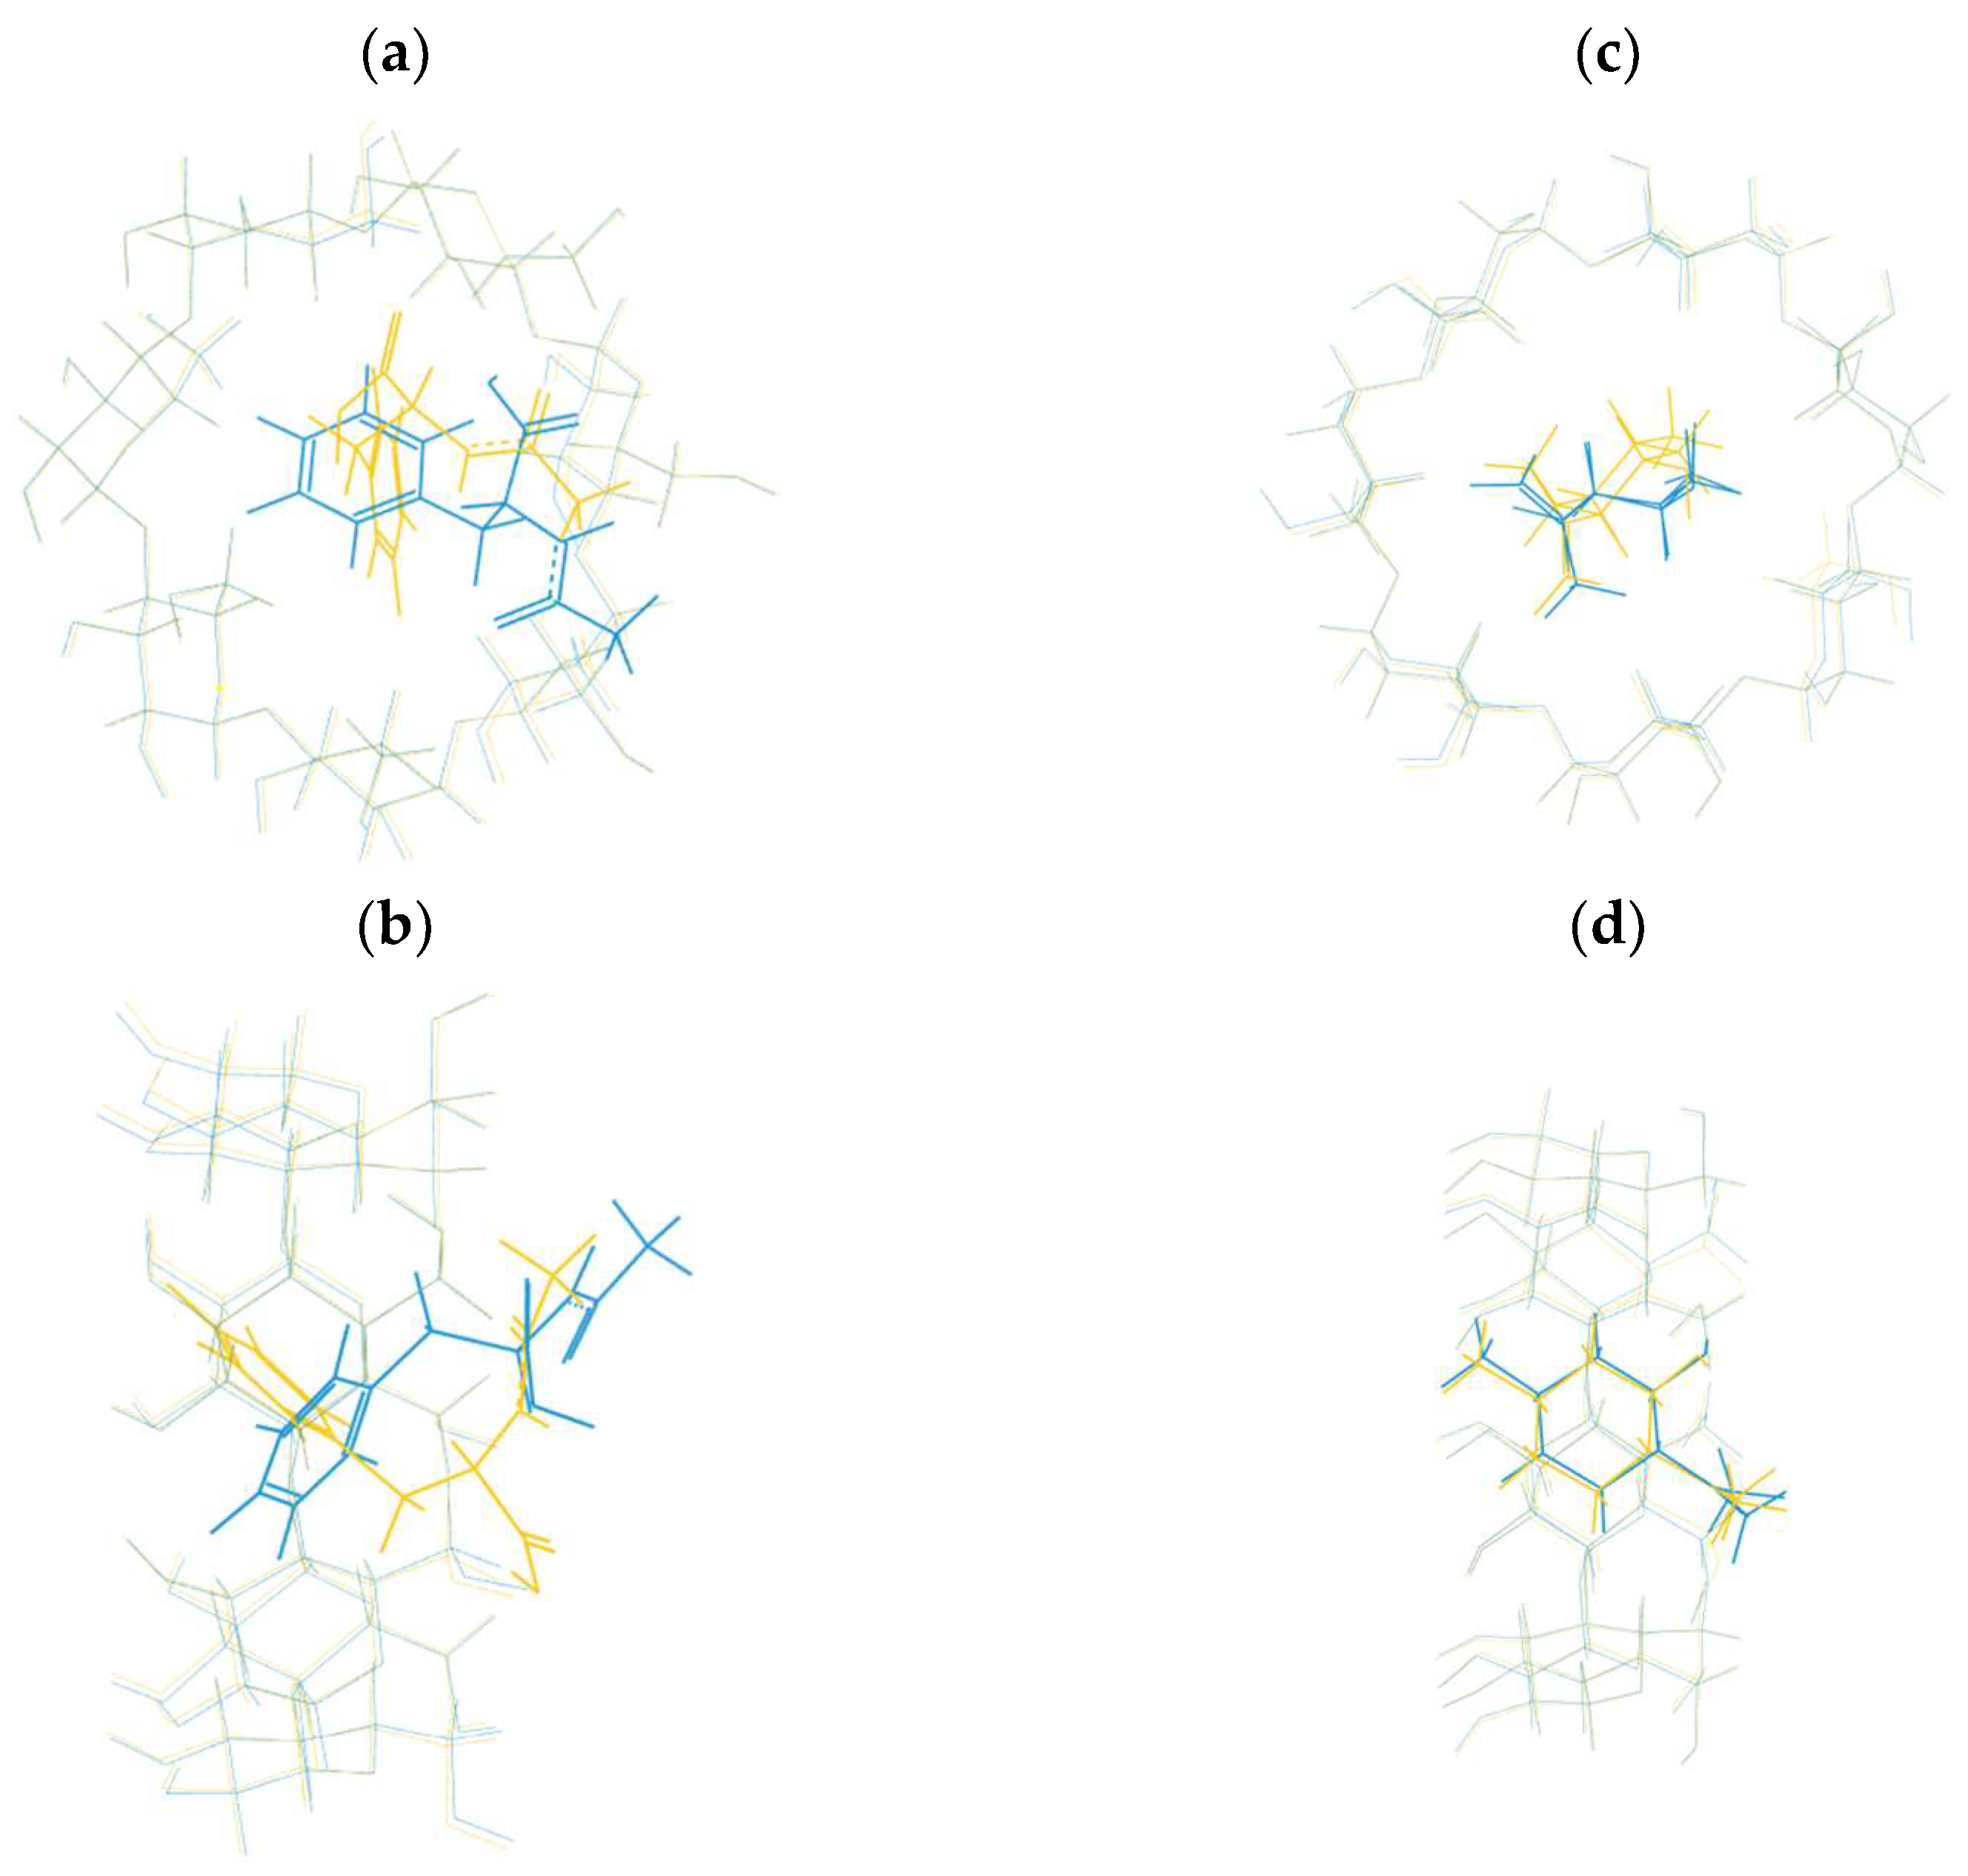
Crystal Structures of The Complexes with Native Β-CD
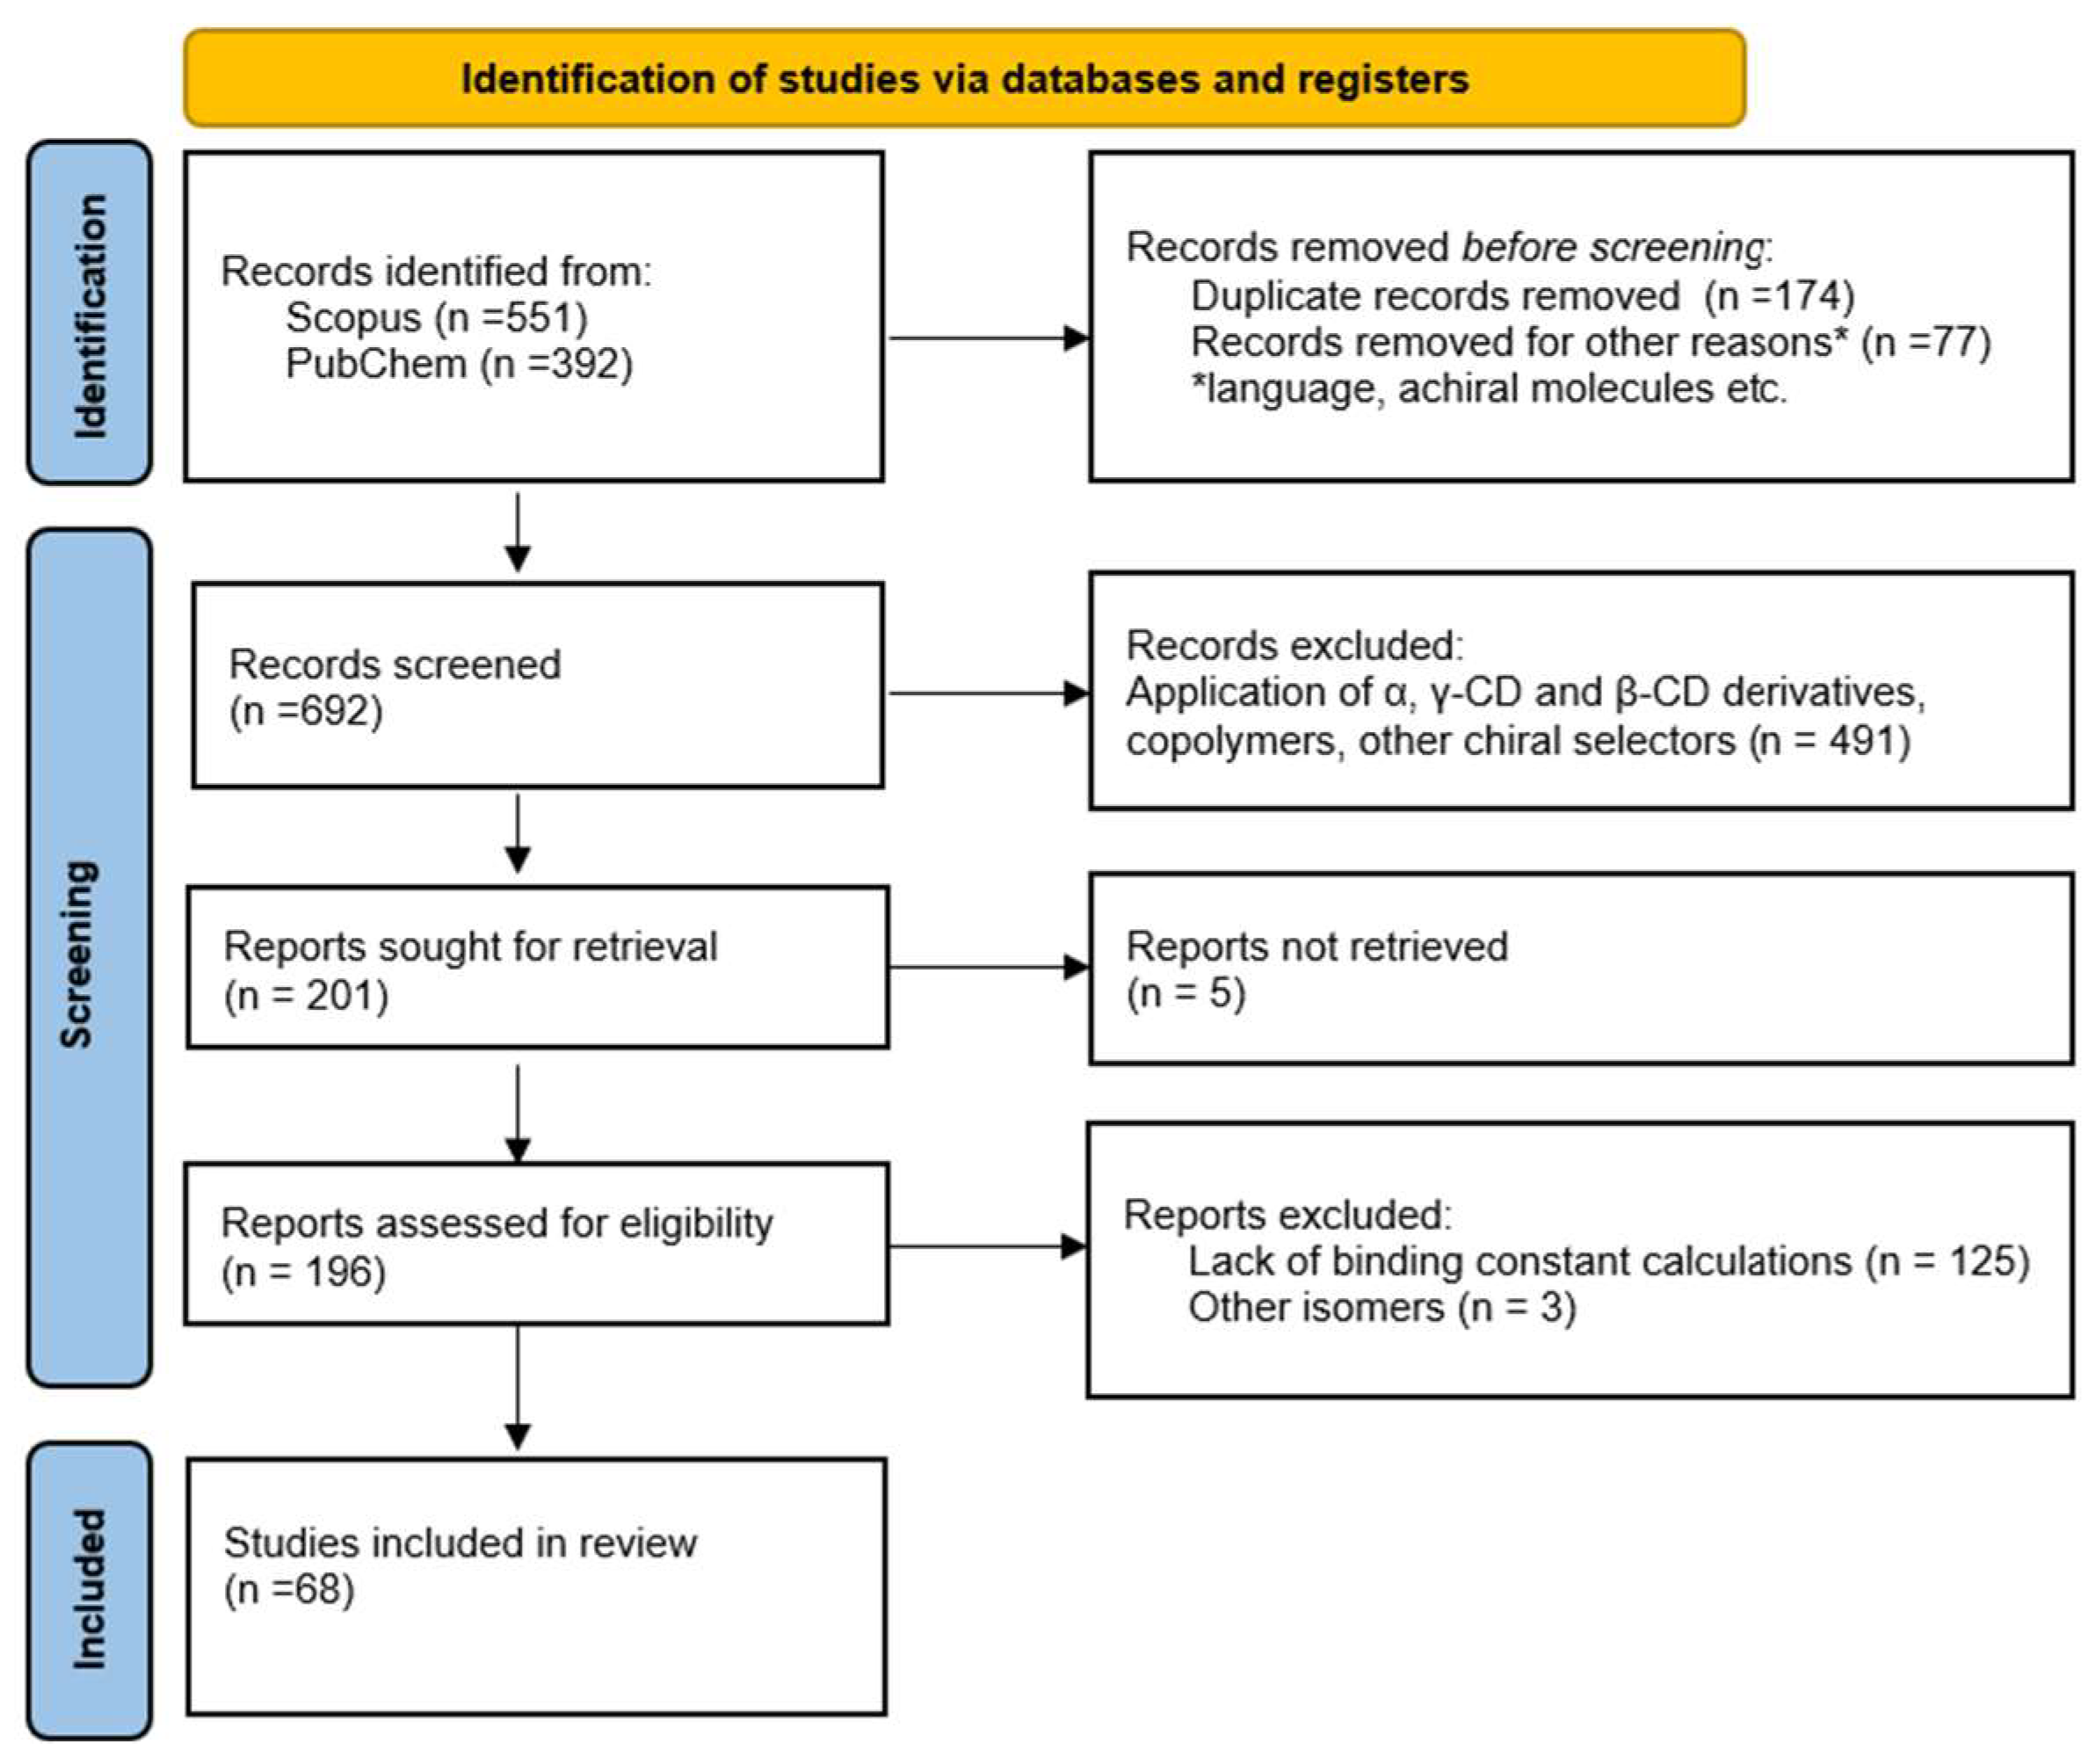
3. Aim and Design of the Study
4. Theoretical Overview
5. Determination of Binding Constant
5.1. Binding Selectivity (α)
5.2. Analytical Methods Used for Determination of Binding Constant
6. Overview of the Determination of the Binding Constants in Chiral Selective Analytical Analysis
6.1. Liquid Chromatography (LC)
6.2. Capillary Electrophoresis (CE)
6.3. Nuclear Magnetic Resonance (NMR)
6.4. Ultraviolet–Visible (UV–vis) and Fluorescence Spectroscopy (FS)
6.4.1. Ultraviolet Analysis (UV–vis)
6.4.2. Fluorescence (FS)
6.4.3. Isothermal Titration Calorimetry (ITC)
6.4.4. Other Methods
6.5. Comparison of Analytical Methods within the Single Study
7. Key Factors Influencing the Effectiveness of Enantioselectivity of Β-CD
7.1. Additives
7.2. Temperature and pH
7.2.1. Temperature and Thermodynamic Properties
7.2.2. pH Value
7.3. Solvent
7.4. Optimal Conditions
7.5. Comparision with Chosen Other Chiral Selectors
7.6. Stoichiometry of the Complexes
7.7. Similarities and Discrepancies between Studies
7.7.1. Ketoprofen
7.7.2. Ephedrine Derivatives
7.7.3. Thalidomide
7.7.4. Propranolol
7.7.5. Naproxen
7.7.6. Noradrenaline
7.7.7. Amino Acids
8. Conclusions
Author Contributions
Funding
Conflicts of Interest
Abbreviations
| Abbreviation | Description |
| 2,6-DKP | 2,6-diketopiperazine derivative |
| 2′OHFL | (2-(2-hydroxy-phe-nyl)-2,3-dihydro-4h-chromen-4-one, 2′-hydroxyflavanone |
| 4′OHFL | 2-(4-hydroxyphenyl)-2,3-dihydro-4h-chromen-4-one, 4′-hydroxyflavanone |
| 5-MeO-DPAC | 5-methoxy-3-(di-n-propylamino)chroman |
| 5-OH-DPAC | 5-hydroxy-3-(di-n-propylamino)chroman |
| AA | 2-acetyl-1-(4′-chlorophenyl)-6,7-dimethoxy-1,2,3,4-tetrahydroisoquinoline |
| ACE | Affinity Capillary Electrophoresis |
| Ala | Alanine |
| am-β-CD | 6-amino-6-deoxy-β-cyclodextrin |
| ANP | Acyclic Nucleoside Phosphonate |
| ANP 4 | (1-(1-(2,6-diamino-9h-purin-9-yl)-3-hydroxypropan-2-yl)-1,2,3-triazol-4-yl)phosphonic acid |
| ANP 5 | 2-((diisopropoxyphosphoryl)methoxy)-3-(2,4-dioxo-3,4-dihydropyrimidin-1(2h)-yl)propanoic acid |
| API | Active Pharmaceutical Ingredient |
| API-MS | Atmospheric Pressure Ionization Mass Spectrometry |
| Asp | Asparagine |
| ATR | Attenuated Total Reflection |
| BGE | Background electrolyte |
| BINOL | 1,1′-binaphthol |
| BNP | 1,1′-binaphthyl-2,2′-diyl hydrogen phosphate |
| BrPh | Brompheniramine |
| Cbz- | Benzyloxycarbonyl |
| CCDC | Cambridge Crystallographic Data Centre |
| CD | Circular Dichroism |
| CDs | Cyclodextrins |
| CE | Capillary Electrophoresis |
| CHMA | α-cyclohexylmandelic acid |
| CM-β-CD | Carboxymethyl-β-cyclodextrin |
| CP | Cyclopentolate |
| Crv | Carvone |
| CSP | Chiral Stationary Phase |
| CS | Chiral selector |
| CT | Citalopram |
| CZE | Capillary Zone Electrophoresis |
| de | Diastereomeric Excess |
| DIM | Dimethindene |
| DMF | N,N-Dimethylformamide |
| DNP- | Dinitrophenyl- |
| Dns-Glu | Dansylated-Glutamate |
| Dns-Leu | Dansylated-Leucine |
| DPAC | 3,4-dihydro-2h-1-benzopyran |
| DSC | Differential Scanning Calorimetry |
| ee | Enantiomeric Excess |
| EOF | Electroosmotic Flow |
| ES | Enantioseparation |
| ESI-MS | Electrospray Ionization Mass Spectrometry |
| EurPh | European Pharmacopeia |
| FEP | Free Energy Perturbation |
| FET | 1-ferrocenylethanol |
| FL | 2-phenyl-2,3-dihydro-4h-chromen-4-onen, flavanone |
| FLUO | Fluorescence |
| FTIR | Fourier Transform Infrared Spectroscopy |
| FTIR-ATS | Attenuated Total Reflectance Fourier Transform Infrared Spectroscopy |
| FS | Fluorescence spectroscopy |
| GC | Gas Chromatography |
| GLC | Gas–Liquid Chromatography |
| Glu | Glutamic Acid |
| His | Histidine |
| HPLC | High-Performance Liquid Chromatography |
| HPMPA | 9-[3-hydroxy-2-(phosphonomethoxy)propyl]adenine |
| HP-β-CD | (2-hydroxypropyl)-β-cyclodextrin |
| HR-DOSY | High-Resolution Diffusion-Ordered Spectroscopy |
| HSCCC | High-Speed Counter-Current Chromatography |
| IB | 6-[imidazol-1-yl(phenyl)methyl]-3-methyl-1,3-benzothiazol-2-one |
| Ibu | 1-iodobutane |
| ID | Inner Diameter |
| IIR | Ion Interaction Reagent |
| IR | Infrared |
| ITC | Isothermal Titration Calorimetry |
| K | Binding Constant |
| KC | Ketoconazole |
| KP | Ketoprofen |
| LC | Liquid Chromatography |
| Leu | Leucine |
| MeOH | Methanol |
| MET | Metomidate |
| MPB | Methylphenobarbital |
| NA | Not Applicable |
| N-Ac- | N-Acetyl- |
| Nap | Naproxen |
| NOESY | Nuclear Overhauser Effect Spectroscopy |
| NP | Not Provided |
| Phe | Phenylalanine |
| PMPA | 9-[2-(phosphonomethoxy)propyl]adenine |
| PMPDAP | 9-[2-(phosphonomethoxy)propyl]-2,6-diaminopurine |
| PTZ | Promethazine Hydrochloride |
| PZQ | Praziquantel |
| ROESY | Rotating-Frame Overhauser Enhancement Spectroscopy |
| RP-HPLC | Reverse-Phase High-Performance Liquid Chromatography |
| RPLC | Reversed-Phase Liquid Chromatography |
| RTP | Room Temperature Phosphorescence |
| SIB | Sibutramine |
| TAA | Tetraalkylammonium |
| TB | Tröger’S Base |
| TD | Thermodynamics |
| TEA | Triethylamine |
| TG | Thermogravimetric Analysis |
| THA | Thalidomide |
| Thr | Threonine |
| TM-β-CD | Heptakis(2,3,6-tri-o-methyl-)-β-cyclodextrin |
| Trp | Tryptophan |
| Tyr | Tyrosine |
| UV-Vis | Ultraviolet Absorption Spectroscopy |
| Vc | Cavity volume |
| VP | Verapamil |
| Z- | Benzyloxycarbonyl |
| α ratio | Binding selectivity, ratio of binding constants |
| ΔK | Difference in binding constants |
References
- Vantomme, G.; Crassous, J. Pasteur and Chirality: A Story of How Serendipity Favors the Prepared Minds. Chirality 2021, 33, 597–601. [Google Scholar] [CrossRef] [PubMed]
- Schiffman, S.; Sennewald, K.; Gagnon, J. Comparison of Taste Qualities and Thresholds of D- and L-Amino Acids. Physiol. Behav. 1981, 27, 51–59. [Google Scholar] [CrossRef]
- Jafari, M.; Tashkhourian, J.; Absalan, G. Chiral Recognition of Naproxen Enantiomers Based on Fluorescence Quenching of Bovine Serum Albumin–Stabilized Gold Nanoclusters. Spectrochim. Acta A Mol. Biomol. Spectrosc. 2017, 185, 77–84. [Google Scholar] [CrossRef] [PubMed]
- Papp, L.-A.; Krizbai, S.; Dobó, M.; Hancu, G.; Szabó, Z.-I.; Tóth, G. Determination of Chiral Impurity of Naproxen in Different Pharmaceutical Formulations Using Polysaccharide-Based Stationary Phases in Reversed-Phased Mode. Molecules 2022, 27, 2986. [Google Scholar] [CrossRef] [PubMed]
- Murtas, G.; Pollegioni, L. D-Amino Acids and Cancer: Friends or Foes? Int. J. Mol. Sci. 2023, 24, 3274. [Google Scholar] [CrossRef]
- Kowalski, T.W.; Feira, M.F.; Lord, V.O.; Gomes, J.d.A.; Giudicelli, G.C.; Fraga, L.R.; Sanseverino, M.T.V.; Recamonde-Mendoza, M.; Schuler-Faccini, L.; Vianna, F.S.L. A New Strategy for the Old Challenge of Thalidomide: Systems Biology Prioritization of Potential Immunomodulatory Drug (IMiD)-Targeted Transcription Factors. Int. J. Mol. Sci. 2023, 24, 11515. [Google Scholar] [CrossRef]
- Ceramella, J.; Iacopetta, D.; Franchini, A.; De Luca, M.; Saturnino, C.; Andreu, I.; Sinicropi, M.S.; Catalano, A. A Look at the Importance of Chirality in Drug Activity: Some Significative Examples. Appl. Sci. 2022, 12, 10909. [Google Scholar] [CrossRef]
- Al-Sulaimi, S.; Kushwah, R.; Abdullah Alsibani, M.; El Jery, A.; Aldrdery, M.; Ashraf, G.A. Emerging Developments in Separation Techniques and Analysis of Chiral Pharmaceuticals. Molecules 2023, 28, 6175. [Google Scholar] [CrossRef]
- Poulson, B.G.; Alsulami, Q.A.; Sharfalddin, A.; El Agammy, E.F.; Mouffouk, F.; Emwas, A.H.; Jaremko, L.; Jaremko, M. Cyclodextrins: Structural, Chemical, and Physical Properties, and Applications. Polysaccharides 2021, 3, 1–31. [Google Scholar] [CrossRef]
- Qiu, H.; Zhu, B.; Zhu, J.; Chen, S.; Ma, C.; Xiang, H.; Tong, S. Recent Advances in Application of Cyclodextrin-Based Chiral Materials for Enantioseparation. TrAC Trends Anal. Chem. 2024, 175, 117708. [Google Scholar] [CrossRef]
- Chankvetadze, B.; Scriba, G.K.E. Cyclodextrins as Chiral Selectors in Capillary Electrophoresis: Recent Trends in Mechanistic Studies. TrAC Trends Anal. Chem. 2023, 160, 116987. [Google Scholar] [CrossRef]
- Peluso, P.; Chankvetadze, B. Native and Substituted Cyclodextrins as Chiral Selectors for Capillary Electrophoresis Enantioseparations: Structures, Features, Application, and Molecular Modeling. Electrophoresis 2021, 42, 1676–1708. [Google Scholar] [CrossRef] [PubMed]
- Hancu, G.; Papp, L.A.; Tóth, G.; Kelemen, H. The Use of Dual Cyclodextrin Chiral Selector Systems in the Enantioseparation of Pharmaceuticals by Capillary Electrophoresis: An Overview. Molecules 2021, 26, 2261. [Google Scholar] [CrossRef]
- Kurkov, S.V.; Loftsson, T. Cyclodextrins. Int. J. Pharm. 2013, 453, 167–180. [Google Scholar] [CrossRef] [PubMed]
- Beta Cyclodextrin Price: Factory Supply Wholesale Beta-Cyclodextrin Stabilizing Agent Cas 7585-39-9. Available online: https://www.alibaba.com/product-detail/Factory-Supply-Wholesale-Beta-Cyclodextrin-Stabilizing_1600847526990.html?spm=a2700.galleryofferlist.normal_offer.d_title.55d75cb5GPpNu7 (accessed on 26 July 2024).
- Hirayama, F.; Yamamoto, M.; Uekama, K. Acid-Catalyzed Hydrolysis of Maltosyl-β-Cyclodextrin. J. Pharm. Sci. 1992, 81, 913–916. [Google Scholar] [CrossRef]
- Schönberger, B.P.; Jansen, A.C.A.; Jansen, L.H.M. The Acid Hydrolysis of Cyclodextrins and Linear Oligosaccharies: A Comparative Study. In Proceedings of the Fourth International Symposium on Cyclodextrins, Munich, Germany, 20–22 April 1988; Springer: Dordrecht, The Netherlands, 1988; pp. 61–63. [Google Scholar]
- The Cambridge Structural Database CCDC. Available online: https://www.ccdc.cam.ac.uk/ (accessed on 26 July 2024).
- Cid-Samamed, A.; Rakmai, J.; Mejuto, J.C.; Simal-Gandara, J.; Astray, G. Cyclodextrins Inclusion Complex: Preparation Methods, Analytical Techniques and Food Industry Applications. Food Chem. 2022, 384, 132467. [Google Scholar] [CrossRef]
- CSD Entry: AGAZUD. Available online: https://www.ccdc.cam.ac.uk/structures/search?id=doi:10.5517/cc634zd&sid=DataCite (accessed on 23 August 2024).
- CSD Entry: AGAZIR. Available online: https://www.ccdc.cam.ac.uk/structures/search?id=doi:10.5517/cc634xb&sid=DataCite (accessed on 23 August 2024).
- CSD Entry: PAKREB. Available online: https://www.ccdc.cam.ac.uk/structures/search?id=doi:10.5517/ccdc.csd.ccz5tjg&sid=DataCite (accessed on 23 August 2024).
- CSD Entry: PAKRAX. Available online: https://www.ccdc.cam.ac.uk/structures/search?id=doi:10.5517/ccdc.csd.ccz5thf&sid=DataCite (accessed on 23 August 2024).
- Alexander, J.M.; Clark, J.L.; Brett, T.J.; Stezowski, J.J. Chiral Discrimination in Cyclodextrin Complexes of Amino Acid Derivatives: β-Cyclodextrin/N-Acetyl-L-Phenylalanine and N-Acetyl-D-Phenylalanine Complexes. Proc. Natl. Acad. Sci. USA 2002, 99, 5115–5120. [Google Scholar] [CrossRef]
- Hamilton, J.A.; Chen, L. Crystal Structures of Inclusion Complexes of.Beta.-Cyclodextrin with S-(+)- and (R)-(-)-Fenoprofen. J. Am. Chem. Soc. 1988, 110, 4379–4391. [Google Scholar] [CrossRef]
- Ceborska, M.; Szwed, K.; Suwinska, K. β-Cyclodextrin as the Suitable Molecular Container for Isopulegol Enantiomers. Carbohydr. Polym. 2013, 97, 546–550. [Google Scholar] [CrossRef]
- Christoforides, E.; Mentzafos, D.; Bethanis, K. Structural Studies of the Inclusion Complexes of the (+)- and (-)-Borneol Enantiomers in α- And β-Cyclodextrin. J. Incl. Phenom. Macrocycl. Chem. 2015, 81, 193–203. [Google Scholar] [CrossRef]
- Page, M.J.; McKenzie, J.E.; Bossuyt, P.M.; Boutron, I.; Hoffmann, T.C.; Mulrow, C.D.; Shamseer, L.; Tetzlaff, J.M.; Akl, E.A.; Brennan, S.E.; et al. The PRISMA 2020 Statement: An Updated Guideline for Reporting Systematic Reviews. BMJ 2021, 372, n71. [Google Scholar] [CrossRef] [PubMed]
- Endresz, G.; Chankvetadze, B.; Bergenthal, D.; Blaschke, G. Comparative Capillary Electrophoretic and Nuclear Magnetic Resonance Studies of the Chiral Recognition of Racemic Metomidate with Cyclodextrin Hosts. J. Chromatogr. A 1996, 732, 133–142. [Google Scholar] [CrossRef]
- Laverde, A.; Da Conceição, G.J.A.; Queiroz, S.C.N.; Fujiwara, F.Y.; Marsaioli, A.J. An NMR Tool for Cyclodextrin Selection in Enantiomeric Resolution by High-Performance Liquid Chromatography. Magn. Reson. Chem. 2002, 40, 433–442. [Google Scholar] [CrossRef]
- Acuña-Rougier, C.; Olea-Azar, C. Thermodynamic and Geometric Study of Diasteroisomeric Complexes Formed by Racemic Flavanones and Three Cyclodextrins through NMR. J. Incl. Phenom. Macrocycl. Chem. 2013, 75, 119–136. [Google Scholar] [CrossRef]
- Acuña-Rougier, C.; Jullian, C.; Olea-Azar, C. NMR as a Tool for Simultaneous Study of Diasteroisomeric Inclusion Complexes, Part 2: Complexes Formed by Racemic Mixture of 4′- Hydroxyflavanone and Two Cyclodextrins. J. Incl. Phenom. Macrocycl. Chem. 2012, 74, 157–166. [Google Scholar] [CrossRef]
- Guerrero-Martínez, A.; Montoro, T.; Viñas, M.H.; Tardajos, G. Complexation and Chiral Drug Recognition of an Amphiphilic Phenothiazine Derivative with β-Cyclodextrin. J. Pharm. Sci. 2008, 97, 1484–1498. [Google Scholar] [CrossRef] [PubMed]
- Ali, S.M.; Maheshwari, A.; Fozdar, B.I. 1H NMR Spectroscopic Study of Complexation of Citalopram with β-Cyclodextrin in Aqueous Solution. Magn. Reson. Chem. 2007, 45, 253–256. [Google Scholar] [CrossRef]
- Danel, C.; Azaroual, N.; Foulon, C.; Goossens, J.F.; Vermeersch, G.; Bonte, J.P.; Vaccher, C. NMR Studies of Chiral Recognition Mechanisms: Interaction of Enantiomers of N-Imidazole Derivatives with Cyclodextrin Hosts. Correlation with the CD-EKC Studies. Tetrahedron Asymmetry 2006, 17, 975–983. [Google Scholar] [CrossRef]
- Lee, S.; Yi, D.H.; Jung, S. NMR Spectroscopic Analysis on the Chiral Recognition of Noradrenaline by β-Cyclodextrin (β-CD) and Carboxymethyl-β-Cyclodextrin (CM-β-CD). Bull. Korean Chem. Soc. 2004, 25, 216–220. [Google Scholar] [CrossRef]
- Chankvetadze, B.; Pintore, G.; Burjanadze, N.; Bergenthal, D.; Bergander, K.; Breitkreuz, J.; Mühlenbrock, C.; Blaschke, G. Mechanistic Study of Opposite Migration Order of Dimethindene Enantiomers in Capillary Electrophoresis in the Presence of Native β-Cyclodextrin and Heptakis(2,3,6-Tri-O-Methyl)-β-Cyclodextrin. J. Chromatogr. A 2000, 875, 455–469. [Google Scholar] [CrossRef]
- Borges, R.B.; Laverde, A.; Porto, A.L.M.; Marsaioli, A.J. HR-DOSY and Sulfoxide Enantiomeric Discrimination by Cyclodextrin. Spectroscopy 2000, 14, 203–213. [Google Scholar] [CrossRef]
- Salvatierra, D.; Sánchez-Ruiz, X.; Garduño, R.; Cervelló, E.; Jaime, C.; Virgili, A.; Sánchez-Ferrando, F. Enantiodifferentiation by Complexation with β-Cyclodextrin: Experimental (NMR) and Theoretical (MD, FEP) Studies. Tetrahedron 2000, 56, 3035–3041. [Google Scholar] [CrossRef]
- Chankvetadze, B.; Burjanadze, N.; Pintore, G.; Bergenthal, D.; Bergander, K.; Mühlenbrock, C.; Breitkreuz, J.; Blaschke, G. Separation of Brompheniramine Enantiomers by Capillary Electrophoresis and Study of Chiral Recognition Mechanisms of Cyclodextrins Using NMR-Spectroscopy, UV Spectrometry, Electrospray Ionization Mass Spectrometry and X-Ray Crystallography. J. Chromatogr. A 2000, 875, 471–484. [Google Scholar] [CrossRef] [PubMed]
- Da Silva, A.M.; Empis, J.; Teixeira-Dias, J.J.C. Inclusion of Enantiomeric Carvones in β-Cyclodextrin: A Variable Temperature 1H NMR Study in Aqueous Solution. J. Incl. Phenom. 1999, 33, 81–97. [Google Scholar] [CrossRef]
- Chankvetadze, B.; Burjanadze, N.; Pintore, G.; Strickmann, D.; Bergenthal, D.; Blaschke, G. Chiral Recognition of Verapamil by Cyclodextrins Studied with Capillary Electrophoresis, NMR Spectroscopy, and Electrospray Ionization Mass Spectrometry. Chirality 1999, 11, 635–644. [Google Scholar] [CrossRef]
- Redenti, E.; Ventura, P.; Fronza, G.; Selva, A.; Rivara, S.; Plazzi, P.V.; Mor, M. Experimental and Theoretical Analysis of the Interaction of (±)-Cis- Ketoconazole with β-Cyclodextrin in the Presence of (+)-L-Tartaric Acid. J. Pharm. Sci. 1999, 88, 599–607. [Google Scholar] [CrossRef]
- Cotta Ramusino, M.; Bartolomei, M.; Gallinella, B. 1H NMR, UV and Circular Dichroism Study of Inclusion Complex Formation between the 5-Lipoxygenase Inhibitor Zileuton and β- and γ-Cyclodextrins. J. Incl. Phenom. Mol. Recognit. Chem. 1998, 32, 485–498. [Google Scholar] [CrossRef]
- Li, S.; Purdy, W.C. Circular Dichroism, Ultraviolet, and Proton Nuclear Magnetic Resonance Spectroscopic Studies of the Chiral Recognition Mechanism of Beta-Cyclodextrin. Anal. Chem. 1992, 64, 1405–1412. [Google Scholar] [CrossRef]
- López-García, M.Á.; López, Ó.; Maya, I.; Fernández-Bolaños, J.G. Complexation of Hydroxytyrosol with β-Cyclodextrins. An Efficient Photoprotection. Tetrahedron 2010, 66, 8006–8011. [Google Scholar] [CrossRef]
- Holzgrabe, U.; Mallwitz, H.; Branch, S.K.; Jefferies, T.M.; Wiese, M. Chiral Discrimination by NMR Spectroscopy of Ephedrine and N- Methylephedrine Induced by β-Cyclodextrin, Heptakis(2,3-Di-O-Acetyl)β- Cyclodextrin, and Heptakis(6-O-Acetyl)β-Cyclodextrin. Chirality 1997, 9, 211–219. [Google Scholar] [CrossRef]
- Zhu, H.; Wu, E.; Chen, J.; Jang, Y.S.; Kang, W.; Choi, J.K.; Lee, W.; Kang, J.S. Reverse Migration Order of Sibutramine Enantiomers as a Function of Cyclodextrin Concentration in Capillary Electrophoresis. J. Pharm. Biomed. Anal. 2011, 54, 1007–1012. [Google Scholar] [CrossRef] [PubMed]
- Kwaterczak, A.; Duszczyk, K.; Bielejewska, A. Comparison of Chiral Separation of Basic Drugs in Capillary Electrophoresis and Liquid Chromatography Using Neutral and Negatively Charged Cyclodextrins. Anal. Chim. Acta 2009, 645, 98–104. [Google Scholar] [CrossRef] [PubMed]
- Wahl, J.; Furuishi, T.; Yonemochi, E.; Meinel, L.; Holzgrabe, U. Characterization of Complexes between Phenethylamine Enantiomers and Β-cyclodextrin Derivatives by Capillary Electrophoresis—Determination of Binding Constants and Complex Mobilities. Electrophoresis 2017, 38, 1188–1200. [Google Scholar] [CrossRef] [PubMed]
- Řezanka, P.; Řezanková, K.; Sedláčková, H.; Mašek, J.; Rokosová, L.; Bláhová, M.; Řezanka, M.; Jindřich, J.; Sýkora, D.; Král, V. Influence of Substituent Position and Cavity Size of the Regioisomers of Monocarboxymethyl-α-, β-, and γ-Cyclodextrins on the Apparent Stability Constants of Their Complexes with Both Enantiomers of Tröger’s Base. J. Sep. Sci. 2016, 39, 980–985. [Google Scholar] [CrossRef]
- Šolínová, V.; Mikysková, H.; Kaiser, M.M.; Janeba, Z.; Holý, A.; Kašička, V. Estimation of Apparent Binding Constant of Complexes of Selected Acyclic Nucleoside Phosphonates with β-Cyclodextrin by Affinity Capillary Electrophoresis. Electrophoresis 2016, 37, 239–247. [Google Scholar] [CrossRef] [PubMed]
- Danel, C.; Azaroual, N.; Chavaria, C.; Odou, P.; Martel, B.; Vaccher, C. Comparative Study of the Complex Forming Ability and Enantioselectivity of Cyclodextrin Polymers by CE and 1H NMR. Carbohydr. Polym. 2013, 92, 2282–2292. [Google Scholar] [CrossRef]
- Castro-Puyana, M.; Crego, A.L.; Marina, M.L.; García-Ruiz, C. Enantioselective Separation of Azole Compounds by EKC. Reversal of Migration Order of Enantiomers with CD Concentration. Electrophoresis 2007, 28, 2667–2674. [Google Scholar] [CrossRef]
- Deñola, N.L.; Quiming, N.S.; Catabay, A.P.; Saito, Y.; Jinno, K. Optimization of Capillary Electrophoretic Enantioseparation for Basic Drugs with Native β-CD as a Chiral Selector. Electrophoresis 2006, 27, 2367–2375. [Google Scholar] [CrossRef]
- Foulon, C.; Danel, C.; Vaccher, M.P.; Bonte, J.P.; Vaccher, C.; Goossens, J.F. Chiral Separation of N-Imidazole Derivatives, Aromatase Inhibitors, by Cyclodextrin-Capillary Zone Electrophoresis. Mechanism of Enantioselective Recognition. Electrophoresis 2004, 25, 2735–2744. [Google Scholar] [CrossRef]
- Wang, F.; Khaledi, M.G. Chiral Separations by Nonaquaous Capillary Electrophoresis. Anal. Chem. 1996, 68, 3460–3467. [Google Scholar] [CrossRef]
- Baumy, P.; Morin, P.; Dreux, M.; Viaud, M.C.; Boye, S.; Guillaumet, G. Determination of β-Cyclodextrin Inclusion Complex Constants for 3,4-Dihydro-2-H-1-Benzopyran Enantiomers by Capillary Electrophoresis. J. Chromatogr. A 1995, 707, 311–326. [Google Scholar] [CrossRef]
- Terekhova, I.V.; Hammitzsch-Wiedemann, M.; Shi, Y.; Sungthong, B.; Scriba, G.K.E. Investigation of the PH-Dependent Complex Formation between β-Cyclodextrin and Dipeptide Enantiomers by Capillary Electrophoresis and Calorimetry. J. Sep. Sci. 2010, 33, 2499–2505. [Google Scholar] [CrossRef] [PubMed]
- Li, J.; Waldron, K.C. Estimation of the PH-Independent Binding Constants of Alanylphenylalanine and Leucylphenylalanine Stereoisomers with β-Cyclodextrin in the Presence of Urea. Electrophoresis 1999, 20, 171–179. [Google Scholar] [CrossRef]
- Penn, S.G.; Bergström, E.T.; Goodall, D.M.; Loran, J.S. Capillary Electrophoresis with Chiral Selectors: Optimization of Separation and Determination of Thermodynamic Parameters for Binding of Tioconazole Enantiomers to Cyclodextrins. Anal. Chem. 1994, 66, 2866–2873. [Google Scholar] [CrossRef]
- Penn, S.G.; Liu, G.; Bergström, E.T.; Goodall, D.M.; Loran, J.S. Systematic Approach to Treatment of Enantiomeric Separations in Capillary Electrophoresis and Liquid Chromatography. I. Initial Evaluation Using Propranolol and Dansylated Amino Acids. J. Chromatogr. A 1994, 680, 147–155. [Google Scholar] [CrossRef]
- Chankvetadze, B.; Lindner, W.; Scriba, G.K.E. Enantiomer Separations in Capillary Electrophoresis in the Case of Equal Binding Constants of the Enantiomers with a Chiral Selector: Commentary on the Feasibility of the Concept. Anal. Chem. 2004, 76, 4256–4260. [Google Scholar] [CrossRef]
- Slavíček, V.; Grüner, B.; Vespalec, R. Exploration of the Electrophoretic Behaviour of Borane Cluster Anions and of the Capability of Capillary Electrophoresis to Separate Them Chirally. J. Chromatogr. A 2003, 984, 121–134. [Google Scholar] [CrossRef]
- Obaid, A.; Jamil, A.K.M.; Prabu, S.; Saharin, S.M.; Mohamad, S. Spectroscopic Studies for the Inclusion Complexation of Ketoprofen Enantiomers with β-Cyclodextrin. Spectrochim. Acta A Mol. Biomol. Spectrosc. 2020, 241, 118674. [Google Scholar] [CrossRef] [PubMed]
- Wang, Y.; Feng, T.T.; Shi, L.L.; Liu, F.; Shang, Z.B.; Jin, W.J. Enantioselective Phosphorescence Behavior of Naproxen in β-Cyclodextrin Supramolecular Complex. J. Incl. Phenom. Macrocycl. Chem. 2013, 76, 151–158. [Google Scholar] [CrossRef]
- Wei, Y.; Kang, H.; Ren, Y.; Qin, G.; Shuang, S.; Dong, C. A Simple Method for the Determination of Enantiomeric Composition of Propranolol Enantiomers. Analyst 2013, 138, 107–110. [Google Scholar] [CrossRef]
- Wei, Y.; Wang, S.; Chao, J.; Wang, S.; Dong, C.; Shuang, S.; Paau, M.C.; Choi, M.M.F. An Evidence for the Chiral Discrimination of Naproxen Enantiomers: A Combined Experimental and Theoretical Study. J. Phys. Chem. C 2011, 115, 4033–4040. [Google Scholar] [CrossRef]
- Song, L.X.; Bai, L. Old Drugs, New Tricks: The Effect of Molecule—Ion Interactions on the Precipitation—Dissolution Equilibrium of Lithium Carbonate in Aqueous Solution and on the Chiral Recognition of Cyclodextrins to D-,L-Tryptophan. J. Phys. Chem. B 2009, 113, 11724–11731. [Google Scholar] [CrossRef] [PubMed]
- Marcelo, G.; de Francisco, R.; González-Álvarez, M.J.; Mendicuti, F. Fluorescence Properties of (R)- and (S)-[1,1′-Binaphthalene]-2,2′-Diols Solutions and Their Complexes with Cyclodextrins in Aqueous Medium. J. Photochem. Photobiol. A Chem. 2008, 200, 114–125. [Google Scholar] [CrossRef]
- Xu, Y.; McCarroll, M.E. Chiral Recognition of 1,1′-Binaphthyl-2,2′-Diyl Hydrogenphosphate Using Fluorescence Anisotropy. J. Photochem. Photobiol. A Chem. 2007, 187, 139–145. [Google Scholar] [CrossRef]
- Liu, Y.; Li, L.; Zhang, H.Y.; Fan, Z.; Guan, X.D. Selective Binding of Chiral Molecules of Cinchona Alkaloid by β- and γ-Cyclodextrins and Organoselenium-Bridged Bis(β-Cyclodextrin)s. Bioorg Chem. 2003, 31, 11–23. [Google Scholar] [CrossRef] [PubMed]
- Billiot, E.; Wang, J.; Warner, I.M. Improved Chiral Separation Using Achiral Modifiers in Cyclodextrin Modified Capillary Zone Electrophoresis. J. Chromatogr. A 1997, 773, 321–329. [Google Scholar] [CrossRef]
- Kano, K.; Tamiya, Y.; Otsuki, C.; Shimomura, T.; Ohno, T.; Hayashida, O.; Murakami, Y. Chiral Recognition by Cyclic Oligosaccharides. Enantioselective Complexation of Binaphthyl Derivatives with Cyclodextrins. Supramol. Chem. 1993, 2, 137–143. [Google Scholar] [CrossRef]
- Morin, N.; Guillaume, Y.C.; Rouland, J.-C. A Simple Model for RPLC Retention and Selectivity of Imidazole Enantiomers Using β-Cyclodextrin as Chiral Selector. Chromatographia 1998, 48, 388–394. [Google Scholar] [CrossRef]
- Szabó, Z.I.; Mohammadhassan, F.; Szőcs, L.; Nagy, J.; Komjáti, B.; Noszál, B.; Tóth, G. Stereoselective Interactions and Liquid Chromatographic Enantioseparation of Thalidomide on Cyclodextrin-Bonded Stationary Phases. J. Incl. Phenom. Macrocycl. Chem. 2016, 85, 227–236. [Google Scholar] [CrossRef]
- Ceborska, M.; Szwed, K.; Asztemborska, M.; Wszelaka-Rylik, M.; Kicińska, E.; Suwińska, K. Study of β-Cyclodextrin Inclusion Complexes with Volatile Molecules Geraniol and α-Terpineol Enantiomers in Solid State and in Solution. Chem. Phys. Lett. 2015, 641, 44–50. [Google Scholar] [CrossRef]
- Szwed, K.; Dawidowski, M.; Asztemborska, M. Enantiomeric Separation of Drugs Using Ion Interaction Reagents in Combination with β-Cyclodextrin in HPLC. Chromatographia 2013, 76, 467–474. [Google Scholar] [CrossRef]
- Shishovska, M.; Trajkovska, V. HPLC-Method for Determination of Permethrin Enantiomers Using Chiral b-Cyclodextrin-Based Stationary Phase. Chirality 2010, 22, 527–533. [Google Scholar] [CrossRef]
- Lipka, E.; Vaccher, M.P.; Fourmaintraux, E.; Bonte, J.P.; Vaccher, C. Chiral Separation and Determination of the Enantiomeric Purity of Tetrahydronaphthalenic Derivatives, Melatoninergic Ligands, by HPLC Using β-Cyclodextrins. Chromatographia 2003, 58, 665–670. [Google Scholar] [CrossRef]
- Reepmeyer, J.C. Separation of R- and S-Thalidomide by Reversed-Phase HPLC with β-Cyclodextrin in the Mobile Phase. Chirality 1996, 8, 11–17. [Google Scholar] [CrossRef]
- Takeuchi, T.; Miwa, T. Separation of Ferrocenylethanol Enantiomers by Microcolumn Liquid Chromatography with β-Cyclodextrin as Mobile Phase Additive. J. Chromatogr. A 1994, 666, 439–443. [Google Scholar] [CrossRef]
- Rekharsky, M.; Inoue, Y. Chiral Recognition Thermodynamics of β-Cyclodextrin: The Thermodynamic Origin of Enantioselectivity and the Enthalpy-Entropy Compensation Effect. J. Am. Chem. Soc. 2000, 122, 4418–4435. [Google Scholar] [CrossRef]
- Marconi, G.; Mezzina, E.; Manet, I.; Manoli, F.; Zambelli, B.; Monti, S. Stereoselective Interaction of Ketoprofen Enantiomers with β-Cyclodextrin: Ground State Binding and Photochemistry. Photochem. Photobiol. Sci. 2011, 10, 48–59. [Google Scholar] [CrossRef]
- Rekharsky, M.V.; Goldberg, R.N.; Schwarz, F.P.; Tewari, Y.B.; Ross, P.D.; Yamashoji, Y.; Inoue, Y. Thermodynamic and Nuclear Magnetic Resonance Study of the Interactions of α- and β-Cyclodextrin with Model Substances: Phenethylamine, Ephedrines, and Related Substances. J. Am. Chem. Soc. 1995, 117, 8830–8840. [Google Scholar] [CrossRef]
- Yamamura, H.; Rekharsky, M.V.; Ishihara, Y.; Kawai, M.; Inoue, Y. Factors Controlling the Complex Architecture of Native and Modified Cyclodextrins with Dipeptide (Z-Glu-Tyr) Studied by Microcalorimetry and NMR Spectroscopy: Critical Effects of Peripheral Bis-Trimethylamination and Cavity Size. J. Am. Chem. Soc. 2004, 126, 14224–14233. [Google Scholar] [CrossRef]
- Rekharsky, M.; Yamamura, H.; Kawai, M.; Inoue, Y. Critical Difference in Chiral Recognition of N-Cbz-d/l-Aspartic and -Glutamic Acids by Mono- and Bis(Trimethylammonio)-β-Cyclodextrins. J. Am. Chem. Soc. 2001, 123, 5360–5361. [Google Scholar] [CrossRef]
- Rekharsky, M.V.; Inoue, Y. Complexation and Chiral Recognition Thermodynamics of 6-Amino-6-Deoxy-β-Cyclodextrin with Anionic, Cationic, and Neutral Chiral Guests: Counterbalance between van Der Waals and Coulombic Interactions. J. Am. Chem. Soc. 2002, 124, 813–826. [Google Scholar] [CrossRef] [PubMed]
- Crupi, V.; Guella, G.; Majolino, D.; Mancini, I.; Rossi, B.; Stancanelli, R.; Venuti, V.; Verrocchio, P.; Viliani, G. A Phase Solubility Study on the Chiral Discrimination of Ibuprofen by β-Cyclodextrin Complexes. Food Biophys. 2011, 6, 267–273. [Google Scholar] [CrossRef]
- Stancanelli, R.; Crupi, V.; De Luca, L.; Ficarra, P.; Ficarra, R.; Gitto, R.; Guardo, M.; Iraci, N.; Majolino, D.; Tommasini, S.; et al. Improvement of Water Solubility of Non-Competitive AMPA Receptor Antagonists by Complexation with β-Cyclodextrin. Bioorg Med. Chem. 2008, 16, 8706–8712. [Google Scholar] [CrossRef] [PubMed]
- El-Arini, S.K.; Giron, D.; Leuenberger, H. Solubility Properties of Racemic Praziquantel and Its Enantiomers. Pharm. Dev. Technol. 1998, 3, 557–564. [Google Scholar] [CrossRef] [PubMed]
- Han, C.; Luo, J.; Xu, J.; Zhang, Y.; Zhao, Y.; Xu, X.; Kong, L. Enantioseparation of Aromatic α-Hydroxycarboxylic Acids: The Application of a Dinuclear Cu2(II)-β-Cyclodextrin Complex as a Chiral Selector in High Speed Counter-Current Chromatography Compared with Native β-Cyclodextrin. J. Chromatogr. A 2015, 1375, 82–91. [Google Scholar] [CrossRef]
- Sebestyén, Z.; Buvári-Barcza, Á.; Rohonczy, J. PH-Dependent Complex Formation of Amino Acids with β-Cyclodextrin and Quaternary Ammonium β-Cyclodextrin. J. Incl. Phenom. Macrocycl. Chem. 2012, 73, 199–210. [Google Scholar] [CrossRef]
- Ḱahle, C.; Holzgrabe, U. Determination of Binding Constants of Cyclodextrin Inclusion Complexes with Amino Acids and Dipeptides by Potentiometric Titration. Chirality 2004, 16, 509–515. [Google Scholar] [CrossRef]
- Skórka, M.; Asztemborska, M.; Zukowski, J. Thermodynamic Studies of Complexation and Enantiorecognition Processes of Monoterpenoids by α- and β-Cyclodextrin in Gas Chromatography. J. Chromatogr. A 2005, 1078, 136–143. [Google Scholar] [CrossRef]
- Xiao, Y.; Chung, T.S. Functionalization of Cellulose Dialysis Membranes for Chiral Separation Using Beta-Cyclodextrin Immobilization. J. Memb. Sci. 2007, 290, 78–85. [Google Scholar] [CrossRef]
- Thordarson, P. Binding Constants and Their Measurement. In Supramolecular Chemistry; Wiley: Hoboken, NJ, USA, 2012. [Google Scholar]
- Thordarson, P. Determining Association Constants from Titration Experiments in Supramolecular Chemistry. Chem. Soc. Rev. 2011, 40, 1305–1323. [Google Scholar] [CrossRef]
- WANG, R.; YU, Z. Validity and Reliability of Benesi-Hildebrand Method. Acta Phys.-Chim. Sin. 2007, 23, 1353–1359. [Google Scholar] [CrossRef]
- Tárkányi, G. Quantitative Approach for the Screening of Cyclodextrins by Nuclear Magnetic Resonance Spectroscopy in Support of Chiral Separations in Liquid Chromatography and Capillary Electrophoresis: Enantioseparation of Norgestrel with α-, β- and γ-Cyclodextrins. J. Chromatogr. A 2002, 961, 257–276. [Google Scholar] [CrossRef]
- Zhang, P.; He, Y.; Wang, S.; Shi, D.; Xu, Y.; Yang, F.; Wang, J.; He, L. Chiral Separation and Determination of Etoxazole Enantiomers in Vegetables by Normal-Phase and Reverse-Phase High Performance Liquid Chromatography. Molecules 2020, 25, 3134. [Google Scholar] [CrossRef] [PubMed]
- Harris, D.C. Quantitative Chemical Analysis, 7th ed.; W.H. Freeman and Co.: San Francisco, CA, USA, 2007; pp. 270–610. [Google Scholar]
- Chen, Z.; Weber, S.G. Determination of Binding Constants by Affinity Capillary Electrophoresis, Electrospray Ionization Mass Spectrometry and Phase-Distribution Methods. TrAC Trends Anal. Chem. 2008, 27, 738–748. [Google Scholar] [CrossRef] [PubMed]
- Servais, A.C.; Rousseau, A.; Fillet, M.; Lomsadze, K.; Salgado, A.; Crommen, J.; Chankvetadze, B. Capillary Electrophoretic and Nuclear Magnetic Resonance Studies on the Opposite Affinity Pattern of Propranolol Enantiomers towards Various Cyclodextrins. J. Sep. Sci. 2010, 33, 1617–1624. [Google Scholar] [CrossRef] [PubMed]
- Nikolic, K.; Ivković, B.; Bešović, Ž.; Marković, S.; Agbaba, D. A Validated Enantiospecific Method for Determination and Purity Assay of Clopridogrel. Chirality 2009, 21, 878–885. [Google Scholar] [CrossRef]
- Lamparczyk, H.; Zarzycki, P.K.; Nowakowska, J. Effect of Temperature on Separation of Norgestrel Enantiomers by High-Performance Liquid Chromatography. J. Chromatogr. A 1994, 668, 413–417. [Google Scholar] [CrossRef]
- Jin, X.; Kang, Q.; Wang, Y. Enantioseparation of Flavanoids, Isoxazolines, Dansyl Amino Acids and β-Blockers on Native and Phenylcarbamoylated α, β and γ-Cyclodextrin Chiral Stationary Phases. ChemistrySelect 2017, 2, 9992–9998. [Google Scholar] [CrossRef]
- Rahim, N.Y.; Tay, K.S.; Mohamad, S. Chromatographic and Spectroscopic Studies on β-Cyclodextrin Functionalized Ionic Liquid as Chiral Stationary Phase: Enantioseparation of NSAIDs. Adsorpt. Sci. Technol. 2018, 36, 130–148. [Google Scholar] [CrossRef]
- Mazurek, A.H.; Szeleszczuk, Ł.; Gubica, T. Application of Molecular Dynamics Simulations in the Analysis of Cyclodextrin Complexes. Int. J. Mol. Sci. 2021, 22, 9422. [Google Scholar] [CrossRef]
- Mazurek, A.H.; Szeleszczuk, Ł. Current Status of Quantum Chemical Studies of Cyclodextrin Host–Guest Complexes. Molecules 2022, 27, 3874. [Google Scholar] [CrossRef]
- Gitto, R.; Ficarra, R.; Stancanelli, R.; Guardo, M.; De Luca, L.; Barreca, M.L.; Pagano, B.; Rotondo, A.; Bruno, G.; Russo, E.; et al. Synthesis, Resolution, Stereochemistry, and Molecular Modeling of (R)- and (S)-2-Acetyl-1-(4′-Chlorophenyl)-6,7-Dimethoxy-1,2,3,4-Tetrahydroisoquinoline AMPAR Antagonists. Bioorg Med. Chem. 2007, 15, 5417–5423. [Google Scholar] [CrossRef]
- Jansook, P.; Ogawa, N.; Loftsson, T. Cyclodextrins: Structure, Physicochemical Properties and Pharmaceutical Applications. Int. J. Pharm. 2018, 535, 272–284. [Google Scholar] [CrossRef] [PubMed]
- Seidi, F.; Jin, Y.; Xiao, H. Polycyclodextrins: Synthesis, Functionalization, and Applications. Carbohydr. Polym. 2020, 242, 116277. [Google Scholar] [CrossRef] [PubMed]
- Cai, T.; Chen, B.; Han, J.; Kim, M.; Yeom, E.; Kim, K.C. Effect of Excitation Duration on Phosphorescence Decay and Analysis of Its Mechanisms. J. Lumin. 2022, 252, 119423. [Google Scholar] [CrossRef]
- Quang, C.; Khaledi, M.G. Improved Chiral Separations of Basic Compounds in Capillary Electrophoresis Using.Beta.-Cyclodextrin and Tetraalkylammonium Reagents. Anal. Chem. 1993, 65, 3354–3358. [Google Scholar] [CrossRef]
- Fanali, S. Separation of Optical Isomers by Capillary Zone Electrophoresis Based on Host-Guest Complexation with Cyclodextrins. J. Chromatogr. A 1989, 474, 441–446. [Google Scholar] [CrossRef]
- Wei, W.; Chu, Y.; Ding, C. Gas-Phase Binding of Noncovalent Complexes Between α-Cyclodextrin and Amino Acids Investigated by Mass Spectrometry. Anal. Lett. 2014, 47, 2221–2237. [Google Scholar] [CrossRef]


| Analytical Method | Principle | Time of Analysis | Complexity | Sensitivity | Destruction of the Sample | Spectrum of Compounds | Other Aspects, Requirements | Number of Works | Ref. |
|---|---|---|---|---|---|---|---|---|---|
| NMR Spectroscopy | Change in chemical shift upon binding | Moderate to long | High | Moderate | No | Very broad | Expensive deuterated solvents, maintenance of the spectrometer, Provide detailed information on the structure | 19 | [29,30,31,32,33,34,35,36,37,38,39,40,41,42,43,44,45,46,47] |
| Capillary Electrophoresis (CE) | Differences in electrophoretic mobility and interaction with capillary | Fast | Moderate | Very high | No | Polar compounds | Allows separation, Requires optimization of conditions | 16 | [48,49,50,51,52,53,54,55,56,57,58,59,60,61,62,63,64] |
| Fluorescence Spectroscopy (FS) and anisotropy | Emission of the light after excitation | Fast to moderate | Low to moderate | High | No | Fluorescent compounds | May require additional compounds | 10 | [65,66,67,68,69,70,71,72,73,74] |
| High-Performance Liquid Chromatography (HPLC) and Liquid Chromatography (LC) | Interaction with the stationary or/and mobile phases | Fast to moderate | Moderate to high | High | Yes | Very broad | Requires optimization of conditions, May require a column with β-CD bounded allows separation | 9 | [49,75,76,77,78,79,80,81,82] |
| Isothermal Titration Calorimetry (ITC) | Heat released/absorbed upon complexation | Fast | Moderate | High | No | Very broad | Allows direct determination of thermodynamic binding constant and ΔH, ΔS, | 8 | [50,59,83,84,85,86,87,88] |
| UV–vis Spectroscopy | Absorption of light in the UV–vis spectra | Fast | Low | Moderate | No | Broad, chromophores | Limited information on molecular interactions | 6 | [44,45,65,89,90,91] |
| Circular Dichroism (CD) Spectroscopy | Absorption of circularly polarized light | Fast to moderate | moderate | Moderate to low | No | Broad, optical active | Limited to chiral molecules | 5 | [44,45,74,84,92] |
| Potentiometry | Change in electrochemical potential | Fast to moderate | Low to moderate | Moderate | No | Ionic compounds | Requires calibration and standardization | 2 | [93,94] |
| Gas Chromatography (GC) | Interaction with the stationary phase, volatility | Fast to moderate | Moderate to high | High | Yes | Volatile compounds | Allows separation, Requires optimization of conditions | 1 | [95] |
| Ultrafiltration | Separation of molecules depending on the size | Fast to moderate | Low to moderate | Moderate | No | Large molecules | Simple method, Membrane selectivity | 1 | [96] |
| No. | Guest Molecule | Enantiomers | K [M−1] | ΔK [M−1] Binding Selectivity (α) * | Analytical Methods Used for the Determination of Binding Constant | Conditions (pH and Temp) at Which the Binding Constants Were Determined | STOICHIOMETRY of the Complex | Chiral Stationary Phase/β-CD Added to the Solution | Other Analytical Approaches, Molecular Modeling | Year | Ref. |
|---|---|---|---|---|---|---|---|---|---|---|---|
| 1. | Ketoprofen | (R)-(-)-ketoprofen (S)-(+)-ketoprofen | (R): 2750 (UV) (S): 1299 (UV) (R): 4088 (FLUO) (S): 2547 (FLUO) | ΔK = 1451 (UV) α = 2.12 (UV) ΔK = 1541(FLUO) α = 1.61 (FLUO) | UV, Fluorescence (Benesi–Hildebrand (BH) equation) | 303.15 K pH = 7 | 1:1 | Added to the solution | Raman, FTIR, TD | 2020 | [65] |
| 2. | Ephedrine | (1R,2S)-(-)-ephedrine (1S,2R)-(+)-ephedrine | (-): 35.7 (CE) (+): 34.2 (CE) (-): 37.4 (ITC) (+): 33.5 (ITC) | ΔK = 1.5 (CE) α = 1.04 (CE) ΔK = 3.9 (ITC) α = 1.12 (ITC) | CE (nonlinear regression) a ITC | 298.15 K pH = 3 | 1:1 | Added to the solution | TD | 2017 | [50] |
| 3. | Pseudoephedrine | (1S,2S)-(+)-pseudoephedrine (1R,2R)-(-)-pseudoephedrine | (+): 127.2 (-): 93.5 | ΔK = 33.7 α = 1.36 | CE | 298.15 K pH = 3 | 1:1 | Added to the solution | 2017 | [50] | |
| 4. | Methylephedrine | (1S,2R)- (+)-methylephedrine (1R,2S)-(-)-methylephedrine | (+): 96.8 (-): 94.6 | ΔK = 2.2 α = 1.02 | CE | 298.15 K pH = 3 | 1:1 | Added to the solution | 2017 | [50] | |
| 5. | Norephedrine | (1S,2R)- (+)-norephedrine (1R,2S)-(-)-norephedrine, | (+): 34.9 (-): 34.9 | ΔK = 0 α = 1.00 | CE | 298.15 K pH = 3 | 1:1 | Added to the solution | 2017 | [50] | |
| 6. | Tröger’s base (TB) | (-)Tröger’s base (+)Tröger’s base | (-): 303 ± 8 (+): 219 ± 8 | ΔK = 84 ± 11 α = 1.38 ± 0.06 | CE | 298.15 K pH = 2.5 | 1:1 | Added to the solution | NMR, X-ray | 2016 | [51] |
| 7. | Thalidomide (THA) | (R)-(+)-thalidomide (S)-(-)-thalidomide | (S): 91 (R): 83 | ΔK = 8 α = 1.10 | HPLC | 293.15 K pH = 5 | 1:1 | Stationary | NMR titration, TD, molecular modeling | 2016 | [76] |
| 8. | 9-[2-(phosphonomethoxy)propyl]adenine (PMPA) | (R)-PMPA (S)-PMPA | (R): 46.4 ± 4.8 (S): 41.5 ± 7.8 | ΔK = 4.9 ± 9.2 α = 1.12 ± 0.24 | CE (nonlinear regression) a | 298.15 K pH = 10 | 1:1 | Added to the solution | 2016 | [52] | |
| 9. | 9-[3-hydroxy-2-(phosphonomethoxy)propyl]adenine (HPMPA) | (R)-HPMPA (S)-HPMPA | (S): 27.0 ± 8.6 (R): 25.6 ± 8.5 | ΔK = 1.4 ± 12.1 α = 1.06 ± 0.50 | CE (nonlinear regression) a | 298.15 K pH = 10 | 1:1 | Added to the solution | 2016 | [52] | |
| 10. | 9-[2-(phosphonomethoxy)propyl]-2,6-diaminopurine (PMPDAP) | (R)-PMPDAP (S)-PMPDAP | (R): 21.7 ± 4.6 (S): 19.5 ± 4.1 | ΔK = 2.2 ± 6.1 α = 1.11 ± 0.33 | CE (nonlinear regression) a | 298.15 K pH = 10 | 1:1 | Added to the solution | 2016 | [52] | |
| 11. | (1-(1-(2,6-diamino-9H-purin-9-yl)-3-hydroxypropan-2-yl)-1,2,3-triazol-4-yl)phosphonic acid (ANP 4) | (R)-ANP 4 (S)-ANP 4 | (S): 13.7 ± 5.6 (R): 13.3 ± 3.3 | ΔK = 0.4 ± 6.5 α = 1.03 ± 0.49 | CE (nonlinear regression) a | 298.15 K pH = 10 | 1:1 | Added to the solution | 2016 | [52] | |
| 12. | 2-((diisopropoxyphosphoryl)methoxy)-3-(2,4-dioxo-3,4-dihydropyrimidin-1(2H)-yl)propanoic acid (ANP 5) | (R)-ANP 5 (S)-ANP 5 | (S): 37.8 ± 5.7 (R): 35.5 ± 5.6 | ΔK = 2.3 ± 8.0 α = 1.07 ± 0.23 | CE (nonlinear regression) a | 298.15 K pH = 10 | 1:1 | Added to the solution | 2016 | [52] | |
| 13. | α-cyclohexylmandelic acid (CHMA) | (-)-CHMA (+)-CHMA | (-): 30.52 (+): 17.47 | ΔK = 13.05 α = 1.75 | ICD | 283.15 K pH = 3.51 | 1:1 | Added to the solution | HSCCC, TD | 2015 | [92] |
| 14. | α-terpineol | (+)-α-terpineol (−)-α-terpineol | (+): 413 ± 10 (-): 399 ± 8 | ΔK = 14 ± 13 α = 1.04 ± 0.03 | HPLC | 298.15 K pH = 7 | 1:1 | Added to the solution | TG, X-ray, molecular modeling | 2015 | [77] |
| 15. | Paliperidone Propranolol Risperidone Verapamil | R-isomer S-isomer | Details can be found in Section 7.5. | Details can be found in Section 7.5. | CE (linear model, y- reciprocal equation) | 298 K pH = 2.5 and 7.0 | 1:1 | Added to the solution | NMR (only for risperidone) | 2013 | [53] |
| 16. | Cyclopentolate (CP) | (R)-cyclopentolate (S)-cyclopentolate | 204.2/138.6 | ΔK = 65.6 α = 1.47 | HPLC | 293.15 K pH = 2.5 | 1:1 | Added to the solution | 2013 | [78] | |
| 17. | 2,6-diketopiperazine derivative (2,6-DKP) | (R,R)-2.6-DKP (S,S)-2,6-DKP | 19.5/12.4 | ΔK = 7.1 α = 1.57 | HPLC | 293.15 K pH = 2.5 | 1:1 | Added to the solution | 2013 | [78] | |
| 18. | Methylphenobarbital (MPB) | (R)-MPB (S)-MPB | 171.3/149.7 | ΔK = 21.6 α = 1.14 | HPLC | 293.15 K pH = 2.5 | 1:1 | Added to the solution | 2013 | [78] | |
| 19. | 2-phenyl-2,3-dihydro- 4H-chromen-4-onen (FL) | (+)-flavanone (-)-flavanone | 222/184 | ΔK = 38 α = 1.21 | NMR | 298.15 K b pH = 7 | 1:1 | Added to the solution | TD | 2013 | [31] |
| 20. | (2-(2-hydroxyphenyl)-2,3-dihydro-4H-chromen-4-one (2′OHFL) | (+)-2′-hydroxyflavanone (-)-2′-hydroxyflavanone | NA c | NA c | NMR | 298.15 K b pH = 7 | 1:1 | Added to the solution | 2013 | [31] | |
| 21. | Naproxen | (R)-(-)-naproxen (S)-(+)-naproxen | (R): 897 ± 30 (S): 821 ± 25 (R) d: (8.02 ± 0.15) × 103 (S) d: (2.50 ± 0.06) × 103 | ΔK = 76 ± 39 α = 1.09 ± 0.05 ΔK d = (5.52 ± 0.16) × 103 A d = 3.21 ± 0.10 | RTP | 298.15 K pH = 2.78 | 1:1 1:1:1 d | Added to the solution | UV | 2013 | [66] |
| 22. | Propranolol | (R)-(+)-propranolol (S)-(-)-propranolol | (R): 924.84 (S): 877.94 (R) e: 6.44 × 10³ M−3 (S) e: 4.56 × 10³ M−3 | ΔK = 46.9 α = 1.05 ΔK e = 1.88 × 10³ α = 1.41 | RTP | 298.15 K pH = 3.0 | NP | Added to the solution | UV–vis, NMR, | 2013 | [67] |
| 23. | Series of amino acids: Phenylalanine (Phe) Tyrosine (Tyr) Tryptophan (Trp) Leucine (Leu) Asparagine (Asp) Glutamic acid (Glu) Histidine (His) Threonine (Thr) | L-amino acid D-amino acid | Details can be found in Section 7.7.7. | Details can be found in Section 7.7.7. | Potentiometry | 298.15 K pH range varied for each amino acid | 1:1 | Added to the solution | UV–vis, NMR | 2012 | [93] |
| 24. | 2-(4-hydroxyphenyl)-2,3-dihydro-4H-chromen-4-one (4′OHFL) | (+)-4′-hydroxyflavanone (-)-4′-hydroxyflavanone | 254/145 | ΔK = 109 α = 1.75 | NMR | 298.15 K b pH = 7 | 1:1 | Added to the solution | TD | 2012 | [32] |
| 25. | Sibutramine (SIB) | (R)-sibutramine (S)-sibutramine | (R): 228 ± 4 (S): 199 ± 4 | ΔK= 29 ± 5.7 α= 1.14 ± 0.03 | CE (linear model, x-reciprocal equation) | 298.15 K pH = 4.3 | 1:1 | Added to the solution | 2011 | [48] | |
| 26. | Naproxen | (R)-(-)-naproxen (S)-(+)-naproxen | (R): 502 (S): 566 (R) f: 2.43 × 10³ M−1 (S) f: 3.20 × 10³ M−2 | ΔK = 64 α = 1.13 ΔK = NA α = NA | RTP | 298.15 K pH = 3.0 | 1:1 1:1:1 f (R-enantiomer) 1:1:2 f (S-enantiomer) | Added to the solution | NMR, molecular modeling | 2011 | [68] |
| 27. | Ketoprofen | (R)-(-)-ketoprofen (S)-(+)-ketoprofen | (S): 1098.54 ± 175.36 (CD) (R): 758.58 ± 69.89 (CD) (S): 791 ± 19 (ITC) (R): 568 ± 8 (ITC) | ΔK = 339.96 ± 188.77 (CD) α = 1.45 ± 0.27 (CD) ΔK = 223 (ITC) α = 1.39 ± 0.04 (ITC) | CD ITC | 298.15 K pH = 7.4 | 1:1 | Added to the solution | NMR, ROESY, molecular modeling, photolysis, ESI-MS | 2011 | [84] |
| 28. | Ibuprofen | (R)-(-)-ibuprofen (S)-(+)-ibuprofen | (R): 2100 (S): 2040 | ΔK = 60 α = 1.03 | UV (linear regression) | 298.15 K pH = NP | 1:1 | Added to the solution | NMR | 2011 | [89] |
| 29. | Ala-Phe | D-Ala-D-Phe L-Ala-L-Phe | DD(+) l:80 ± 13 LL(+) l: 48 ± 8 DD(±) l:24 ± 3 LL(±) l:19 ± 2 | ΔK(+) l = 32 ± 15.2 α(+) l = 1.67 ± 0.39 ΔK(±) l = 5 ± 3.6 α(±) l = 1.26 ± 0.21 | ITC | 298.15 K pH = 2.2 and 3.8 | 1:1 | Added to the solution | CE, TD | 2010 | [59] |
| 30. | Ala-Tyr | D-Ala-D-Tyr L-Ala-L-Tyr | DD(+) l:76 ± 9 LL(+) l:48 ± 8 DD(±) l:52 ± 9 LL(±) l:39 ± 7 | ΔK(+) l = 28 ± 12.0 α(+) l = 1.58 ± 0.32 ΔK(±) l = 13 ± 11.1 α(±) l = 1.33 ± 0.33 | ITC | 298.15 K pH = 2.2 and 3.8 | 1:1 | Added to the solution | CE, TD | 2010 | [59] |
| 31. | Permethrin | 1R-cis-permethrin 1S-cis-permethrin | 179.14 g/160.70 | ΔK = 18.44 α = 1.12 | HPLC | 298 K pH = NP | NP | Stationary | TD | 2010 | [79] |
| 32. | Permethrin | 1R-trans-permethrin 1S-trans-permethrin | 92.18 g/79.65 | ΔK = 12.53 α = 1.16 | HPLC | 298 K pH = NP | NP | Stationary | TD | 2010 | [79] |
| 33. | Brompheniramine | (+)-brompheniramine (-)-brompheniramine | (+): 192.2 k (HPLC) (-): 183 ± 9 (HPLC) (+): 146.6 k (CE) (-): 137 ± 0.5 (CE) | ΔK = 9.2 (HPLC) α = 1.05 (HPLC) ΔK = 9.6 (CE) α = 1.07 (CE) | HPLC CE | 298 K pH = 7 (HPLC) and pH = 2.5 (CE) | 1:1 | Added to the solution | 2009 | [49] | |
| 34. | Cyclopentolate | (+)-cyclopentolate (-)-cyclopentolate | 268.7 k/202 ± 7 (HPLC) 1367.5 k/ 1036 ± 22 (CE) | ΔK = 66.7 (HPLC) α = 1.33 (HPLC) ΔK = 331.5 (CE) α = 1.32 (CE) | HPLC CE | 296–298 K pH = 7 (HPLC) and pH = 2.5 (CE) | 1:1 | Added to the solution | 2009 | [49] | |
| 35. | Tryptophan (Trp) | D-tryptophan L-tryptophan | L: 297.3 D: 112.9 | ΔK = 184.4 α = 2.63 | FS | 298.2 K pH = 10.4 | 1:1 | Added to the solution | ESI-MS | 2009 | [69] |
| 36. | 1,1′-binaphthol (BINOL) | (R)-1,1′-binaphthol (S)-1,1′-binaphthol | R: 404 ± 98 (298.15 K) S: 352 ± 49 (298.15 K) | ΔK = 52 ± 110 α = 1.15 ± 0.32 | FS (non-linear) a | 278.15–318.15 K pH = NP | 1:1 | Added to the solution | TD, molecular modeling | 2008 | [70] |
| 37. | Promethazine hydrochloride (PTZ) | (R)-promethazine (S)-promethazine | (2.4 ± 0.4) × 103/(1.3 ± 0.1) × 103 | ΔK = (1.1 ± 0.4) × 103 α = 1.85 ± 0.34 | NMR | 298 K pH = NP | 1:1 | Added to the solution | Fluorescence, UV, molecular modeling | 2008 | [33] |
| 38. | 2-acetyl-1-(4′-chlorophenyl)-6,7-dimethoxy-1,2,3,4-tetrahydroisoquinoline (AA) | (R)-AA (S)-AA | (R): 15,889 (S): - | ΔK = NA α = NA | UV–vis phase solubility diagram | 298.15 K pH = NP | 1:1 | Added to the solution | FTIR-ATR, molecular modeling | 2008 | [90] |
| 39. | 1,1′-binaphthyl-2,2′-diyl hydrogen phosphate (BNP) | (S)-BNP (R)-BNP | (S): 369.6 (R): 230.2 | ΔK = 139.4 α = 1.61 | FS | T = 298 K pH = 6.9 | 1:1 | Added to the solution | TD | 2007 | [71] |
| 40. | Bifonazole | (R)-bifonazole (S)-bifonazole | 2767 ± 552/2767 ± 552 | ΔK = 0 ± 781 α = 1.00 + 0.28 | CE (γ-reciprocal equation) | T = 288.15 pH = 3.0 | 1:1 | Added to the solution | 2007 | [54] | |
| 41. | Miconazole | (R)-miconazole (S)-miconazole | 932 ± 120/749 ± 91 | ΔK = 183 ± 151 α = 1.24 ± 0.22 | CE (γ-reciprocal equation) | T = 288.15 pH = 3.0 | 1:1 | Added to the solution | 2007 | [54] | |
| 42. | Econazole | (R)-econazole (S)-econazole | 737 ± 121/622 ± 97 | ΔK = 115 ± 155 α = 1.19 ± 0.27 | CE (γ-reciprocal equation) | T = 288.15 pH = 3.0 | 1:1 | Added to the solution | 2007 | [54] | |
| 43. | Sulconazole | (R)-sulconazole (S)-sulconazole | 2394 ± 640/2357 ± 611 | ΔK = 37 ± 886 α = 1.02 ± 0.38 | CE (γ-reciprocal equation) | 288.15 K pH = 3.0 | 1:1 | Added to the solution | 2007 | [54] | |
| 44. | Tryptophan (Trp) | L-Trp D-Trp | L: 4.3 × 10⁻⁵ D: 3.1 × 10⁻⁵ | ΔK = 1.2 × 10⁻⁵ α = 1.39 | ultrafiltration | 298.15 K pH = 6.0 | NP | Stationary | UV–vis | 2007 | [96] |
| 45. | Citalopram (CT) | (R)-citalopram (S)-citalopram | R: 418 S: NP | ΔK = NA α = NA | NMR | 298.15 K pH = 7.0 | 1:1 | Added to the solution | ROESY | 2007 | [34] |
| 46. | 6-[imidazol-1-yl(phenyl)methyl]-3-methyl-1,3-benzothiazol-2-one [IB] | (R)-(+)-IB (S)-(-)-IB | R: 215–242 h S: 154–185 h | ΔK = 56–85 h α = 1.3–1.54 h | NMR | 298 K pH = 2.5 | 1:1 | Added to the solution | ROESY, ESI-MS | 2006 | [35] |
| 47. | Alprenolol Isoproterenol Isoxsuprine Metaproterenol Methoxamine Nadolol Pindolol Propranolol Ritodrine Terbutaline | (R)-isomer (S)-isomer | Details can be found in Section 7.4. | Details can be found in Section 7.4. | CE | T- 288.15–303.15 K pH = 2.5 | 1:1 | Stationary | 2006 | [55] | |
| 48. | Isomenthone | (+)-isomenthone (−)-isomenthone | (+)I: 6.9 i (−)I: 7.4 i (+)II: 15 i (−)II: 13 i | ΔKI = −0.5 i αI = 0.93 ΔKII = 2 i αII = 1.22 αIαII = 1.14 | GLC | T = 333 K pH = NP | 1:1 1:2 | Stationary Stationary+Added to the solution | TD | 2005 | [95] |
| 49. | Fenchone | (-)-fenchone (+)-fenchone | (-)I: 9.9 i (+)I: 12 i (-)II: 57 i (+)II: 44 i | ΔKI = −2.1 i αI=0.85 ΔKII = 13 i αII = 1.29 αI * αII = 1.09 | GLC | T = 333 K pH = NP | 1:1 1:2 | Stationary Stationary+ added to the solution | TD | 2005 | [95] |
| 50. | 6-[imidazol-1-yl(phenyl)methyl]-3-methyl-1,3-benzothiazol-2-one [IB] | (R)-(+)-IB (S)-(-)-IB | R: 322 S: 281 | ΔK = 41 α = 1.15 | CE | 298 K pH = 2.5 | 1:1 | Added to the solution | HPLC | 2004 | [56] |
| 51. | Noradrenaline | (S)-(+)- noradrenaline (R)-(-)- noradrenaline | S: 537 R: 516 | ΔK = 21 α = 1.04 | NMR | T = 298.15 K pH = 7.0 | 1:1 | Added to the solution | ROESY | 2004 | [36] |
| 52. | Amino acids: Alanine, Valine, Norvaline, Histidine, Isoleucine | D-isomer L-isomer | D: - L: - | ΔK = NA α = NA | Potentiometry | 298.15 K pH = 4–8 and pH > 11 | 1:1 | Added to the solution | 2004 | [94] | |
| 53. | Ala-Phe | L-Ala-L-Phe D-Ala-D-Phe | LL(-) l: 403 ± 46 DD(-) l: 135 ± 51 LL(±) l: 274 ± 35 DD(±) l: 105 ± 45 | ΔK(+) l = 268 ± 68.7 α(+) l = 2.98 ± 1.17 ΔK(±) l = 169 ± 57.0 α(±) l = 2.61 ± 1.17 | Potentiometry | 298.15 K pH = 4–8 and pH > 11 | 1:1 | Added to the solution | 2004 | [94] | |
| 54. | Tryptophan (Trp) | L-Trp D-Trp | LL(-) l: 571 ± 102 DD(-) l: 140 ± 18 LL(±) l:447 ± 83 DD(±) l: 88 ± 17 | ΔK(+) l = 431 ± 103.6 α(+) l = 4.08 ± 0.90 ΔK(±) l = 359 ± 84.74 α(±) l = 5.08 ± 1.36 | Potentiometry | 298.15 K pH = 4–8 and pH > 11 | 1:1 | Added to the solution | 2004 | [94] | |
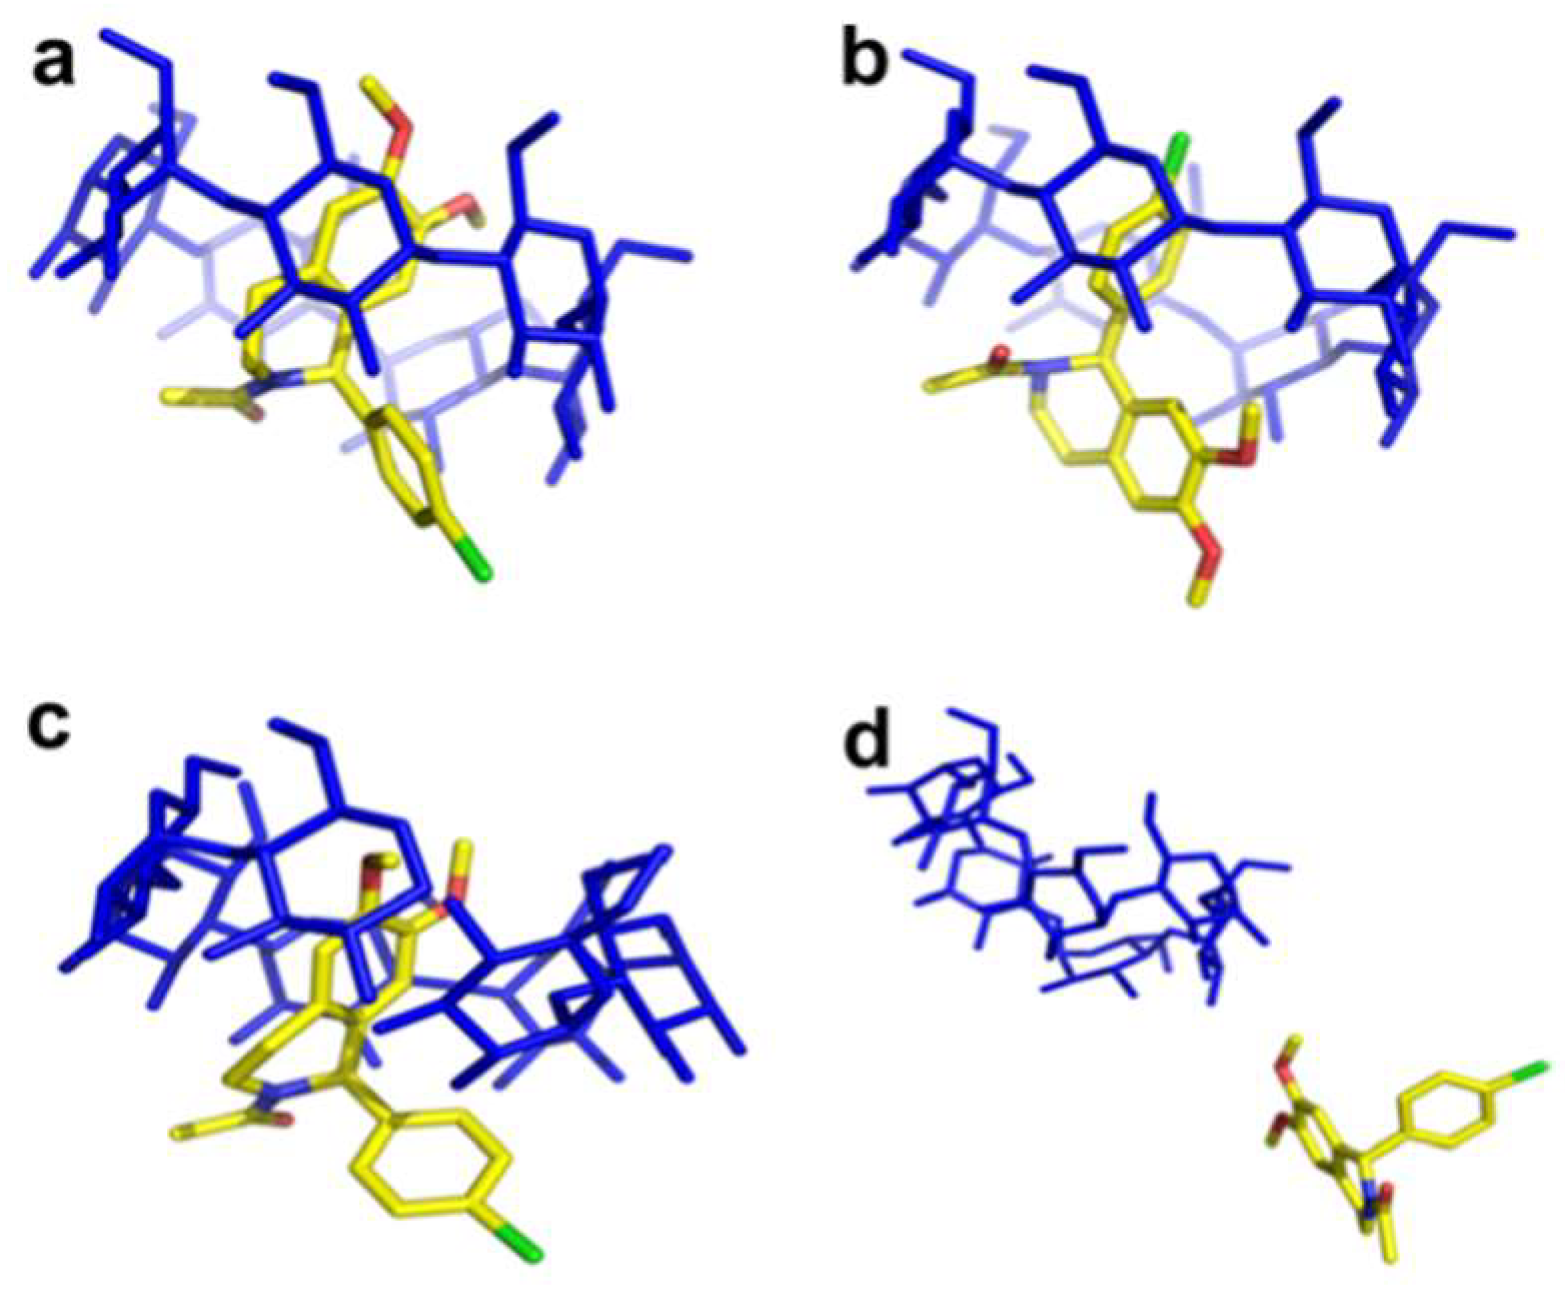
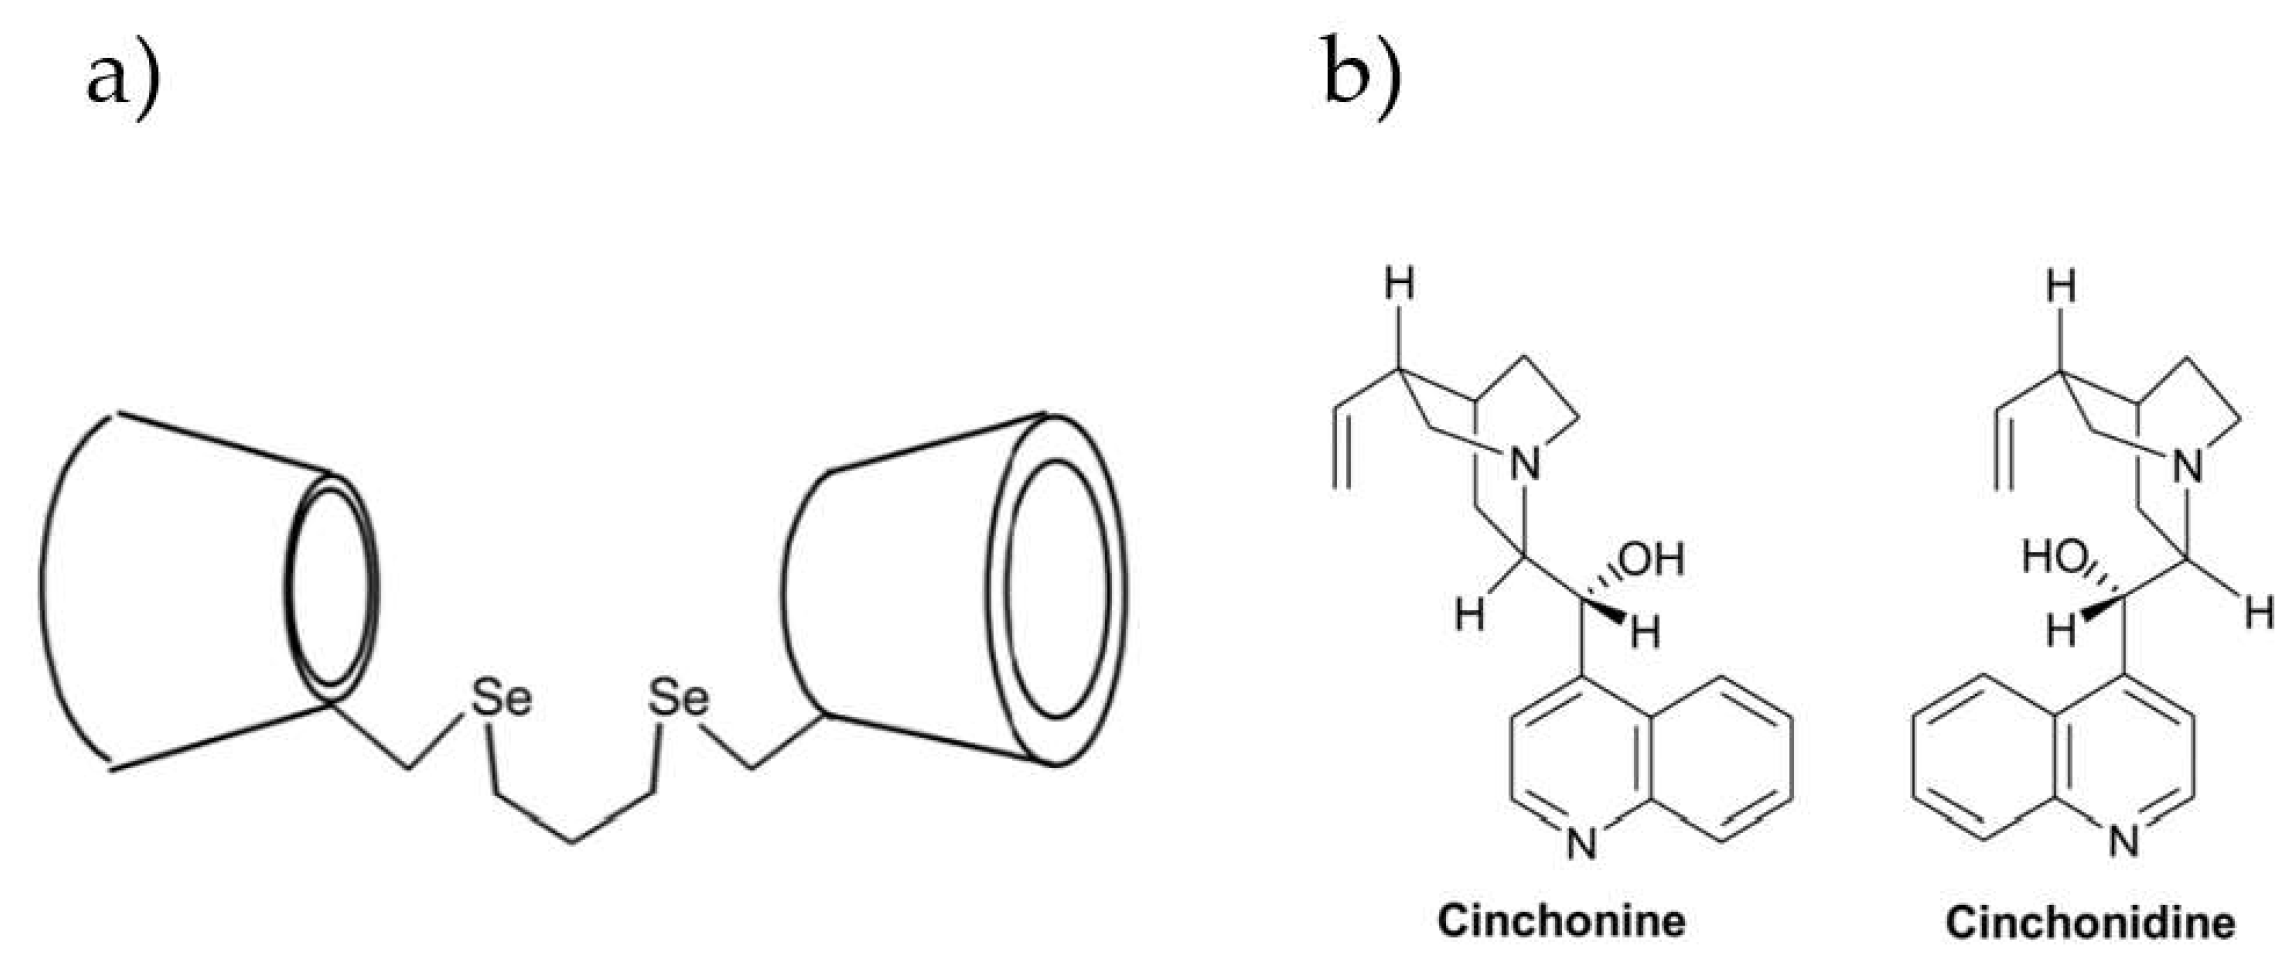
| 55. | Cinchonan-9-ol | Cinchonine ((9S)-Cinchonan-9-ol) Cinchonidine ((9R)-Cinchonan-9-ol) | S: 117 R: 108 | ΔK = 9 α = 1.08 | FS | T = 298.15 K pH = 7.2 | 1:1 | Added to the solution | TD, NOESY | 2003 | [72] |
| 56. | Melatonine | (+)-melatonin (-)-melatonin | (+): 91.86 (-): 79.68 | ΔK = 12.18 α = 1.15 | HPLC | NP | 1:1 | Added to the solution | TD | 2003 | [80] |
| 57. | N-[2-(5-methoxy-1H-indol-3-yl)ethyl]cyclopropanecarboxamide | (+)-isomer (-)-isomer | (+): 115.50 (-): 100.42 | ΔK = 15.08 α = 1.15 | HPLC | NP | 1:1 | Added to the solution | TD | 2003 | [80] |
| 58. | N-[2-(5-fluoro-1H-indol-3-yl)ethyl]acetamide | (+)-isomer (-)-isomer | (+): 158.77 (-): 143.37 | ΔK = 15.4 α = 1.11 | HPLC | NP | 1:1 | Added to the solution | TD | 2003 | [80] |
| 59. | 3-Hydroxy-2,2-dimethylcyclohexan-1-one | (-)-isomer (+)-isomer | (-): 350 ± 24 (+): 320 ± 20 | ΔK = 30 ± 31 α = 1.09 | NMR | 303 ± 0.1 K pH = NP | 1:1 | Added to the solution | HR-DOSY, HPLC, ROESY, GC, GC-MS | 2002 | [30] |
| 60. | 3-Acetoxy-2,2-dimethylcyclohexan-1-one | (+)-isomer (-)-isomer | (+): 1010 ± 310 (-): 770 ± 100 | ΔK = 240 ± 326 α = 1.31 | NMR | 303 ± 0.1 K pH = NP | 1:1 | Added to the solution | HR-DOSY, HPLC, ROESY, GC, GC-MS | 2002 | [30] |
| 61. | 3-Hydroxy-2-methyl-2-(2-propynyl) cyclohexan-1-one | (-)-isomer (+)-isomer | (-): 1225 ± 118 (+): 980 ± 90 | ΔK = 245 α = 1.25 | NMR | 303 ± 0.1 K pH = NP | 1:1 | Added to the solution | HR-DOSY, HPLC, ROESY, GC, GC-MS | 2002 | [30] |
| 62. | Z-Glu | L-Glu D-Glu | L: 86 ± 2 D: 84 ± 2 | ΔK = 2 ± 2.83 α = 1.02 ± 0.03 | ITC | 298.15 K pH = 6.9 | 1:1 | Added to the solution | TD | 2001 | [87] |
| 63. | Dimethindene (DIM) | (R)-(-)-DIM (S)-(+)-DIM | R: 504 S: 457 | ΔK = 47 α = 1.10 | NMR | T = NP pH = 3.0 | 1:1 | Added to the solution | ROESY, ESI-MS, CE, X-ray | 2000 | [37] |
| 64. | Ethyl-phenylsulfoxide | (+)-ethyl-phenylsulfoxide (-)-ethyl-phenylsulfoxide | (+): 256.4 (-): 210.2 | ΔK = 46.2 α = 1.22 | NMR | 303 ± 0.1 K pH = NP | 1:1 | Added to the solution | HPLC, HR-DOSY, ROESY, | 2000 | [38] |
| 65. | N-acetyl- phenylalanine | N-acetyl-L-Phe N-acetyl-D-Phe | L: 67.5 ± 1.4 D: 60.7 ± 1.3 | ΔK = 6.8 ± 1.9 α = 1.11 ± 0.03 | ITC | 298.15 K pH = 6.9 | 1:1 | Added to the solution | TD | 2000 | [83] |
| 66. | N-acetyl-tryptophan | N-acetyl-L-Trp N-acetyl-D-Trp | L: 17.1 ± 0.5 D: 12.7 ± 0.5 | ΔK = 4.4 ± 0.7 α = 1.35 ± 0.07 | ITC | 298.15 K pH = 6.9 | 1:1 | Added to the solution | TD | 2000 | [83] |
| 67. | N-acetyl-tyrosine | N-acetyl-L-Tyr N-acetyl-D-Tyr | L: 130 ± 2 D: 125 ± 2 | ΔK = 5 ± 2.83 α = 1.04 ± 0.02 | ITC | 298.15 K pH = 6.9 | 1:1 | Added to the solution | TD | 2000 | [83] |
| 68. | 1-cyclohexyl ethylamine | (R)-1-cyclohexyl ethylamine (S)-1-cyclohexyl ethylamine | (R): 329 ± 3 (S): 328 ± 3 | ΔK = 1.0 ± 4.2 α = 1.00 ± 0.01 | ITC | 298.15 K pH = 6.9 | 1:1 | Added to the solution | TD | 2000 | [83] |
| 69. | N,N-dimethyl-1- ferrocenylethylamine | (S)-N,N-dimethyl-1- ferrocenylethylamine (R)-N,N-dimethyl-1- ferrocenylethylamine | (S): 6700 ± 500 (R): 5600 ± 300 | ΔK = 1100 ± 583 α = 1.20 ± 0.11 | ITC | 298.15 K pH = 4.8 | 1:1 | Added to the solution | TD | 2000 | [83] |
| 70. | 2-phenylbutyric acid | (S)-2-phenylbutyric acid (R)-2-phenylbutyric acid | (S): 95 ± 2 (R): 94 ± 2 | ΔK = 1.0 ± 2.8 α = 1.01 ± 0.03 | ITC | 298.15 K pH = 6.9 | 1:1 | Added to the solution | TD | 2000 | [83] |
| 71. | 3-phenylbutyric acid | (S)-3-phenylbutyric acid (R)-3-phenylbutyric acid | (S): 430 ± 4 (R): 402 ± 4 | ΔK = 28 ± 6 α = 1.07 ± 0.01 | ITC | 298.15 K pH = 6.9 | 1:1 | Added to the solution | TD | 2000 | [83] |
| 72. | propranolol | (S)-propranolol (R)-propranolol | (S): 117 ± 10 (R): 115 ± 10 | ΔK = 2 ± 14 α = 1.02 ± 0.12 | ITC | 298.15 K pH = 4.8 | 1:1 | Added to the solution | TD | 2000 | [83] |
| 73. | Mandelic acid | (R)- mandelic acid (S)- mandelic acid | (R): 811 (S): 178 | ΔK = 633 α = 4.56 | NMR | 303 ± 0.1 K pH = NP | 1:1 | Added to the solution | ROESY, molecular modeling | 2000 | [39] |
| 74. | Hexahydromandelic acid | (R)-hexahydromandelic acid (S)- hexahydromandelic acid | (R): 3812 (S): 1040 | ΔK = 2772 α = 3.65 | NMR | 303 ± 0.1 K pH = NP | 1:1 | Added to the solution | ROESY, molecular modeling | 2000 | [39] |
| 75. | Brompheniramine (BrPh) | (+)-BrPh (-)-BrPh | (+): 822.7 (-): 798.5 | ΔK = 24.2 α = 1.03 | NMR | T = NP pH = 3.0 | 1:1 | Added to the solution | ROESY, CE, UV–vis, ESI-MS, X-ray | 2000 | [40] |
| 76. | Carvone (Crv) | (S)-(+)-carvone (R)-(-)-carvone | (S): 13.3 (R): 6.8 | ΔK = 6.5 α = 1.96 | NMR | T = 286 K pH = 7.0 | 1:1 | Added to the solution | TD, molecular modeling | 1999 | [41] |
| 77. | Verapamil (VP) | (+)-VP (-)-VP | (+): 272 ± 34 (-): 207 ± 59 | ΔK = 65 ± 68 α = 1.30 | NMR | NP | 1:1 | Added to the solution | CE, ESI-MS | 1999 | [42] |
| 78. | Ketoconazole (KC) | (+)-KC (-)-KC | (+): 1146 ± 163 j (-): 750 ± 39 j | ΔK = 396 ± 168 α = 1.53 ± 0.23 | NMR | 298 K pH = NP | 1:1:1 j | Added to the solution | API-MS, ROESY, molecular modeling | 1999 | [43] |
| 79. | Ala-Phe | L-Ala-L-Phe D-Ala-D-Phe | LL: 14–40 DD: 12–42 | ΔK = 2–5 α = 1.17–1 | CE | 298 K pH = 1.8–3.5 | 1:1 | Added to the solution | 1999 | [60] | |
| 80. | Praziquantel (PZQ) | (+)-PZQ (-)-PZQ | (+): 335 (-): 224 | ΔK = 111 α = 1.50 | UV–vis phase solubility diagram | T = 310 ± 1 K pH = 7.0 | 1:1 | Added to the solution | UV, DSC, X-ray, IR, API-MS | 1998 | [91] |
| 81. | Bifonazole | S-bifonazole R-bifonazole | (S): 376–484 (R): 273–323 | ΔK = 103–161 α = 1.38–1.50 | RPLC | T = 293 and 278 K pH = 3.0 | 1:1 | Added to the solution | TD | 1998 | [75] |
| 82. | Econazole | S-econazole R-econazole | (S): 229–275 (R): 168–213 | ΔK = 61–62 α = 1.36–1.29 | RPLC | T = 293 and 278 K pH = 3.0 | 1:1 | Added to the solution | TD | 1998 | [75] |
| 83. | Sulconazole | S-sulconazole R-sulconazole | (S): 297–348 (R): 256–299 | ΔK = 41–49 α = 1.16 | RPLC | T = 293 and 278 K pH = 3.0 | 1:1 | Added to the solution | TD | 1998 | [75] |
| 84. | Miconazole | S-miconazole R-miconazole | (S): 57–68 (R): 38–45 | ΔK = 19–23 α = 1.5 | RPLC | T = 293 and 278 K pH = 3.0 | 1:1 | Added to the solution | TD | 1998 | [75] |
| 85. | Zileuton | (+)-zileuton (-)-zileuton | (+): 5752 ± 246 (NMR) (-): 5436 ± 735 (NMR) (+): 5866 ± 738 (UV) (-): 5686 ± 216 (UV) (+): 5071 ± 182 (CD) (-): 4508 ± 218 (CD) | ΔK = 316 ± 775 (NMR) α = 1.06 ± 0.15 (NMR) ΔK = 180 ± 769 (UV) α = 1.03 ± 0.14 (UV) ΔK = 563 ± 283.9 (CD) α = 1.13 ± 0.07 (CD) | NMR UV CD | T = 298 ± 1 K pH = NP | 1:1 | Added to the solution | ROESY | 1998 | [44] |
| 86. | Propranolol | (S)-propranolol (R)-propranolol | S: 166 ± 13 R: 138 ± 26 | ΔK = 28 ± 29 α = 1.20 ± 0.24 | FS | T = NP pH = 2.5 | 1:1 | Added to the solution | CE | 1997 | [73] |
| 87. | Metomidate (MET) | (+)-MET (-)-MET | 655/483 | ΔK = 172 α = 1.36 | NMR | T = NP pH = 3.5 | 1:1 | Added to the solution | CE | 1996 | [29] |
| 88. | Mianserin | (R)- mianserin (S)- mianserin | (2.59 ± 0.73)×102/(1.35 ± 0.51)×102 | ΔK = (1.24 ± 0.89)×102 α = 1.92 ± 0.90 | CE | T = 298.15 K pH = 3.2 | 1:1 | Added to the solution | 1996 | [57] | |
| 89. | Trimipramine | (R)- trimipramine (S)- trimipramine | (7.20 ± 2.40)×103/(5.02 ± 1.33)×103 | ΔK = (2.18 ± 2.74) × 103 α = 1.44 ± 0.61 | CE | T = 298.15 K pH = 3.2 | 1:1 | Added to the solution | 1996 | [57] | |
| 90. | Thioridazine | (R)- thioridazine (S)- thioridazine | (3.54 ± 3.02)×104/(2.91 ± 1.43)×104 | ΔK = (6.30 ± 33.4)×103 α = 1.22 ± 1.20 | CE | T = 298.15 K pH = 3.2 | 1:1 | Added to the solution | 1996 | [57] | |
| 91. | Thalidomide (THA) | (S)-(-)-thalidomide (R)-(+)-thalidomide | (S): 76 (R): 64 | ΔK = 12 α = 1.19 | HPLC | T = NP pH = 4 | 1:1 | Added to the solution | 1996 | [81] | |
| 92. | Ephedrine | (1R,2S)-(-)-ephedrine (1S,2R)-(+)-ephedrine | (-): 79.2 ± 1.6 (+): 71.3 ± 1.2 | ΔK = 7.9 ± 2.0 α = 1.11 ± 0.02 | ITC | 298.15 K pH = 5 | 1:1 | Added to the solution | TD, NMR | 1995 | [85] |
| 93. | Pseudoephedrine | (1S,2S)-(+)-pseudoephedrine (1R,2R)-(-)-pseudoephedrine | (+): 96.7 ± 1.0 (-): 68.9 ± 0.8 | ΔK = 27.8 ± 1.28 α = 1.40 ± 0.02 | ITC | 298.15 K pH = 6.9 | 1:1 | Added to the solution | TD, NMR | 1995 | [85] |
| 94. | 5-methoxy-3-(di-n-propylamino)chroman (5-MeO-DPAC) | (S)- 5-MeO-DPAC (R)- 5-MeO-DPAC | (S): 72 (R): 58 | ΔK = 14 α = 1.24 | CE | 298.15 K pH = 7.0 | 1:1 | Added to the solution | 1995 | [58] | |
| 95. | 5-hydroxy-3-(di-n-propylamino)chroman (5-OH-DPAC) | (S)- 5-OH-DPAC (R)- 5-OH-DPAC | (S): 166 (R): 138 | ΔK = 28 A = 1.20 | CE | 298.15 K pH = 7.0 | 1:1 | Added to the solution | 1995 | [58] | |
| 96. | 1-ferrocenylethanol (FET) | (+)-FET (-)-FET | (+): 1.26 × 10³ (-): 1.17 × 10³ | ΔK = 0.09 × 10³ α = 1.08 | Microcolumn LC | 293 K pH = NP | 1:1 | Added to the solution | 1994 | [82] | |
| 97. | Dansylated-glutamate (Dns-Glu) | D-Dns-Glu L-Dns-Glu | D: 220 ± 4 L: 187 ± 4 | ΔK = 32 ± 5.7 α = 1.18 ± 0.03 | CE | 298.15 K pH = 6.8 | 1:1 | Added to the solution | HPLC | 1994 | [62] |
| 98. | Dansylated-leucine (Dns-Leu) | D-Dns-Leu L-Dns-Leu | D: 170 ± 4 L: 141 ± 4 | ΔK = 29 ± 5.7 α = 1.21 ± 0.04 | CE | 298.15 K pH = 6.8 | 1:1 | Added to the solution | HPLC | 1994 | [62] |
| 99. | Tioconazole | (+)-tioconazole (-)-tioconazole | (+) m: (1.63–0.26) × 103 (-) m: (1.34–0.23) × 103 | ΔK m = 285–50 α m = 1.25–1.19 | CE | 298.15 K pH = 4.3 | 1:1 | Added to the solution | NMR, TD | 1994 | [61] |
| 100. | 1,1′-binaphthol (BINOL) | (S)-1,1′-binaphthol (R)-1,1′-binaphthol | (S): 245 ± 4 (R): 176 ± 25 | ΔK = 69 ± 25 α = 1.39 ± 0.2 | FS | 298.15 K pH = 5.5 | 1:1 | Added to the solution | NMR, molecular modeling, CE, CD | 1993 | [74] |
| 101. | 1,1′-binaphthyl-2,2′-diyl hydrogen phosphate (BNP) | (S)-BNP (R)-BNP | (S): 542 ± 30 (R): 188 ± 20 | ΔK = 354 ± 36 α = 2.88 ± 0.34 | CD | 298.15 K pH = 5.5 | 1:1 | Added to the solution | FS, NMR, molecular modeling, CE | 1993 | [74] |
| 102. | Dinitrophenyl (DNP)- amino acids: DNP-valine, DNP-leucine, DNP-methionine | D-isomer L-isomer | Details can be found in Section 7.7.7. | Details can be found in Section 7.7.7. | UV–vis CD NMR | 273.15–298.15 K pH = 6.0 (UV–vis, CD) and pD = 11.0 (NMR) | 1:1 (D-isomer); association of 1:1 complexes (L-isomer) | Added to the solution | 1992 | [45] |
| M−1 | CP | 2,6-DKP | MPB | |||
|---|---|---|---|---|---|---|
| β-CD | 204.2 | 138.6 | 19.5 | 12.4 | 171.3 | 149.7 |
| β-CD and C4 | 2.147 × 10⁵ | 1.493 × 10⁵ | 1.240 × 10⁵ | 9.688 × 10⁵ | 1.423 × 10⁵ | 1.256 × 10⁵ |
| β-CD and C8 | 7.391 × 10⁵ | 5.657 × 10⁵ | 0.549 × 10⁵ | 0.336 × 10⁵ | 0.910 × 10⁵ | 0.761 × 10⁵ |
| β-CD and C12 | - | - | 0.399 × 10⁵ | 0.251 × 10⁵ | 0.484 × 10⁵ | 0.413 × 10⁵ |
| Chiral Drug | Buffer (mM) | T (°C) | [β-CD] (mM) | Modifier/Additive | K1 [M−1] | K2 [M−1] | ΔK [M−1] (α) α = KH/KL | [β-CD]opt (mM) |
|---|---|---|---|---|---|---|---|---|
| Alprenolol | 200 | 15 | 20 | 5% MeOH + 1% TEA | 88.52 | 90.84 | ΔK = 2.32 α = 1.03 | 11.15 |
| Isoproterenol | 100 | 20 | 50 | 1% TEA | 7.31 | 11.89 | ΔK = 4.58 α = 1.63 | 107.3 |
| Isoxsuprine | 100 | 30 | 15 | 0 | 57.73 | 58.72 | ΔK = 0.99 α = 1.02 | 17.18 |
| Metaproterenol | 75 | 30 | 20 | 0 | 35.05 | 37.52 | ΔK = 2.47 α = 1.07 | 27.58 |
| Methoxamine | 75 | 30 | 20 | 0 | 41.63 | 44.6 | ΔK=2.97 α=1.07 | 23.21 |
| Nadolol | 100 | 15 | 50 | 0 | 11.38 | 11.65 | ΔK = 0.27 α = 1.02 | 86.84 |
| Pindolol | 200 | 15 | 50 | 10%MeOH + 0.6% TEA | 31.38 | 31.85 | ΔK = 0.47 α = 1.01 | 31.63 |
| Propranolol | 75 | 15 | 20 | 20% MeOH | 80.07 | 90.37 | ΔK = 10.3 α = 1.13 | 11.76 |
| Ritodrine | 150 | 15 | 10 | 2% TEA | 56.52 | 63.29 | ΔK = 6.77 α = 1.12 | 16.72 |
| Terbutaline | 75 | 30 | 20 | 0 | 39.27 | 53.06 | ΔK = 13.79 α = 1.35 | 21.91 |
| pH 2.5 | pH 7.0 | |||
|---|---|---|---|---|
| β-CD | Polyβ-CD | β-CD | Polyβ-CD | |
| Paliperidone | 167 | 437 | 193 | 574/602 |
| Propranolol | 157 | 247/273 | 144 | 517/537 |
| Risperidone | 91 | 562 | 216 | 729 |
| Verapamil | 308/350 | 1513/1643 | 410 | 1198/1332 |
| Amino Acid | A-·β-CD | A-·β-CD (HA-·β-CD) * | A ± ·β-CD (H2A ± ·β-CD)* | H2A+ ·β-CD (H3A+ ∙β-CD) * | H3A2+ ·β-CD |
|---|---|---|---|---|---|
| L-Phe + β-CD | 116 ± 12 | 10 ± 3 | 6 ± 4 | ||
| D-Phe + β-CD | 103 ± 14 | 10 ± 3 | 11 ± 5 | ||
| L-Tyr + β-CD | 102 ± 10 | 84 ± 19 | 4.5 ± 2.5 | ||
| D-Tyr + β-CD | 108 ± 12 | 120 ± 18 | 30 ± 9 | ||
| L-Trp + β-CD | 86 ± 11 | 7 ± 3 | 2.5 ± 2.0 | ||
| D-Trp + β-CD | 94 ± 13 | 19 ± 9 | 8 ± 7 | ||
| L-Leu + β-CD | 21 ± 2 | 5 ± 4 | 3 ± 1.5 | ||
| D-Leu + β-CD | 28 ± 3.5 | ~0 | 0.9 ± 0.4 | ||
| L-Asp + β-CD | 3.4 ± 0.2 | 14 ± 1.5 | 11 ± 6 | ~0 | |
| D-Asp + β-CD | 11.3 ± 2.0 | 4.6 ± 0.3 | 1.5 ± 0.6 | ~0 | |
| L-Glu + β-CD | 5.7 ± 0.3 | 19 ± 2 | 13 ± 7 | ~0 | |
| D-Glu + β-CD | 2.7 ± 0.1 | 2 ± 1 | 1.1 ± 0.2 | ~0 | |
| L-His + β-CD | 3.3 ± 0.2 | 1.2 ± 0.5 | 0.6 ± 0.3 | ~0 | |
| D-His + β-CD | 5 ± 1 | 5 ± 1 | 0.4 ± 0.1 | ~0 | |
| L-Thr + β-CD | 2 ± 1 | 2 ± 1.5 | 2.5 ± 1.1 | ||
| D-Thr + β-CD | 2.8 ± 0.6 | 0.9 ± 0.5 | 2.0 ± 1.2 |
| Guest Molecules | Kd [M] (UV) | α (UV) | Kd [M] (CD) | α (CD) | Kd [M] (NMR) | α (NMR) |
|---|---|---|---|---|---|---|
| DNP-L.valine | (1.78 ± 0.10) × 10−3 | 1.33 ± 0.12 | (2.83 ± 0.05) × 10−3 | 1.15 ± 0.03 | 2.85 × 10⁻³ | 1.19 |
| DNP-D-valine | (2.36 ± 0.17) × 10−3 | (3.26 ± 0.05) × 10−3 | 3.38 × 10⁻³ | |||
| DNP-L-leucine | (7.11 ± 0.41) × 10−4 | 1.62 ± 0.30 | (1.66 ± 0.20) × 10−3 | 1.30 ± 0.22 | 1.52 × 10⁻³ | 1.6 |
| DNP-D-leucine | (1.15 ± 0.21) × 10−3 | (2.15 ± 0.25) × 10−3 | 2.43 × 10⁻³ | |||
| DNP-L-methionine | (1.38 ± 0.19) × 10−3 | 1.29 ± 0.22 | (1.32 ± 0.07) × 10−3 | 1.64 ± 0.31 | 2.47 × 10⁻³ | 1.2 |
| DNP-D-methionine | (1.78 ± 0.25) × 10−3 | (2.16 ± 0.41) × 10−3 | 2.96 × 10⁻³ |
Disclaimer/Publisher’s Note: The statements, opinions and data contained in all publications are solely those of the individual author(s) and contributor(s) and not of MDPI and/or the editor(s). MDPI and/or the editor(s) disclaim responsibility for any injury to people or property resulting from any ideas, methods, instructions or products referred to in the content. |
© 2024 by the authors. Licensee MDPI, Basel, Switzerland. This article is an open access article distributed under the terms and conditions of the Creative Commons Attribution (CC BY) license (https://creativecommons.org/licenses/by/4.0/).
Share and Cite
Napiórkowska, E.; Szeleszczuk, Ł. Review of Applications of β-Cyclodextrin as a Chiral Selector for Effective Enantioseparation. Int. J. Mol. Sci. 2024, 25, 10126. https://doi.org/10.3390/ijms251810126
Napiórkowska E, Szeleszczuk Ł. Review of Applications of β-Cyclodextrin as a Chiral Selector for Effective Enantioseparation. International Journal of Molecular Sciences. 2024; 25(18):10126. https://doi.org/10.3390/ijms251810126
Chicago/Turabian StyleNapiórkowska, Ewa, and Łukasz Szeleszczuk. 2024. "Review of Applications of β-Cyclodextrin as a Chiral Selector for Effective Enantioseparation" International Journal of Molecular Sciences 25, no. 18: 10126. https://doi.org/10.3390/ijms251810126