Article

Synthesis and Mechanism of a Green Scale and Corrosion Inhibitor

1
College of Chemistry and Molecular Sciences, Henan University, Kaifeng 475004, China
2
College of Pharmacy and Chemical Engineering, Zhengzhou University of Industrial Technology, Zhengzhou 451150, China
*
Authors to whom correspondence should be addressed.
Int. J. Mol. Sci. 2024, 25(18), 10150; https://doi.org/10.3390/ijms251810150
Submission received: 7 August 2024 / Revised: 5 September 2024 / Accepted: 20 September 2024 / Published: 21 September 2024

Abstract

:
A new green water treatment agent, a poly(aspartic acid)-modified polymer (PASP/5–AVA), was synthesized using polysuccinimide and 5-aminovaleric acid (5-AVA) in a hybrid system. The structure was characterized, and the scale and corrosion inhibition performance were carried out with standard static scale inhibition and electrochemical methods, respectively. The mechanism was explored using XRD, XPS, SEM, and quantum chemistry calculations. The results indicated that PASP/5–AVA exhibited better scale and corrosion inhibition performance than PASP and maintained efficacy and thermal stability of the scale inhibition effect for a long time. Mechanistic studies indicated that PASP/5–AVA interferes with the normal generation of CaCO3 and CaSO4 scales through lattice distortion and dispersion, respectively; the combined effect of an alkaline environment and terminal electron-withdrawing -COOH groups can induce the stable C- ionic state formation in -CH2- of the extended side chain, thus enhancing its chelating ability for Ca2+ ions. At the same time, the extension of the side chain length also enhances the adsorption ability of the agent on the metal surface, forming a thick film and delaying the corrosion of the metal surface. This study provides the necessary theoretical reference for the design of green scale and corrosion agents.

1. Introduction

Global water resources are becoming increasingly strained. Industrial water has become the fastest-growing sector in terms of water consumption while circulating water accounts for two-thirds of the total industrial water consumption [1]. Many reaction processes in chemical and other industries are exothermic during production, and the heat generated during production must be removed in a timely manner to maintain normal production operations. In the industrial recirculating cooling water system, the system is usually required to maintain the operating temperature at 15 °C~45 °C, although the temperature is often high due to various factors. In the long run, the water will continue to evaporate, the concentration of Ca2+ and Mg2+ ions in the water will gradually increase, and inorganic salts and other ions can easily combine to form limescale. At present, scaling is a serious problem faced by many industries, such as water treatment. Scale deposition on the surfaces of equipment and pipelines, particularly around pipe bends, blocks the equipment and pipelines, reduces the heat transfer efficiency, and causes heat accumulation, which results in accidents [2,3]. In addition, scale deposits cause localized current differentials in pipelines, accelerating the corrosion of equipment and pipelines, which in turn increases operating costs and risk factors [4,5]. Various methods have been used in industry to prevent inorganic scale formation and deposition, but the use of water treatment agents is currently the most effective way [6,7].
There are many industrial water treatment agents used; however, there are still various problems. Chitosan, tannin, cellulose, and other natural polymer scale inhibitors have obvious scale inhibition but also have disadvantages such as high dosages, easy decomposition at high temperatures, and poor scale inhibition [8,9]. Some phosphorus-containing scale inhibitors, for example, organic phosphonates, have better scale inhibition efficiencies; however, they cause eutrophication of water bodies, which hinders the widespread popularization of phosphorus-containing scale inhibitors [10,11]. To solve these kinds of problems, it is urgent to explore and design new water treatment agents that are nonphosphorus, multifunctional, biodegradable, and efficient.
Polyaspartic acid (PASP), with good biodegradability, is an environmentally friendly water treatment agent resulting from the absence of phosphorus and other nutrients in the molecular composition, water solubility, easy biodegradability, and a structure containing many carboxyl groups that chelate Ca2+ ions [12,13]. The literature has suggested that PASP exhibits excellent CaSO4 scale inhibition, whereas it is less effective in inhibiting CaCO3 scale and providing corrosion resistance, so it does not meet the needs of industrial application [14,15]. To further improve the overall water treatment performance of PASP, functional groups or small molecules, such as hydroxyl, carboxylic, heterocyclic, sulfonic groups, etc., are usually introduced into PASP to obtain modified PASP polymers [16,17,18]. Although much has been reported about the structure–activity relationship of water treatment agents, deeper scientific evidence is needed to confirm it [19,20].
To reveal the structure–performance relationships of PASP, the effect of side chain length on the scale and corrosion inhibition performance of PASP was investigated. A new PASP derivative (PASP/5–AVA) was synthesized using nucleophilic compounds as ring openers to break the amide bond in poly (succinimide) and by introducing the 5-aminovaleric acid (5−AVA) functional group into the PASP side chain. The structure of 5-AVA was characterized by 1H NMR and FT-IR. The scale inhibition performance, including concentration, the solution pH value, and reaction temperature, was investigated according to the static scale inhibition method. In addition, the corrosion inhibition performance of 5−AVA was also tested by electrochemical methods. Finally, the scale and corrosion inhibition mechanism was explored by optimizing its structure using quantum chemical calculations.

2. Results and Discussion

2.1. Structural Characterization of PASP/5–AVA

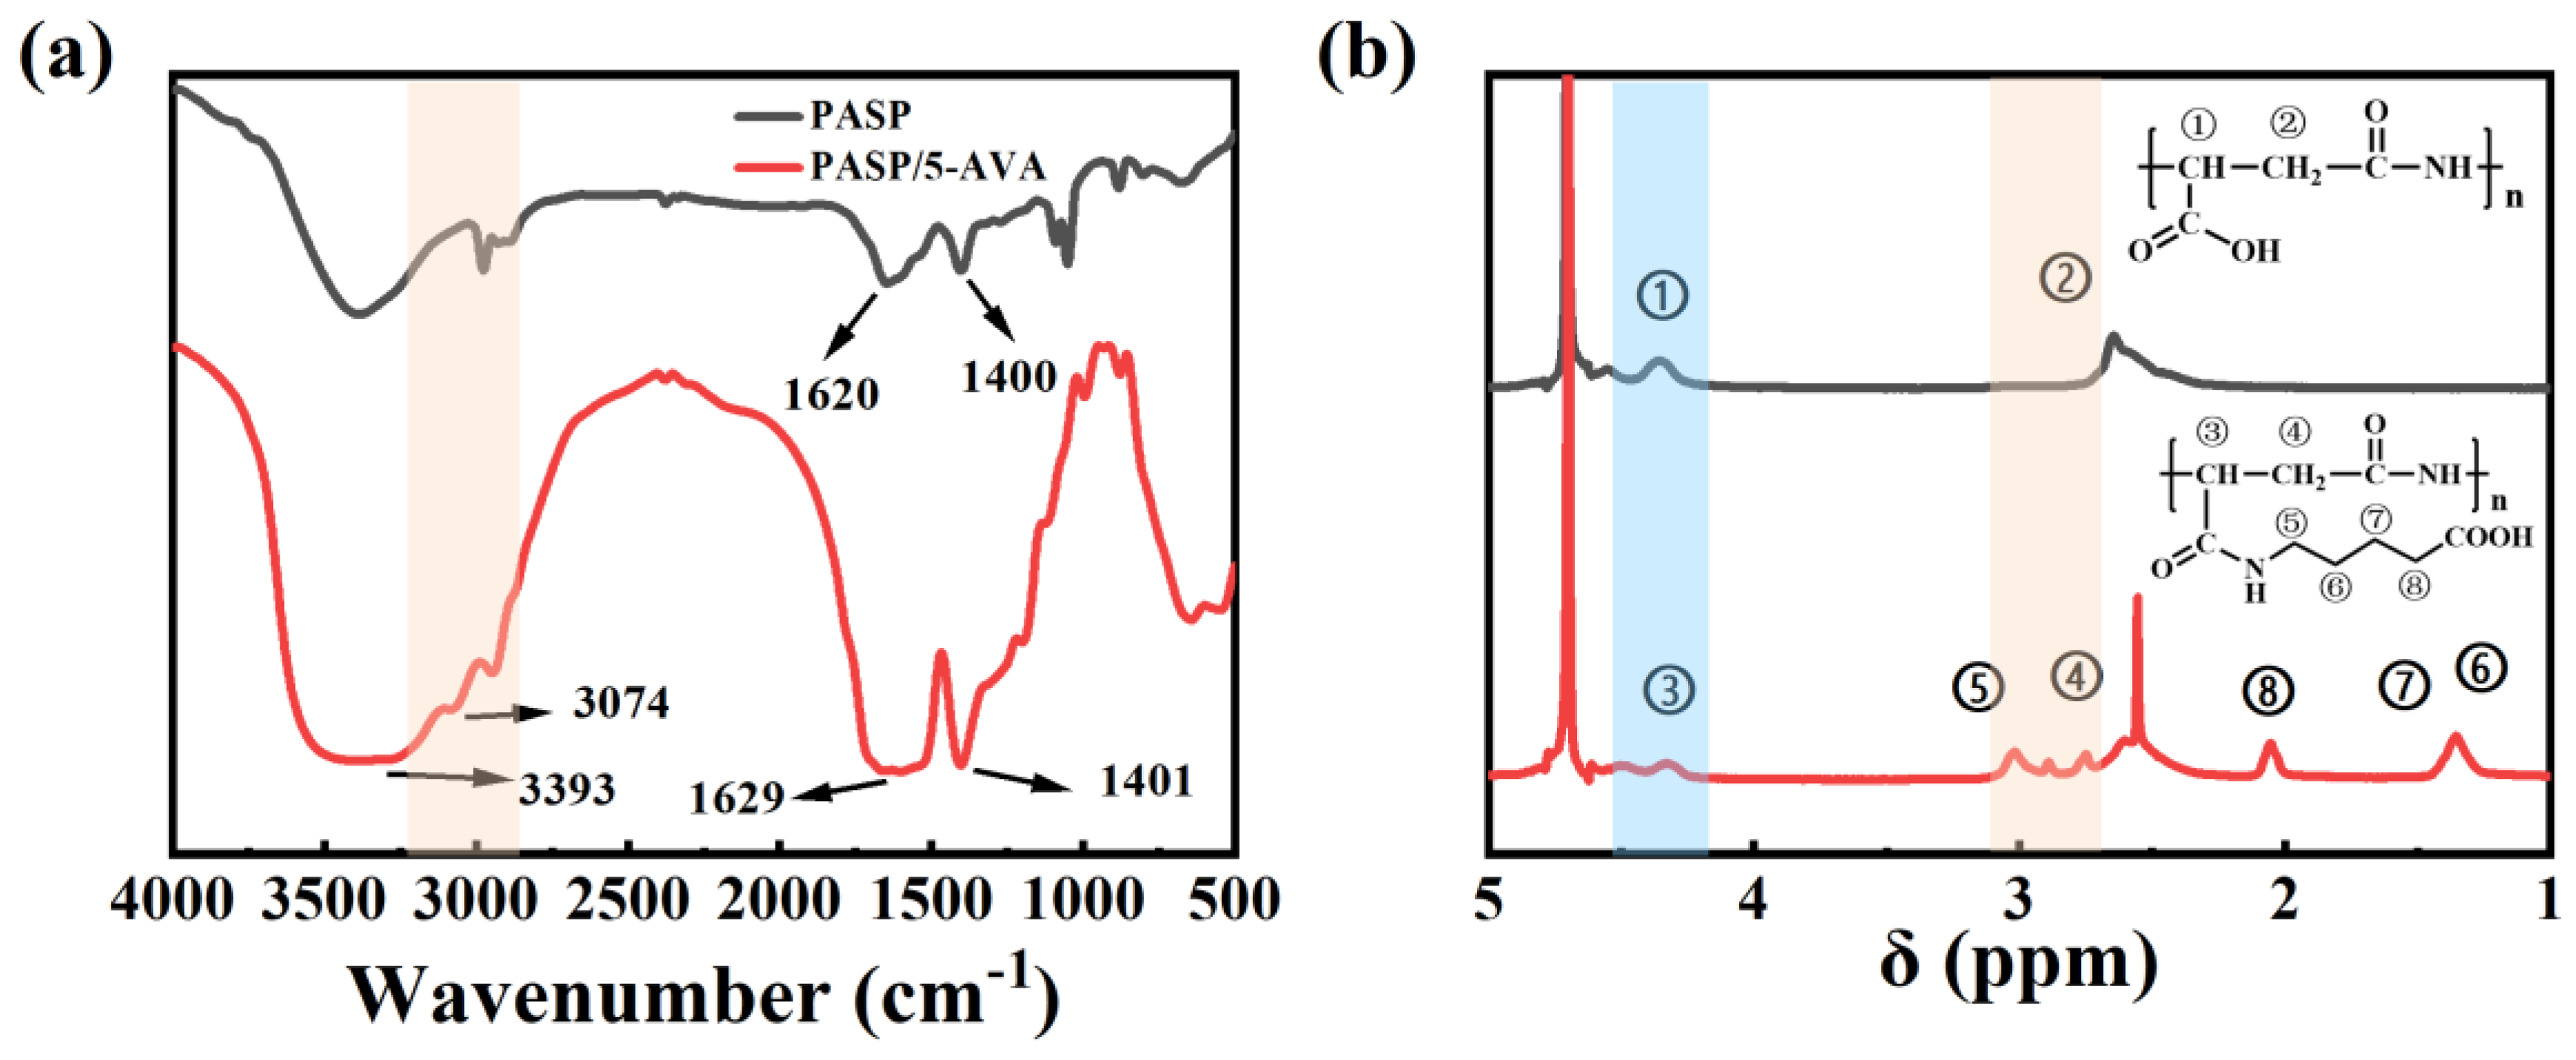
2.1.1. The Results Analysis of FT-IR and 1H-NMR

The FT-IR spectra of PASP and PASP/5–AVA are shown in Figure 1a. From the FT-IR spectra of PASP, the peak at ~1620 cm−1 is a stretching vibration absorption peak of the amide C=O bonds. The C-N stretching vibration peak at ~1400 cm−1 overlapped with the N-H bending vibration absorption peak. In addition, the stretching vibration peak of the amide N-H bonds in PASP is shown at ~3500 cm−1. The -OH bending vibration of the carboxyl groups appeared at 950–900 cm−1. The absorption peaks at ~2930 cm−1 are attributed to the stretching vibrations of the -CH2- group in the main chain, and the stretching vibrations of the -CH- groups resulted in the peaks at ~ 2890 cm−1. This indicated that PASP was obtained from the PSI ring opening reaction. In the FTIR spectrum of PASP/5–AVA, besides the peaks for PASP, the new peaks located at ~1401 cm−1, ~1629 cm−1, and ~3393 cm−1 were assigned to stretching vibrations of the C-N, C-O, and N-H bonds in the amides of PASP/5–AVA, respectively. Additionally, in the PASP/5–AVA polymer side chains, the O-H bonds stretching vibrations peak in the -COOH group appeared at ~3400 cm−1, while the asymmetric stretching vibrations of the -CH2- groups appeared at ~3000 cm−1, and the two peaks coincided with the stretching vibrations of the N-H. However, the O-H stretching vibration gave a broad and strong peak due to the association of the hydroxyl compounds. In addition, the absorption peak at ~2846 cm−1 was the symmetric stretching vibration of -CH2- in the PASP/5AC polymer side chain. Thus, the PASP/5–AVA graft copolymer was synthesized.
Figure 1b shows the 1H-NMR spectra of PASP and PASP/5–AVA polymers in D2O. The -CH- and -CH2- groups in PASP displayed broad peaks at 4.45 and 2.65 ppm (① and ②, with an integrated ratio of 1:2), respectively (Figure 1b). In the spectrum of PASP/5–AVA, it can be seen that the signal peaks of the -CH2- (⑥ and ⑦) and -CH2- (⑧) groups are located at δH = 1.30 and δH = 2.11 ppm, respectively. It is worth noting that -CH2- groups (⑥ and ⑦) in the side chain did not show coupling due to the symmetry of the molecule. Broad peaks at 4.43 and 2.62 ppm (③ and ④) with chemical shifts similar to those of PASP appeared in the spectrum. Meanwhile, the broad triplet at 3.0 ppm (⑤) was assigned to -NH-CH2- groups in the side chains of PASP/5–AVA. Combined with the infrared spectrogram results, these NMR data confirmed that PASP/5–AVA was synthesized successfully.

2.1.2. Gel Chromatography (GPC) Analysis

Polymers are usually composed of macromolecular homologs with different molecular weights [21]. The molecular weight polydispersity dispersity (Ð, Mw/Mn) is one of the important indices used to characterize a polymer, which affects the stability of the polymer, the temperature resistance, etc. Generally, a narrow molecular weight distribution corresponds to a stable polymer [22]. Gel permeation chromatography (GPC) was used to measure the molecular weights of PASP and PASP/5–AVA to clarify the characteristics of PASP/5–AVA, and the results are displayed in Table 1. From the results, the weight-average molecular weight (Mw) of the prepared PASP/5–AVA was 14,109 Da, and the number-average molecular weight (Mn) was 11,328 Da; thus, the Ð was 1.245. It is noteworthy that the actual Mn of PASP/5–AVA obtained by the GPC method is much higher than its theoretical value. This result indicates that the PASP/5–AVA polymer is not composed of single chain segments, but there are longer chain segments, i.e., there are multiple chain segments with different molecular weights in the PASP/5–AVA polymer, and therefore, the actual Mn in the GPC analysis result is much larger than the theoretical value.
The literature shows that the molecular weights of polymers are closely related to their scale inhibition capabilities; in general, molecular weights within a certain range indicate good inhibition efficiency [23]. The excessive molecular weight leads to the encapsulation of some of the carboxyl groups and other functional groups in the molecule, which reduces its scale and corrosion inhibition ability [24]. The above data confirm that PASP and PASP/5–AVA have narrower molecular weight distributions, suggesting that PASP/5–AVA polymers are well dispersed, highly stable, and potentially have good scale resistance.

2.1.3. Zeta Potential Analysis

The zeta potential shows the polymer charge and is a measure of the mutual repulsions or attractions of particles. To confirm the charges, the zeta potentials of PASP and PASP/5–AVA were determined as −4.77 and −8.12, respectively, indicating that both carried negative charges [25]. The charge of PASP/5–AVA would attract positively charged Ca2+ ions, thereby inhibiting the combination of Ca2+ ions with CO32− and SO42− in circulating water and reducing scale deposition. On the other hand, the potential of PASP/5–AVA was higher than that of PASP, indicating that PASP/5–AVA adsorbs more effectively on the surfaces of scale crystals and neutralizes the charge. The electrostatic repulsion between similar charges disperses scale crystals in circulating water and prevents deposition of the scale. Therefore, PASP/5–AVA is potentially a good scale inhibitor.

2.2. Scale Inhibition Results Analysis of PASP/5–AVA

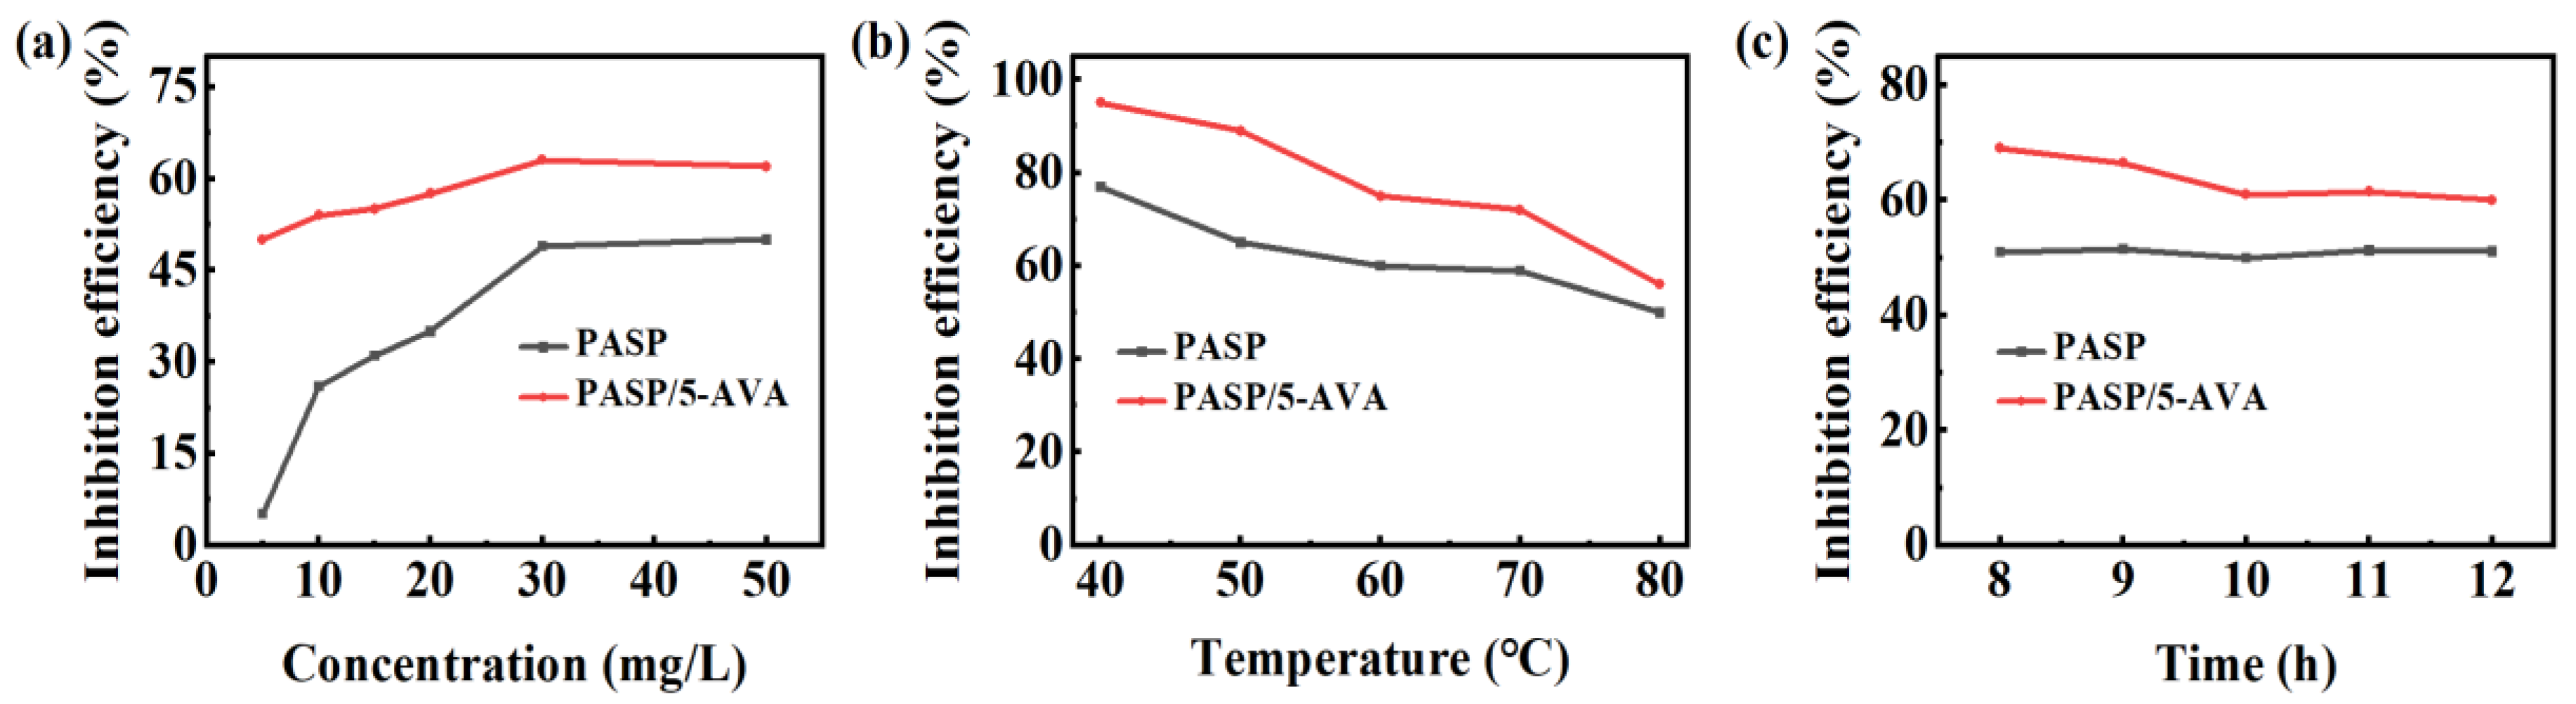
2.2.1. Analysis of CaCO3 Scale Results

To explore the CaCO3 scale inhibition of PASP/5–AVA, the relationship between the inhibitor concentration, the environmental temperature and action time, and the scale inhibition efficiency were measured, and the results are listed in Figure 2. Figure 2a reveals the effects of scale inhibitor concentrations on CaCO3 scaling. From Figure 2a, it can be clearly seen that with the gradual increase in concentration, the scale inhibition efficiency of PASP and PASP/5–AVA on CaCO3 showed a trend of gradual improvement up to the concentration of 40 mg/L when the scale inhibition efficiency of both reached the maximum value. It should be noted that over the experimental concentration range, the scale inhibition efficiency of PASP on CaCO3 was always lower than that of PASP/5–AVA. It is exciting that when the concentrations were 5 mg/L, compared with PASP, the scale inhibition efficiency of PASP/5–AVA was increased by about 45%. At a dose of 10 mg/L, the CaCO3 scale inhibition efficiency of PASP/5–AVA was about 27% higher than that of PASP. When the concentration exceeded 30 mg/L, the CaCO3 scale resistance efficiency of PASP/5–AVA remained nearly constant and was stable at approximately 65.32%. However, after the concentration exceeded 43 mg/L, the scale inhibition efficiency declined slightly. As the length of the side chains increased, the steric hindrance of the polymer decreased, and the coordination sites for the chelated Ca2+ ions increased, thus chelating more Ca2+ ions and hindering the deposition of CaCO3 scale, which had a better scale inhibition ability at low concentrations. When the concentration of the polymer was too high, the chains were intertwined, and functional groups such as -COOH were wrapped, which reduced the probability of binding the Ca2+ ions and decreased the scale inhibition efficiency.
Moreover, when the concentration was 30 mg/L, the effect of temperature on PASP/5–AVA against CaCO3 scale was investigated, and the results are listed in Figure 2b. In the experimental temperature range of 40 °C~80 °C, the anti-CaCO3 scale efficiency of PASP/5–AVA was still higher than that of PASP. It is noteworthy that when the temperature was increased to 80 °C, the anti-CaCO3 scale efficiency of PASP/5–AVA still reached 60%, while PASP was only 48.9%. The above results indicated that with the increase in temperature, the inhibition efficiency of both PASP and PASP/5–AVA on the CaCO3 scale showed a decreasing trend. However, in the whole range of test temperatures, the scale inhibition efficiency of PASP/5–AVA on CaCO3 was higher than that of PASP and was still maintained at about 60% even at 80 °C, which fully demonstrated the inhibition of CaCO3 scale by PASP/5–AVA. This shows that PASP/5–AVA has high thermal stability for CaCO3 scale inhibition. At the same time, this result also indicates that the extension of the side chain can not only improve the scale-inhibiting efficiency of PASP but also improve the thermal stability of its scale-inhibiting effect. The reason for this is that the -CH2- on the side chain is acidic due to the carbonyl group in the adjacent -COOH position, and in the alkaline test environment, the -CH2- on the side chain forms negative Ca2+ ions, so it can also interact with positively charged Ca2+ ions, adsorbing more Ca2+ ions, and at the same time improving the thermal stability of the deterrent’s action.
In addition, to determine the effect of heating time on the anti-CaCO3 efficiency, the scale inhibition efficiency of PASP and PASP/5–AVA was observed at the dosage of 30 mg/L, which is shown in Figure 2c. The anti-CaCO3 scale efficiencies of PASP and PASP/5–AVA remained almost stable as the heating time was increased. After 12 h of heating, the anti-CaCO3 scale efficiency of PASP/5–AVA remained at approximately 60%, whereas that of PASP was approximately 50%. In addition, the anti-CaCO3 scale efficiency of PASP/5–AVA was always higher than that of PASP. In addition to the chelating effect of -COOH at the end of the side chain, -CH2- on the side chain is negatively charged by -COOH, which allows better adsorption of Ca2+ ions. With time, the adsorption sites of PASP/5–AVA were gradually occupied, resulting in a decreasing trend of scale inhibition. However, in the tested heating time range, compared with PASP, the persistence of the anti-CaCO3 scale inhibiting effect of PASP/5–AVA was significantly higher.

2.2.2. Analysis of CaSO4 Scale Results

The crystallization kinetics of CaSO4 are different from those of CaCO3, so the optimal concentration and inhibition efficiency may differ for the same agent used in inhibiting CaCO3 scale and CaSO4 scale [26]. To explore the anti-CaSO4 scale effects of inhibitors, the effects of the scale inhibitor concentration, the experimental temperature, and the heating time against the CaSO4 scale were determined. Figure 3a demonstrates the anti-CaSO4 scale effects of PASP and PASP/5–AVA. From the results, the anti-CaSO4 scale efficiencies of both PASP and PASP/5–AVA increased with increasing concentrations. Similar to CaCO3, the anti-CaSO4 scale efficiency of PASP/5–AVA was better than PASP over the range of experimental concentrations. At the dosage of 2 mg/L, the anti-CaSO4 scale efficiency of PASP/5–AVA was approximately 80%, but PASP showed only 20% efficiency. When the scale inhibitors concentrations were 3 mg/L, the anti-CaSO4 scale efficiency of PASP/5–AVA, which was close to 100%, was 69% higher in comparison to PASP. When the concentrations exceeded 3 mg/L, the anti-CaSO4 scale rate of PASP/5–AVA was stable at 100%. However, when the dosage was 6 mg/L, the anti-CaSO4 scale efficiency of PASP was close to 100%. These data show that PASP/5–AVA is also highly effective in inhibiting CaSO4 scale as well as CaCO3 scale.
The effect of temperature on scale inhibitors against CaSO4 scale was observed with the concentration of 3 mg/L, and the relationship is shown in Figure 3b. With a gradual increase in the experimental temperature, the anti-CaSO4 scale efficiency of PASP showed a decreasing trend, however, the scale inhibition rate of PASP/5–AVA on the CaSO4 scale basically remained unchanged. When the experimental temperature was less than 85 °C, the anti-CaSO4 scale efficiency of PASP/5–AVA was basically maintained at a level of about 99%; at 90 °C, the anti-CaSO4 scale rate was still 81%. On the contrary, the scale inhibition efficiency of PASP on the CaSO4 scale decreased by 60.84% at 80 °C; when the temperature was raised to 90 °C, the anti-CaSO4 scale rate of PASP on the CaSO4 scale was only 20.14%. These results indicate that the extension of the side chain can not only effectively improve the scale inhibition ability of PASP against CaSO4 scale but also improve the heat resistance of its scale inhibition ability in a certain temperature range, which in turn expands its range of use in industrial applications.
Figure 3c displays the relationship between the experimental time and CaSO4 scale resistance when the scale inhibitor was 3 mg/L. The scale inhibition rate of PASP/5–AVA on the CaSO4 scale remained essentially unchanged over the test time range, and even when the static experiment lasted for 24 h, its scale inhibition efficiency was still maintained at around 100%. On the other hand, the scale inhibition rate of PASP against the CaSO4 scale began to gradually decrease when the test time exceeded 10 h, and the anti-CaSO4 scale efficiency decreased to 62% when the time lasted 24 h. This result confirms the speculation of the above results that the extension of the side chain not only promotes the adsorption of more Ca2+ ions by the PASP scale inhibitor but also the formation of a more stable structure which prolongs the duration of the scale inhibitor effective time.

2.3. Calcium Scale Analysis

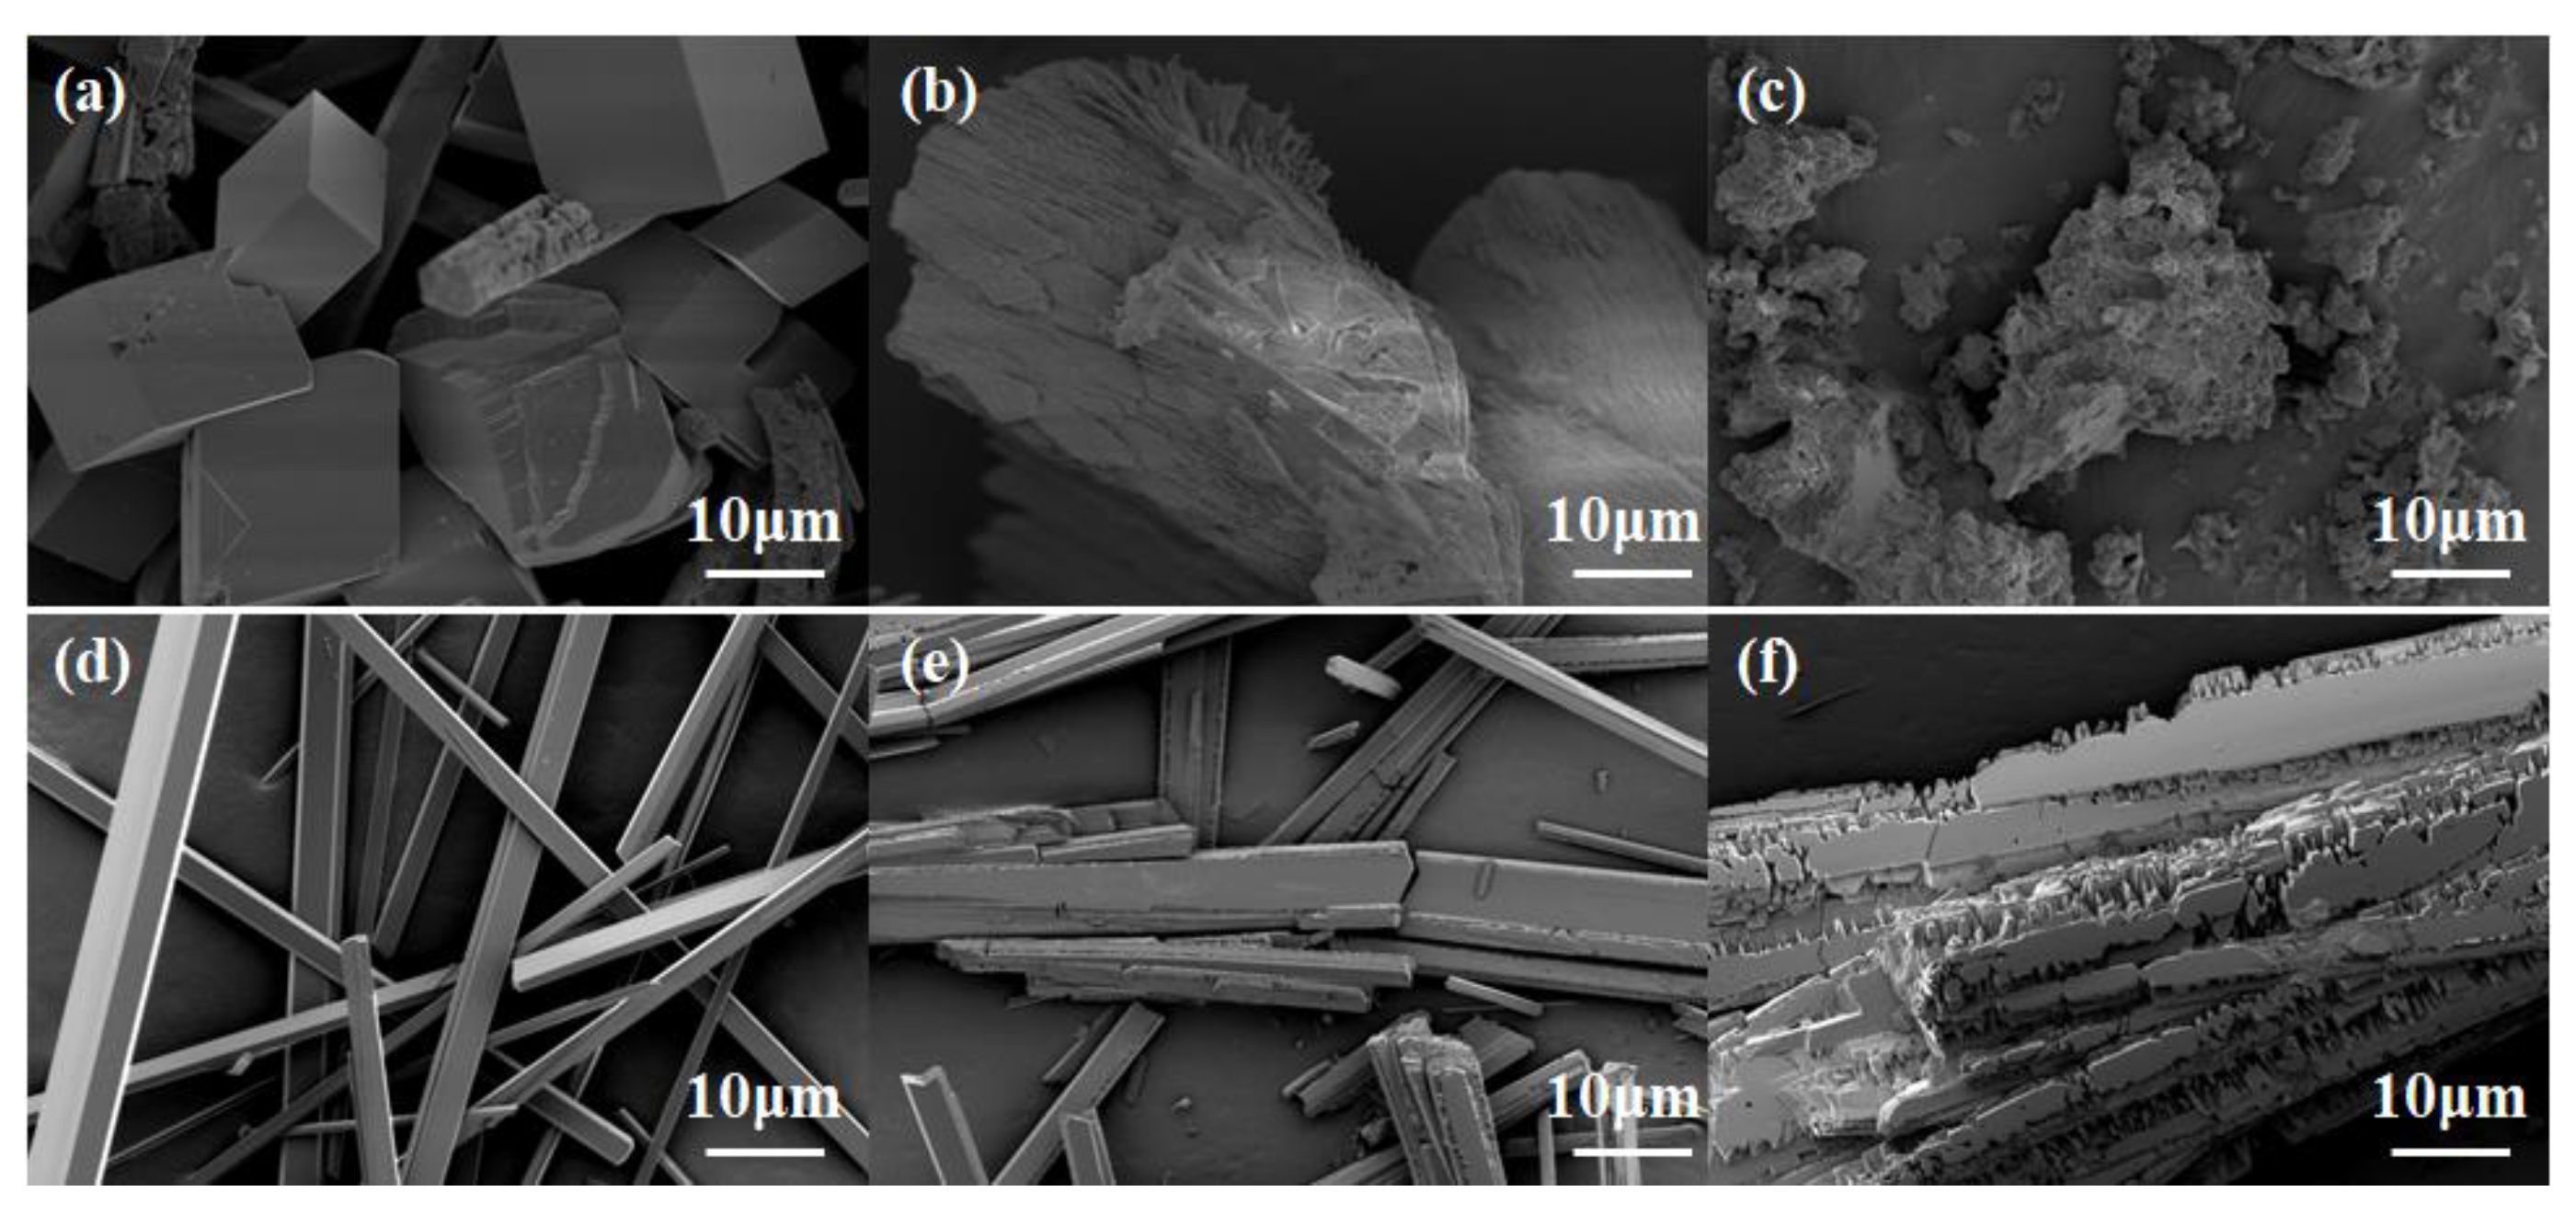
2.3.1. SEM Analysis of Calcium Scales

To investigate the inhibition mechanism of PASP/5–AVA, the morphology of CaCO3 and CaSO4 scales was scanned with and without inhibitors by scanning electron microscopy (SEM), and the images are displayed in Figure 4a–c. It was clearly seen that when the scale inhibitor was absent, the CaCO3 scale resembled calcite, with regular lozenge shapes, a regular structure, and smooth surfaces, which was the most stable crystalline form. When the concentration of PASP was 30 mg/L, the crystals of the CaCO3 scale began to change, the original regular cubic calcite shape disappeared, and multiple crystal shapes were formed, while the surface was no longer smooth and became rough with a fish scale appearance, and the original calcite was destroyed (Figure 4b). After adding 30 mg/L PASP/5–AVA, the original regular calcite morphology of the CaCO3 scale crystals was more seriously deformed, and the overall size of the crystals was smaller; the surface showed a loose bloom, like light cotton, and was easily washed away (Figure 4c). The above results indicate that both PASP and PASP/5–AVA are involved in the formation of CaCO3 scale crystals and can effectively destroy the formation of CaCO3 crystals, i.e., effective lattice distortion; it can also be seen that the extension of the side chain can effectively increase the destructive ability of PASP on the formation of CaCO3 scales and further reduce the scale deposition. Indirectly, the above results again confirmed that the extension of the side chain induced PASP to interact with more Ca2+ ions and, thus, improve the scale inhibition efficiency of PASP.
Similarly, the CaSO4 deposits showed needle-like particles with regular structures and smooth surfaces when the scale inhibitor was absent (Figure 4e). At the dosage of 3 mg/L PASP, the original regular shapes of the CaSO4 crystals were damaged, and the obvious angles disappeared, showing a jagged shape, and the surface was also damaged to some extent, forming a scaly morphology (Figure 4e). When 3 mg/L PASP/5–AVA was added, the structure of the CaSO4 crystals was severely damaged; at the same time, the whole surface of the crystals appeared very rough, showing a lamellar and flowered morphology, and became loose (Figure 4f). When crystals crystallize rapidly, the number of nuclei increases, forming fine, needle-like, or dendritic crystals. Conversely, if the crystallization rate is too slow, loose and thick crystals are formed. It can be seen that PASP/5–AVA inhibits the formation of the CaSO4 scale more than PASP. This result also suggests that the extension of the side chain length effectively promotes the ability of PASP to inhibit CaSO4 crystal formation. The destruction of CaSO4 crystals leads to the loosening of the calcium scale in solution and a reduction in the amount of deposition.

2.3.2. XRD Analysis of Calcium Scales

To investigate the action mechanism of the scale inhibitors, the CaCO3 and CaSO4 crystals were studied using XRD to monitor their crystalline phase changes. The XRD spectrums of CaCO3 and CaSO4 in the presence and absence of the scale inhibitor are shown in Figure 5. As seen in Figure 5a, the peaks for CaSO4 were located at 12.04°, 21.78°, 23.45°, and 29.69° in the absence of inhibitor. The peak intensity was high and sharp, indicating higher crystallinity and larger particles. The XRD diffraction peak positions of CaSO4 did not change significantly when PASP or PASP/5–AVA was added. However, compared to the diffraction peaks without the inhibitor, whether the PASP or PASP/5–AVA was added, it would result in a decrease in peak height and some broadening, especially for PASP/5–AVA. This suggests that the addition of PASP reduces the size and crystallinity of the grains and that the extension of the side chains increases the potency of PASP. Combined with the SEM results of the CaSO4 scales, this further suggests that PASP/5–AVA does not alter the internal structure of CaSO4 scale crystals but merely hinders crystal growth by adsorbing more Ca2+ ions.
The data of XRD peaks for aragonite are usually seen at 26.13°, 27.13°, 33.03°, 37.18°, 37.78°, 38.33°, 41.07°, 42.76°, 45.78°, 48.29°, 50.11°, 52.35°, and 52.81°; the peaks at 22.98°, 29.28°, 35.86°, 39.33°, 47.42°, and 57.29° corresponded to calcite, and the diffraction peaks at 21.02°, 24.94°, 27.05°, 32.82°, 43.89°, 49.15°, 50.13°, and 55.84° corresponded to vaterite [27]. Figure 5b displays the XRD patterns for CaCO3 with and without the antiscaling agent. When the scale inhibitor was absent, diffraction peaks can be clearly seen mainly at about 29.9°, 30°, 35.8°, 39.3°, 47.2°, and 53°, which are typical diffraction characteristic peaks of calcite. However, when the PASP or PASP/5–AVA was added, a clear shift of the original typical calcite diffraction peaks could be clearly observed, and the change in shift varies between the two. After the addition of PASP, compared without scale inhibitor, new diffraction peaks at about 26°, 27.1°, 33.56°, 41.12°, 45.5°, and 48.2° are presented, which are typical characteristic diffraction peaks of aragonite. When the PASP/5–AVA was added, similar to those of PASP, the diffraction peaks were at 26°, 27.1°, and 33.56°, except that the characteristic diffraction peaks of calcite at about 57° almost disappeared. This result fully demonstrates that the PASP inhibitor resulted in the transformation of some CaCO3 crystals from the calcite form to the aragonite. The extension of side chains resulted in the disappearance of the calcite of CaCO3 and basically its complete transformation to the aragonite, which is an unstable form of CaCO3. In addition, consistent with the SEM results, the addition of PASP altered the structure of the calcium crystal by adsorption of Ca2+ ions and other effects, thereby disrupting the normal formation of calcium scale, i.e., the lattice distortion effect. The side chain lengthening of PASP increased its ability to distort the lattice, resulting in the formation of smaller, less crystalline particles on the CaCO3 scale.

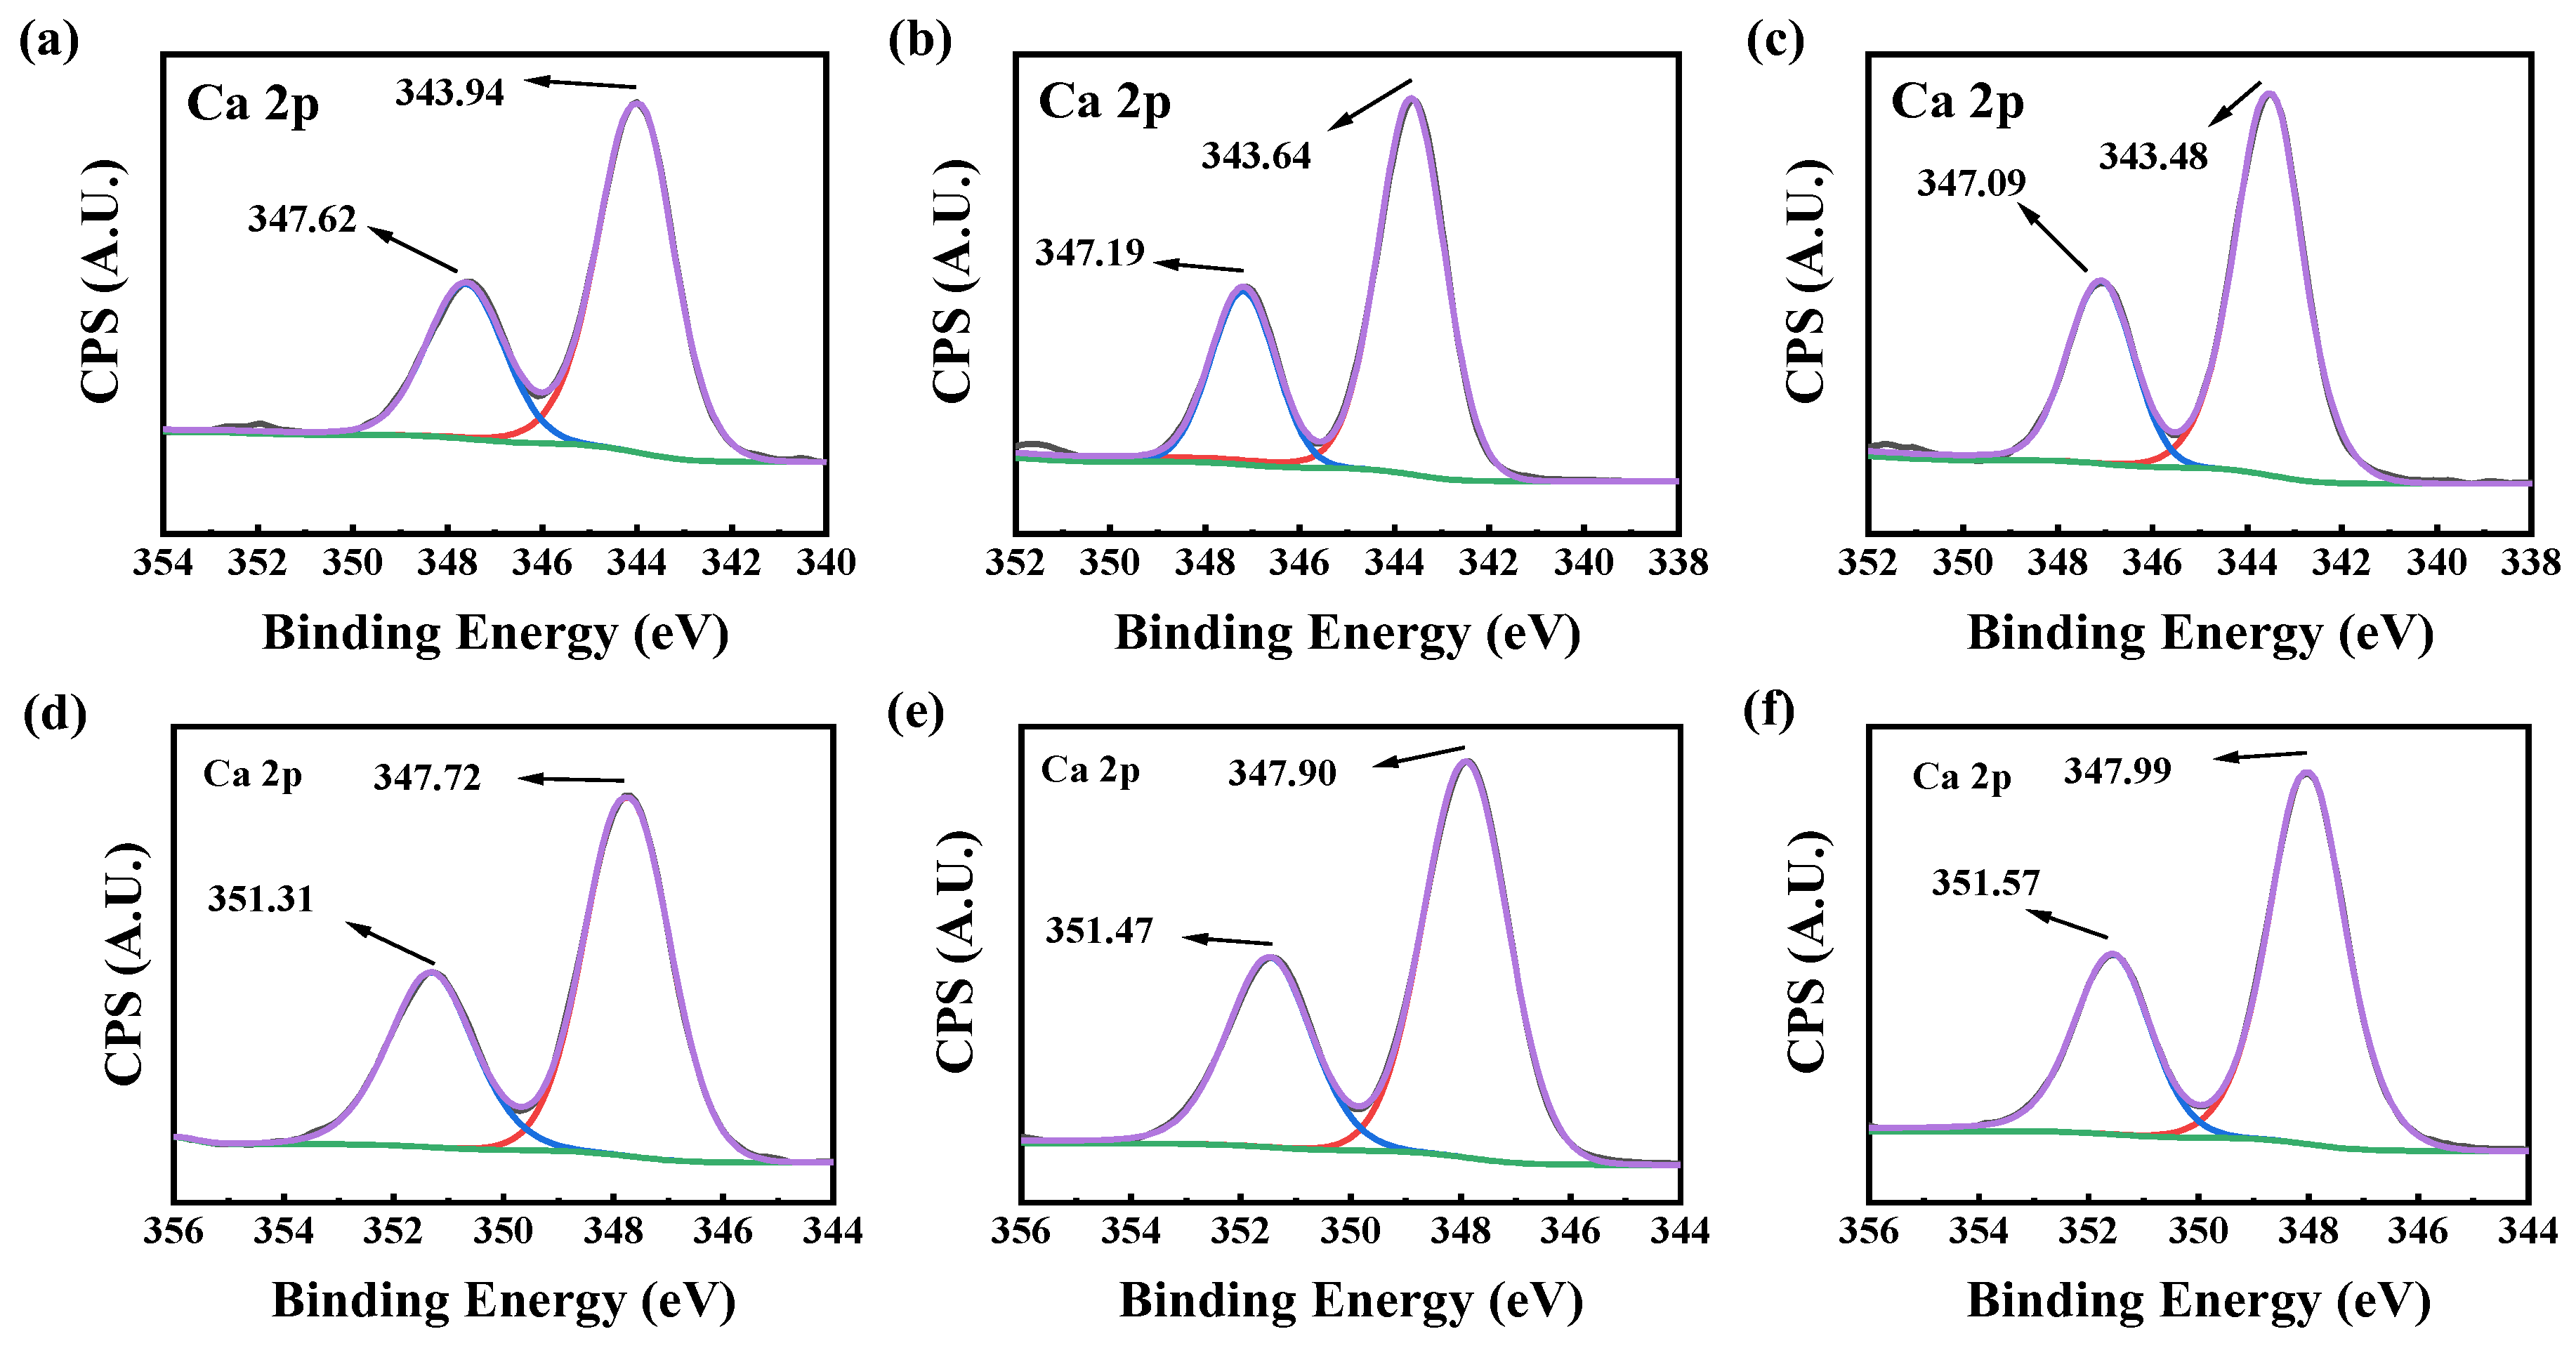
2.3.3. XPS Analysis of Calcium Scales

To further explore the action mechanism of the PASP/5–AVA inhibitor, the CaCO3 and CaSO4 scales formed in the static scale inhibition tests were observed using X-ray photoelectron spectroscopy (XPS). Figure 6 shows the high-resolution Ca 2p XPS data of calcium scales formed in the presence and absence of scale inhibitors.
When the scale inhibitor was absent, the peaks at 347.62 and 343.94 eV were Ca 2p1/2 and Ca 2p3/2 peaks of the CaCO3 scale, respectively (Figure 6a–c). With 30 mg/L PASP in the solution, the binding energies of Ca 2p1/2 and Ca 2p3/2 were 0.43 eV and 0.3 eV lower than that without the scale inhibitor, respectively. When 30 mg/L of PASP/5–AVA was added, the binding energies of Ca 2p1/2 and Ca 2p3/2 decreased by 0.53 eV and 0.46 eV, respectively. The binding energies change of Ca 2p1/2 and Ca 2p3/2 suggested that PASP or PASP/5–AVA changed the chemical environment of Ca2+ ions in the CaCO3 scale; the decrease of binding energy further indicated the formation rate of CaCO3 crystals was slowed down, thus reducing the formation of CaCO3 scales. Lengthening of the side chains increased the lattice distortion ability of PASP on the CaCO3 scale, resulting in significant displacement.
Similar to the XPS results for the CaCO3 scale, after the addition of PASP or PASP/5–AVA, the Ca 2p peaks shift for the CaSO4 scale also changed (Figure 6e,f), and the binding energies of Ca 2p1/2 were increased by 0.16 eV and 0.28 eV, respectively. The binding energies of the Ca 2p3/2 also changed by 0.18 eV and 0.26 eV, respectively. These changes confirm that both the electronegative groups in PASP and PASP/5–AVA could act on Ca2+ ions, thus hindering the normal formation of the CaSO4 scale. In addition, due to the long length of the PASP/5–AVA side chain and the action of the alkaline environment and -COOH groups, it has a stable C property in -CH2- near -COOH on the side chain, so it could act on more Ca2+ and have a more stable binding capacity than PASP. The above results suggested that the PASP and PASP/5–AVA could bind to Ca2+, and the Ca atoms lose more electrons, changing the original chemical environment and shifting the peak to higher energies. The extent of the shift suggests that the lengthening of the side chain may encourage PASP to bind more Ca2+ ions, thereby preventing the growth of CaSO4 scale crystals. However, it should be noted that the inhibition mechanism of PASP/5–AVA on the CaSO4 scale is not due to the lattice distortion effect. Summarizing the SEM and XRD results, it is thought that the scale inhibitor inhibited the growth of CaSO4 crystals mainly through the dispersion effect.

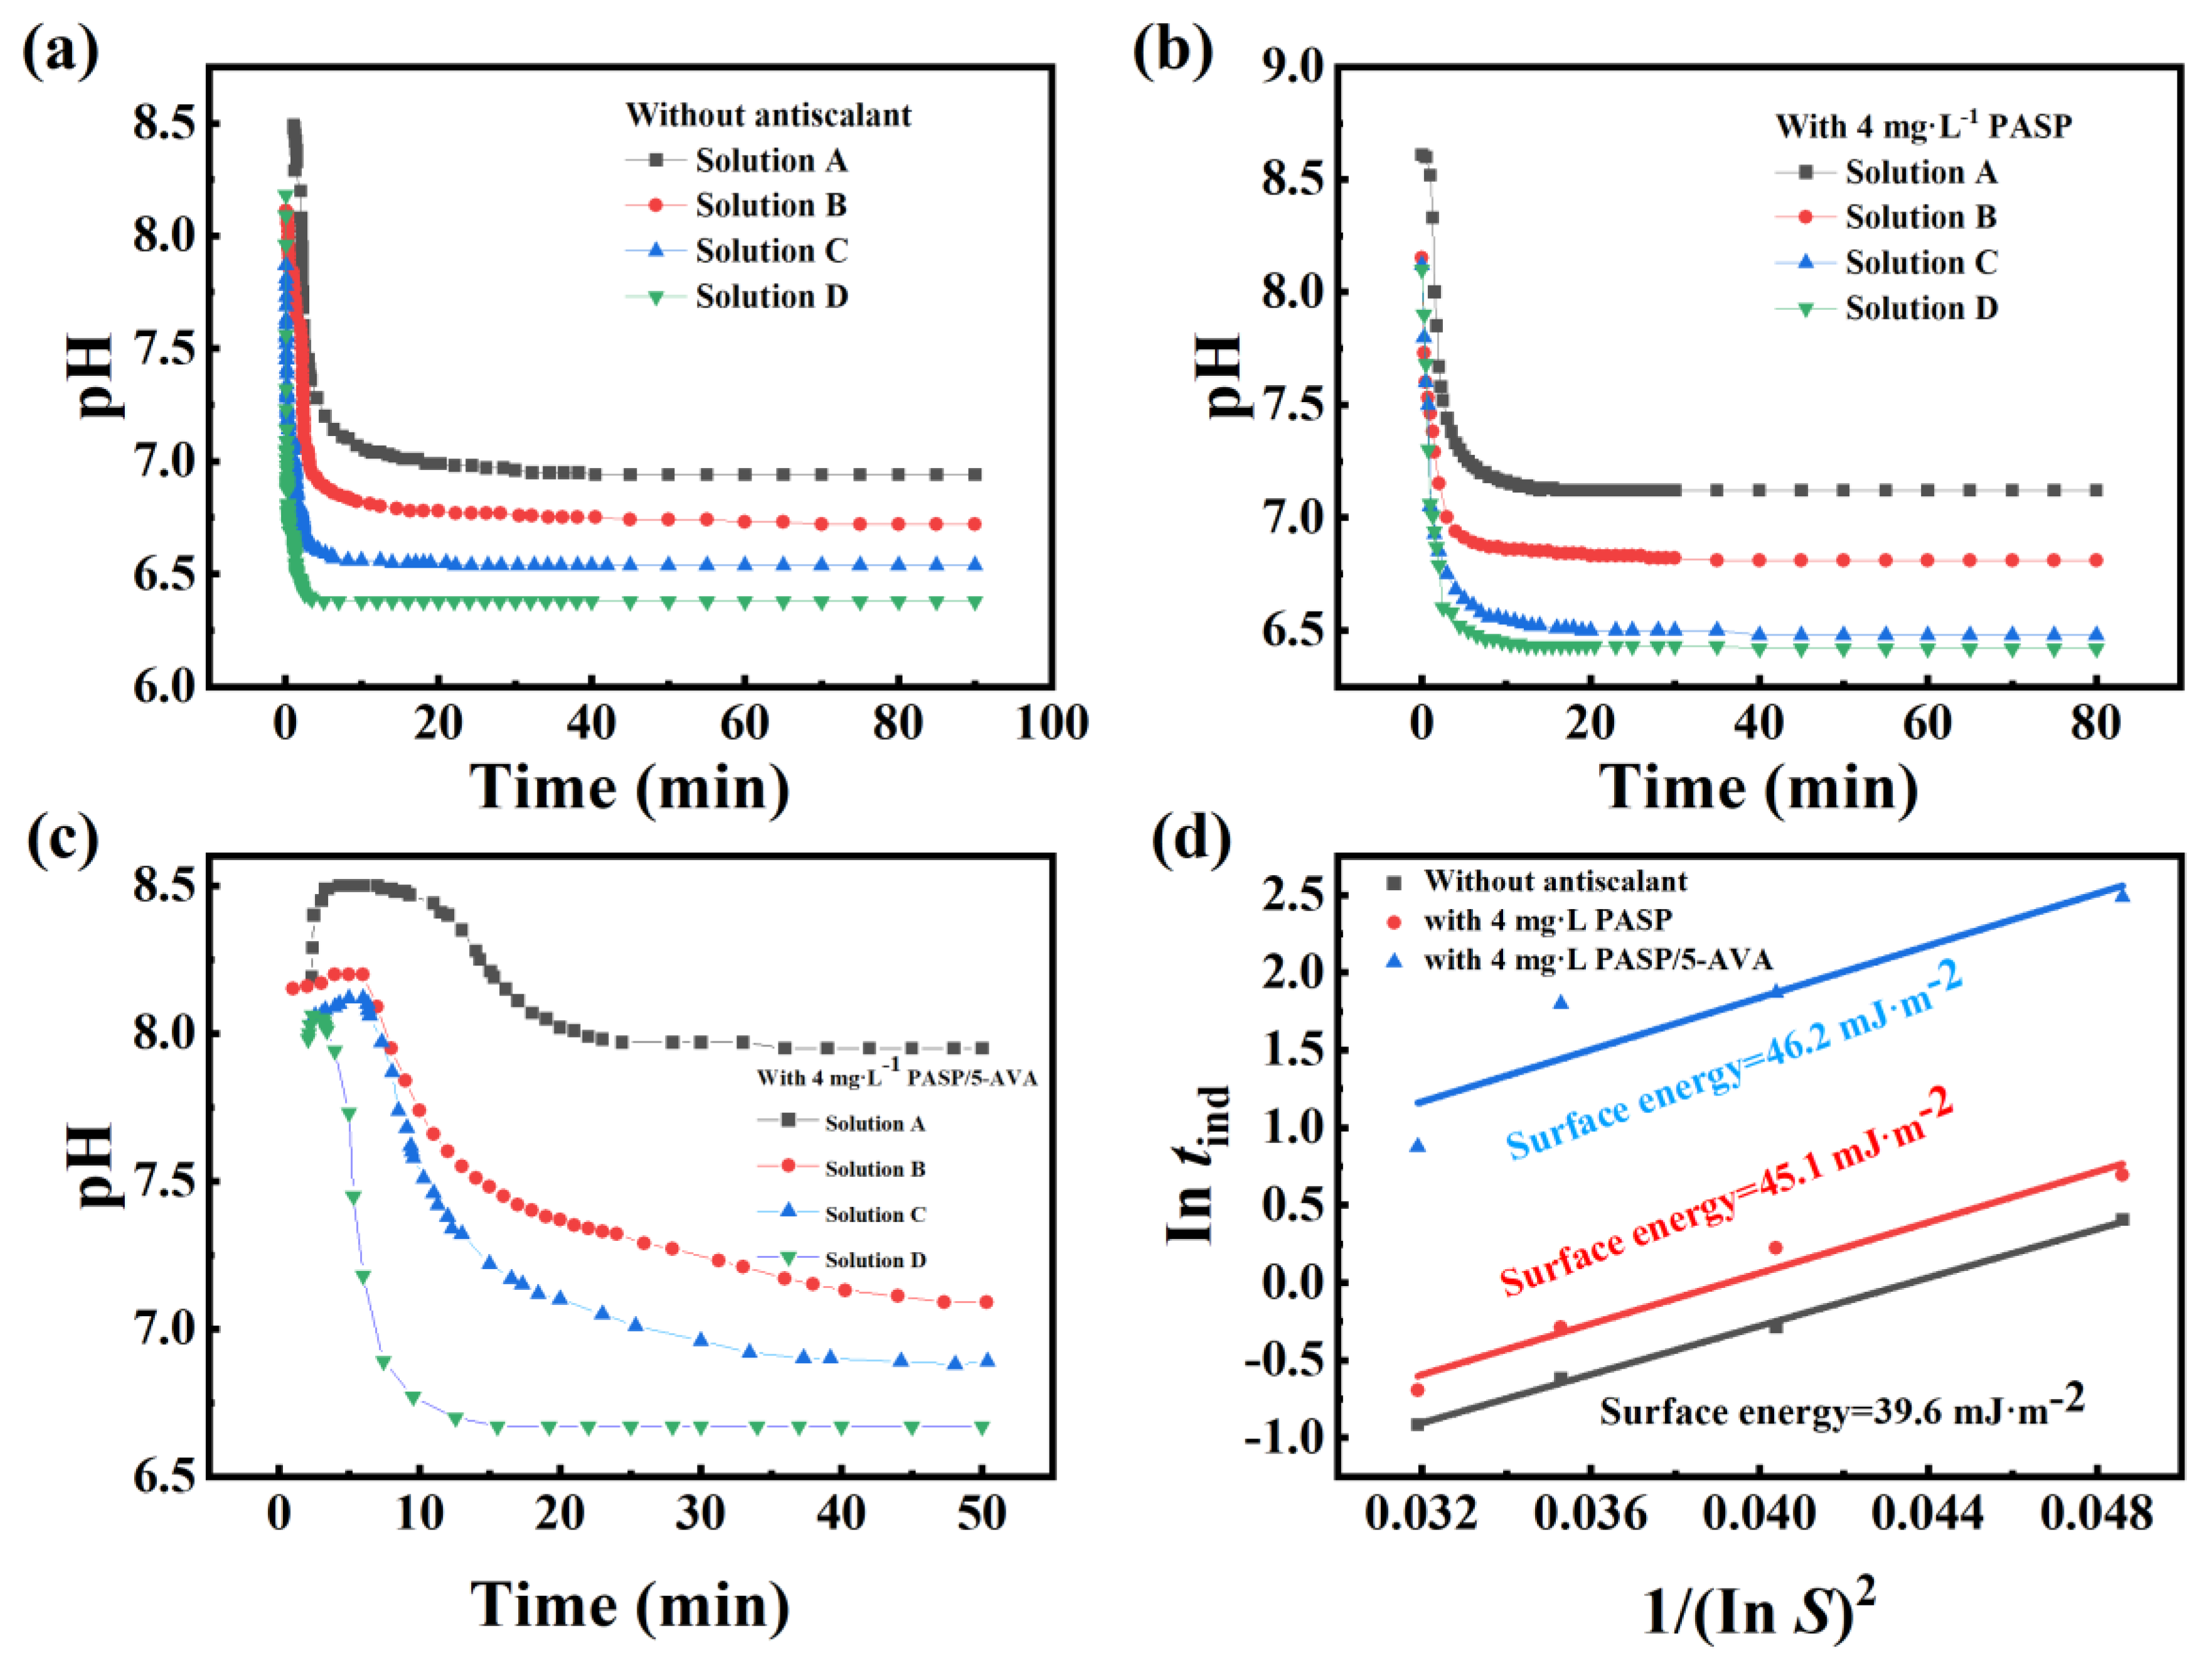
2.3.4. Surface Energy Analysis of CaCO3 Scale

Furthermore, to further explore the mechanism of PASP/5–AVA, the pH changes in solution during CaCO3 scale growth by PASP and PASP/5–AVA were tested with a pH meter. Specifically, to determine the induction time (tind) of CaCO3 scale formation, the pH changes of the solution were monitored at four different supersaturation ratios (S) of CaCO3 solutions with and without the scale inhibitor. The concentrations of CaCO3 in the four solutions (A, B, C, and D) were 0.015 mol/L, 0.02 mol/L, 0.025 mol/L, and 0.03 mol/L, respectively. The relationship curves are described in Figure 7. Table 2 shows the tind for solutions without scale inhibitors and with different dosages of scale inhibitors (Figure 7a).
Combined with Table 2 and Figure 7, it can be seen that a reasonable extension of the tind occurred for all four CaCO3 solutions with the dosage of 4 mg/L PASP; however, a significant extension of the tind occurred for all four solutions after the addition of the same concentration of PASP/5–AVA compared to the absence of the inhibitor (Figure 7b,c). The maximum tind after adding PASP/5–AVA was 53.71 min in solution A, while the tind of the blank solution was only 1.50 min, and the induction time for the solution with an appropriate amount of PASP was 2.25 min. In addition, the surface energy of the calcium scale was calculated according to Equation (4) (Figure 7d), and the crystal surface energies of the solution without the scale inhibitor and the solutions with PASP and PASP/5–AVA were 39.6 mJ·m−2, 45.1 mJ·m−2, and 63.9 mJ·m−2, respectively. These results clearly indicated that the extension of the side chain could induce PASP to better chelate more Ca2+ ions, reducing the local supersaturation of the solution, inhibiting crystal nucleation, and making crystallization more difficult, and this conclusion was also confirmed by the change in surface energy. However, as the Ca2+ concentration increased, the site of action of the agent was occupied, leading to a gradual shortening of the tind, which also confirms that the ion concentration ratio also affects the tind.

2.4. Corrosion Inhibition Analysis of PASP/5–AVA

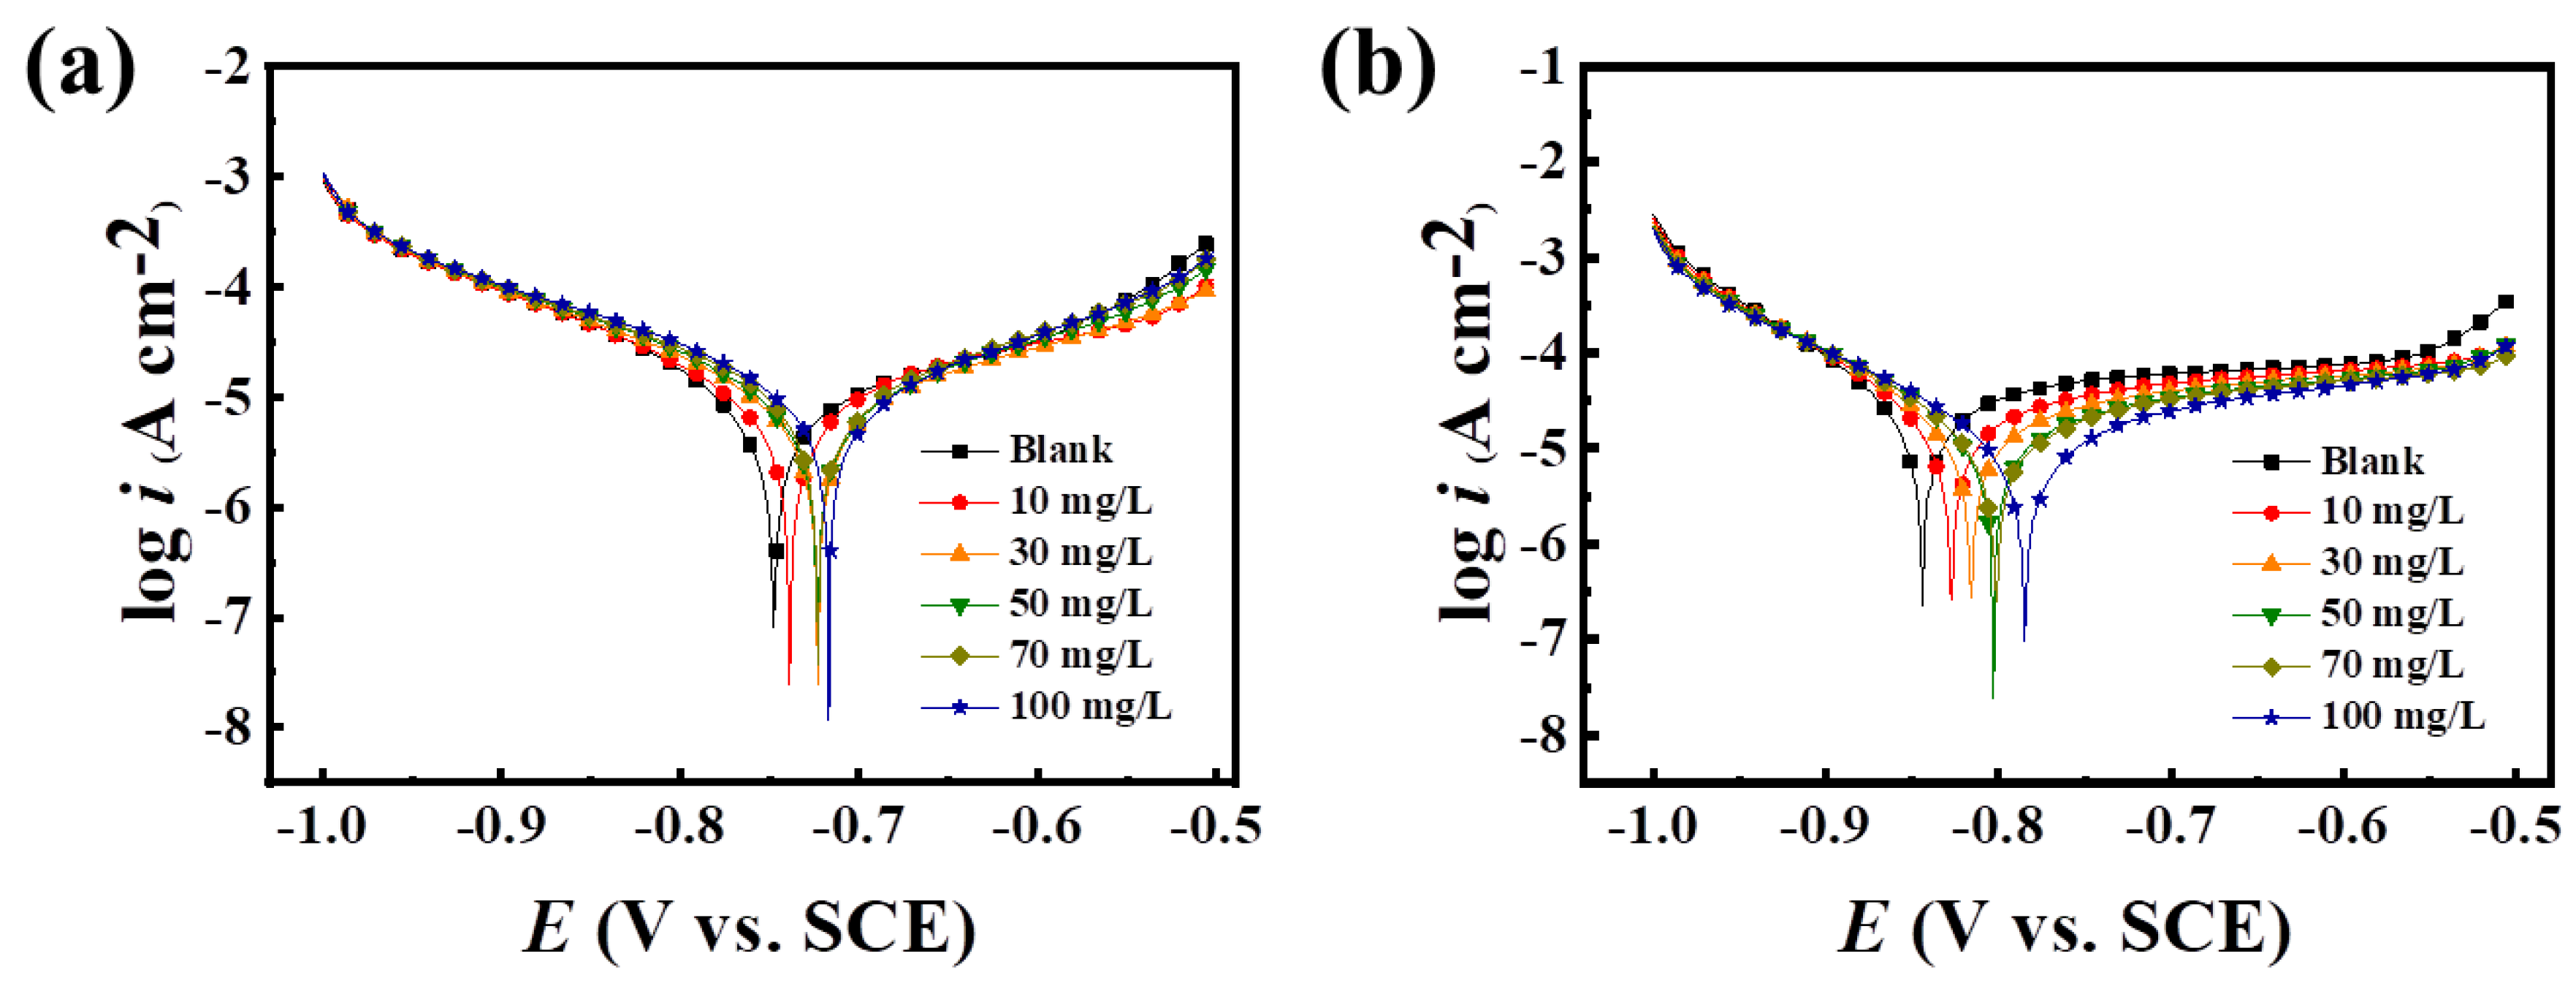
2.4.1. Analysis of Electrochemical Polarization Curves

Analyses of polarization curves are used for studying metal corrosion to reveal the metal corrosion mechanism [28]. Therefore, the potentiodynamic polarization changes of mild steel samples with and without inhibitors were measured at room temperature. To obtain a stable open-circuit potential, the carbon steel electrode was immersed in a 3.5% NaCl solution for 1 h before being used for measurements. The polarization curves results are displayed in Table 3 and Figure 8, from which potentiodynamic constants such as corrosion potential (Ecorr), the cathodic and anodic Tafel slopes (βc and βa), surface coverage (θ), corrosion inhibition efficiency (ηp,%), and corrosion current (Icorr) of corrosion inhibitors with various concentrations were obtained.
When the inhibitors were absent, the corrosion current density (Icorr) and the corrosion potential (−Ecorr) were 3.516 mA/cm2 and 0.6775 V vs. SCE, respectively. These data indicate a relatively serious corrosion trend of the metal and easy corrosion. After adding the inhibitor, with the increase of the agent concentration, the corrosion potential (Ecorr) moved in the positive direction, and the self-corrosion potential decreased, indicating a corrosion tendency weakening of the metal surface. Similarly, the corrosion current density (Icorr) was also gradually reduced, indicating that anode corrosion was suppressed. As the concentration of the agent increases, the polarization curve of the self-corrosion potential gradually shifts to positive; the Icorr gradually decreases, and the corrosion inhibition performance is better. In addition, Figure 8 shows that both PASP and PASP/5–AVA caused a large change in the anodic Tafel slope (βa), while the cathodic Tafel slope (βc) did not change significantly. This result indicated that PASP and PASP/5–AVA inhibited the corrosion of the metal by altering the anodic corrosion process and were typical anodic corrosion inhibitors. However, compared with PASP, the addition of PASP/5–AVA resulted in a greater positive shift of the corrosion potential and a smaller corrosion current, and the corrosion inhibition efficiency and surface coverage of PASP/5–AVA were also relatively improved. At 100 mg/L, compared with PASP, the corrosion inhibition efficiency and the surface coverage of PASP/5–AVA increased by 29.16% and 0.29, respectively. This result fully demonstrates that the extension of the side chains can improve the adsorption capacity between PASP and the surface of carbon steel and, thus, effectively protect the metal surface to avoid corrosion.

2.4.2. Analysis of Electrochemical AC Impedance Spectra

To investigate the corrosion inhibition performance and mechanism of corrosion inhibitors, electrochemical impedance spectroscopy (EIS) was used [29,30]. The electrochemical impedance profiles were obtained with and without corrosion inhibitors, and the results are shown in Figure 9. The relevant parameters are exhibited in Table 4.
From Figure 9 and Table 4, it can be seen that the impedance spectra with and without corrosion inhibitor exhibit the shape of a single capacitive resistive arc. It is indicated that the dissolution of 20# carbon steel is mainly controlled by charge transfer. At the same time, compared to without corrosion inhibitor, the addition of PASP or PASP/5–AVA increases the high-frequency resistive arc radius, and with increasing corrosion inhibitor concentration, the high-frequency resistive arc radius increases. It is worth noting that the high-frequency capacitive resistance arc radius of PASP/5–AVA added at the same concentration is significantly greater than that of PASP. From Table 4, the inhibition efficiency of PASP/5–AVA is increased by 16.73% compared with PASP at the dosage of 30 mg/L; at 70 mg/L, the corrosion inhibition efficiency is increased by 24.2%. The above results indicate that the presence of corrosion inhibitors leads to corrosion occurring, reaction transfer resistance increases, and double-layer capacitance is significantly reduced, thus slowing down the corrosion rate of the metal. With the increase of inhibitor concentration, the charge transfer resistance gradually becomes larger, and the metal corrosion rate is gradually reduced. It can also be seen from the impedance spectra of the low-frequency part in Figure 9, a diagonal line with an inclination of 45 °C. This indicates that a thicker and denser passivation film was formed on the electrode surface after adding corrosion inhibitors, resulting in a large increase in film resistance; the migration process of ions is greatly inhibited, effectively preventing the corrosion of the metal. Consistent with the above results of the electropolarisation curves, the extension of the side chain is conducive to improving the adsorption capacity between PASP and the metal surface. The solution resistance increased, and the high-frequency capacitive resistance presented an increase, which reduced the corrosion rate of the metal to a greater extent and improved the corrosion inhibition rate.

2.5. Action Mechanism of PASP/5–AVA

2.5.1. Mechanism Analysis of Scale Inhibition

To explore the scale inhibition mechanism, Gaussian quantum chemical calculations were performed on PASP/5–AVA to obtain its optimal structure and charges, and the results are shown in Figure 10. From the data in Figure 10, the N (−0.668848, −0.57034), O (−0.37315, −0.39235, −0.42867, −0.56595), and C (−0.2969, −0.29006, −0.24382, −0.25541) atoms of the PASP/5–AVA structure carry a large number of negative charges, providing more ideal binding sites for Ca2+ ions. Consequently, when PASP/5–AVA is dispersed in circulating water, it can combine with more of the positively charged metal ions, thereby intervening in crystal formation and reducing the formation of CaCO3 and CaSO4 scales. Moreover, Combining the SEM, XRD, and XPS results of calcium scales, it can be concluded that the chelating number and chelating capacity of PASP/5–AVA for Ca2+ ions is much higher than PASP. The above results imply that PASP/5–AVA interferes mainly with the normal formation of CaCO3 and CaSO4 through lattice distortion and dispersion effects, respectively. At the same time, the side chain extension improves the scale inhibition capacity of PASP. Analyzing the reasons, as industrial circulating water is often alkaline, the -CH2- on the extended side chains of PASP/5–AVA is prone to form a carbon negative ion which is terminally attached to this electron-absorbing -COOH group, resulting in a more stable structure. The -COOH and the stable negatively charged -CH2- group carried by PASP/5–AVA interact with the positively charged Ca2+ in the solution, thus improving its scale inhibition efficiency. The side chain extension of PASP/5–AVA also reduces the intramolecular -COOH interactions compared to PASP, thereby increasing its stability against Ca2+ ion chelation. Thus, it can be seen that proper extension of the side chain can enhance the scale inhibition ability of PASP.

2.5.2. Analysis of Corrosion Inhibition Mechanism

To investigate the anti-corrosion mechanism of PASP/5–AVA, the molecular orbital density distributions of PASP and PASP/5–AVA were optimized using density functional theory. The results are listed in Figure 11, and the corresponding parameters are given in Table 5. The data indicate that the electron density of PASP and PASP/5–AVA is concentrated on highly negatively charged N and O heteroatoms. According to quantum chemical theory, the corrosion inhibition performance of the inhibitors was closely related to the energies and the energy gap (ΔE) of the highest and the lowest unoccupied molecular orbital (EHOMO and ELUMO). A high EHOMO indicates that the molecule readily donates electrons to suitable low-energy acceptors with empty molecular orbitals. The lower the ELUMO value, the better the ability of the molecule to accept electrons. Furthermore, the smaller the ΔE is, the more likely the molecule is to donate and accept electrons.
The data in Table 6 show that PASP/5–AVA had a higher EHOMO, a lower ELUMO, and a smaller ΔE compared with PASP, which indicates that PASP/5–AVA is more likely to interact with metals through the N and O atoms. Moreover, the number of electrons transferred (ΔN) by PASP/5–AVA and PASP were 0.5633 and 0.4708, respectively. These values mean that the electrons on the molecule of PASP/5–AVA are more likely to be transferred to the metal surface, and the metal surface could be effectively protected and avoid being corroded. The above results clearly indicate that the side chain extends due to the increase of -CH2- groups and changes the atom characteristics of the PASP molecule to some extent. This is conducive to the transfer of electrons to the metal surface, thereby improving the stability of the agent adsorbed on the metal surface, forming a protective film to prevent metal corrosion.

3. Materials and Methods

3.1. Reagents and Equipment

The reagents and equipment used in this experiment are listed in Table 6. Deionized water (DI) was prepared in the laboratory and used as the solvent for rinsing.

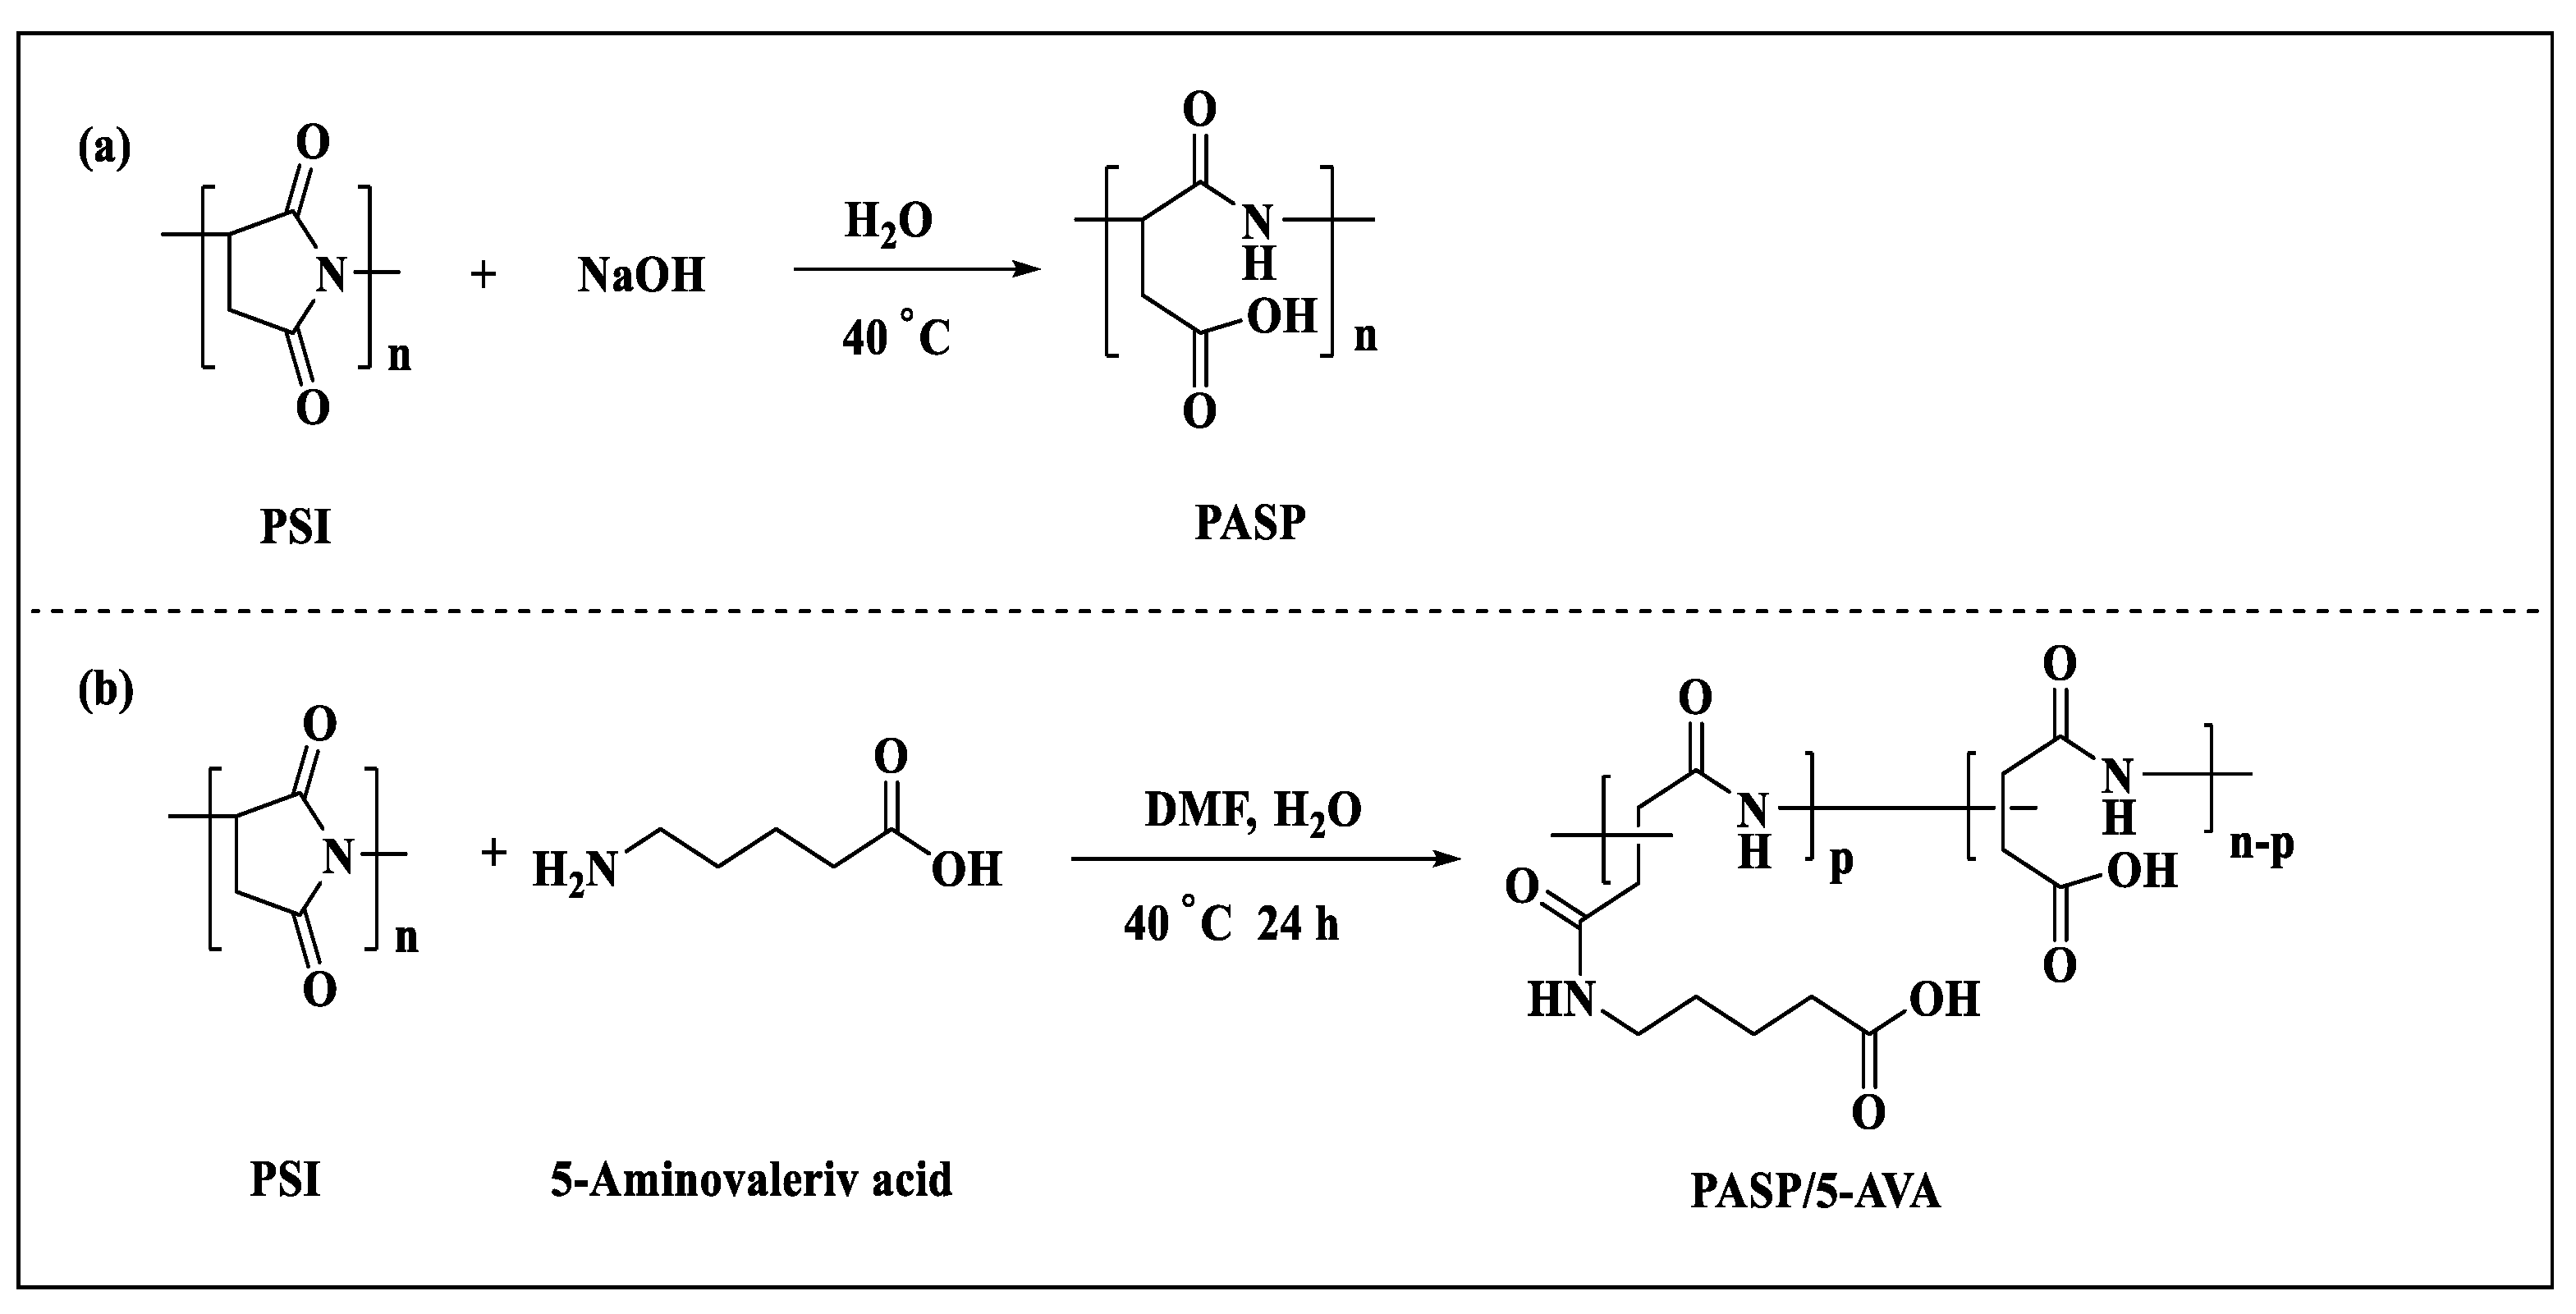
3.2. Synthesis of PASP and PASP/5–AVA

Synthesis of PASP: 400 mg NaOH (10 mmol) was dissolved in 1 mL H2O and set aside. Then, 984 mg PSI (10 mmol) was dissolved in 10 mL distilled water in a 100 mL reaction flask, and the flask was placed in a water bath at 40 °C with stirring for 24 h. During the reaction, the prepared NaOH solution was added dropwise to the reaction flask. After the reaction, PASP was purified by dialysis in distilled water using a dialysis bag with a molecular weight of 1000 kD, and then the water was removed by vacuum distillation to give PASP. The synthetic reaction for PASP is shown in Figure 12a.
Synthesis of PASP/5–AVA: First, a mixture of 0.984 g polysuccinimide (PSI, 10 mM) and 25 mL distilled water were added to a 50 mL round-bottomed flask with magnetic stirring for 6 h, and the temperature was kept at 60 °C. Then, 1.171 g of 5-aminovaleric acid (5-AVA, 10 mM) dissolved in 5 mL N,N-dimethylformamide (DMF) was added to the above solution. The temperature of the system was adjusted to 40 °C. Subsequently, the pH value of the reaction solution was adjusted to 9 with 0.1 mol/L NaOH solution. After 24 h, a yellowish-brown viscous solid was formed. Then, the product was precipitated with 100 mL of anhydrous ethanol. The precipitate was moved to a drying oven and dried at 60 °C for 24 h. To purify the samples, they were dissolved in pure water, purified by a dialysis membrane, and then spun to obtain the PASP/5–AVA solid product (yield, 96%). The synthetic reaction for PASP/5–AVA is illustrated in Figure 12b. The above-mentioned polymer was put into a reserve solution with a certain concentration for the performance evaluation.

3.3. Characterization of PASP/5–AVA

The structural characteristics of PASP/5–AVA were performed using 1H nuclear magnetic resonance spectroscopy (1H NMR; AVANCE 400 MHz NMR spectrometer, Bruker Optics, Bilerika, Germany) and Fourier transform infrared spectroscopy (VERTEX 70 FTIR spectrometer, Bruker Optics, Bilerika, Germany). The gel permeation chromatography (PL-GPC50, Agilent, Palo Alto, USA) and a nanoparticle size and zeta potential analyzer (Nano ZS Malvern Instruments Co., Ltd., Marvin, England) were used for determining the molecular weight and the zeta potential of the PASP/5–AVA, respectively.

3.4. Static Scale Inhibition Experiment

The static scale inhibition method (GB/T 16632-2019) was used to assess the scale inhibition effect of PASP/5–AVA on the CaCO3 scale [31]. Specifically, a test solution including Ca2+ (240 mg/L) and HCO3 (732 mg/L) was kept in an 80 °C water bath and, after 10 h, was cooled to room temperature. Next, 0.01 mol/L of disodium ethylenediaminetetraacetate (EDTA-2Na) solution was used to titrate the filtrate to determine the Ca2+ ions concentration. Similarly, the scale inhibition for PASP/5–AVA against the CaSO4 scale was evaluated according to industry standard test methods (QSY126-2014) [32]. To determine CaSO4 scale resistance, a solution including Ca2+ (2000 mg/L) and SO42- (480 mg/L) was heated in a 70 °C water bath for 6 h and then cooled to room temperature. The calcium ion concentration was measured as above. The inhibition efficiencies against CaCO3 and CaSO4 scales (η, %) were calculated according to Formula (1).
η = C 2 C 1 C 0 C 1 × 100 %
C0 represents the initial Ca2+ concentration of the water samples without scale inhibitor before heating, and C1 and C2 represent the Ca2+ concentrations of the water samples without and with scale inhibitor after heating, respectively. Each value was the average value of the experiment repeated three times to minimize data errors.

3.5. Calcium Scale Characterization

The surface morphologies of the scale samples were observed with field emission scanning electron microscopy (FESEM). X-ray powder diffraction (XRD) and X-ray photoelectron spectroscopy (XPS) were used to investigate the structures and Ca 2p binding energies of CaSO4 and CaCO3 crystals, respectively.

3.6. Determination of Scale Crystal Surface Energy

The formation process of CaCO3 is listed in Equation (I). Crystallization of CaCO3 results in a decrease in pH value due to the release of H+. Therefore, the point at which the pH of the solution dropped significantly was regarded as the induction time (tind) for CaCO3 crystal nucleation [33,34]. The pH value change of the solution was detected to investigate the effects of PASP and PASP/5–AVA against CaCO3 crystals. The specific process is as follows. Four CaCl2 and NaHCO3 solutions with equal volumes and molar concentrations were mixed to obtain solutions A, B, C, and D, and the concentrations of CaCO3 were 0.015 mol/L, 0.02 mol/L, 0.025 mol/L, and 0.03 mol/L, respectively. The corresponding supersaturation ratio (S) of A, B, C, and D were 93.325, 144.524, 204.174, and 269.153, respectively. A certain amount of scale inhibitor was added to the premixed solution. The reaction temperature was kept at room temperature. The surface energy (γ) of the CaCO3 crystals was obtained according to Formula (2).
Ca2+ + HCO3→CaCO3↓ + H+
I n t ind = B + β γ 3 v m 2 N A f ( θ ) R 3 T 3 ( L n S ) 2
B and γ represent a constant and surface energy (J·m−2), respectively. β is the geometric factor of a spherical nucleus, 16π/3. ʋm, which was 36.93 cm3·mol−1 for calcite, is the molar volume. NA represented Avogadro’s constant (mol−1). f ( θ ) is the correction factor. R is the gas constant (J·mol−1. K−1). T and S are the absolute temperature (K) and the supersaturation ratio for different solution concentrations, respectively. Each value was the average value of repeated three times.

3.7. Determination of Corrosion Inhibition Efficiency

The ability of PASP and PASP/5–AVA to inhibit electrochemical corrosion on carbon steel was studied at different concentrations with a CHI 660E electrochemical workstation, a three-electrode system, and the corrosion medium was 3.5% NaCl solution (298 K) [35]. The counter electrode and the reference electrode were a platinum electrode (2 cm2) and a saturated calomel electrode, respectively. The working electrode was 1 cm2 of an epoxy-clad 20# carbon steel. Before the experiment began, the working electrode was polished with sandpapers of different specifications (400–2000 mesh) to ensure a smooth surface, cleaned with acetone, and dried. Before the tests, to determine the steady-state open circuit potential (EOCP), the electrode was immersed in 500 mL corrosion solution for 1 h. Potentiodynamic polarization was tested at a scan rate of 1 mv/s within the potential range ±250 mV EOCP. The metal surface coverage (θ) and inhibition efficiency (ηp) were obtained from Tafel curves, which were calculated with Formulas (3) and (4), respectively.
η p % = I c o r r 0 I c o r r I c o r r 0 × 100
θ = n p 100
I c o r r 0 and I c o r r are the current densities in corrosive media without and with corrosion inhibitors, respectively.

3.8. Mechanism Analysis

To investigate the scale inhibition mechanism at the B3LYP/6-31 G(d, p) level, the molecular structure of scale inhibitors was optimized with the Gaussian 09 software package. The structure–activity relationship was analyzed using Density Functional Theory (DFT) [36]. The highest and the lowest occupied molecular orbital energy (EHOMO and ELUMO) were obtained. The energy gap (ΔE) was the difference value between EHOMO and ELUMO (Formula (5)). The electron transfer (ΔN) between EHOMO and ELUMO was calculated with Formulas (6) to (8).
Δ E = E L U M O E H O M O
Δ N = χ F e χ i n h 2 ( η F e + η i n h )
χ i n h = E H O M O E L U M O 2
η i n h = E L O M O E H U M O 2
χ is the electronegativity of the particle, η is the overall hardness of the substance, and in theory, the χFe and ηFe of pure iron were 7 eV·mol−1 and 0 eV·mol−1, respectively. Each value was the mean value, at least in triplicate.

4. Conclusions

The new corrosion inhibitor PASP/5–AVA was synthesized from poly(succinimide) (PSI) and 5-aminovaleric acid (5-AVA) in a mixed reaction system of organic solvent and water. The experimental results suggest that PASP/5–AVA has better scale inhibition on CaCO3 and CaSO4 and corrosion inhibition effects than PASP. Mechanistic analysis showed that PASP/5–AVA acted on CaCO3 through chelation solubilization and lattice distortion and on CaSO4 through dispersion to achieve scale inhibition. Moreover, the increasing of the -CH2- groups in the side chain and extending its length can enhance the scale and corrosion inhibition capability of PASP.

Author Contributions

Writing—original draft, L.Z.; Methodology, Z.C.; Software and Formal analysis, X.Z. (Xiaojuan Zhang) and Y.W. (Yuxia Wang); Validation, Y.H.; Software and Validation, X.Z. (Xiaowei Zhao); Conceptualization, Y.C.; Data curation and Writing—review and editing, Y.X. and Y.W. (Yufeng Wu). All authors have read and agreed to the published version of the manuscript.

Funding

This research was funded by Henan Central Leading Local S&T Development Projects (Henan Provincial Department of Science and Technology, grant number: Z20231811016) and the Science and Technology Planning Project of Henan Province (Henan Provincial Department of Science and Technology, grant number: 242102320224).

Institutional Review Board Statement

Not applicable.

Informed Consent Statement

Not applicable.

Data Availability Statement

All data are contained within the manuscript and are available upon request.

Acknowledgments

We thank the financial support received from Henan Provincial Department of Science and Technology (Henan Central Leading Local S&T Development Projects, grant number: Z20231811016 and the Science and Technology Planning Project of Henan Province, grant number: 242102320224).

Conflicts of Interest

The authors declare no conflicts of interest.

References

  1. Salehi, M. Global water shortage and potable water safety; Today’s concern and tomorrow’s crisis. Environ. Int. 2022, 158, 106936. [Google Scholar] [CrossRef] [PubMed]
  2. Kaekratoke, N.; Flood, A.; Crespy, D. Homopolymers and copolymers with iminodiacetic acid chelating units for scale inhibition. Desalination 2024, 583, 117643. [Google Scholar] [CrossRef]
  3. Li, C.G.; Liu, C.; Xu, W.H.; Shan, M.G.; Wu, H.X. Formation mechanisms and supervisory prediction of scaling in water supply pipelines: A review. Water Res. 2022, 222, 118922. [Google Scholar] [CrossRef]
  4. Dou, W.Y.; Peng, X.J.; Kong, L.H.; Hu, X.Y. A review on the removal of Cl (-I) with high concentration from industrial wastewater: Approaches and mechanisms. Sci. Total Environ. 2022, 824, 153909. [Google Scholar] [CrossRef] [PubMed]
  5. Zhou, J.; Chang, Y.X.; Yang, D.W.; Yang, L.; Jiang, B.; Yan, W.; Xu, H.; Xu, X. A novel membrane-free electrochemical separation-filtering crystallization coupling process for treating circulating cooling water. Water Res. 2024, 256, 121617. [Google Scholar] [CrossRef]
  6. Taqieddin, A.; Sarrouf, S.; Ehsan, M.F.; Alshawabkeh, A.N. New insights on designing the next-generation materials for electrochemical synthesis of reactive oxidative species towards efffcient and scalable water treatment: A review and perspectives. J. Environ. Chem. Eng. 2023, 11, 111384. [Google Scholar] [CrossRef]
  7. Zhu, H.F.; Zheng, F.; Lu, S.J.; Hao, L.S.; Li, B.J.; Mao, Z.X.; Long, Y.Y.; Yao, C.T.; Wu, H.; Zheng, X.; et al. Effect of electrochemical pretreatment on the control of scaling and fouling caused by circulating cooling water on heat exchanger and side-stream reverse osmosis membrane. J. Water Process Eng. 2021, 43, 102261. [Google Scholar] [CrossRef]
  8. Bharti, M.; Das, P.P.; Purkait, M.K. A review on the treatment of water and wastewater by electrocoagulation process: Advances and emerging applications. J. Environ. Chem. Eng. 2023, 11, 111558. [Google Scholar] [CrossRef]
  9. Yu, W.; Xiong, P.; Teng, J.H.; Chen, C.; Li, B.S.; Zhao, L.H.; Lin, H.J.; Shen, L.G. Advances in synthesis and application of amphoteric polymer-based water treatment agents. Desalination 2024, 574, 117280. [Google Scholar] [CrossRef]
  10. Hu, Y.L.; Chen, C.M.; Liu, S.T. State of art bio-materials as scale inhibitors in recirculating cooling water system: A review article. Water Sci. Technol. 2022, 85, 1500–1521. [Google Scholar] [CrossRef]
  11. Yi, X.Y.; Yang, S.M.; He, X.; Wang, Z.W.; Rui, M.; Tang, Y.L. Use of modified poly-epoxysuccinic acid as an efficient scale inhibitor to control CaSO4 scaling in NF processes: Performance and mechanisms. Desalination 2024, 586, 117821. [Google Scholar] [CrossRef]
  12. Adelnia, H.; Sirous, F.; Blakey, I.; Ta, H.T. Metal ion chelation of poly(aspartic acid): From scale inhibition to therapeutic potentials. Int. J. Biol. Macromol. 2023, 229, 974–993. [Google Scholar] [CrossRef] [PubMed]
  13. Zhang, T.T.; Zhang, D.Q.; Liu, D.D.; Cai, Y.J.; Gao, L.X. Polyaspartic acid modified by fluorescent carbon quantum dots as an environmentally friendly scale inhibitor for calcium sulphate. Desalination 2024, 584, 117740. [Google Scholar] [CrossRef]
  14. Husna, U.Z.; Elraies, K.A.; Shuhili, J.A.B.M.; Elryes, A.A. A review: The utilization potency of biopolymer as an eco-friendly scale inhibitors. J. Pet. Explor. Prod. Technol. 2021, 12, 1075–1094. [Google Scholar] [CrossRef]
  15. Chai, C.X.; Xu, Y.H.; Shi, S.C.; Zhao, X.W.; Wu, Y.F.; Xu, Y.; Zhang, L. Functional polyaspartic acid derivatives as eco-friendly corrosion inhibitors for mild steel in 0.5 M H2SO4 solution. RSC Adv. 2018, 8, 24970–24981. [Google Scholar] [CrossRef]
  16. Zhao, J.L.; Zhang, M.L.; Zhang, Z.K.; Ma, C.; Cao, Z.Y.; Ni, S.F.; Xu, Y. Polyaspartic acid-capped (4-[(2-aminoethyl) amino]-4-oxobutanoic acid as an efficient and green gypsum scale inhibitor and its scale inhibition mechanism. Desalination 2022, 543, 116101. [Google Scholar] [CrossRef]
  17. Jiang, W.; Yang, Y.J.; Miao, S.F.; Wan, D.Q. Fabrication of a novel chitosan/polyaspartic acid composite: A pH-tunable sorbent for efffcient adsorption of heavy metal ions and dyes from water. J. Water Process Eng. 2023, 56, 104554. [Google Scholar] [CrossRef]
  18. Yu, X.C.; Kan, J.h.; Han, J.; Liu, K.L.; Li, J.H.; Zhang, H.X.; Chen, J.X. Synthesis, scale and corrosion inhibition evaluation and mechanism of 2-aminobenzimidazole modified polyaspartic acid. J. Environ. Chem. Eng. 2024, 12, 112950. [Google Scholar] [CrossRef]
  19. Tkachenko, S.; Trukhina, M.; Ryabova, A.; Oshchepkov, M.; Kamagurov, S.; Popov, K. Fluorescent-tagged antiscalants-the new materials for scale inhibition mechanism studies, antiscalant traceability and antiscaling efficacy optimization during CaCO3 and CaSO4·2H2O scale formation. Int. J. Mol. Sci. 2023, 24, 3087. [Google Scholar] [CrossRef]
  20. Zhang, Y.; Duan, H.; Chen, E.; Li, M.; Liu, S. Physicochemical characteristics and the scale inhibition effect of air nanobubbles (A-NBs) in a circulating cooling water system. Langmuir 2023, 39, 1629–1639. [Google Scholar] [CrossRef]
  21. Namasivayam, S.K.R.; Srinivasan, S.; Samrat, K.; Priyalakshmi, B.; Kumar, R.D.; Bharani, A.; Kumar, R.G.; Kavisri, M.; Moovendhan, M. Sustainable approach to manage the vulnerable rodents using eco-friendly green rodenticides formulation through nanotechnology principles—A review. Process Saf. Environ. 2023, 171, 591–606. [Google Scholar] [CrossRef]
  22. Zhang, Y.; Zhang, N.; Zhao, P.; Niu, Z.G. Characteristics of molecular weight distribution of dissolved organic matter in bromide-containing water and disinfection by-product formation properties during treatment processes. J. Environ. Sci. 2017, 65, 179–189. [Google Scholar] [CrossRef] [PubMed]
  23. Yan, M.F.; Tan, Q.Q.; Liu, Z.; Li, H.H.; Zheng, Y.X.; Zhang, L.H.; Liu, Z.F. Synthesis and application of a phosphorous-free and non-nitrogen polymer as an environmentally friendly scale inhibition and dispersion agent in simulated cooling water systems. ACS Omega 2020, 5, 15487–15494. [Google Scholar] [CrossRef] [PubMed]
  24. Timothy, U.J.; Umoren, P.S.; Solomon, M.M.; Igwe, I.O.; Umoren, S.A. An appraisal of the utilization of natural gums as corrosion inhibitors: Prospects, challenges, and future perspectives. Int. J. Biol. Macromol. 2023, 253, 126904. [Google Scholar] [CrossRef] [PubMed]
  25. Nassar, L.; Wadi, V.S.; Hegab, H.M.; Khalil, H.; Banat, F.; Naddeo, V.; Hasan, S.W. Sustainable and green polylactic acid-based membrane embedded with self-assembled positively charged f-MWCNTs/GO nanohybrids for the removal of nutrients from wastewater. npj Clean Water 2022, 5, 57. [Google Scholar] [CrossRef]
  26. Hou, J.J.; Liu, Z.D.; Ni, X.Y. Unlocking the mysteries: Investigating the kinetic mechanism of calcium carbonate formation from phosphogypsum. Process. Saf. Environ. 2024, 182, 625–637. [Google Scholar] [CrossRef]
  27. Liu, X.; Sheng, X.; Yao, Q.; Zhao, L.; Xu, Z.; Zhou, Y. Synthesis of a new type of 2-phosphonobutane-1,2,4-tricarboxylic-acid-modified terpolymer scale inhibitor and its application in the oil field. Energy Fuels 2021, 35, 6136–6143. [Google Scholar] [CrossRef]
  28. Varvara, S.; Berghian-Grosan, C.; Damian, G.; Popa, M.; Popa, F. Combined electrochemical, raman analysis and machine learning assessments of the inhibitive properties of an 1,3,4-oxadiazole-2-thiol derivative against carbon steel corrosion in HCl solution. Materials 2022, 15, 2224. [Google Scholar] [CrossRef]
  29. Gao, X.; Wu, Y.; Huang, Q.; Jiang, Y.; Ma, D.; Ren, T. The inhibition behavior of novel ionic liquids for magnesium alloy in NaCl solution: Experimental and theoretical investigation. J. Mol. Liq. 2021, 324, 114732. [Google Scholar] [CrossRef]
  30. Pandiyarajan, S.; Manickaraj, S.S.M.; Liao, A.H.; Ramachandran, A.; Lee, K.Y.; Chuang, H.C. Recovery of Al2O3 from hazardous Al waste as a reinforcement particle for high-performance Ni/Al2O3 corrosion resistance coating via ultrasonic-aided supercritical-CO2 electrodeposition. Chemosphere 2023, 313, 137626. [Google Scholar] [CrossRef]
  31. GB/T 16632−2019; Determination of Scale Inhibition Performance of Water Treatment Chemicals-Calcium Carbonate Precipitation Method. The Standardization Administration of China: Beijing, China, 2019.
  32. QSY126−2014; Specifications of Corrosion and Scale Inhibitors for Oil Field Water Treatment. The China National Petroleum Corporation China: Beijing, China, 2014.
  33. Benslimane, S.; Bouhidel, K.E.; Ferfache, A.; Farhi, S. Mechanistic study of the synergetic inhibiting effects of Zn2+, Cu2+ and Mg2+ ions on calcium carbonate precipitation. Water Res. 2020, 186, 116323. [Google Scholar] [CrossRef] [PubMed]
  34. Liu, B.; Ding, X.L.; Dai, Y.M.; Wan, L. A study of guar gum derivatives as green kinetic hydrate inhibitors. J. Environ. Chem. Eng. 2024, 12, 112075. [Google Scholar] [CrossRef]
  35. Raj, R.M.; Ganesan, S.; Suganthi, S.; Vignesh, S.; Hatamleh, A.A.; Alnafisi, B.K.; Venkatesan, R.; Raj, V.; Lo, H.M. Facile construction of cost-effective zinc-aluminium polymeric framework for efficient removal of selective both drug and dye from an aqueous medium. Chemosphere 2023, 311, 137105. [Google Scholar] [CrossRef]
  36. Zeng, T.T.; Ma, D.L.; Gui, Y.G. Gas-Sensing Performance of Metal Oxide Heterojunction Materials for SF6 Decomposition Gases: A DFT Study. Int. J. Mol. Sci. 2024, 25, 8009. [Google Scholar] [CrossRef] [PubMed]
Figure 1. Infrared (FTIR, (a)) and Nuclear Magnetic Resonance spectra (1H-NMR, (b)) of PASP and PASP/5–AVA.
Ijms 25 10150 g001
Figure 2. The anti-CaCO3 scale efficiency of PASP and PASP/5–AVA. (a) With different concentrations; (b) Different experimental temperatures (the dosage of inhibitor is 30 mg/L); (c) Heating time (the dosage of inhibitor is 30 mg/L).
Ijms 25 10150 g002
Figure 3. The anti-CaSO4 scale efficiency of PASP and PASP/5–AVA. (a) With different concentrations; (b) Different experimental temperatures (the dosage of inhibitor is 3 mg/L); (c) Heating time (the dosage of inhibitor is 3 mg/L).
Ijms 25 10150 g003
Figure 4. The morphology of CaCO3 (ac) and CaSO4 (df) scales under SEM at different dosages. (a,d) In the absence of antiscalant; (b) in the presence of 30 mg/L PASP; (c) in the presence of 30 mg/L PASP/5–AVA; (e) in the presence of 3 mg/L PASP; (f) in the presence of 3 mg/L PASP/5–AVA.
Ijms 25 10150 g004
Figure 5. XRD patterns of CaSO4 (a) and CaCO3 (b) scales.
Ijms 25 10150 g005
Figure 6. XPS spectra of Ca 2p with CaCO3 (ac) and CaSO4 (df) scales. (a,d) In the absence of antiscalant; (b) in the presence of 30 mg/L PASP; (c) in the presence of 30 mg/L PASP/5–AVA; (e) in the presence of 3 mg/L PASP; (f) in the presence of 3 mg/L PASP/5–AVA.
Ijms 25 10150 g006
Figure 7. The relationship curves between pH values and CaCO3 scale solutions. (a) In the absence of antiscalant; (b) in the presence of 4 mg/L PASP; (c) in the presence of 4 mg/L PASP/5–AVA; (d) the relation curves between Intind and 1/(InS)2 with and without antiscalants.
Ijms 25 10150 g007
Figure 8. The potentiodynamic polarization curves of PASP (a) and PASP/5–AVA (b) at different concentrations in 3.5% NaCl solution.
Ijms 25 10150 g008
Figure 9. Impedance graph (a) for PASP and PASP/5–AVA with different concentrations and the corre-sponding analog equivalent circuit model (b).
Ijms 25 10150 g009
Figure 10. The PASP/5–AVA optimization structure diagram. The red ball (●) represents the N atom, the red ball (●) represents the O atom, the gray ball (●) represents the C atom, and the white ball (●) represents the H atom.
Ijms 25 10150 g010
Figure 11. The geometrically optimized structures and molecular orbital density distribution of PASP and PASP/5–AVA according to quantum chemical calculation results.
Ijms 25 10150 g011
Figure 12. Preparation route of the PASP (a) and PASP/5–AVA (b) modified copolymer.
Ijms 25 10150 g012
Table 1. The Mn, Mw, and Ð of PASP and PASP/5–AVA.
SampleMnMwÐ
PASP177820391.147
PASP/5–AVA11,32814,1091.245
Table 2. The tind values of the CaCO3 solutions with and without antiscalants in the pH measurement process.
Different Concentrations of CaCO3 Solution (mol/L)Antiscalants
BlankPASP PASP/5–AVA
tind (min)0.0151.502.2553.71
0.020.751.256.00
0.0250.540.752.19
0.030.40.51.05
Table 3. The electrochemical polarization parameters of carbon steel in 3.5% NaCl solution containing PASP and PASP/5–AVA with different concentrations.
InhibitorsC
(mg/L)
Ecorr
(Vvs.SCE)
βa
(mV/dec)
βc
(mV/dec)
Icorr
(mA/cm2)
ηp (%)θ
Blank0.6775202.55102.993.516--
PASP300.6228267.81109.973.12910.720.11
500.6296250.06104.342.95515.960.16
700.6294278.71100.392.88318.120.18
1000.6208259.27104.132.74921.840.22
PASP/5–AVA300.6050153.0117.61.39531.70.32
500.6142141.8113.41.38632.10.32
700.6166149.4114.91.11845.20.45
1000.6047143.9118.01.00151.00.51
Table 4. Corrosion electrochemical parameters of 20# carbon steel measured by EIS in 3.5% NaCl solution at 298 K without and with inhibitors at various concentrations.
InhibitorsC
(mg/L)
Rct
(Ohm.cm2)
Cdl
(F/cm2)
χ2 (×10−3)ηp (%)
Blank144.30.409370.3777-
PASP10144.80.371480.31266.73
30145.60.359090.424012.28
50147.80.323990.436020.86
70154.50.317490.417822.44
100205.40.311480.396223.91
PASP/5–AVA1057.40.331370.257119.96
3068.520.290420.416729.01
5070.460.271680.365433.63
7074.020.218420.360046.64
10075.270.207220.3994749.38
Table 5. Quantum chemical parameters of PASP and PASP/5–AVA.
InhibitorEHOMO (eV)ELUMO (eV)E (eV)χ (eV)η (eV)N
PASP−7.1724−1.27435.89814.22332.94910.4708
PASP/5–AVA−6.4474−1.40855.03894.03792.62940.5633
Table 6. The reagents and equipment used in this experiment.
NamePurchasing Company
ReagentsPolysuccinimide (PSI, Mw = 7000, AR)Wuhan Yuancheng Gongyi Technology Company Limited (Wuhan, China)
5-Aminovaleric acid (AR)Tianjin De’en Chemical Reagents Company Limited (Tianjin, China)
Anhydrous sodium sulfate (AR, 99%)Tianjin Komi Chemical Reagent Company Limited (Tianjin, China)
Sodium carbonate (AR, 99.8%)Tianjin Komi Chemical Reagent Co., Ltd. (Tianjin, China)
Potassium hydroxide (AR, 90%)Tianjin Komi Chemical Reagent Co., Ltd. (Tianjin, China)
Anhydrous borax (AR, 95%)Shanghai Shaoyuan Chemical Reagent Co., Ltd. (Shanghai, China)
Calcium chloride (AR, 99.9%)Shanghai Shaoyuan Chemical Reagent Co., Ltd. (Shanghai, China)
Potassium chloride (AR, 99.999%)Shanghai Shaoyuan Chemical Reagent Co., Ltd. (Shanghai, China)
Sodium chloride (AR, 99%)Shanghai Shaoyuan Chemical Reagent Co., Ltd. (Shanghai, China)
Ethylenediaminetetraacetic acid disodium salt dihydrate (EDTA)Shanghai Energy Chemical Reagent Co. Ltd. (Shanghai, China)
Absolute ethanolAnhui Ante Food Co., Ltd. (Anhui China)
Ethanol absolute (AR, 99.5%)Anhui Ante Food Co., Ltd. (Anhui, China)
Hydrochloric acid (ω = 36%)China Pingmei Shenma Group Kaifeng Dongda Chemical Co., Ltd. (Kaifeng, China)
EquipmentAn AVANCE 400 nuclear magnetic resonance spectrometerBruker Co., Ltd. (Bilerika, Germany)
An ESCALAB 250Xi X-ray photoelectron spectrometerThermo Fisher Scientific Co., Ltd. (waltham, USA)
A JSM-7610F SEMJapan Electronics Co., Ltd. (Tokyo Metropolis, Japan)
An HH-601 constant-temperature water tank Jintan Jingda Instrument Manufacturing Co., Ltd. (Changzhou, China)
A Nano ZS particle size and zeta potential analyzerMalvery Instruments Ltd. (Marvin, England)
A PL-GPC50 gel permeation chromatographAgilent Technology Co., Ltd. (Palo Alto City, USA)
A DDS-11A conductivity meterINASE Scientific Instrument Co., Ltd. (Shanghai, China)
A D8 Advance X-ray powder diffractometerBruker Co., Ltd. (Bilerika, Germany)
A CHI660E electrochemical workstationChenhua Instrument Co., Ltd. (Shanghai, China)
A VERTEX 70 Fourier transform infrared spectrometerBruker Co., Ltd. (Bilerika, Germany)
Disclaimer/Publisher’s Note: The statements, opinions and data contained in all publications are solely those of the individual author(s) and contributor(s) and not of MDPI and/or the editor(s). MDPI and/or the editor(s) disclaim responsibility for any injury to people or property resulting from any ideas, methods, instructions or products referred to in the content.

