Article

Applicability and Advantage of Mitochondrial Metagenomics and Metabarcoding in Spider Biodiversity Survey

Key Laboratory of Zoological Systematics and Application of Hebei Province, Institute of Life Science and Green Development, College of Life Sciences, Hebei University, Baoding 071002, China
*
Authors to whom correspondence should be addressed.
Diversity 2023, 15(6), 711; https://doi.org/10.3390/d15060711
Submission received: 30 April 2023 / Revised: 18 May 2023 / Accepted: 25 May 2023 / Published: 27 May 2023

Abstract

:
Spiders are an extraordinary animal group with extremely high diversity in species, morphology, and behavior. Accurate estimation of species diversity and community composition is essential in spider ecological studies as well as applications of biodiversity surveys and monitoring. However, spider biodiversity surveys still largely utilize the morphology-based approach, which is often time-consuming and highly dependent on taxonomic experts. In this study, we tested the applicability of mitochondrial metagenomic and metabarcoding methods in the biodiversity survey of spiders. Local mitogenome and barcode databases of 62 reference species were built using next-generation sequencing and Sanger sequencing technologies. The performances of mitochondrial metagenomics, metabarcoding, and morphological methods were compared for five plot samples of spiders. The results show that the molecular methods (mitochondrial metagenomics and metabarcoding) have a higher species detection rate compared with the traditional morphological biodiversity method, which is largely due to their capability of incorporating the large proportion of immature specimens in each plot into the biodiversity assessment. Our study demonstrates the great potential of molecular approaches in advancing spider biodiversity and community ecology studies and suggests that by combining both mitochondrial metagenomic and metabarcoding methods we could provide more accurate and reliable biodiversity assessment for spiders.

1. Introduction

Evolutionary and ecological research often relies on our ability to correctly identify species and reliably estimate biodiversity [1]. Traditional biodiversity assessment with morphology-based taxonomy is costly in terms of manpower, time, and money, and is largely dependent on the personal knowledge and experience of the identification experts [2]. Although traditional biological classification based on morphological characteristics and comparative anatomy is fine to recognize groups with significant morphological characteristics and less species diversity, e.g., vertebrates and higher plants, it is often not efficient in organisms such as arthropods, nematodes, etc., which are generally small in size and have subtle morphological differences yet great species diversity [3]. The morphological characteristics of many organisms are affected by the environment and developmental stages, which easily causes classification errors and misleads the biodiversity results [4]. In addition, although about 1.7 million species have been named so far, there may be tens of millions of species on Earth, and many more species remain to be discovered [5]. Therefore, the traditional approach of applying solely morphological techniques could not satisfy the increasing demands on fast and accurate biodiversity surveys and monitoring in various fields such as the conservation of biodiversity and community ecology [4].
The DNA barcode, proposed by Professor Paul Hebert in 2003, refers to the relatively short standard DNA fragments, which can be easily amplified and have sufficient interspecific sequence variation to represent the species [6] and has been widely applied in various fields such as species delimitation, biodiversity, and ecology [7,8,9,10]. At present, the most commonly used barcode for animals is the 658 bp fragment of the mitochondrial cytochrome c oxidase subunit I (COI) gene. The DNA metabarcoding method applies high-throughput sequencing technology to obtain barcode sequences from a pooled sample and then utilizes the established barcode reference database to uncover the biodiversity information in the pooled sample (Figure 1). Metabarcoding has been considered a powerful biological monitoring tool and played an important role in environmental management, biological invasion, and food safety [11,12,13].
Mitochondrial metagenomics also applies high-throughput sequencing, but in contrast to metabarcoding, it does not involve amplifying certain barcode sequences using primers (e.g., COI), and acquires the diversity content of the mixed samples by mapping the sequenced reads to the established database of reference mitogenomes [14] (Figure 1). This method is fast and efficient and has even shown potential in the diversity analysis of environmental samples of mixed specimens [15,16]. In a study of wild bee communities, the mitochondrial metagenomic approach has a higher accuracy in species detection than the metabarcoding method [2]. The mitochondrial metagenomic approach has been successfully applied to investigate the species abundance and community structure of various arthropod groups, i.e., leaf beetles [14], soil beetles [17], and wild bees [2]. However, the mitochondrial metagenomic method has not yet been applied to spiders.
Spiders (Order Araneae) are one of the most diverse lineages of terrestrial predators, with over 50,000 species described worldwide [18]. Spider taxonomy and identification are highly dependent on genitalic features. The immature stages of spiders are usually not included in the identification guide, and thus, it is difficult to accurately identify species. In contrast, the molecule-based approaches are not affected by the developmental stages of specimens. Although the mitochondrial genomes and barcode sequences have been previously explored and applied in spider phylogenetic and taxonomic studies [19,20], the molecule-based methods have rarely been applied in spider diversity surveys and community ecology studies (see studies by Kirse et al. [21] and Domenech et al. [4]). So far, the dominant approach in these fields, especially in China, is still the traditional morphology-based identification [22,23,24].
In this study, we used the Baiyangdian Lake, China as the study site, and built the local reference databases of mitogenome and barcode sequences of spiders from this region. The species diversity of plot samples of spiders was analyzed using both mitochondrial metagenomic and metabarcoding methods, as well as the traditional morphological approach. By applying and comparing different methods in the spider diversity survey, we aim to test the applicability of mitochondrial metagenomics and metabarcoding in spider biodiversity and community ecology studies and provide a rapid spider species detection and identification protocol for future research.

2. Materials and Methods

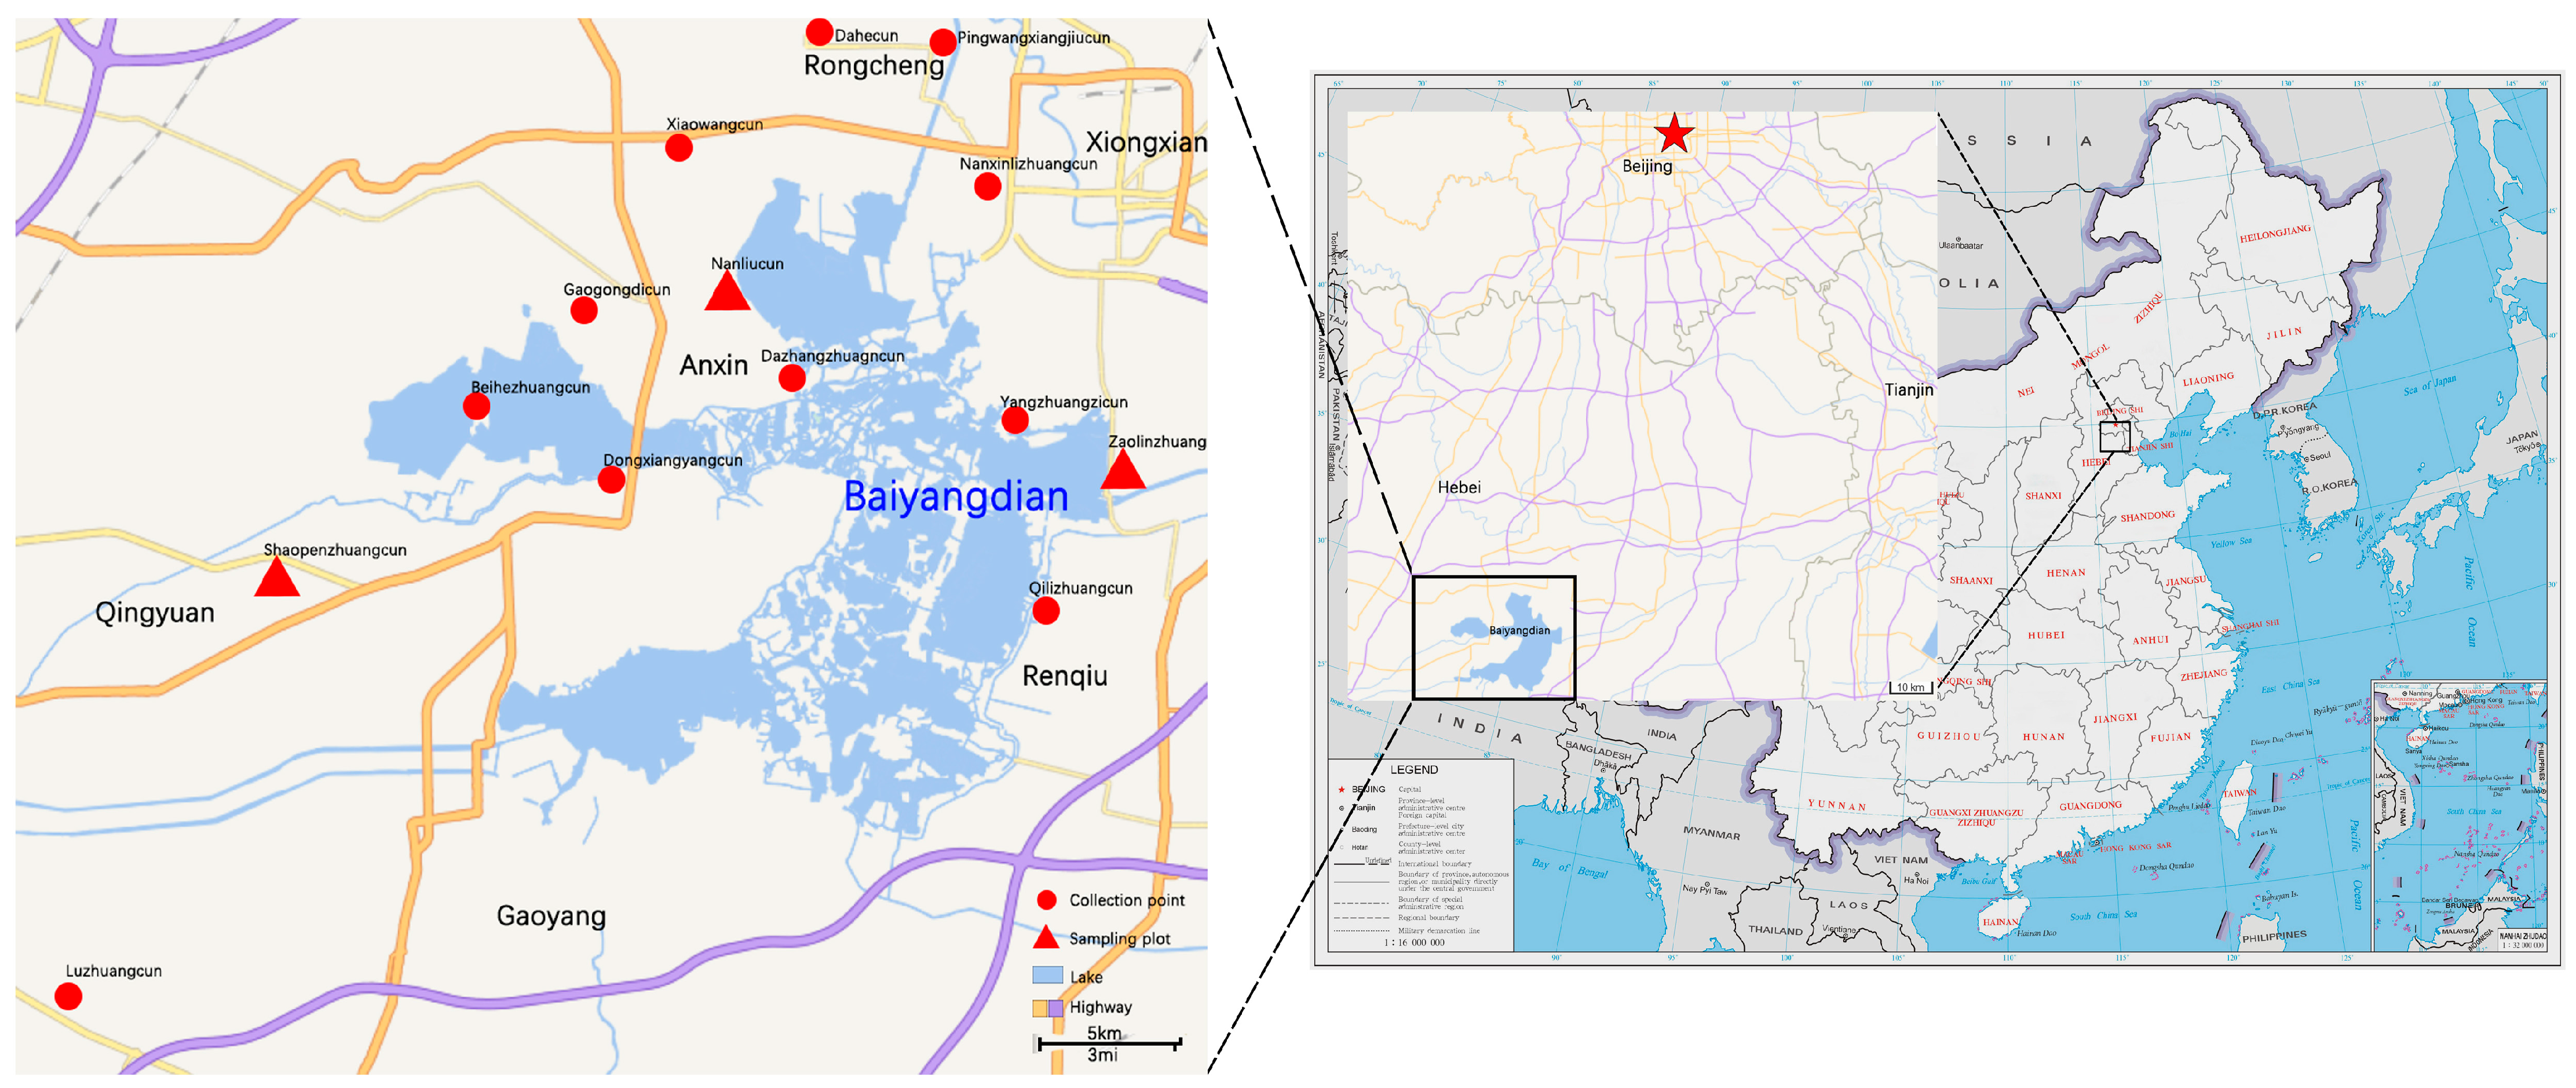
2.1. Sampling Sites and Collecting Spider Specimens

Spider specimens were collected from 14 sites around the Baiyangdian Wetland, Hebei Province, China (N 38.94°, E 115.97°, 559 m a.s.l.) in October 2020 and September 2021 (Figure 2). A variety of collecting methods, including leaf-litter sifting, net sweeping, hand collecting, etc., were conducted in order to obtain as many spider species as possible for building the local barcode and mitogenome reference databases. In addition, the standardized plot sampling protocol was conducted from three of the 14 sites, and five plot samples were obtained in order to test the efficiency of mitochondrial metagenomic and metabarcoding approaches in the spider ecology and biodiversity studies. The sampling plot was 10 m × 10 m in size. The standardized sampling protocol was modified from Cardoso et al. [25]. In summary, for each plot sample: five people collected spider specimens for an hour; during the first 30 min, two people conducted net sweeping and three people conducted leaf-litter sifting; then, all five people conducted hand-collecting during the last 30 min. All specimens were preserved in 95% alcohol. The adult specimens from general collecting were identified to species for the information on local spider species diversity. All the adult spider specimens from the five plot samples were also identified to species in order to compare the species detection efficiency of the morphological method with that of mitochondrial metagenomic and metabarcoding methods. The identification of adult spider specimens followed the general protocol of spider taxonomic studies: The specimens were first sorted into families based on the body form and genitalic characters, and then the genus and species were identified by comparing with the diagnostic descriptions and illustrations in the literature [26,27]. Specimens were examined under a Leica M205A stereomicroscope. All the specimens used in this study are currently deposited in the Museum of Hebei University, Baoding, China (MHBU).

2.2. Mitogenome Assembly, Annotation, and Phylogenetic Analysis

For each reference species, the genomic DNA was extracted with the DNeasy Blood & Tissue Kit (QIAGEN, Hilden, Germany) from either legs or cephalothorax. The sequencing library with an insert size of about 300~500 bp was produced from each specimen using the NEXTFLEX Rapid DNA-Seq Kit 2.0 (Bioo Scientific, Austin, TX, USA) following the manufacturer’s protocol. The prepared library was sequenced at 5 Gb depth on the Illumina Novaseq 6000 platform with 150 bp paired-end reads at Novogene (Tianjin, China). Raw data proceeded with quality control at Novogene to remove reads of low quality (with ≥10% unidentified nucleotides, or with >50% bases having phred quality <5, or with >10 nt aligned to the adapter, or the read 1 and read 2 of the two paired-end reads were completely identical). The remaining cleaned data were used to assemble the complete mitochondrial genome using MitoZ [28]. Genome annotation was first performed with the annotation module in MitoZ, and then further polished in the MITOS webserver [29]. All annotation results were manually checked and corrected, and all sequences were uploaded to NCBI (see Supplementary Table S1 for accession numbers). All obtained mitochondrial genome sequences, as well as the mitogenome of Argiope bruennichi (Scopoli, 1772) (Araneae, Araneidae) (KJ594561) downloaded from NCBI, were included in the local spider mitogenome reference database.
Phylogenetic analysis was conducted using the 13 protein-coding genes (PCGs) from the reference mitogenomes. The mitogenomes of A. bruennichi, Cyriopagopus hainanus (Liang, Peng, Huang & Chen, 1999) (Araneae, Theraphosidae) (NC_053738) and Ornithoctonus huwena (von Wirth, 1991) (Araneae, Theraphosidae) (NC_005925) downloaded from the NCBI website were included in the phylogenetic analysis, with C. hainanus and O. huwena as the outgroups. First, PCGs were imported into PhyloSuite and were aligned with MAFFT v7.505 using ‘--auto’ strategy and codon alignment mode [30,31]. The alignments were refined using the codon-aware program MACSE v2.06 [32]. Poorly aligned positions and divergent sequences were removed using Gblocks v0.91b [33] with the following parameter settings: minimum number of sequences for a conserved/flank position (32/32), maximum number of contiguous non-conserved positions (8), minimum length of a block (10), allowed gap positions (with half). ModelFinder v2.2.0 [34] was used to select the best-fit partition model (Edge-linked) using BIC criterion. The best-fit partitioning schemes and models (see Supplementary Table S4) were utilized in the maximum-likelihood (ML) analysis based on the nucleotide sequences of the 13 PCGs using IQ-TREE v2.2.0 [35], and an ultrafast bootstrap analysis [36] with 20,000 replicates was conducted to assess the node supports.

2.3. Mitochondrial Metagenomics

Total genomic DNA was extracted from each of the five plot samples. Different body parts were dissected from the specimens of each plot according to their body size so that the amount of tissue of each specimen used for DNA extraction was roughly similar: whole body (body length < 2 mm); cephalothorax (body length 2 mm~4 mm); eight legs (body length 4 mm~6 mm); four legs (body length 6 mm~8 mm); one leg or part of one leg (body length > 8 mm). All spider tissues from one plot were homogenized and then the total DNA was extracted using the DNeasy Blood & Tissue Kit (QIAGEN, Hilden, Germany). The sequencing library was constructed for each plot DNA using the NEXTFLEX Rapid DNA-Seq Kit 2.0 (Bioo Scientific, Austin, TX, USA), and then sequenced at 5 Gb depth on the Illumina Novaseq 6000 platform with 150 bp paired-end reads at Novogene (Tianjin, China).
After quality control of the sequenced raw reads at Novogene following the above protocol, the cleaned paired-end reads from each plot sample were combined (see Supplementary Table S3 for SRA accession numbers). A searchable database with the 62 reference mitogenome sequences was built using the makeblastdb command, and the repeated sequences were filtered using Windowmasker [37]. The interleaved reads were then mapped onto the reference mitogenomes database using Hs-blastn [38] at high stringency: 100% read coverage and 100% identity. The species was classified as present in the plot sample if there were reads mapped to its mitogenome sequence.

2.4. PCR-Based Metabarcoding

For each of the reference species, the 658 bp of COI barcode region was amplified using the primers LCO-1490 (5′-GGTCAACAAATCATAAAGATATTGG-3′) and HCO-2198 (5′-TAAACTTCAGGGTGACCAAAAAATCA-3′). PCRs were performed in 25 μL reaction volumes containing 12.5 μL mix (Cwbio, Jiangsu, China), 2.5 μL each primer, 2 μL genomic DNA, and 5.5 μL ddH2O, and followed the thermocycling profile of 95°C for 3 min; 35 cycles of 95 °C for 30 s, 45 °C for 45 s and 72 °C for 45 s; and a final extension of 72 °C for 7 min. PCR products were visualized on 2% agarose gels and then purified and sequenced at Azenta (Tianjin, China). The obtained COI sequences, as well as the COI sequences of Bathyphantes gracilis (Blackwall, 1841) (Araneae, Linyphiidae) (KM836935) and Pirata subpiraticus (Bösenberg & Strand, 1906) (Araneae, Lycosidae) (KY467116) downloaded from NCBI, were used to construct the barcode database after quality inspection (see Supplementary Table S2 for accession numbers).
For the five plot samples, we used the same DNA extracted from each plot sample to amplify the 418 bp of the COI barcode region with the primers III_B_F and Fol_degen_rev [39,40]. To build the Illumina-ready PCR amplicons, the 6-bp index sequences were added to the forward and reverse primers. PCR reactions and downstream metabarcoding analyses were carried out at Majorbio (Shanghai, China). Each plot sample was amplified in three independent PCR reactions. The PCR reaction mixture including 4 μL 5× Fast Pfu buffer, 2 μL 2.5 mM dNTPs, 0.8 μL each primer (5 μM), 0.4 μL Fast Pfu polymerase, 10 ng of template DNA, and ddH2O to a final volume of 20 µL. The thermocycling profile was as follows: 95 °C for 3 min; 37 cycles of 95 °C for 30 s, 55° for 30 s, and 72 °C for 45 s; and a final extension of 72 °C for 10 min. PCR products were pooled and sequenced on the Illumina MiSeq platform with 300 bp paired-end reads at Majorbio (Shanghai, China).
Raw sequencing reads were demultiplexed (see Supplementary Table S3 for SRA accession numbers), quality-filtered using Fastp v0.19.6 [41], and then merged with FLASH v1.2.11 [42] under the following criteria: (i) samples were demultiplexed according to the barcode (exact barcode matching) and primers (maximum two nucleotide mismatch in primer matching was allowed); (ii) the 300 bp reads were truncated at any site receiving an average quality score of <20 over a 50 bp sliding window, and the truncated reads shorter than 50 bp were discarded, reads containing ambiguous characters were also discarded; (iii) only the reads with overlapping sequences longer than 10 bp were assembled with the maximum mismatch ratio of overlap region as 0.2, and reads that could not be assembled were discarded. The resulting high-quality sequences were clustered into operational taxonomic units (OTUs) at 97% similarity cutoff using UPARSE v7.1 [43] with a greedy algorithm that performs chimera filtering. The taxonomy of each COI gene sequence was analyzed using the naive Bayesian classifier [44] against the COI barcode database. The species was classified as present if the OTU was assigned to the species-level taxonomy.

3. Results

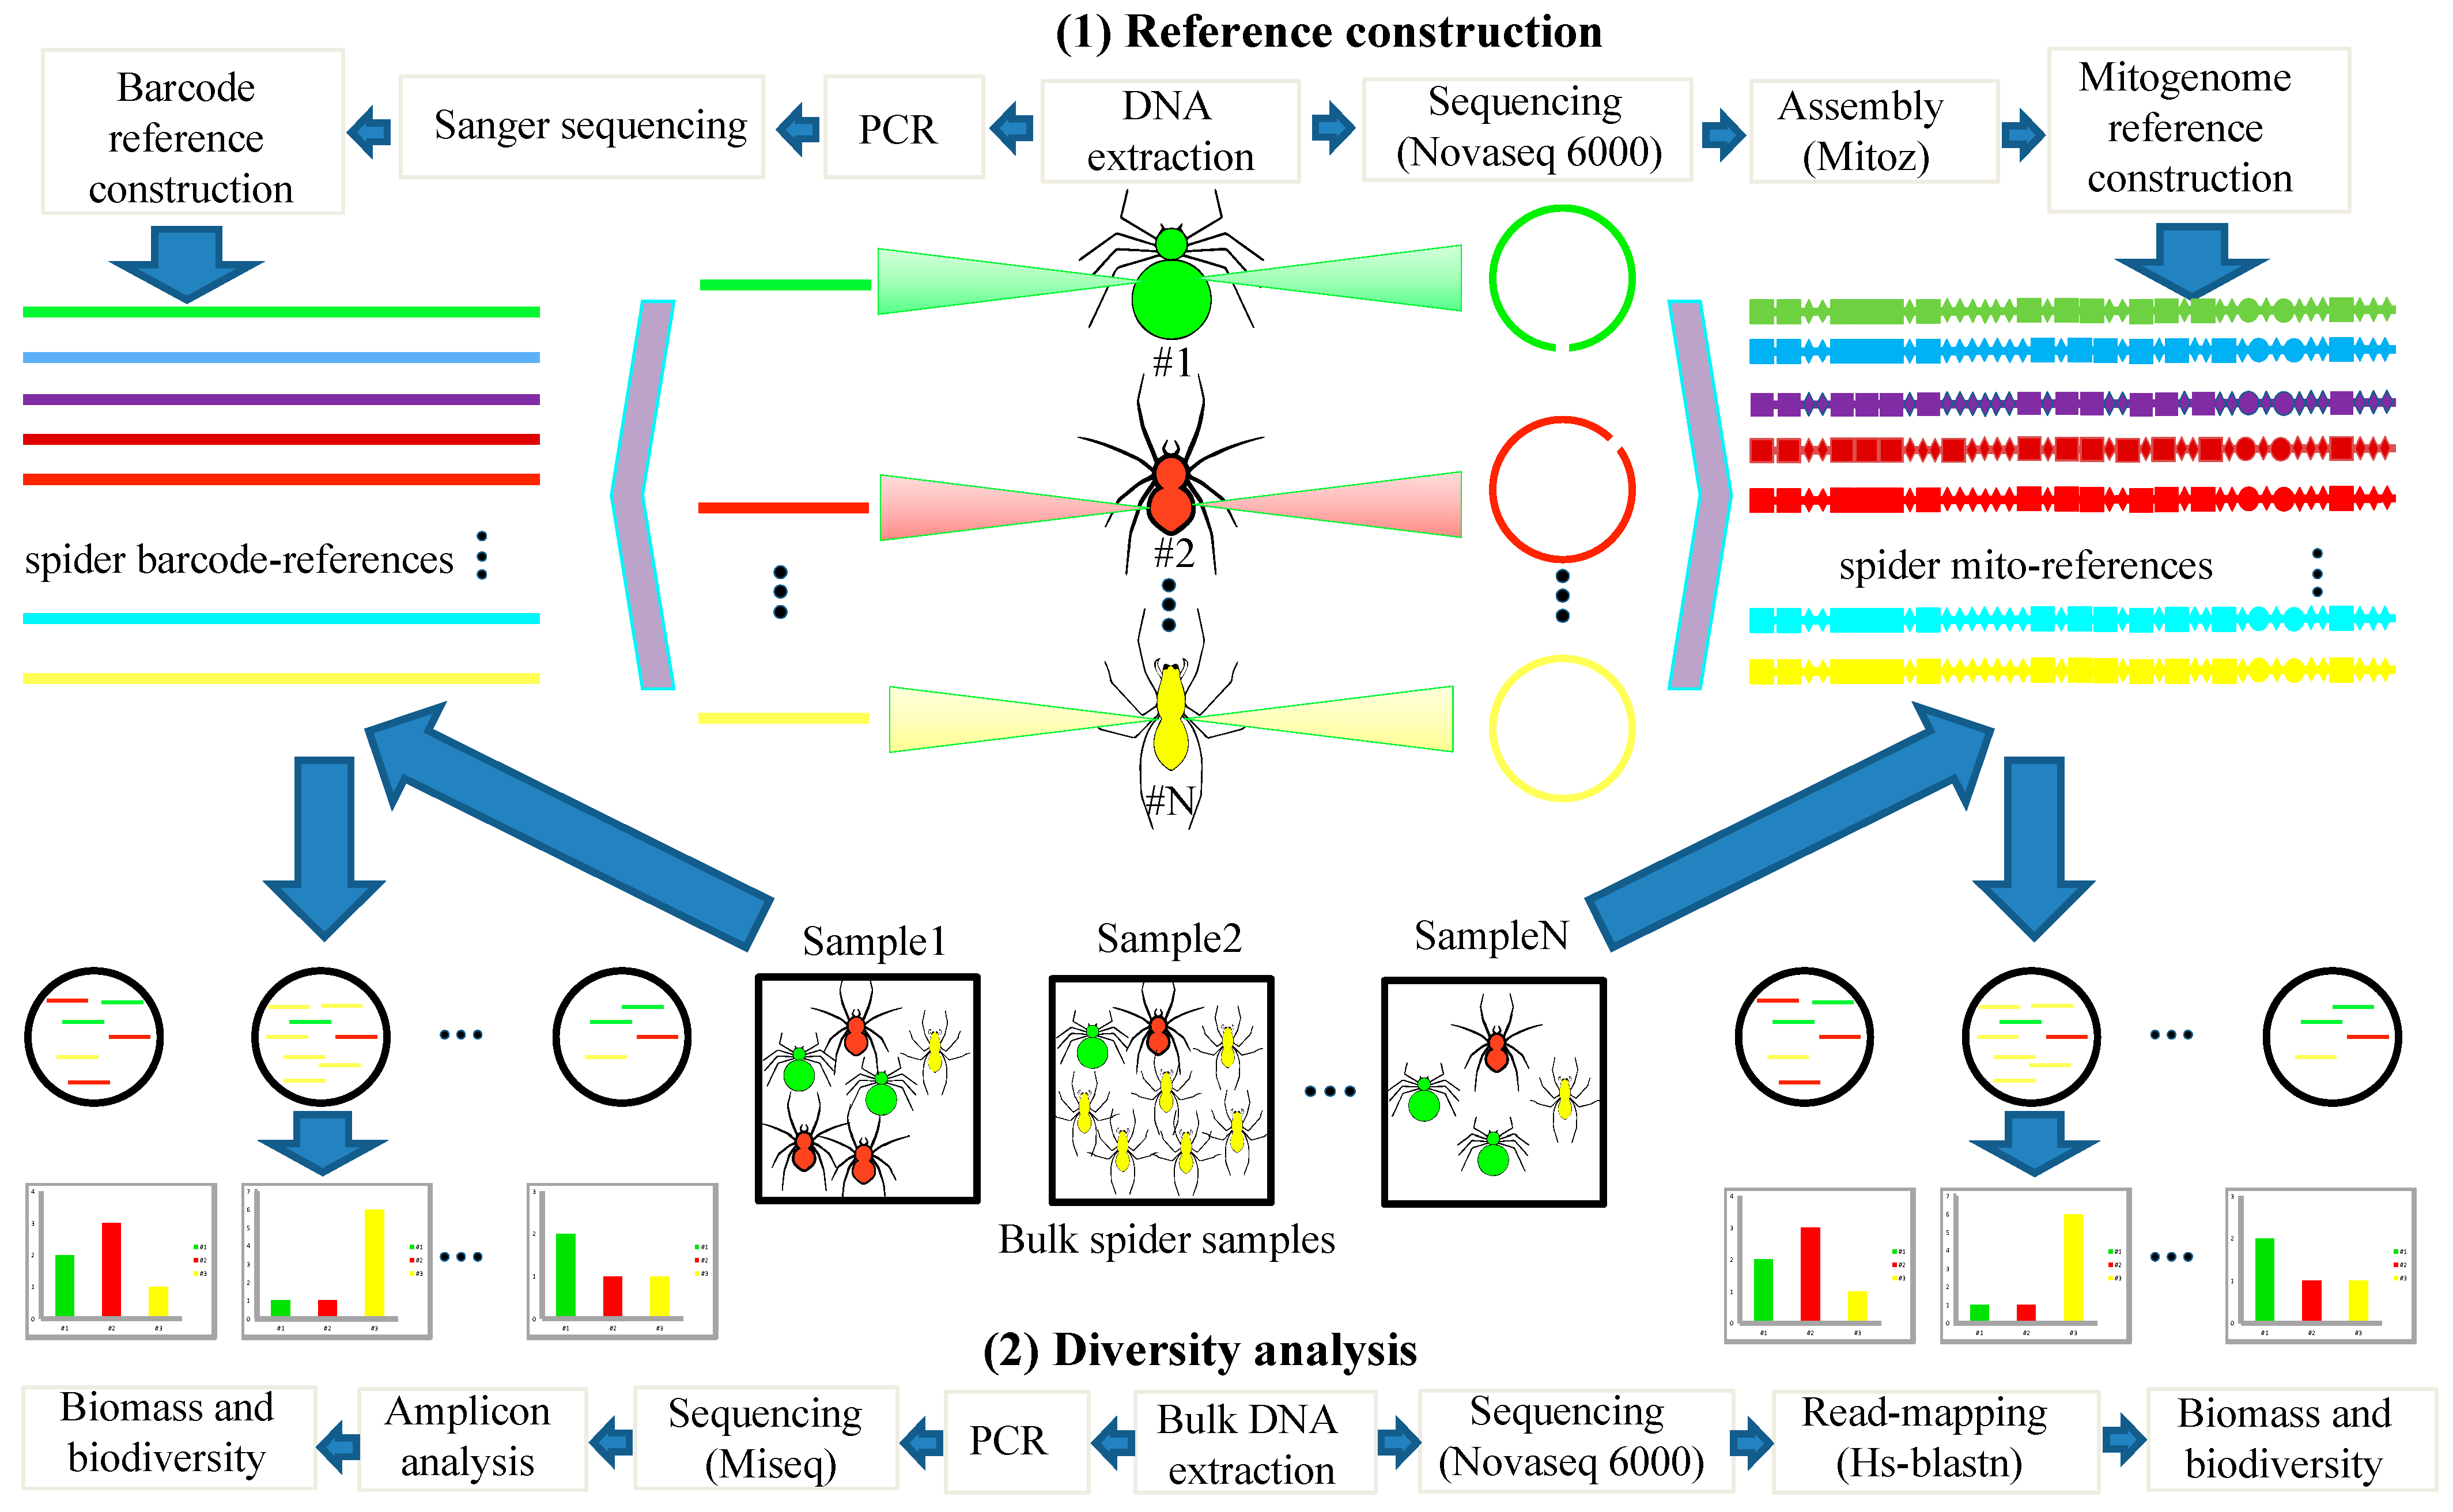
3.1. Establishment of Local Mitogenome and Barcode Reference Databases

During the general species diversity survey, a total of 2213 spider specimens were collected. They were identified as 62 species, all of which were used for the subsequent construction of mitogenome and barcode reference databases (see Supplementary Tables S1, S2 and S5 for details). The mitogenome of A. bruennichi and the COI sequences of B. gracilis and P. subpiraticus were downloaded from NCBI and included in the databases. The obtained mitogenome and COI sequences were submitted to NCBI with the accession numbers provided in Supplementary Tables S1 and S2. Of the 61 newly sequenced mitogenomes, 25 are complete circular mitochondrial genome sequences, 36 have all 13 protein-coding genes annotated, and the other 25 have 10~12 protein-coding genes annotated; the assembled mitogenome length is 8145~14,735 bp (see Supplementary Table S1 for details).

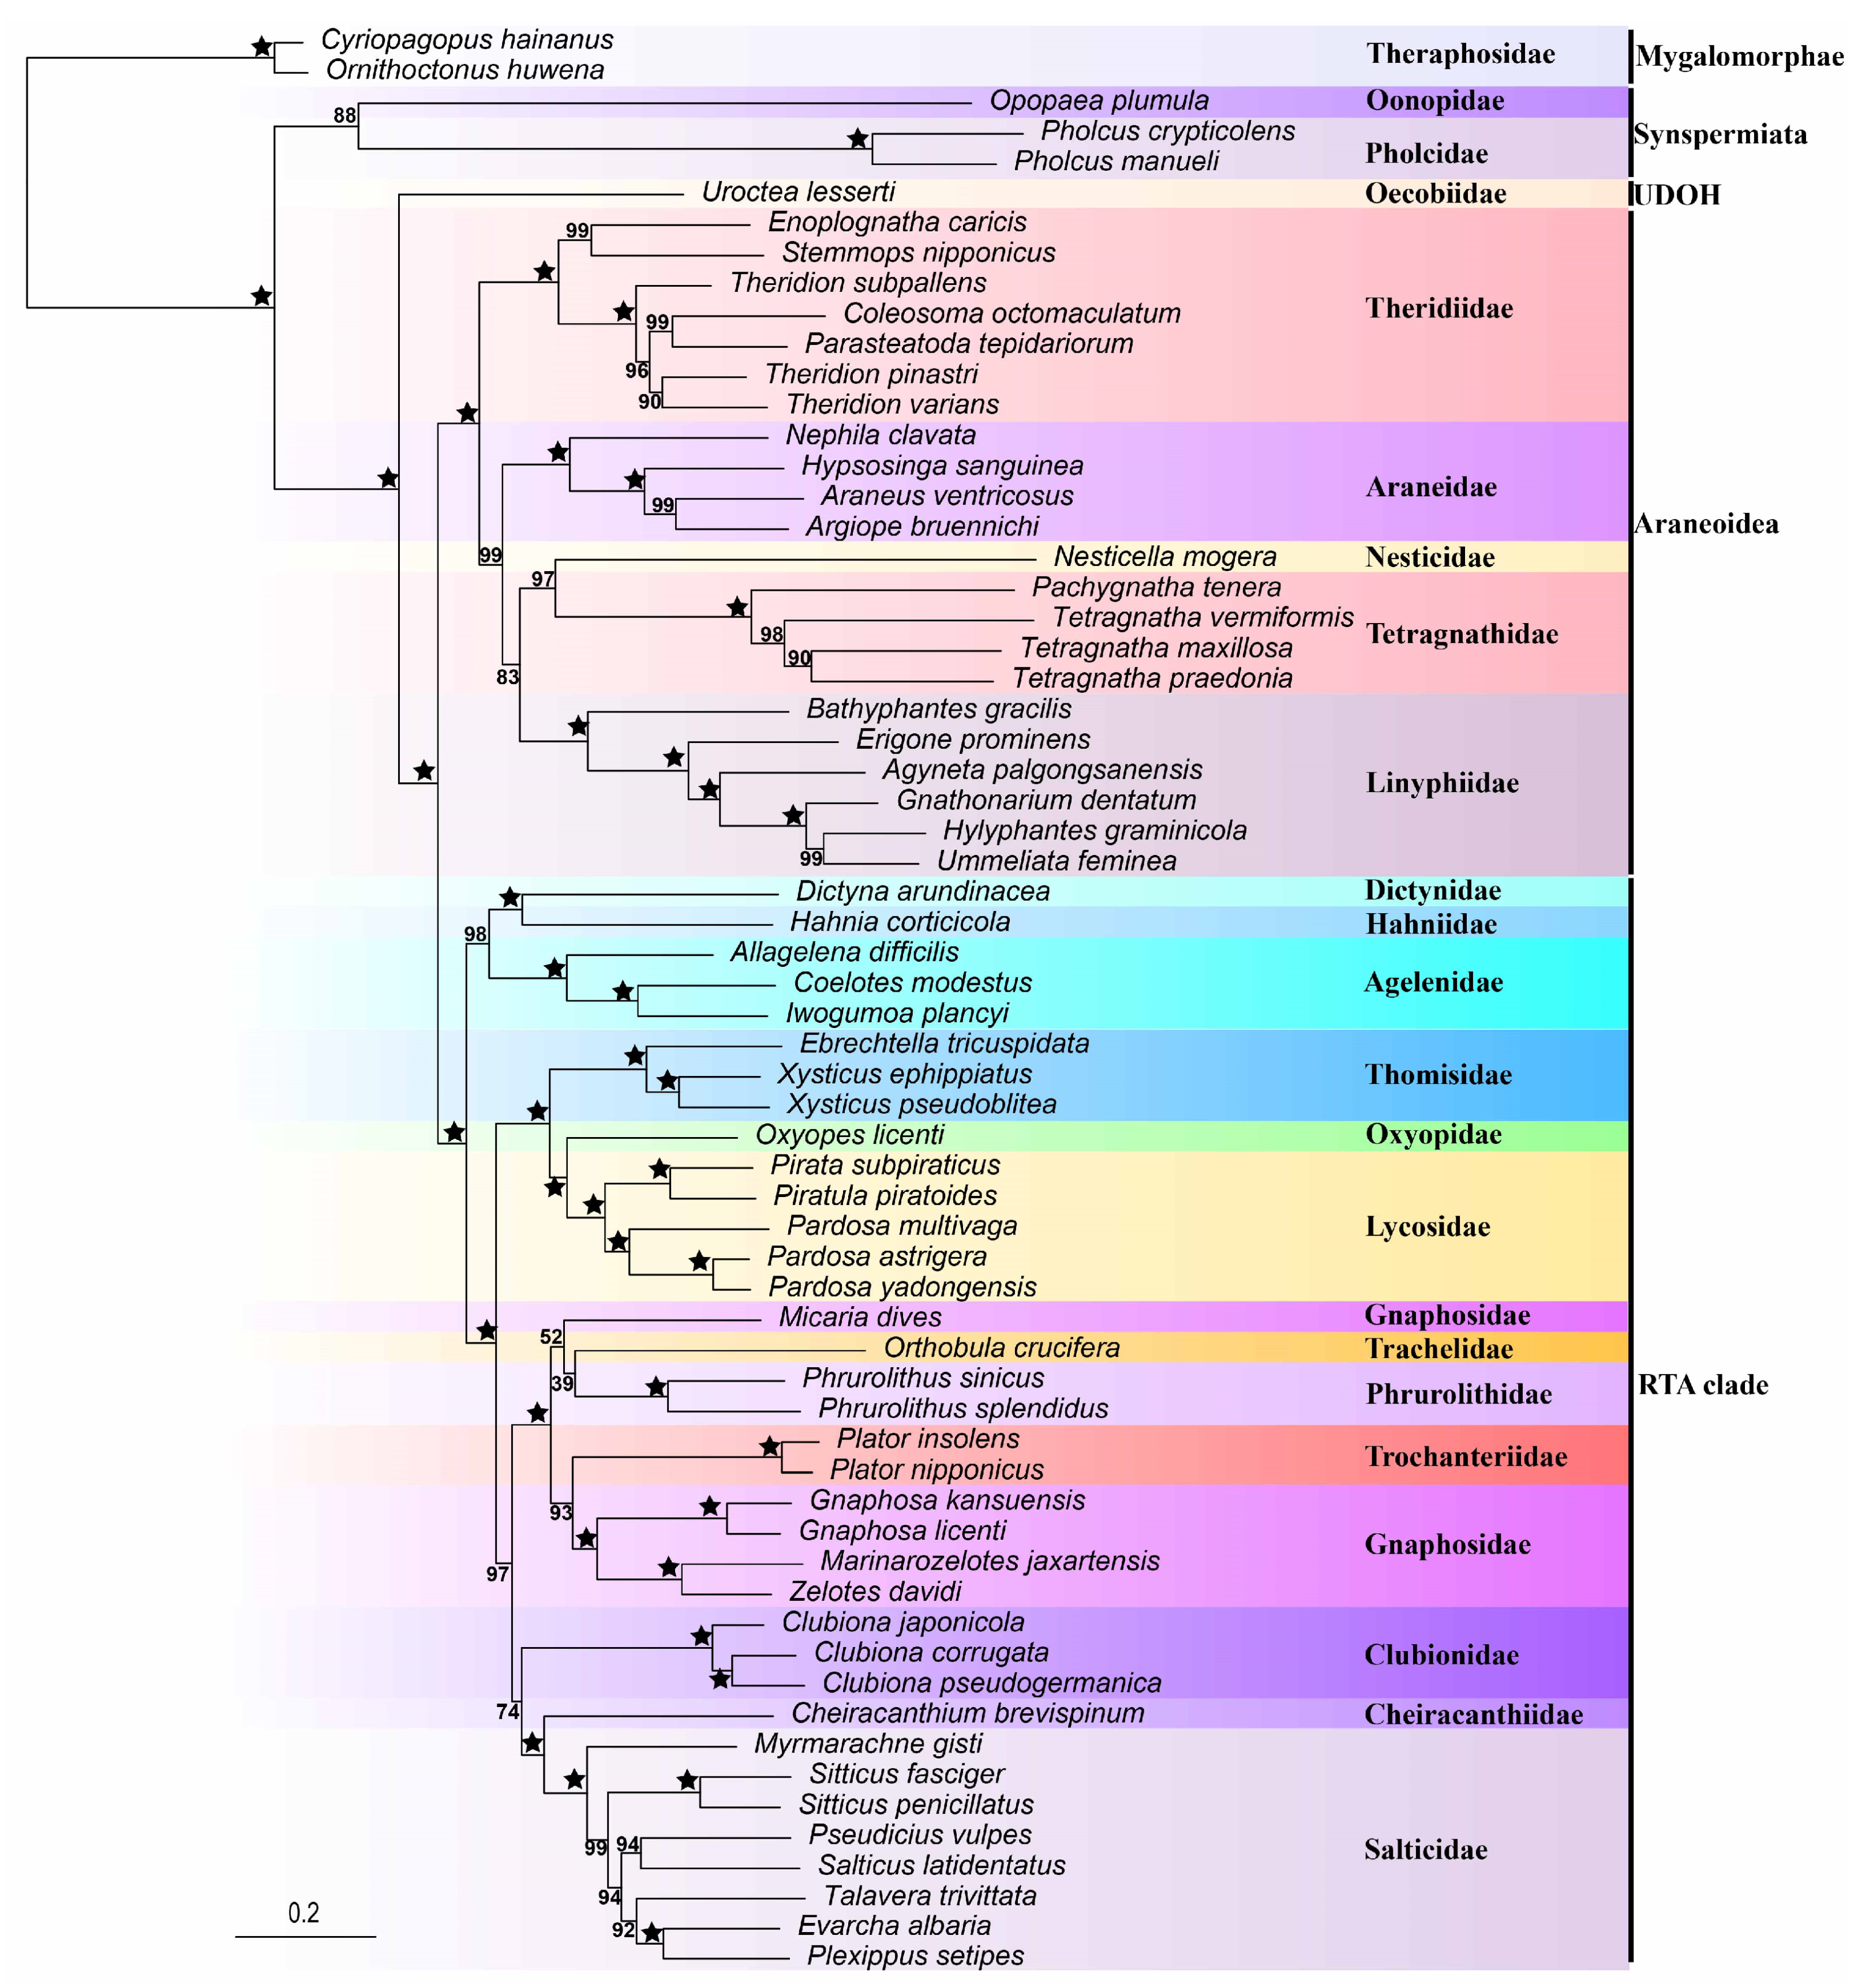
3.2. Phylogeny Based on Mitochondrial Genomes

The ML tree (log likelihood = −344,201.322) from the concatenated matrix on the 13 PCGs of the 64 mitogenomes (866,151 bp in total) is shown in Figure 3. Major lineages of spiders, such as RTA (retrolateral tibial apophysis) clade, Araneoidea, and Synspermiata, are recovered on the phylogeny, of which the RTA clade and Araneoidea are sister groups (bootstrap = 100%). In addition, the monophyly of some spider families (i.e., Agelenidae, Salticidae, Thomisidae, Lycosidae, Theridiidae, Araneidae, Tetragnathidae, and Linyphiidae) was strongly supported (bootstrap = 100%). However, the family Gnaphosidae is suggested to be paraphyletic, with Micaria dives (Lucas, 1846) (Araneae, Gnaphosidae) recovered as sister to the clade containing Trachelidae and Phrurolithidae (Figure 3).

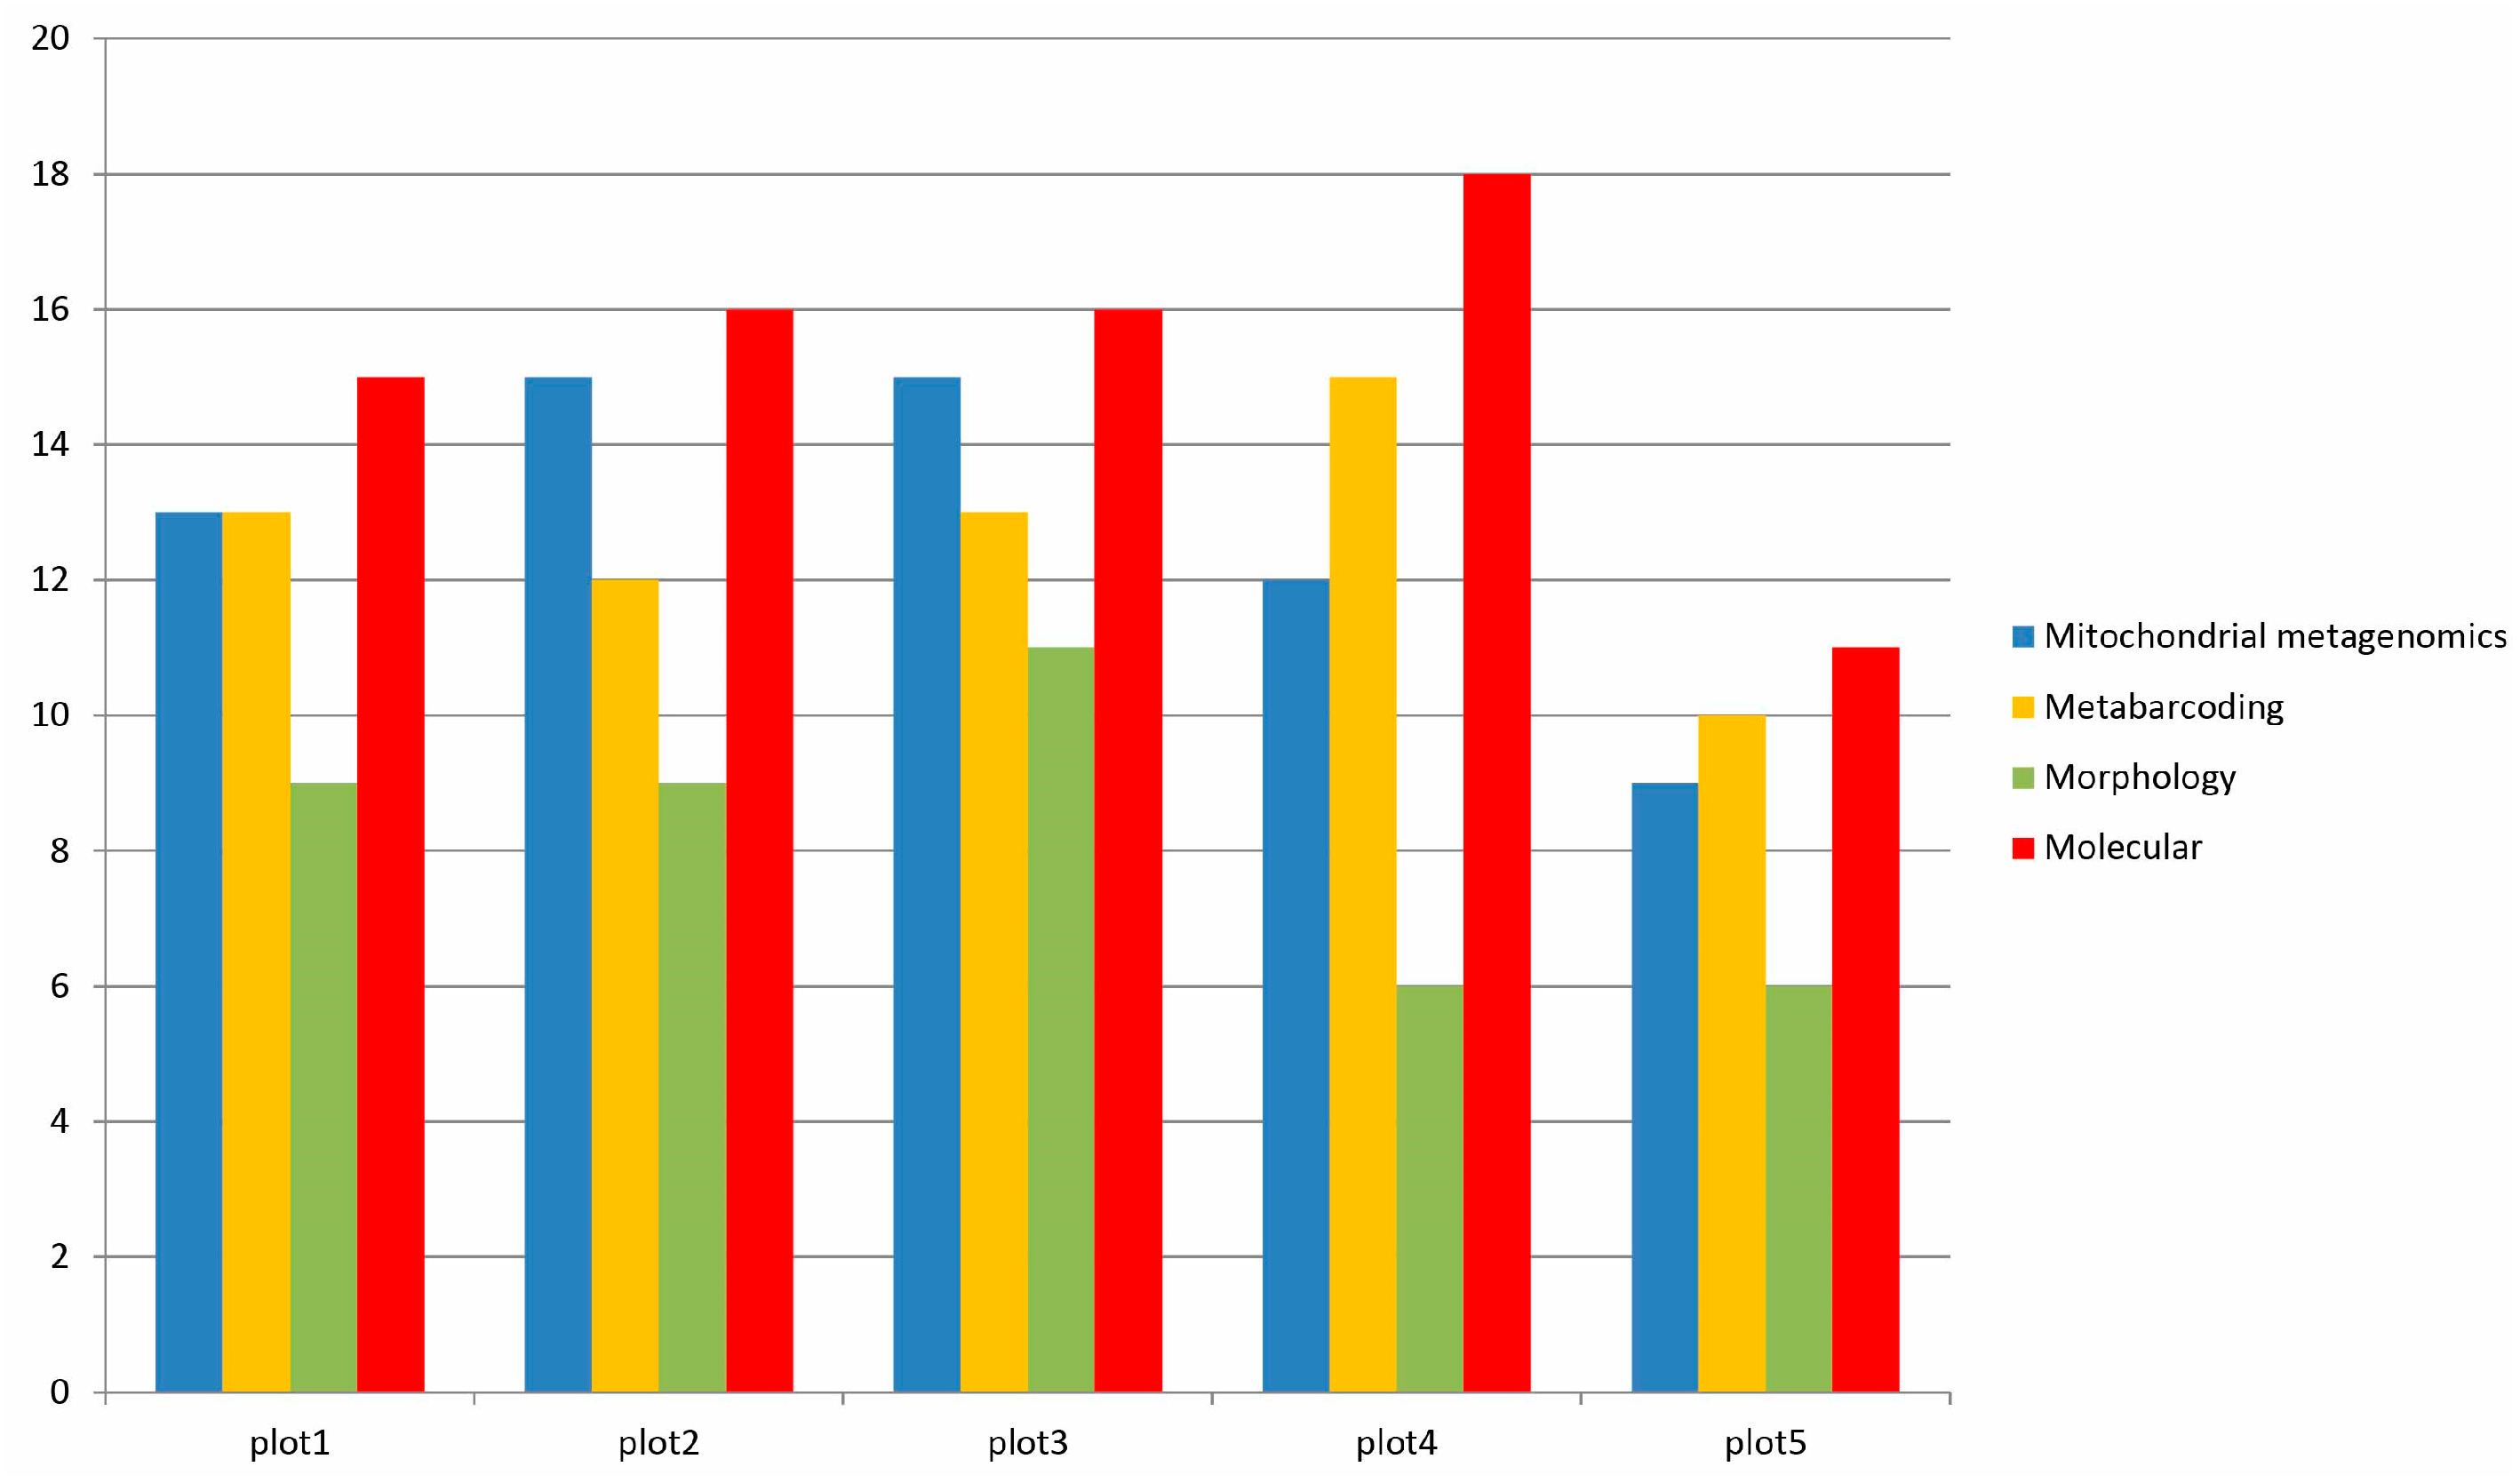
3.3. Species Detection by Morphology, Mitochondrial Metagenomics, and Metabarcoding

In total, 601 spider specimens were collected from the five sampling plots, including 103 adults and 498 immatures (plot 1: 20 adults, 63 immatures; plot 2: 24 adults, 154 immatures; plot 3: 20 adults, 172 immatures; plot 4: 16 adults, 55 immatures; plot 5: 23 adults, 54 immatures). On average, the immatures accounted for about 80% of the total number of specimens collected from each plot. The results of species detection through morphology, mitochondrial metagenomics, and metabarcoding are summarized in Figure 4. The adult specimens collected from all five plots were morphologically identified as 26 species (plot 1: 9 species; plot 2: 9 species; plot 3: 11 species; plot 4: 6 species; plot 5: 6 species). In contrast, the two molecular methods detected about 1.33~2.5 times as many species as morphology, with the mitochondrial metagenomics resulting in 31 species (plot 1: 13 species; plot 2: 15 species; plot 3: 15 species; plot 4: 12 species; plot 5: 9 species) and the metabarcoding in 26 species (plot 1: 13 species; plot 2: 12 species; plot 3: 13 species; plot 4: 15 species; plot 5: 10 species) in total from the five plot samples. The number of species detected in five plot samples using mitochondrial metagenomics, metabarcoding, and the morphological method is shown in Figure 5. Most species identified by the morphological method were successfully detected by the molecular methods, except Xysticus pseudoblitea (Simon, 1880) (Araneae, Thomisidae) (plot 1) and Pardosa astrigera L. Koch, 1878 (Araneae, Lycosidae) (plot 3). Although mitochondrial metagenomics and metabarcoding have similar species detection results, certain species were only detected by one of them. For example, Erigone prominens Bösenberg & Strand, 1906 (Araneae, Linyphiidae) was detected by mitochondrial metagenomics but not metabarcoding; Pachygnatha tenera Karsch, 1879 (Araneae, Tetragnathidae) was detected by metabarcoding but not mitochondrial metagenomics (Figure 4).

4. Discussion

In order to explore a more rapid and accurate diversity assessment method, this study attempted to apply the mitochondrial metagenomic and metabarcoding protocols to analyze the diversity of spiders in Baiyangdian Lake. Compared with the morphological method, mitochondrial metagenomics and metabarcoding have more species detected in the five plot samples, with mitochondrial metagenomics on average identifying 1.59 times and metabarcoding on average 1.63 times as many species as the morphological method. The molecular biodiversity approaches outperform the morphological method in the species detection rate, which is consistent with the findings of other biodiversity surveys or ecological studies. For instance, Doi et al. [45] compared the performance of eDNA metabarcoding with visual and capture surveys for estimating the α- and γ-diversity of river fish communities and found that eDNA metabarcoding detected more species in the study sites.
The dramatic difference in species detection between the molecular and morphological methods in this study is mainly due to the large proportion of immature spider specimens in the plot samples. The proportion of immatures in the five plots is very high (mean 79.6%, ranging 70~89%), and the presence of a high proportion of immature specimens is pretty common in the spider community samples or biodiversity surveys [4,46]. During certain seasons, such as after the breeding period, the immatures are usually abundant in the spider community, and may even exceed the number of adults. When a large number of adult spiders die of aging and immatures are dominant, the traditional morphological method often underestimates the level of diversity in a community because morphological identification of spider species is almost exclusively based on the genitalic characteristics including the structures of the copulatory bulb in males and the vulva and epigyne in females, which are lacking in immature spiders. Therefore, in the traditional spider biodiversity survey using the morphological approach, the immatures were only identified by genus or even family, or completely discarded from diversity analyses [47,48,49]. However, studies have shown that incorporating immature stages may have a major influence on the assessment of biodiversity patterns. For example, Domenech et al. [4] showed that the differences in composition between spider assemblages were greatly reduced when immature stages were considered; Petillon et al. [50] found that the main differences in the distribution of ctenid species between and within habitats of a neotropical forest could only be detected when immatures were taken into account.
In contrast to the traditional morphological approach, the molecular biodiversity methods (mitochondrial metagenomics and metabarcoding) are advantageous in depending on DNA sequences rather than genitalic diagnoses for species identification, and being capable of incorporating not only adults but also immatures into biodiversity assessment [4]. Therefore, molecular approaches could potentially provide a more accurate biodiversity assessment for spider communities. In this study, 12 species identified by either of the two molecular methods failed to be detected by morphology. Furthermore, the morphological method resulted in similar species diversity levels for plots 4 and 5 (each with six species detected); whereas the results from the combined two molecular approaches showed that plot 4 has higher species diversity than plot 5 (18 vs. 11 species; Figure 5). In addition, previous studies have shown that the number of sequenced reads for each species was positively correlated with its biomass [2,14,16,51], and thus, the molecular biodiversity methods could not only provide the species content information but also estimate the species richness for a pooled community sample.
A robust reference database is key for molecular biodiversity methods, and a well-curated mitogenome or barcode reference database is essential to provide scientific names for the identified operational taxonomic units (OTUs) [52]. The widely used reference sequences for classification and identification currently include COI and 16S [53], mitochondrial genome [15], chloroplast genome [54], or even the entire genome [55]. In this study, 61 mitochondrial genome sequences and 60 COI barcode sequences of Baiyangdian spiders were newly sequenced and used to build the local genetic reference databases for the mitochondrial metagenomic and metabarcoding analyses. These sequences also laid the foundation for further studies on the genetic diversity of spiders in this area.
The establishment and improvement of a mitogenome reference database are crucial for biodiversity analysis based on the mitochondrial metagenomic method, which directly affects the results of diversity analysis [2]. At present, the mitochondrial genome databases could be established in two ways. One is to first perform morphological identification to obtain the reference species, and then sequence, assemble, and annotate the mitogenome of each reference species to obtain the mitochondrial genome database of all reference species [2]. The second is to directly conduct high-throughput sequencing on mixed samples, assemble the returned high-throughput data, and obtain multiple mitochondrial genomes at the same time; the species identity of each mitochondrial genome obtained is then acquired by searching against the existing barcode sequences in NCBI [16,56]. The above two methods have their own advantages and disadvantages: the first method does not rely on existing data and can obtain a more complete mitochondrial genome database but at a high cost of time and expense; the second method can obtain a large amount of mitochondrial genome data all at once, and thus, is more efficient in cost and time, but can only annotate species of mitochondrial genomes with existing barcode sequences. In this study, we applied the first method and built the local mitogenome reference database for the mitochondrial metagenomic analysis. With the rapid development of sequencing technology and bioinformatic tools, the number of mitogenomic and barcode sequences available in public depositories is dramatically increasing, which will inevitably promote biodiversity research based on molecular data.
There are only two cases that species were successfully identified by morphology, but not by the molecular approaches in this study (X. pseudoblitea in plot 1 and P. astrigera in plot 3; Figure 4). The “false negative” result by molecular species identification methods has previously been reported [2,57]. This could be due to the low amount of DNA for this species in the pooled samples (mitochondrial metagenomics) or/and the failure of amplifying barcode sequences using the primers (metabarcoding). Among the two molecular methods, it is hard to determine which one is superior. Although similar numbers of species were detected by the two molecular methods, the species contents were not identical. For instance, for plot 1, although both mitochondrial metagenomics and metabarcoding detected 13 species, only 11 were identified by both methods (Figure 4). Previous biodiversity studies applying both of these molecular methods also showed this pattern [58,59]. In contrast to metabarcoding, mitochondrial metagenomics does not involve the amplification of target barcode fragments using primers, which may help to avoid the negative effect of failing to amplify the targeted barcode fragments of certain taxa on the biodiversity assessment. In this study, certain species were constantly identified by both mitochondrial metagenomics and morphology, but not by metabarcoding, e.g., E. prominens, P. astrigera, and Pardosa multivaga Simon, 1880 (Araneae, Lycosidae), which may be due to the failure of amplifying barcode in these species. However, species with very low amounts of DNA in the pooled samples probably have a better chance to be detected by metabarcoding than mitochondrial metagenomics because of the PCR amplification of barcode fragments. For instance, the minute spider P. tenera has been successfully detected by metabarcoding or even morphology, but not by mitochondrial metagenomics. In addition, the Barcode Life Database (BOLD), as a platform to help obtain, store, analyze, and publish DNA barcode data, has collected 1.3 million barcode sequences, which provides a robust foundation for barcode-based biodiversity studies [60]. In contrast to mitochondrial metagenomics, metabarcoding is capable of identifying unclassified OTUs (Operational Taxonomic Units), which may represent species that are new to local fauna or even new to science. For instance, by blasting the sequences of unclassified OTUs of the plot 5 sample to the NCBI database, we found one additional spider species in the plot: Trochosa ruricola (De Geer, 1778) (Araneae, Lycosidae), which was not included in the local barcode and mitogenome reference databases. Therefore, mitochondrial metagenomics and metabarcoding are complementary, and by combining both methods, we could potentially obtain a more reliable and accurate biodiversity assessment.

5. Conclusions

Our study demonstrates that mitochondrial metagenomics and metabarcoding are promising in spider diversity research, which can evaluate species composition more quickly and accurately. By successfully incorporating the immatures in the spider community samples, they could detect more species in the pooled community samples than the traditional morphological approach. Metabarcoding and mitochondrial metagenomics are complementary to each other, and combining the results of both methods could result in a more reliable spider biodiversity assessment.

Supplementary Materials

The following supporting information can be downloaded at: https://www.mdpi.com/article/10.3390/d15060711/s1, Table S1: Accession numbers for the mitogenome sequences, with summary on the assembly and annotation results; Table S2: Accession numbers for the barcode reference sequences; Table S3: Accession numbers for the sequencing results of five plot samples; Table S4: Best-fit partition scheme and model according to BIC; Table S5: Information for the DNA voucher specimens.

Author Contributions

Conceptualization, F.Z. and J.Z.; methodology, J.Z.; data curation, Y.D.; writing—original draft preparation, Y.D.; writing—review and editing, F.Z. and J.Z.; funding acquisition, J.Z. All authors have read and agreed to the published version of the manuscript.

Funding

This research was funded by the National Natural Science Foundation of China to Junxia Zhang (grant no. 32070422), the Advanced Talents Incubation Program of the Hebei University to Junxia Zhang (grant no. 521000981324) and the Institute of Life Sciences and Green Development of Hebei University.

Institutional Review Board Statement

Not applicable.

Data Availability Statement

The newly produced mitogenomes and COI sequences are publicly available in GenBank (see Supplementary Tables S1 and S2 for accession numbers); and the sequenced reads of five plot samples were submitted to the Sequence Read Archive (SRA) of NCBI (see Supplementary Table S3 for accession numbers).

Acknowledgments

We thank Wenqiang Zhang (Hebei University) for his assistance with analysis of the data. We thank Feng Zhang (Nanjing Agricultural University) and Yaozhuo Wang (Hebei University) for helpful discussions and suggestions. Thank the four anonymous reviewers for their valuable comments to improve the manuscript.

Conflicts of Interest

The authors declare no conflict of interest.

References

  1. Cristescu, M.E. From barcoding single individuals to metabarcoding biological communities: Towards an integrative approach to the study of global biodiversity. Trends Ecol. Evol. 2014, 29, 566–571. [Google Scholar] [CrossRef] [PubMed]
  2. Tang, M.; Hardman, C.J.; Ji, Y.; Meng, G.; Liu, S.; Tan, M.; Yang, S.; Moss, E.D.; Wang, J.; Yang, C.; et al. High-throughput monitoring of wild bee diversity and abundance via mitogenomics. Methods Ecol. Evol. 2015, 6, 1034–1043. [Google Scholar] [CrossRef] [PubMed]
  3. Blaxter, M. Molecular systematics: Counting angels with DNA. Nature 2003, 421, 122–124. [Google Scholar] [CrossRef] [PubMed]
  4. Domenech, M.; Wangensteen, O.S.; Enguidanos, A.; Malumbres-Olarte, J.; Arnedo, M.A. For all audiences: Incorporating immature stages into standardised spider inventories has a major impact on the assessment of biodiversity patterns. Mol. Ecol. Resour. 2022, 22, 2319–2332. [Google Scholar] [CrossRef]
  5. Tautz, D.; Arctander, P.; Minelli, A.; Thomas, R.H.; Vogler, A.P. DNA points the way ahead in taxonomy. Nature 2002, 418, 479. [Google Scholar] [CrossRef]
  6. Hebert, P.D.N.; Cywinska, A.; Ball, S.L.; DeWaard, J.R. Biological identifications through DNA barcodes. Proc. Biol. Sci. 2003, 270, 313–321. [Google Scholar] [CrossRef]
  7. Toju, H.; Baba, Y.G. DNA metabarcoding of spiders, insects, and springtails for exploring potential linkage between above- and below-ground food webs. Zool. Lett. 2018, 4, 4. [Google Scholar] [CrossRef]
  8. Piper, A.M.; Batovska, J.; Cogan, N.O.I.; Weiss, J.; Cunningham, J.P.; Rodoni, B.C.; Blacket, M.J. Prospects and challenges of implementing DNA metabarcoding for high-throughput insect surveillance. GigaScience 2019, 8, giz092. [Google Scholar] [CrossRef]
  9. da Silva, L.P.; Mata, V.A.; Lopes, P.B.; Lopes, R.J.; Beja, P. High-resolution multi-marker DNA metabarcoding reveals sexual dietary differentiation in a bird with minor dimorphism. Ecol. Evol. 2020, 10, 10364–10373. [Google Scholar] [CrossRef]
  10. Kodada, J.; Jaech, M.A.; Freitag, H.; Ciamporova-Zatovicova, Z.; Goffova, K.; Selnekovic, D.; Ciampor, F., Jr. Ancyronyx clisteri, a new spider riffle beetle species from Borneo, redescription of A. sarawacensis Jach including a description of the larva and new distribution data for A. procerus Jach using DNA barcodes (Coleoptera, Elmidae). ZooKeys 2020, 912, 25–64. [Google Scholar] [CrossRef]
  11. Borrell, Y.J.; Miralles, L.; Do Huu, H.; Mohammed-Geba, K.; Garcia-Vazquez, E. DNA in a bottle-Rapid metabarcoding survey for early alerts of invasive species in ports. PLoS ONE 2017, 12, e0183347. [Google Scholar] [CrossRef] [PubMed]
  12. Deiner, K.; Bik, H.M.; Machler, E.; Seymour, M.; Lacoursiere-Roussel, A.; Altermatt, F.; Creer, S.; Bista, I.; Lodge, D.M.; de Vere, N.; et al. Environmental DNA metabarcoding: Transforming how we survey animal and plant communities. Mol. Ecol. 2017, 26, 5872–5895. [Google Scholar] [CrossRef]
  13. Hatzenbuhler, C.; Kelly, J.R.; Martinson, J.; Okum, S.; Pilgrim, E. Sensitivity and accuracy of high-throughput metabarcoding methods for early detection of invasive fish species. Sci. Rep. 2017, 7, 46393. [Google Scholar] [CrossRef] [PubMed]
  14. Gomez-Rodriguez, C.; Crampton-Platt, A.; Timmermans, M.J.T.N.; Baselga, A.; Vogler, A.P. Validating the power of mitochondrial metagenomics for community ecology and phylogenetics of complex assemblages. Methods Ecol. Evol. 2015, 6, 883–894. [Google Scholar] [CrossRef]
  15. Crampton-Platt, A.; Yu, D.W.; Zhou, X.; Vogler, A.P. Mitochondrial metagenomics: Letting the genes out of the bottle. GigaScience 2016, 5, 11. [Google Scholar] [CrossRef] [PubMed]
  16. Du, S.Y.; Dong, J.; Godeiro, N.N.; Wu, J.; Zhang, F. Advancing mitochondrial metagenomics: A new assembly strategy and validating the power of seed-based approach. Diversity 2022, 14, 317. [Google Scholar] [CrossRef]
  17. Andujar, C.; Arribas, P.; Ruzicka, F.; Crampton-Platt, A.; Timmermans, M.J.T.N.; Vogler, A.P. Phylogenetic community ecology of soil biodiversity using mitochondrial metagenomics. Mol. Ecol. 2015, 24, 3603–3617. [Google Scholar] [CrossRef]
  18. World Spider Catalog (2023). Available online: http://wsc.nmbe.ch (accessed on 30 April 2023).
  19. Blagoev, G.A.; Dondale, C.D. A new species of Alopecosa (Araneae: Lycosidae) from Canada: A morphological description supported by DNA barcoding of 19 congeners. Zootaxa 2014, 3894, 152–160. [Google Scholar] [CrossRef]
  20. Zhang, Y.; Fu, Y.-T.; Yao, C.; Deng, Y.-P.; Nie, Y.; Liu, G.-H. Mitochondrial phylogenomics provides insights into the taxonomy and phylogeny of fleas. Parasit. Vectors 2022, 15, 223. [Google Scholar] [CrossRef]
  21. Kirse, A.; Bourlat, S.J.; Langen, K.; Fonseca, V.G. Metabarcoding Malaise traps and soil eDNA reveals seasonal and local arthropod diversity shifts. Sci. Rep. 2021, 11, 1–12. [Google Scholar] [CrossRef]
  22. Hu, W.H.; Mei, Z.L.; Liu, Y.H.; Yu, Z.R.; Zhang, F.; Duan, M.C. Recovered grassland area rather than plantation forest could contribute more to protect epigeic spider diversity in northern China. Agric. Ecosyst. Environ. 2022, 326, 107726. [Google Scholar] [CrossRef]
  23. Zhang, X.Z.; Axmacher, J.C.; Wu, P.L.; Song, X.; Yu, Z.R.; Liu, Y.H. The taxon- and functional trait-dependent effects of field margin and landscape composition on predatory arthropods in wheat fields of the North China Plain. Insect Conserv. Diver. 2020, 13, 328–339. [Google Scholar] [CrossRef]
  24. He, X.Q.; Qiao, Y.H.; Sigsgaard, L.; Wu, X.J. The spider diversity and plant hopper control potential in the long-term organic paddy fields in sub-tropical area, China. Agric. Ecosyst. Environ. 2020, 295, 106921. [Google Scholar] [CrossRef]
  25. Cardoso, P.; Henriques, S.S.; Gaspar, C.; Crespo, L.C.; Carvalho, R.; Schmidt, J.B.; Sousa, P.; Szuts, T. Species richness and composition assessment of spiders in a Mediterranean scrubland. J. Insect Conserv. 2009, 13, 45–55. [Google Scholar] [CrossRef]
  26. Song, D.; Zhu, M.; Chen, J. The Fauna of Hebei, China: Araneae, 1st ed.; Hebei Science and Technology Publishing House: Shijiazhuang, China, 2001; p. 510. [Google Scholar]
  27. Zhu, M.; Zhang, B. Spider Fauna of Henan: Arachnida: Araneae, 1st ed.; Science Press: Beijing, China, 2011; p. 558. [Google Scholar]
  28. Meng, G.L.; Li, Y.Y.; Yang, C.T.; Liu, S.L. MitoZ: A toolkit for animal mitochondrial genome assembly, annotation and visualization. Nucleic Acids Res. 2019, 47, e63. [Google Scholar] [CrossRef]
  29. Donath, A.; Juehling, F.; Al-Arab, M.; Bernhart, S.H.; Reinhardt, F.; Stadler, P.F.; Middendorf, M.; Bernt, M. Improved annotation of protein-coding genes boundaries in metazoan mitochondrial genomes. Nucleic Acids Res. 2019, 47, 10543–10552. [Google Scholar] [CrossRef] [PubMed]
  30. Zhang, D.; Gao, F.L.; Jakovlic, I.; Zou, H.; Zhang, J.; Li, W.X.; Wang, G.T. PhyloSuite: An integrated and scalable desktop platform for streamlined molecular sequence data management and evolutionary phylogenetics studies. Mol. Ecol. Resour. 2020, 20, 348–355. [Google Scholar] [CrossRef]
  31. Katoh, K.; Standley, D.M. MAFFT multiple sequence alignment software version 7: Improvements in performance and usability. Mol. Biol. Evol. 2013, 30, 772–780. [Google Scholar] [CrossRef]
  32. Ranwez, V.; Douzery, E.J.P.; Cambon, C.; Chantret, N.; Delsuc, F. MACSE v2: Toolkit for the alignment of coding sequences accounting for frameshifts and stop codons. Mol. Biol. Evol. 2018, 35, 2582–2584. [Google Scholar] [CrossRef]
  33. Talavera, G.; Castresana, J. Improvement of phylogenies after removing divergent and ambiguously aligned blocks from protein sequence alignments. Syst. Biol. 2007, 56, 564–577. [Google Scholar] [CrossRef]
  34. Kalyaanamoorthy, S.; Bui Quang, M.; Wong, T.K.F.; von Haeseler, A.; Jermiin, L.S. ModelFinder: Fast model selection for accurate phylogenetic estimates. Nat. Methods 2017, 14, 587–589. [Google Scholar] [CrossRef]
  35. Nguyen, L.-T.; Schmidt, H.A.; von Haeseler, A.; Minh, B.Q. IQ-TREE: A fast and effective stochastic algorithm for estimating maximum-likelihood phylogenies. Mol. Biol. Evol. 2015, 32, 268–274. [Google Scholar] [CrossRef] [PubMed]
  36. Minh, B.Q.; Nguyen, M.A.T.; von Haeseler, A. Ultrafast approximation for phylogeneticbootstrap. Mol. Biol. Evol. 2013, 30, 1188–1195. [Google Scholar] [CrossRef] [PubMed]
  37. Morgulis, A.; Gertz, E.M.; Schaffer, A.A.; Agarwala, R. WindowMasker: Window-based masker for sequenced genomes. Bioinformatics 2006, 22, 134–141. [Google Scholar] [CrossRef] [PubMed]
  38. Chen, Y.; Ye, W.; Zhang, Y.; Xu, Y. High speed BLASTN: An accelerated MegaBLAST search tool. Nucleic Acids Res. 2015, 43, 7762–7768. [Google Scholar] [CrossRef]
  39. Shokralla, S.; Porter, T.M.; Gibson, J.F.; Dobosz, R.; Janzen, D.H.; Hallwachs, W.; Golding, G.B.; Hajibabaei, M. Massively parallel multiplex DNA sequencing for specimen identification using an Illumina MiSeq platform. Sci. Rep. 2015, 5, 9687. [Google Scholar] [CrossRef]
  40. Yu, D.W.; Ji, Y.; Emerson, B.C.; Wang, X.; Ye, C.; Yang, C.; Ding, Z. Biodiversity soup: Metabarcoding of arthropods for rapid biodiversity assessment and biomonitoring. Methods Ecol. Evol. 2012, 3, 613–623. [Google Scholar] [CrossRef]
  41. Chen, S.F.; Zhou, Y.Q.; Chen, Y.R.; Gu, J. Fastp: An ultra-fast all-in-one FASTQ preprocessor. Bioinformatics 2018, 34, 884–890. [Google Scholar] [CrossRef] [PubMed]
  42. Magoc, T.; Salzberg, S.L. FLASH: Fast length adjustment of short reads to improve genome assemblies. Bioinformatics 2011, 27, 2957–2963. [Google Scholar] [CrossRef] [PubMed]
  43. Edgar, R.C. UPARSE: Highly accurate OTU sequences from microbial amplicon reads. Nat. Methods 2013, 10, 996–998. [Google Scholar] [CrossRef]
  44. Wang, Q.; Garrity, G.M.; Tiedje, J.M.; Cole, J.R. Naive Bayesian classifier for rapid assignment of rRNA sequences into the new bacterial taxonomy. Appl. Environ. Microbiol. 2007, 73, 5261–5267. [Google Scholar] [CrossRef]
  45. Doi, H.; Inui, R.; Matsuoka, S.; Akamatsu, Y.; Goto, M.; Kono, T. Estimation of biodiversity metrics by environmental DNA metabarcoding compared with visual and capture surveys of river fish communities. Freshwater Biol. 2021, 66, 1257–1266. [Google Scholar] [CrossRef]
  46. Soukainen, A.; Pajunen, T.; Korhonen, T.; Saarinen, J.; Chichorro, F.; Jalonen, S.; Kiljunen, N.; Koskivirta, N.; Kuurne, J.; Leinonen, S.; et al. Standardised spider (Arachnida, Araneae) inventory of Lammi, Finland. Biodivers. Data J. 2020, 8, e50775. [Google Scholar] [CrossRef]
  47. Rubio, G.D.; Moreno, C.E. Orb-weaving spider diversity in the Ibera Marshlands, Argentina. Neotrop. Entomol. 2010, 39, 496–505. [Google Scholar] [CrossRef] [PubMed]
  48. Griotti, M.; Munoz-Escobar, C.; Ferretti, N.E. Linking vegetation structure and spider diversity in riparian and adjacent habitats in two rivers of Central Argentina: An analysis at two conceptual levels. Environ. Entomol. 2017, 46, 794–803. [Google Scholar] [CrossRef]
  49. Zheng, G.; Li, S.Q.; Wu, P.F.; Liu, S.J.; Kitching, R.L.; Yang, X.D. Diversity and assemblage structure of bark-dwelling spiders in tropical rainforest and plantations under different management intensities in Xishuangbanna, China. Insect Conserv. Divers. 2017, 10, 224–235. [Google Scholar] [CrossRef]
  50. Petillon, J.; Leroy, B.; Djoudi, E.A.; Vedel, V. Small and large spatial scale coexistence of ctenid spiders in a neotropical forest (French Guiana). Trop. Zool. 2018, 31, 85–98. [Google Scholar] [CrossRef]
  51. Garrido-Sanz, L.; Senar, M.A.; Pinol, J. Relative species abundance estimation in artificial mixtures of insects using mito-metagenomics and a correction factor for the mitochondrial DNA copy number. Mol. Ecol. Resour. 2022, 22, 153–167. [Google Scholar] [CrossRef]
  52. Xin, Z. Understanding biodiversity using genomics: Hooke’s microscope in the era of big data. Biodiv. Sci. 2019, 27, 475–479. [Google Scholar] [CrossRef]
  53. Karst, S.M.; Dueholm, M.S.; McIlroy, S.J.; Kirkegaard, R.H.; Nielsen, P.H.; Albertsen, M. Retrieval of a million high-quality, full-length microbial 16S and 18S rRNA gene sequences without primer bias. Nat. Biotechnol. 2018, 36, 190–195. [Google Scholar] [CrossRef] [PubMed]
  54. Lang, D.; Tang, M.; Hu, J.; Zhou, X. Genome-skimming provides accurate quantification for pollen mixtures. Mol. Ecol. Resour. 2019, 19, 1433–1446. [Google Scholar] [CrossRef]
  55. Hollingsworth, P.M.; Li, D.-Z.; van der Bank, M.; Twyford, A.D. Telling plant species apart with DNA: From barcodes to genomes. Philos. Trans. R. Soc. B 2016, 371, 20150338. [Google Scholar] [CrossRef] [PubMed]
  56. Cicconardi, F.; Borges, P.A.V.; Strasberg, D.; Oromi, P.; Lopez, H.; Perez-Delgado, A.J.; Casquet, J.; Caujape-Castells, J.; Maria Fernandez-Palacios, J.; Thebaud, C.; et al. MtDNA metagenomics reveals large-scale invasion of belowground arthropod communities by introduced species. Mol. Ecol. 2017, 26, 3104–3115. [Google Scholar] [CrossRef] [PubMed]
  57. Bell, K.L.; Burgess, K.S.; Botsch, J.C.; Dobbs, E.K.; Read, T.D.; Brosi, B.J. Quantitative and qualitative assessment of pollen DNA metabarcoding using constructed species mixtures. Mol. Ecol. 2019, 28, 431–455. [Google Scholar] [CrossRef]
  58. Arribas, P.; Andujar, C.; Hopkins, K.; Shepherd, M.; Vogler, A.P. Metabarcoding and mitochondrial metagenomics of endogean arthropods to unveil the mesofauna of the soil. Methods Ecol. Evol. 2016, 7, 1071–1081. [Google Scholar] [CrossRef]
  59. Bista, I.; Carvalho, G.R.; Tang, M.; Walsh, K.; Zhou, X.; Hajibabaei, M.; Shokralla, S.; Seymour, M.; Bradley, D.; Liu, S.; et al. Performance of amplicon and shotgun sequencing for accurate biomass estimation in invertebrate community samples. Mol. Ecol. Resour. 2018, 18, 1020–1034. [Google Scholar] [CrossRef]
  60. Ratnasingham, S.; Hebert, P.D.N. BOLD: The Barcode of Life Data System (www.barcodinglife.org). Mol. Ecol. Notes 2007, 7, 355–364. [Google Scholar] [CrossRef]
Figure 1. Pipelines of mitochondrial metagenomic and metabarcoding methods for spiders. First, the mitochondrial genome references and barcode references were built, respectively (1): The genomic DNA was extracted for each reference spider species; the reference mitogenome sequences were assembled from the next-generation sequencing results of the whole genome libraries; the reference barcode sequences were amplified and Sanger sequenced using the universal primers. Then, the diversity analysis was conducted for each plot sample of spiders (2): The bulk DNA of spiders from each plot sample was extracted; for the mitochondrial metagenomic method, bulk DNA libraries were sequenced using a next-generation sequencing platform, the species content and richness information of the plot samples were then recovered by mapping the reads to the mitogenome reference database; for the metabarcoding method, barcodes were amplified from the bulk DNA and then sequenced using the Miseq platform, the species content and richness information of the plot samples were then recovered through the amplicon analysis with the barcode reference database.
Diversity 15 00711 g001
Figure 2. Sampling sites around the Baiyangdian Wetland, Hebei, China. Circles indicate the collecting sites for reference species, and triangles refer to the sampling sites of plot samples.
Diversity 15 00711 g002
Figure 3. Maximum likelihood tree constructed from 13 PCGs of 64 spider mitochondrial genomes. The numbers along branches indicate bootstrap (%), with asterisks meaning bootstrap = 100%.
Diversity 15 00711 g003
Figure 4. Results of species detection in five plot samples by mitochondrial metagenomics, metabarcoding, and morphology.
Diversity 15 00711 g004
Figure 5. Number of species detected for five plot samples by mitochondrial metagenomics, metabarcoding, morphology, and the two molecular methods combined.
Diversity 15 00711 g005
Disclaimer/Publisher’s Note: The statements, opinions and data contained in all publications are solely those of the individual author(s) and contributor(s) and not of MDPI and/or the editor(s). MDPI and/or the editor(s) disclaim responsibility for any injury to people or property resulting from any ideas, methods, instructions or products referred to in the content.

