Article

Habitat Suitability Analysis and Future Distribution Prediction of Giant Panda (Ailuropoda melanoleuca) in the Qinling Mountains, China

1
School of Tourism, Research Institute of Human Geography, Xi’an International Studies University, Xi’an 710128, China
2
College of Urban and Environmental Sciences, Northwest University, Xi’an 710127, China
*
Authors to whom correspondence should be addressed.
Diversity 2024, 16(7), 412; https://doi.org/10.3390/d16070412
Submission received: 23 May 2024 / Revised: 25 June 2024 / Accepted: 9 July 2024 / Published: 16 July 2024

Abstract

:
Climate change has triggered a series of global problems, posing a huge threat to the distribution of many plants and animals, especially endangered species such as the giant panda. Therefore, predicting the distribution of habitat quality under climate change conditions is of great significance for protecting these species. In this study, we examined the correlation between suitable habitat index and ecosystem services using 260 occurrence records and 13 environmental factors with giant pandas as the model species. The species distribution models can also be employed to predict and compare the potential geographical distribution of giant pandas at present and in the 2050s and 2090s in the Qinling Mountains of Shaanxi Province. The results show the following: (1) The relationship between suitable habitat index and ecosystem services of giant panda is not uniform. (2) From 2040 to 2100, the existing habitats may decrease by 47.8% to 98.5%. (3) The main direction of change in the center of the distribution of the giant panda’s habitat is to migrate first eastward and then northwestward. Our results regarding the potential distribution pattern of giant pandas in the Qinling Mountains and their response to climate change can provide important references for optimizing the conservation and habitat management of wild giant pandas in the Qinling Mountains.

1. Introduction

Habitat degradation caused by climate change has been identified as the main cause of the decline or extinction of many endangered species [1,2]. Mountain ecosystems are particularly sensitive to climate change [3], and species inhabiting high altitudes face the risk of shrinking suitable habitats due to global warming’s impact [4]. The giant panda (Ailuropoda melanoleuca), a rare and endangered species unique to China, is also the world’s flagship species of biodiversity conservation, attracting much attention [5]. The Chinese government attaches great importance to the habitat conditions of giant pandas, having established 67 giant panda nature reserves [6], proposed a national environmental policy based on ecological conservation redlines (ECRs) [7], and established giant panda national parks (GPNPs) [8]. Despite the initial success of these measures, the panda habitat is still under threat from climate change risks and human disturbance (road construction, agricultural expansion, and tourism development) [9].
Rapid climate change and frequent human activities threaten global ecosystems and biodiversity, affecting certain species and their surrounding environments, leading to a sharp decline in biodiversity and ecosystem degradation, ultimately resulting in the loss of ecosystem services [1,10]. There is a complex feedback relationship between biodiversity and the ecosystem services it produces [11]. Ecosystem services may not be affected by small losses of biodiversity, but when a functional group is destroyed, ecosystem services will deteriorate rapidly [12], biodiversity will decline sharply, and natural ecosystems and human society will be seriously threatened [13]. Therefore, exploring the relationship between biodiversity and ecosystem services in the context of climate change is a hot topic in current ecological research [14,15].
The world is striving to cope with the loss of biodiversity and the degradation of ecosystem services. In recent years, with the joint efforts of various sectors around the world, a large amount of research has been carried out on the relationship between biodiversity and ecosystem services. Some studies have focused on the impact of biodiversity on single ecosystem service [16,17], while others have conducted multi-service studies to explore the relationship between biodiversity and ecosystem multifunctionality [18,19]. Although it is widely believed that biodiversity and ecosystem services are interrelated [20], there is still uncertainty about the relationship between biodiversity and its ecosystem services [21]. The relationship between the various service functions in ecosystem services and biodiversity is not always unified.
In recent years, many scholars have used species distribution models (SDMs) to predict the potential distribution of species [22]. The MaxEnt model is the most commonly used method in conservation-oriented research at present and can accurately predict species distribution probability based on a few species distribution points and environmental variables [23,24]. In the field of ecology and conservation biology, it is widely used in the models of species conservation, ecosystem management, and ecological restoration [25]. Therefore, we combined the species-specific giant panda-suitable habitat index with ecosystem services to study the relationship between suitable habitat index and ecosystem services for giant pandas. We predicted the distribution and future trends of habitat suitability of giant pandas in the Qinling Mountains under future climate change based on the MaxEnt model. The purpose is to verify the following hypotheses: (1) The relationship between the suitable habitat index of giant panda and its ecosystem services is not uniform; (2) climate warming will lead to habitat degradation of giant pandas on a mesoscale. We hope to provide references and suggestions for the protection and management of giant pandas in the Qinling Mountains and the construction of reserves.

2. Materials and Methods

In this study, we conducted a spatial modelling analysis based on establishing, evaluating and mapping habitat suitability models for giant pandas in the Qinling Mountains. We investigated the relationship between the habitat suitability index for giant pandas and their ecosystem services. The workflow we studied is shown in Figure 1 and described in detail in the next section.

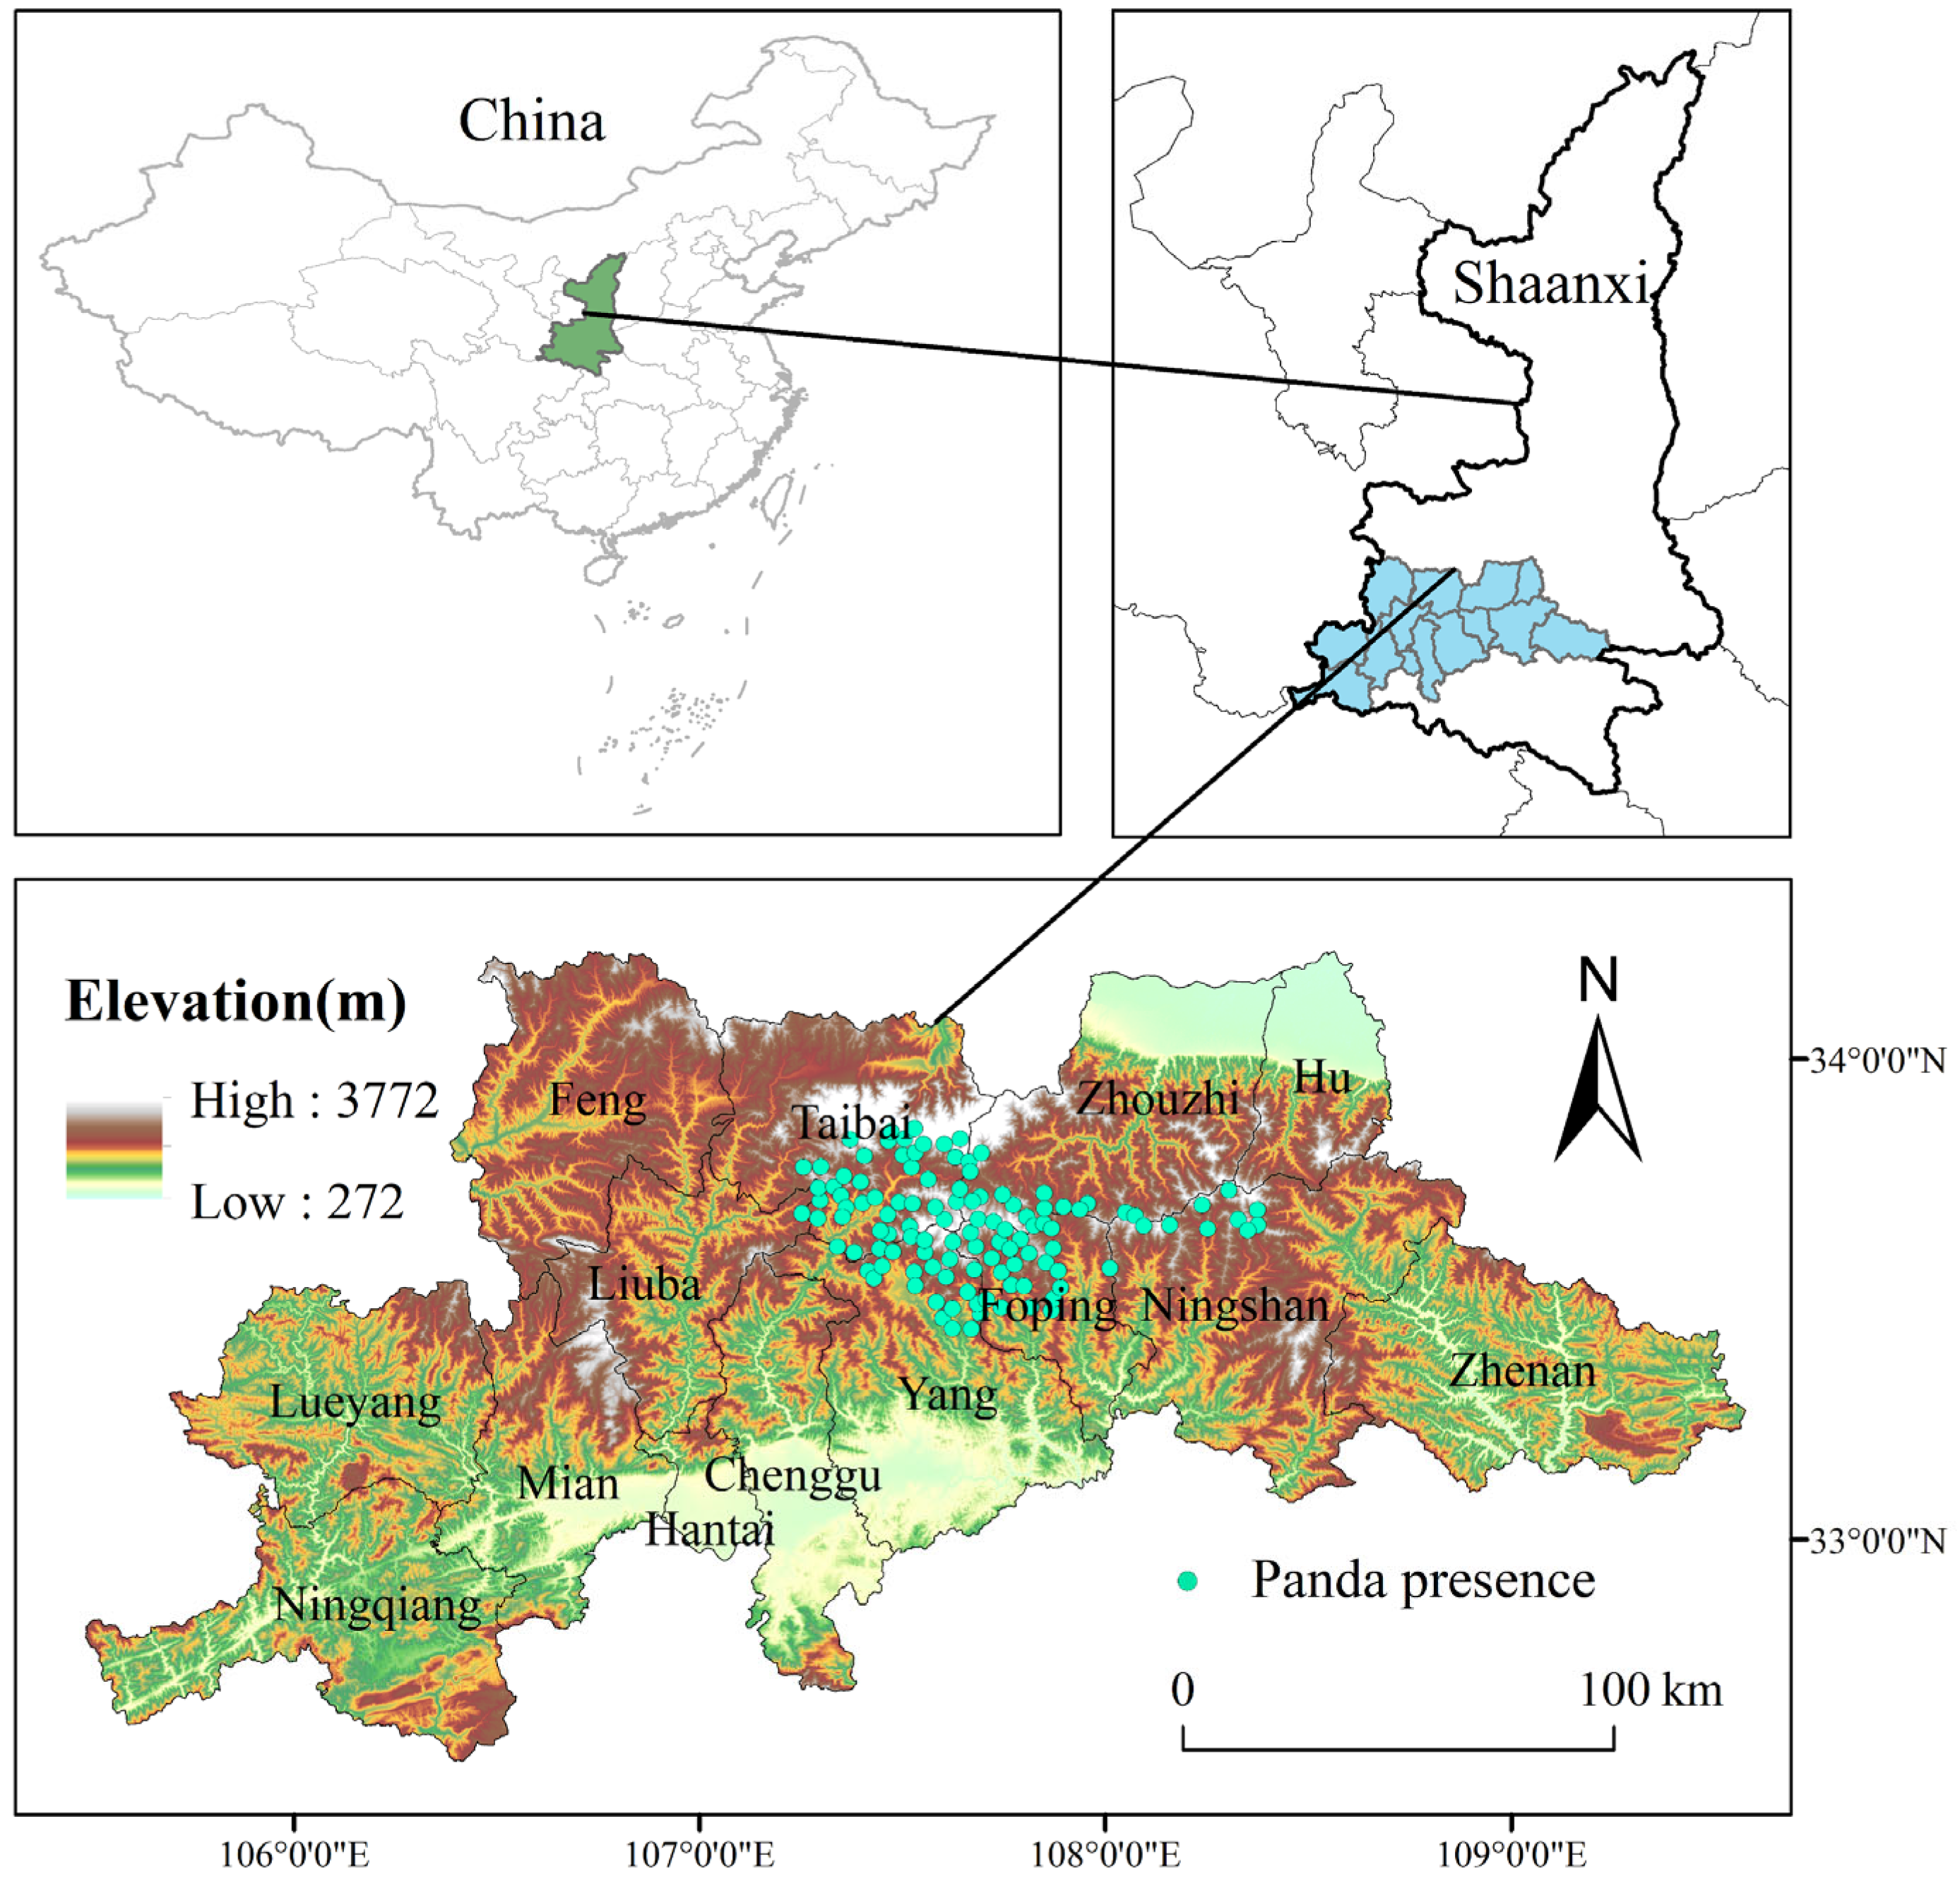
2.1. Overview of the Research Area

The Qinling Mountains stretch across central China, from the Minshan Mountains in the west to the Huaiyang Mountains in the east. They form the north–south demarcation line of China’s climate, as well as the transitional zone and sensitive area of the central ecological environment [26]. The climate of the south slope of the Qinling Mountains is warm and humid, with abundant rainfall, and annual sunlight is less than 2000 h. The north slope is generally mild and dry, with moderate rainfall and intense sunshine. The highest peak in the study area, Taibai Mountain, is 3767 m above sea level, with a relative altitude of 2000–3000 m. The vertical zoning of vegetation in Qinling Mountains is obvious, including mountain evergreen broad-leaved forest, mountain deciduous broad-leaved forest with evergreen species, a mountain dark coniferous forest belt, and a mountain shrub belt from the bottom to the top [27]. This region is a hotspot for biodiversity and a key area of global protection, with numerous rare, endangered, and endemic species such as giant pandas, golden monkeys (Rhinopithecus roxellana), antelopes (Budorcas taxicolor), and crested ibises (Nipponia nippon) [28]. From the perspective of administrative divisions (Figure 2), the study area includes 14 counties, including Foping, Yang, and Zhouzhi Counties, with a high proportion of agricultural population and low total community economic development.

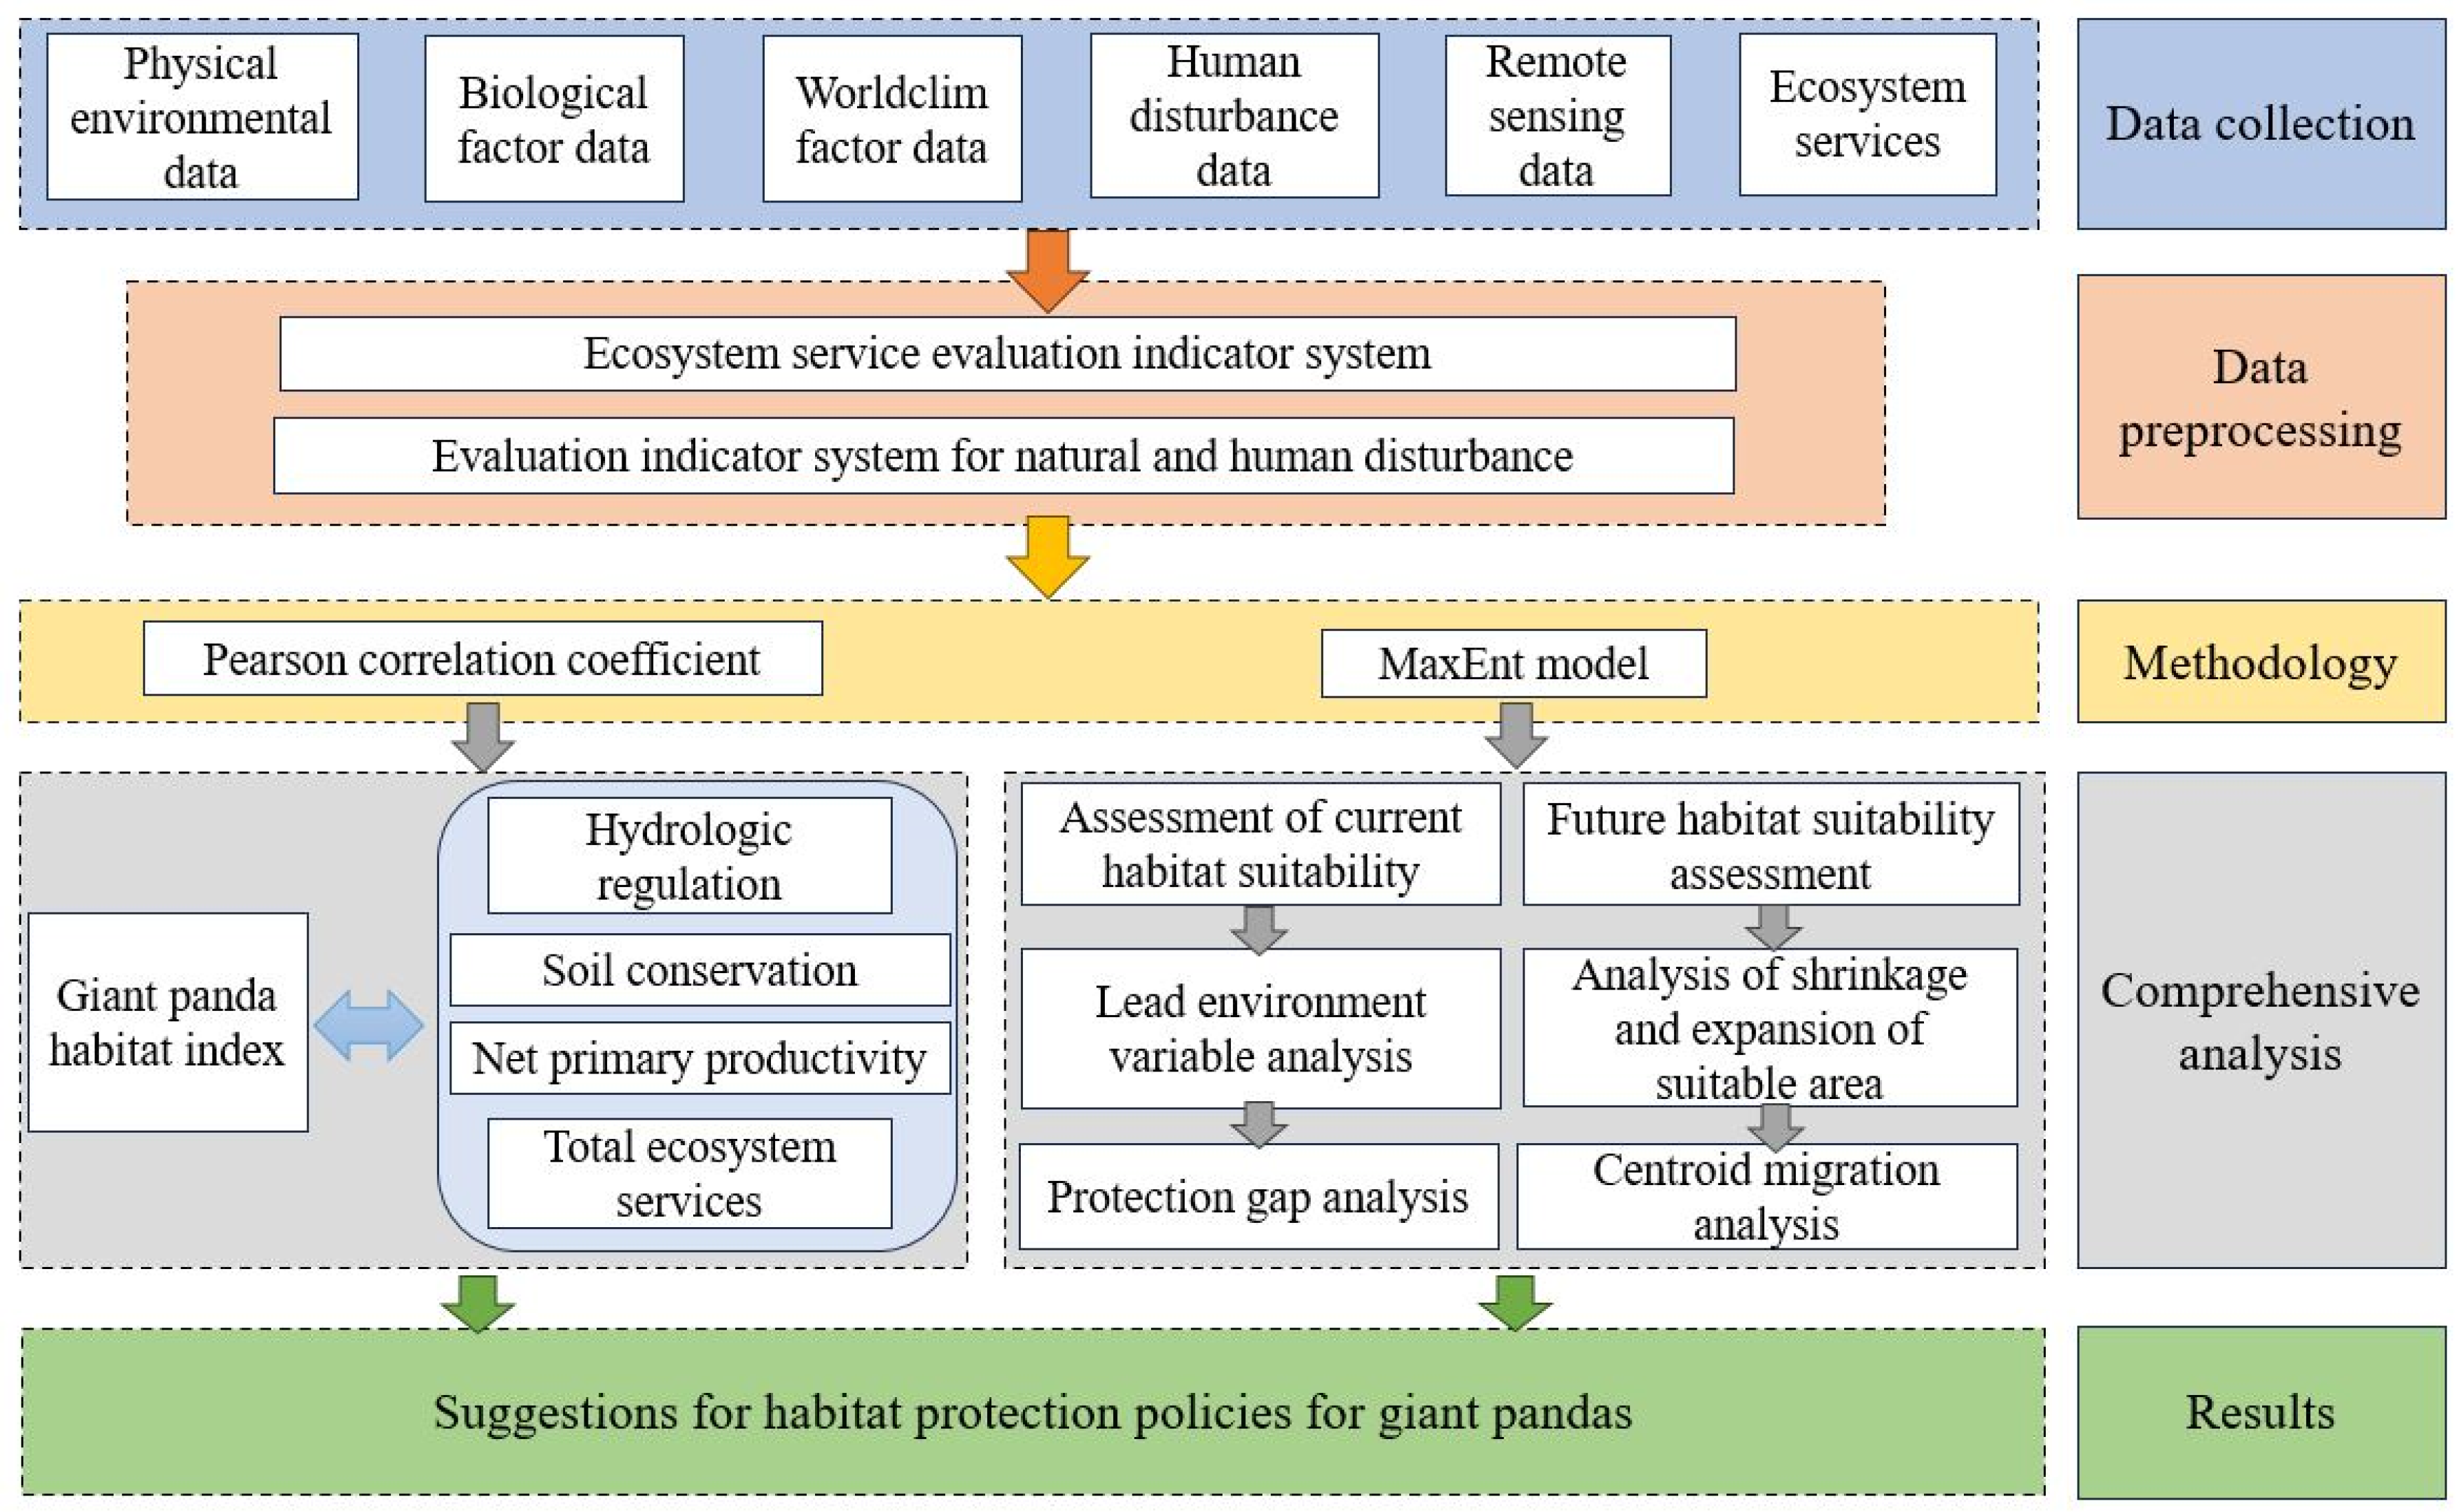
2.2. Research Methods

2.2.1. Calculation of Suitable Habitat Index for Giant Pandas

(1)
Species distribution data
The data on the distribution points of giant panda were obtained from the fourth giant panda survey conducted in Shaanxi Province (2012–2013), with a total of 303 points. To avoid the influence of spatial autocorrelation on model prediction, based on the minimum activity radius of the giant pandas [29], in ArcGIS10.2, we established a buffer with a radius of 1.2 km, eliminated trace points with a distance of less than 2.5 km, and finally retained 260 giant panda trace points as distribution points. Finally, we counted the longitude and latitude data of the giant panda distribution points in an Excel table and converted them into the CSV format as required by the MaxEnt model.
(2)
Environmental factors and pretreatment
Giant pandas have rigorous requirements for habitat; climate is an important factor influencing the spatial distribution of the giant pandas [30]. Altitude, slope, and vegetation cover are also commonly used data in giant panda habitat suitability mapping. Previous studies have shown that many human disturbances affect giant pandas and their habitats [31]. Therefore, considering the closely related factors of species, this study selected five factors: climate, terrain, water source, human disturbance, and vegetation cover type to evaluate the habitat suitability of giant pandas in the study area. (a) Climate factor: Select worldclim 2.1 (http://www.worldclim.org/, accessed on 28 February 2019) of 19 a resolution of 1 km × 1 km of the current climate factor. Future climate data (2041–2060, 2081–2100), three shared socio-economic paths (SSP126 (low compulsion scenario), SSP370 (medium to high compulsion scenario) and SSP585 (high compulsion scenario) were selected using the (BCC-CSM2-MR) model of the Coupled Model Intercomparison Project Phase 6 (CMIP6) project. To avoid collinearity between variables leading to overfitting of the model, the corrplot toolkit in R software is used to conduct correlation analysis of 19 climate factors. If Pearson’s coefficient |r| is ≥0.8 among variables, the variables with a small contribution rate in the initial model will be removed. Based on previous research and the ecological niche of giant pandas [32], we finally selected six climatic factors: Bio2 (mean diurnal range), Bio4 (temperature seasonality), Bio10 (mean temperature of warmest quarter), Bio12 (annual precipitation), Bio15 (precipitation seasonality) and Bio18 (precipitation of warmest quarter) to construct the model. (b) Terrain factors: Altitude, slope and aspect data were derived from Digital Elevation Model (DEM) data from the Geospatial Data Cloud (http://www.gscloud.cn/, accessed on 19 September 2019). (c) Water source and human interference factors: The river, settlement, and road data come from the National Geomatics Center of China (http://www.ngcc.cn/, accessed on 30 December 2021). (d) Vegetation cover type: The data are derived from the National Ecosystem Survey and Assessment of China (2010–2015). Mask extraction and classification of vegetation cover type data in 2015 come from ArcGIS 10.2. Finally, 6 climate factors, 3 terrain factors, 1 water source factor, 2 human interference factors, and 1 vegetation cover factor were selected, and 13 environmental factors were considered in the modeling.
(3)
MaxEnt model analysis
The MaxEnt model was constructed by S.J. Phillips and others in 2004, and it is currently recognized as the most widely utilized ecological niche model (ENM) [33]. Due to its primary application in the prediction of species distribution areas, it is also classified as a species distribution model (SDM). We input the latitude and longitude information of giant pandas and filtered environmental variables into MaxEnt 3.4.1 for modeling. A total of 75% of the point data were randomly selected for simulation training, while the remaining 25% were used as the test dataset. To evaluate the accuracy of the MaxEnt model, receiver operating characteristic (ROC) analysis was used. The area under ROC function (AUC) is a performance indicator widely used to indicate the model’s ability to distinguish between suitable and unsuitable habitats [34]. An AUC close to 1 indicates a more optimal model, and models with an AUC greater than 0.7 are considered to achieve acceptable performance [35].
(4)
Suitable habitat classification criteria
The average ASCII data output from 10 runs of the MaxEnt model was imported into ArcGIS 10.2 software for visualization and reclassification. The model prediction result value is between 0 and 1, with values closer to 1 indicating a greater likelihood of species presence. The distribution areas were categorized into 4 levels: high suitability area (>0.46), medium suitability area (0.25–0.46), low suitability area (0.08–0.25), and unsuitable area (<0.08) [36].

2.2.2. Methods of Ecosystem Service Evaluation

(1)
Hydrological regulation
This term relates to the role an ecosystem plays in the various movements and changes of water in nature [37]. The formula is as follows:
Q = A · J · R
J = J 0 · K
R = R 0 R g
where Q is the increase of water conservation in the forest, grassland, wetland, cultivated land, desert, and other ecosystems compared with bare land (mm/(hm2·a−1)); A is the ecosystem area (hm2); J is the multi-annual runoff rainfall (p > 20 mm) (mm) in the calculation area; J0 is the total annual rainfall in the calculation area (mm); K is the proportion of runoff producing rainfall to total rainfall in the calculation area; R is the benefit coefficient of ecosystem in reducing runoff compared with bare land (or clear-cut land); R0 is the runoff rate of bare land under the condition of runoff producing rainfall.
(2)
Soil conservation
Soil conservation in an ecosystem is the difference between potential erosion and actual erosion [38], which is calculated using the universal soil loss equation (USLE) [39] as follows:
S C = S E p S E a
S E p = R K L S
S E a = R K L S C
where SC is the soil conservation amount (t hm−2 a−1); SEp is the potential soil erosion amount (t hm−2 a−1); SEa is the actual soil erosion amount (t hm−2 a−1); R is the rainfall erosivity factor (MJ mm hm−2 h−1 a−1); K is the soil erodibility factor (t hm2 h hm−2MJ−1 mm−1); LS is the terrain factor; C is the vegetation coverage factor.
(3)
Net primary productivity
The net primary productivity (NPP) was calculated using the remote sensing light energy utilization of the Carnegie–Ames–Stanford Approach (CASA) model. The estimation of NPP in the CASA model can be expressed by the two factors of absorbed photosynthetically active radiation (APAR) and actual light energy utilization (ε), and the estimation formula is as follows [40]:
N P P ( x , t ) = A P A R ( x , t ) × ε ( x , t )
where APAR (x, t) represents the photosynthetic effective radiation absorbed by pixel x in month t (g C·m−2·month−1), and ε(x,t) represents the actual light energy utilization rate of pixel x in month t (g C·MJ−1).
(4)
Calculation of total ecosystem services
Firstly, the ecosystem services of two periods are averaged, and then, based on the entropy weight method [41], the ecosystem services are normalized, and the weights of hydrological adjustment service, soil conservation service, and net primary productivity are determined to be 0.32, 0.49, and 0.19, respectively, and the weighted sum analysis was carried out. The spatial distribution of total ecosystem services in the Qinling Mountains was obtained:
E S s u m = E w a t e r + E s o i l + E n p p
where ESsum is the total ecosystem service, Ewater represents the value of hydrological regulation, Esoil represents the value of soil conservation, and Enpp represents the value of net primary productivity.
(5)
Data sources for ecosystem services mapping
The sources of ecosystem service data are shown in Table 1:

2.2.3. Calculation of Relationship between Suitable Habitat Index and Ecosystem Services of Giant Panda

The Pearson correlation coefficient method based on Origin software [42] was used to analyze the correlation between the suitable habitat index of giant pandas in the Qinling Mountains and hydrological regulation, soil conservation, net primary productivity, and total ecosystem services. The correlation coefficient matrix was used to analyze the relationships between the suitable habitat index of giant pandas and hydrological regulation services, soil conservation services, net primary productivity and total ecosystem services.

3. Results

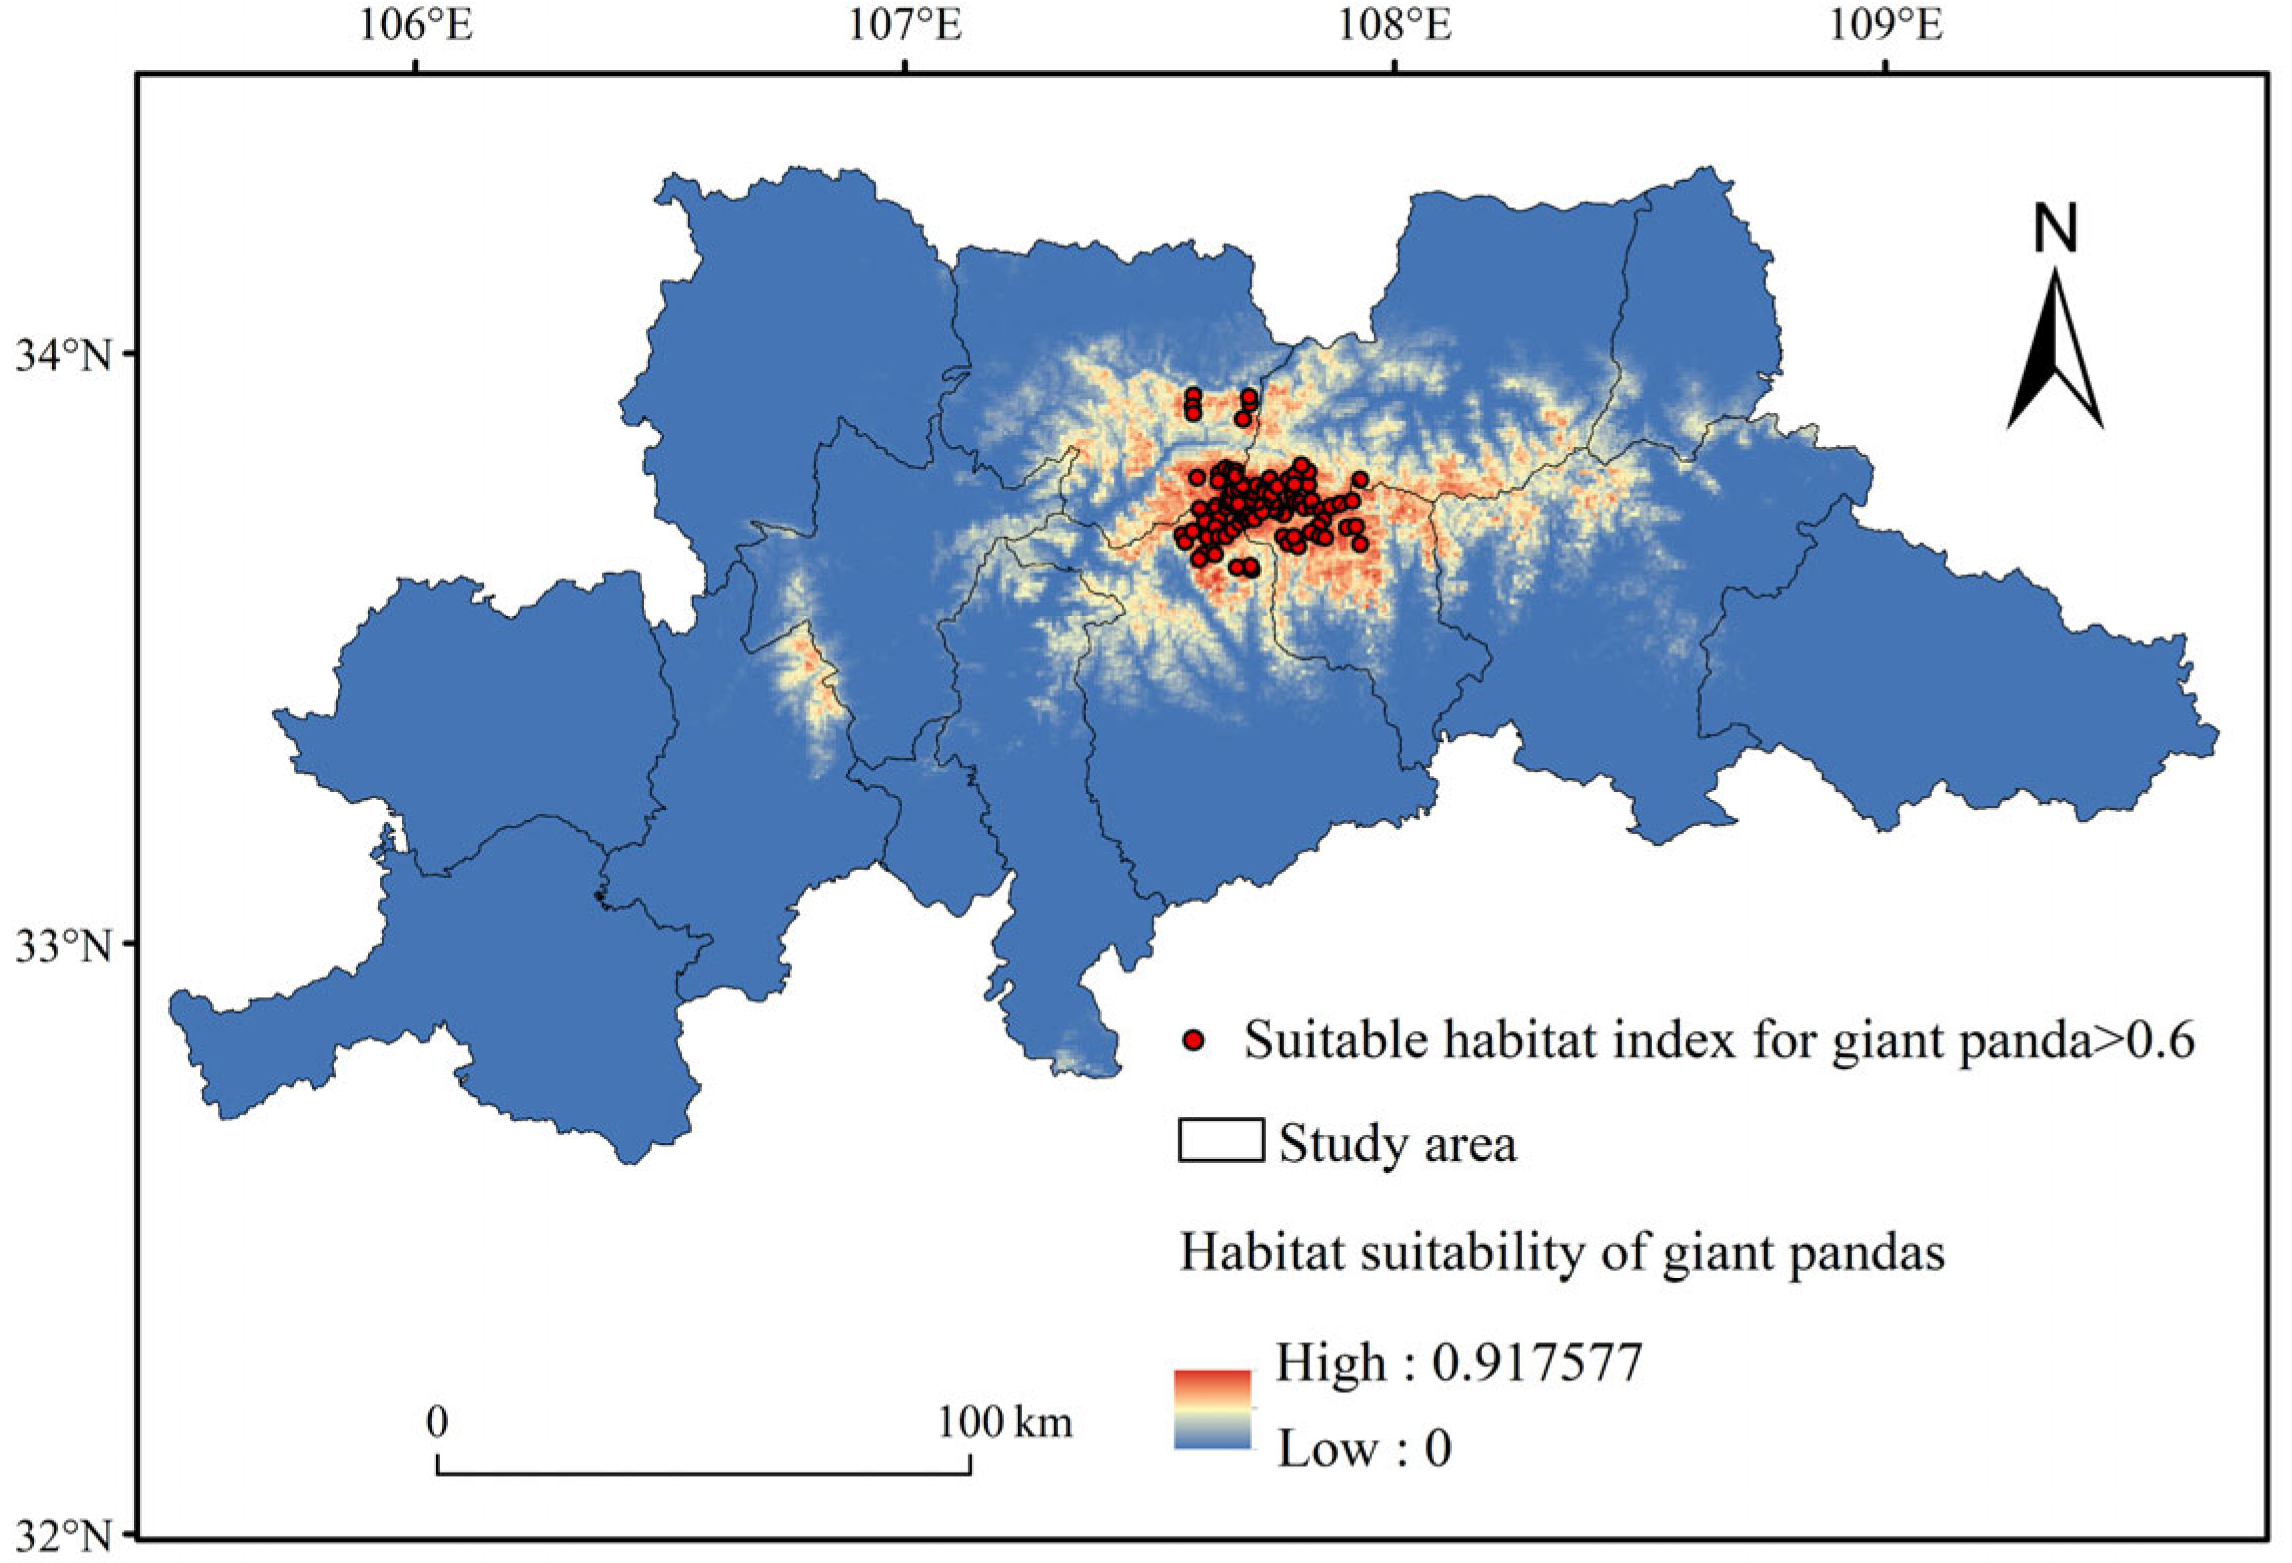
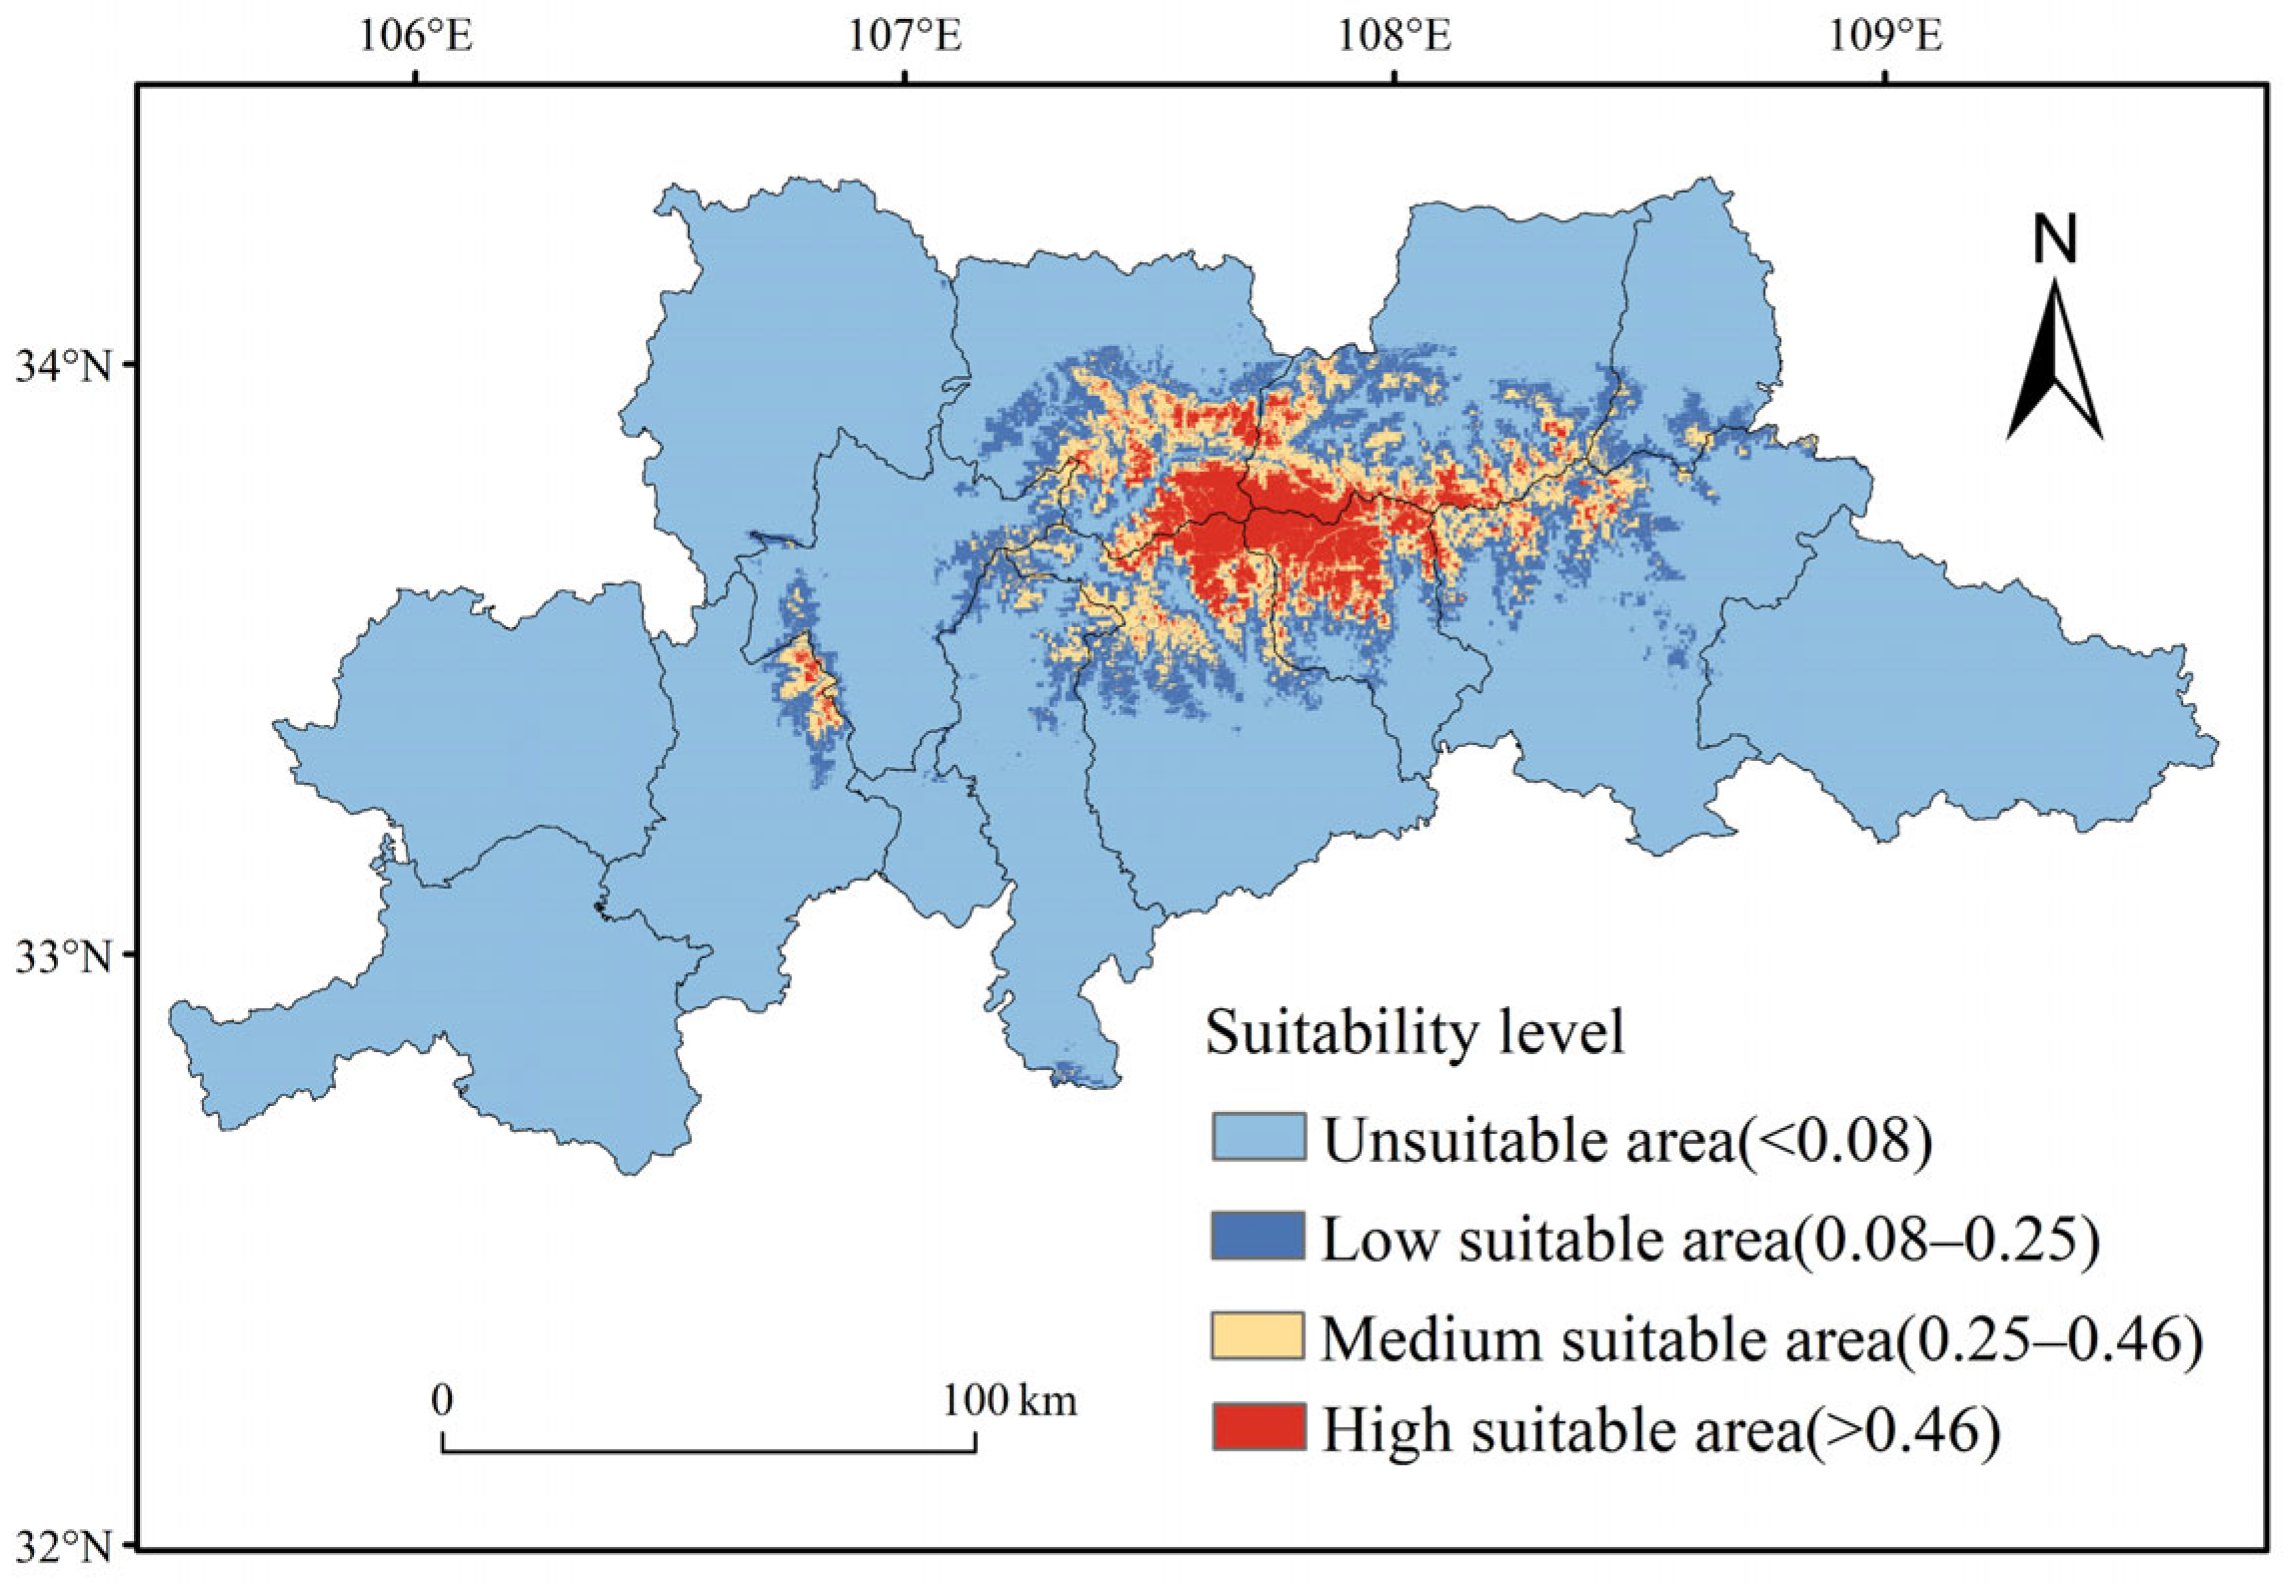
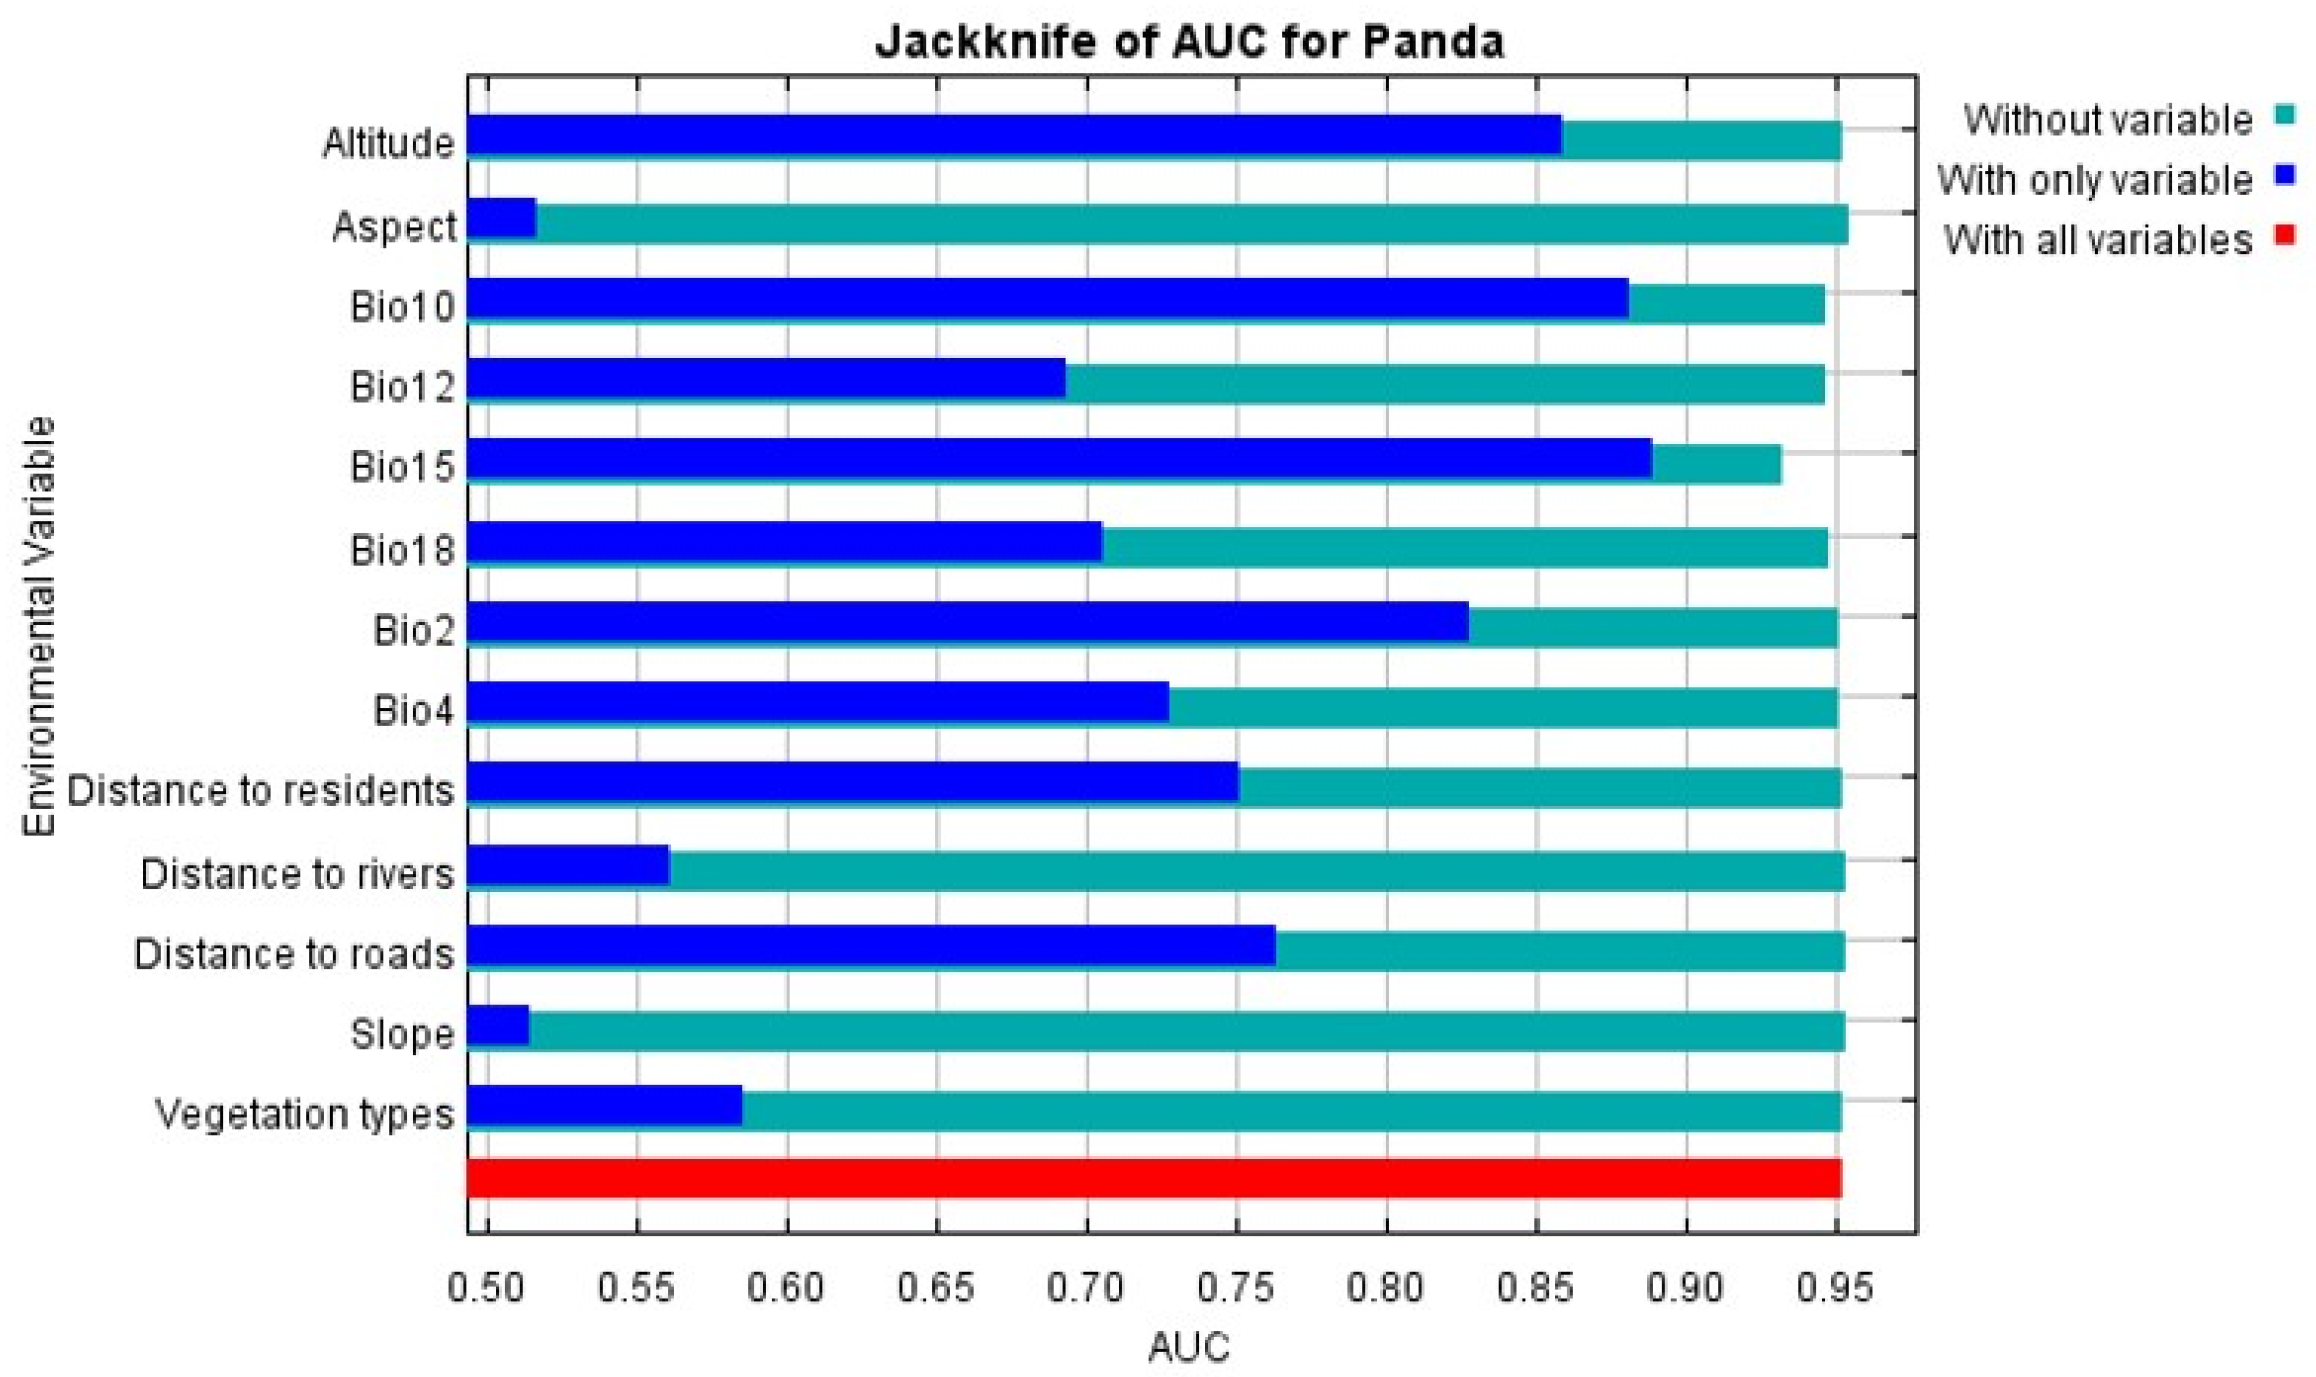
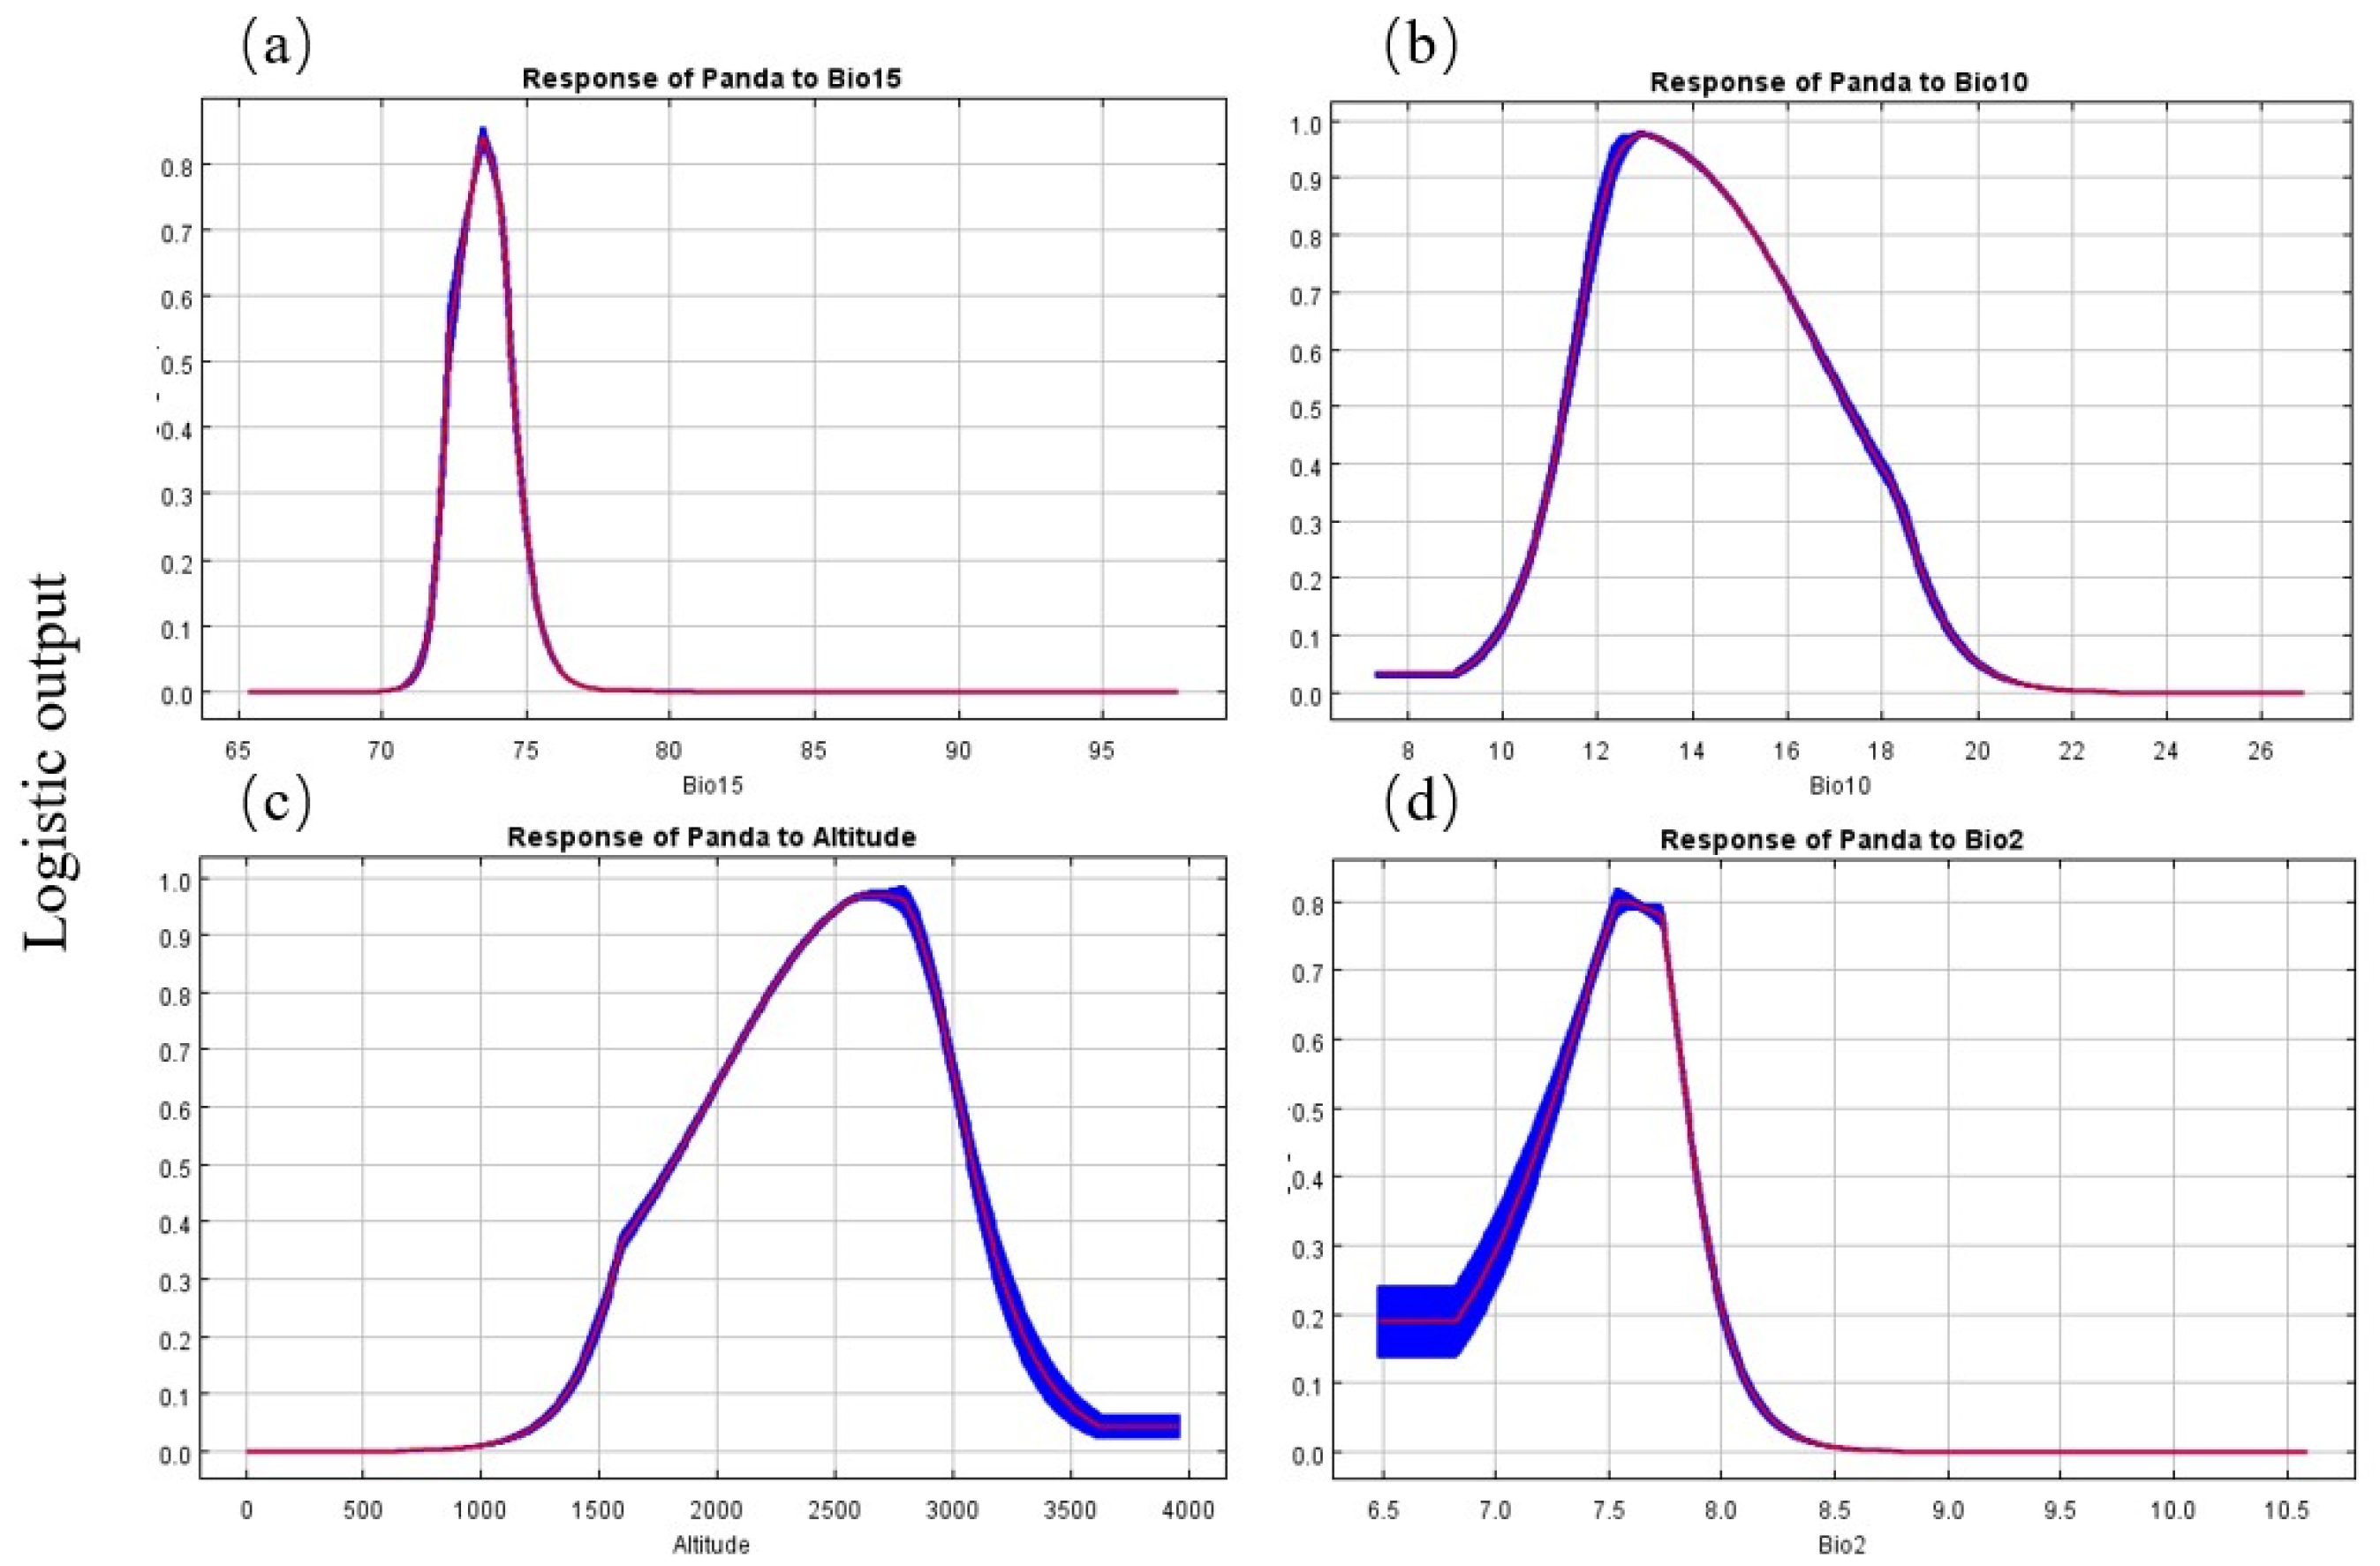
3.1. Suitable Habitat Index for Giant Pandas

The prediction results show that the AUC value predicted by the MaxEnt model under current climate conditions is 0.965 ± 0.002. The results show that the MaxEnt model can be used to predict the potential habitat area of wild giant pandas in the Qinling Mountains with high reliability and no randomness. The constructed model can be used to predict the potential habitat range of wild giant pandas in the Qinling Mountains. According to the suitable habitat index of giant pandas, areas with higher habitat indices are also areas with higher suitability predicted by the model (Figure 3), which verifies the rationality of the correlation analysis between the habitat index and ecosystem services for giant pandas and the prediction of the MaxEnt model.

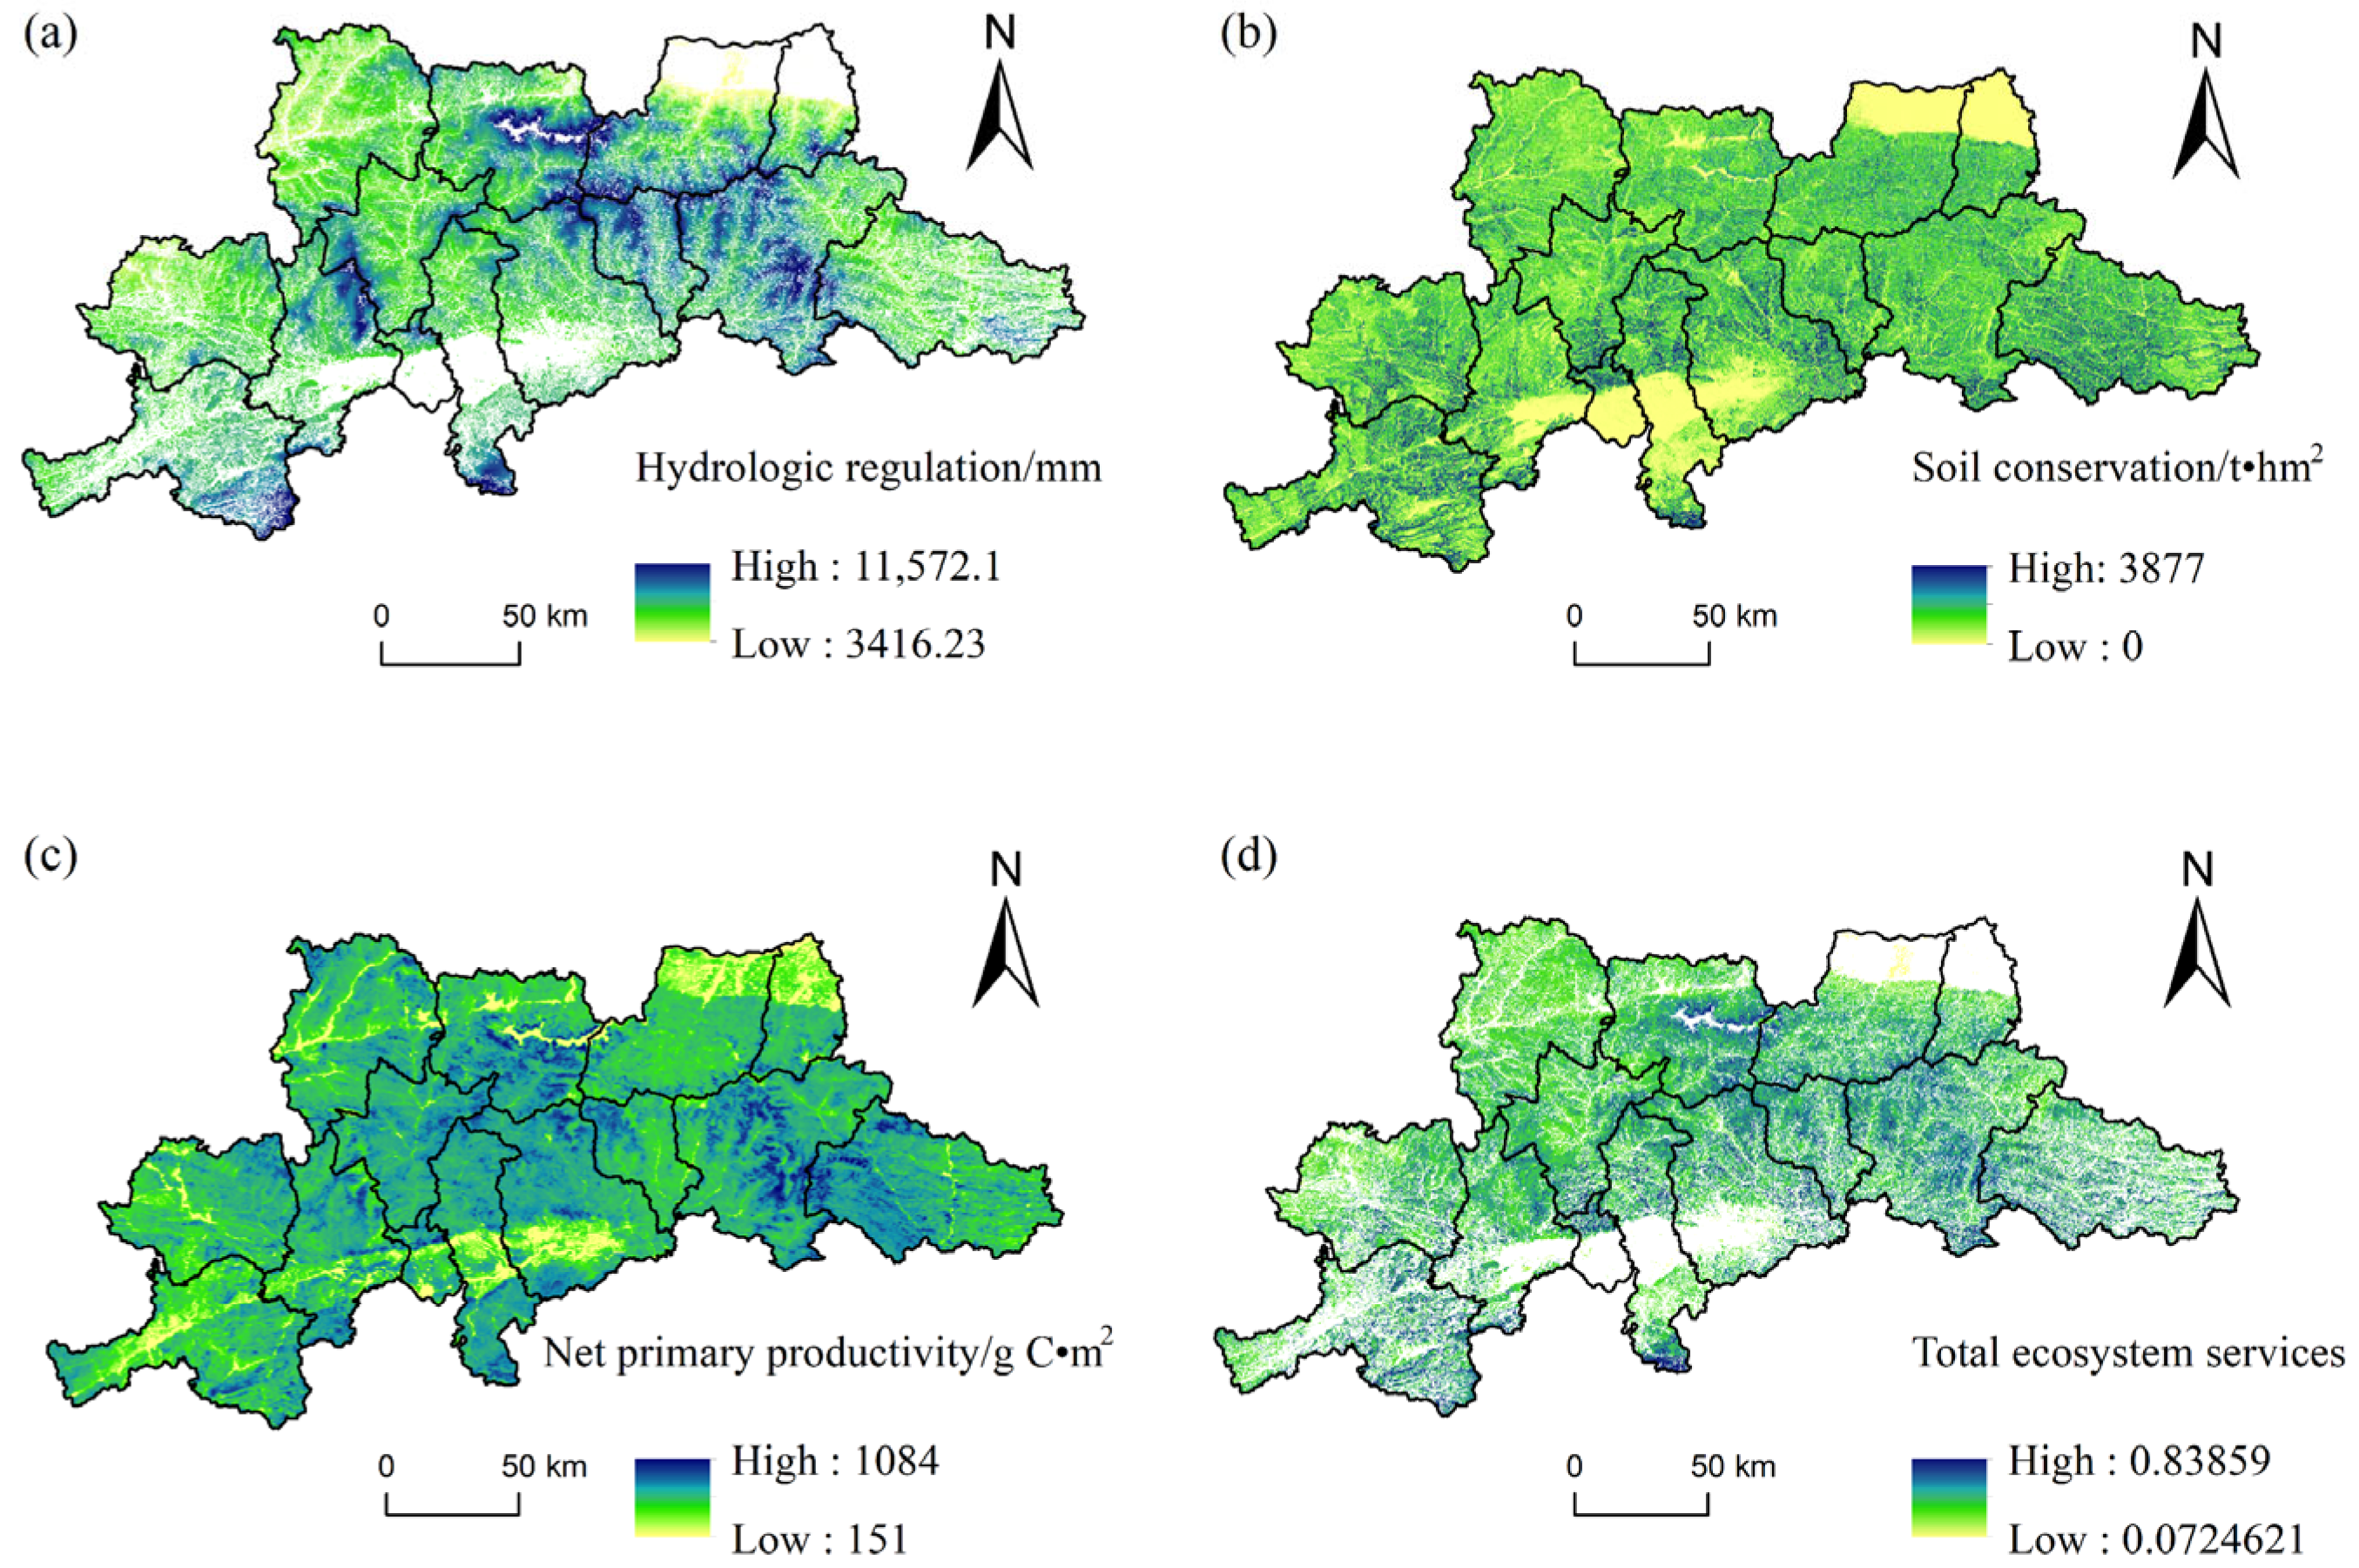
3.2. Spatial Distribution Pattern of Ecosystem Services

The Qinling Mountains’ spatial distribution pattern of ecosystem services is shown in Figure 4. Hydrological regulation services are affected by altitude. High-altitude mountain grassland resources are rich and abundant in rainfall, according to the optimal hydrology regulation service. Soil conservation is influenced by topography and vegetation coverage. The northern parts of Zhouzhi County and Hu County, the southeastern part of Mian County, the southern part of Hantai District, the central part of Chenggu County, and the southwestern part of Yang County have the lowest soil conservation services due to low elevation, shallow slope, and low vegetation coverage. Net primary productivity services have a higher service value in high-altitude areas because of their high vegetation coverage and their high carbon sequestration function. Due to the impacts of topography and human activities, low ecosystem services were concentrated in northern Zhouzhi County and Hu County, southeastern Mian County, southern Hantai District, central Chenggu County, and southwestern Yang County.

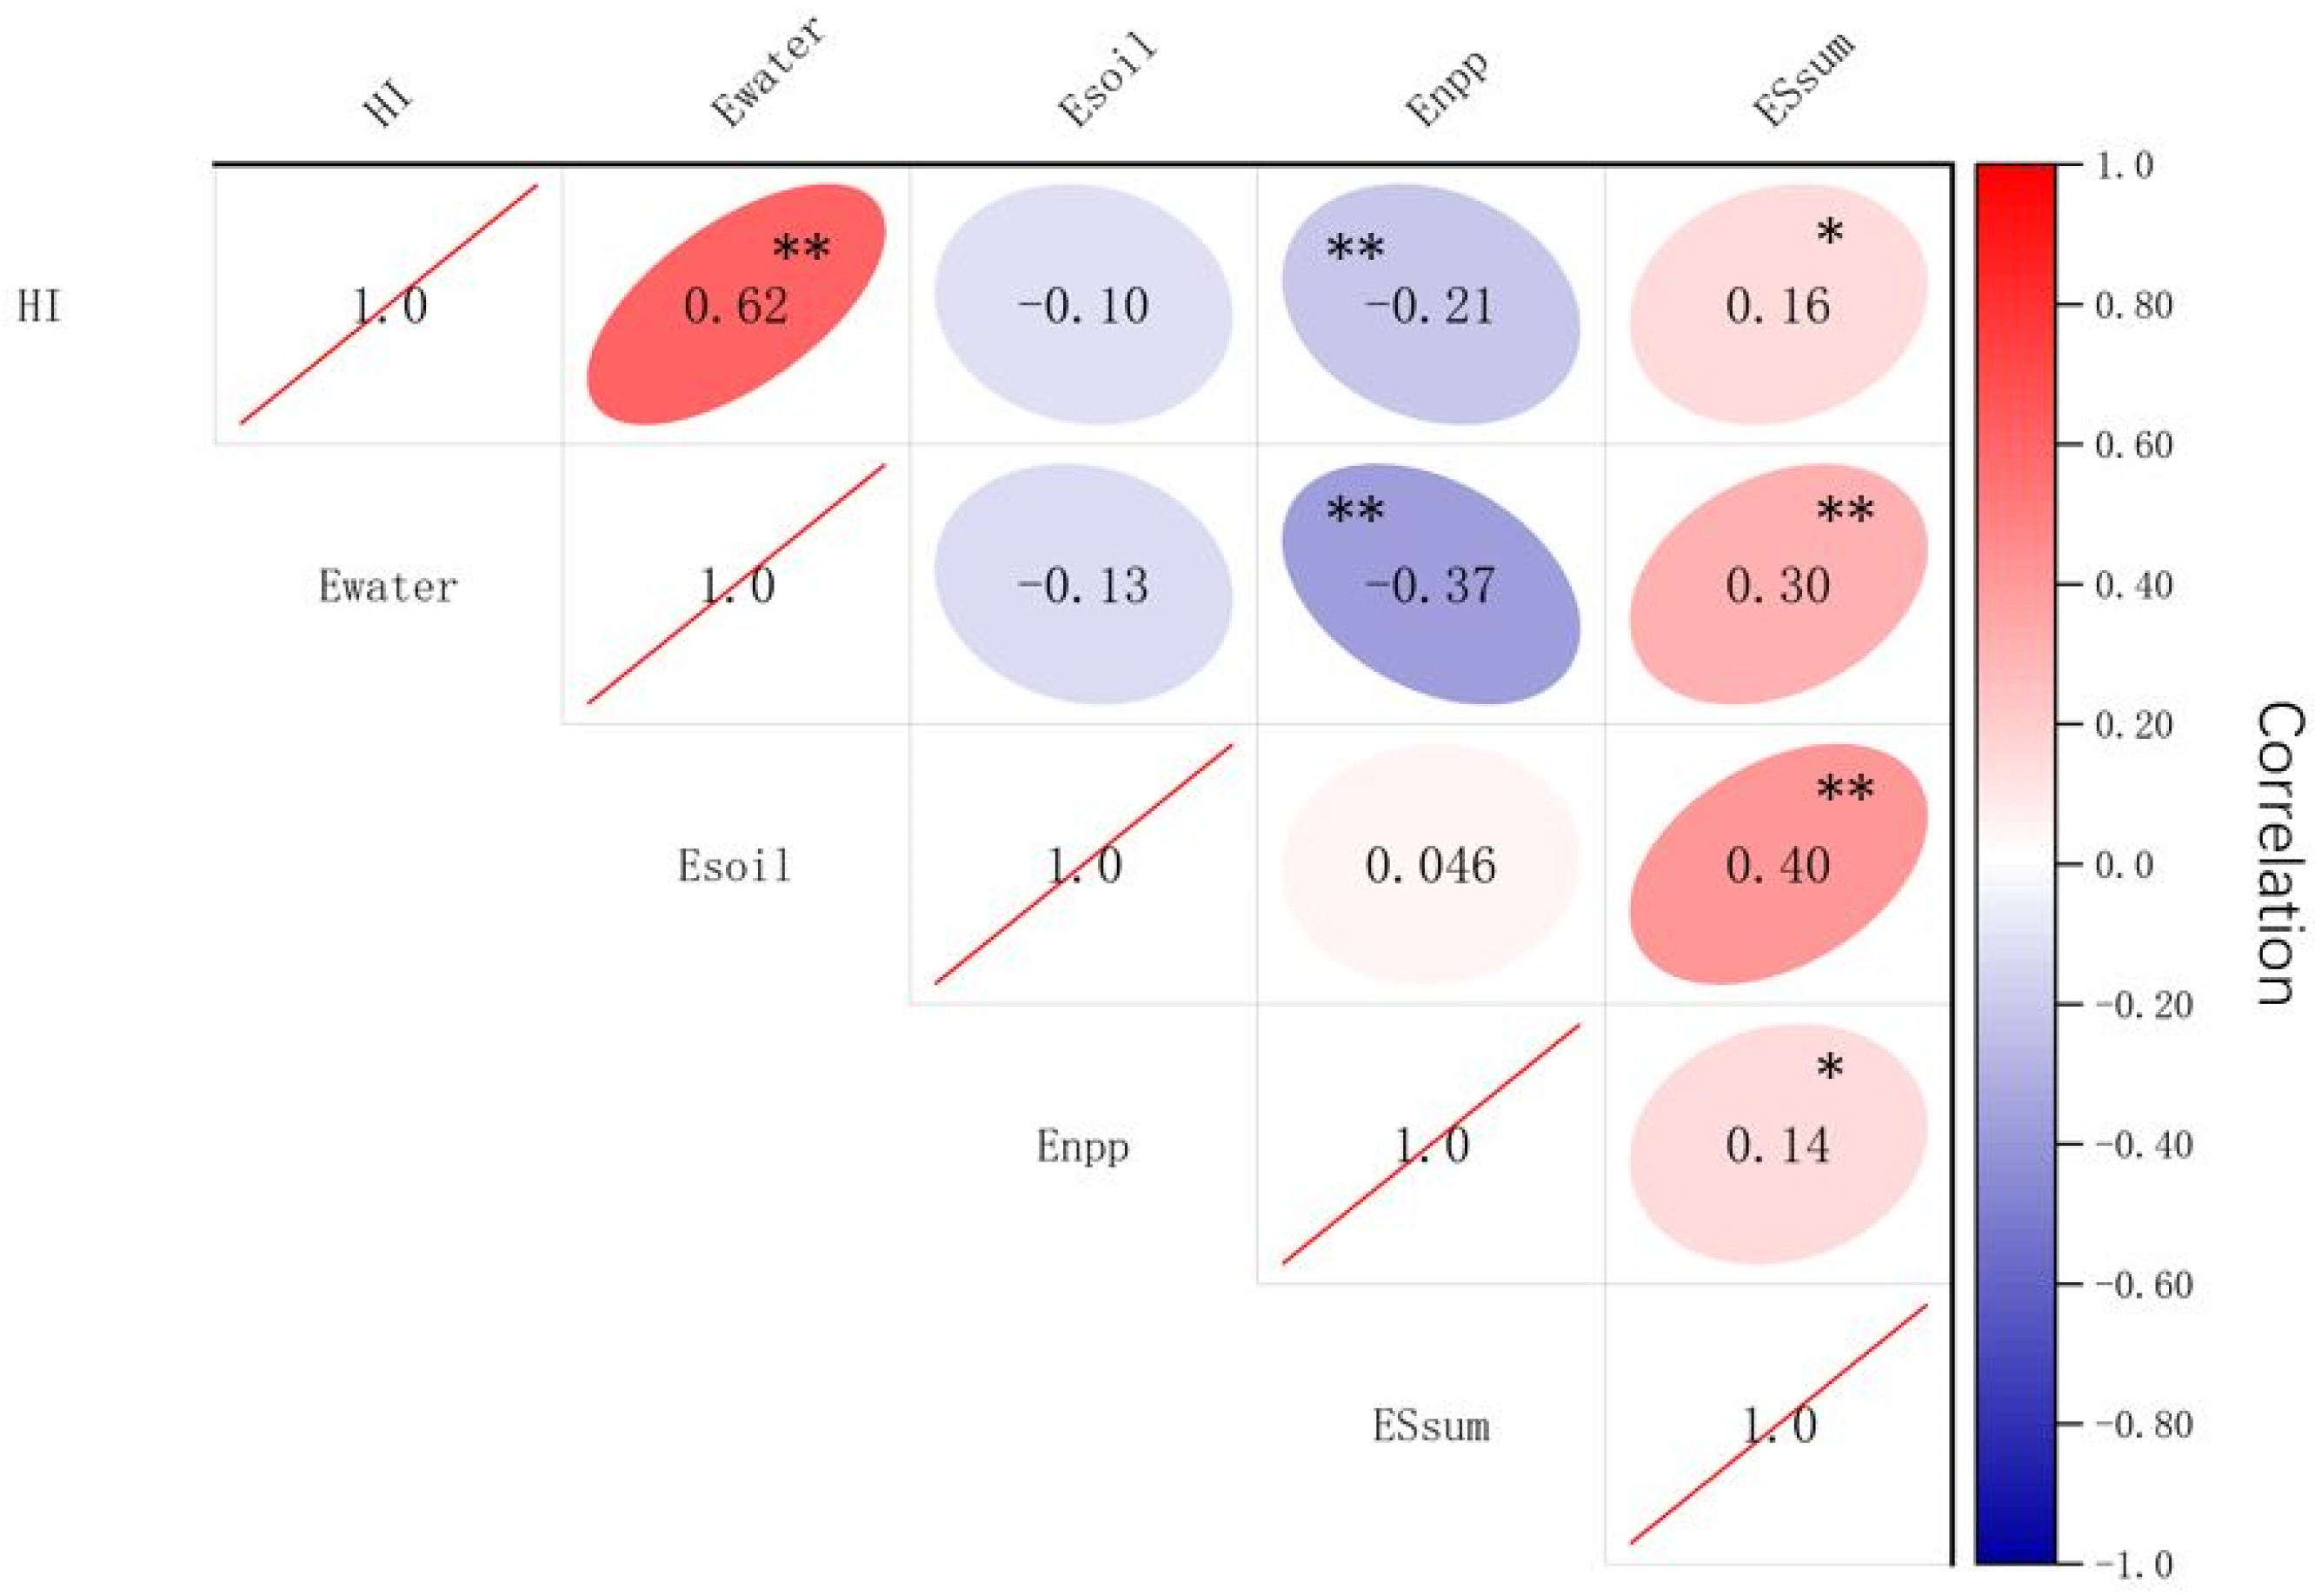
3.3. Relationship between Suitable Habitat Index and Ecosystem Services of Giant Panda

Correlation analysis of suitable habitat index of giant panda and ecosystem services (Figure 5). From the perspective of correlation characteristics, the suitable habitat index of giant pandas in the Qinling Mountains was positively correlated with hydrological regulation services and total ecosystem services, and the correlation between the suitable habitat index and hydrological regulation was 0.62, indicating a very significant positive correlation. The correlation between the suitable habitat index of giant pandas and NPP was −0.21, and at the 0.01 level, the correlation was significant, indicating a highly significant negative correlation between the suitable habitat index of giant pandas and NPP. There was a negative correlation between the suitable habitat index and soil conservation of giant pandas.

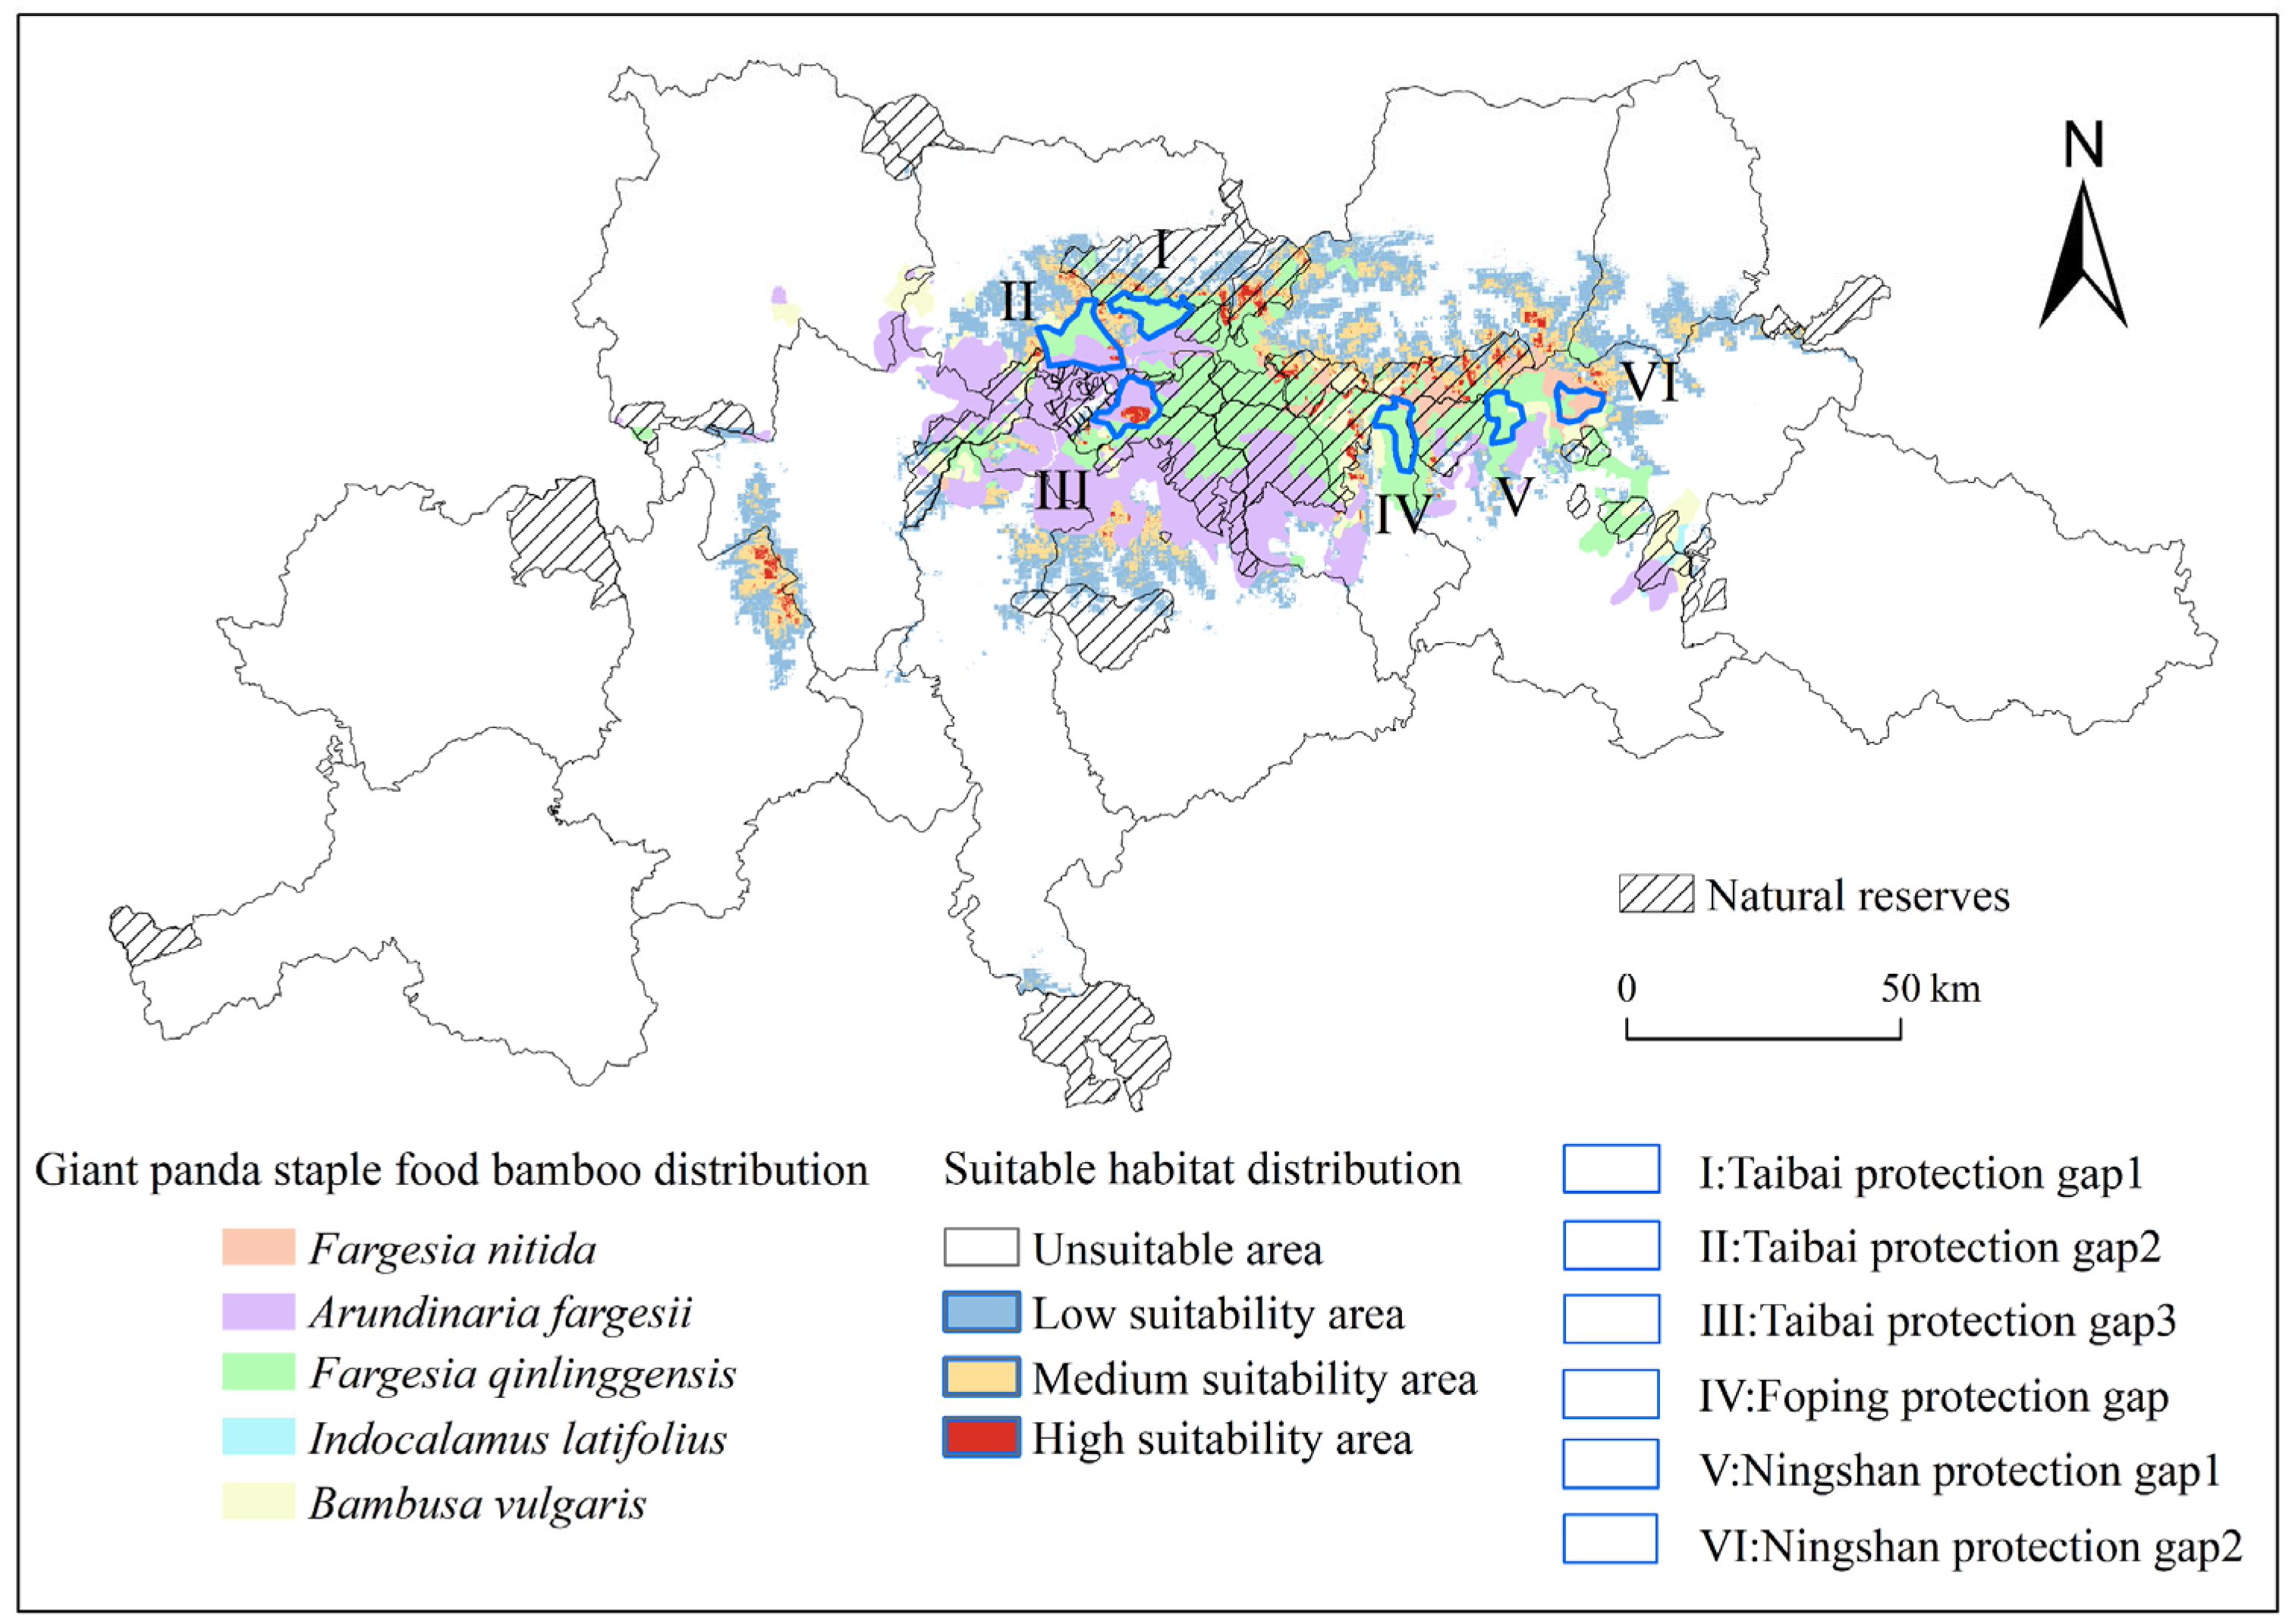
3.4. Analysis of Gaps in Wild Giant Panda Habitat Protection

The predicted results show that the habitat area of giant pandas in the Qinling Mountains is mainly distributed in the Xinglong Mountains, the branch of the Qinling Mountains at the junction of Foping County, Yang County, Zhouzhi County, and Taibai County, and a few areas such as Ningshan County, Liuba County, and Mian County (Figure 6). The high habitat area is mainly distributed in the Xinglong Mountain area with good connectivity. Under the current climate conditions, the Xinglong Mountain area is an important habitat for giant pandas. The suitable habitat area of giant pandas in the Qinling Mountain is about 5875.42 km2, accounting for 16.82% of the total area of the study area. The area of highly suitable habitat area is the least, at 1153.75 km2, accounting for 19.63% of the total suitable habitat area. The area of low suitable growth is the largest, at 2843.03 km2, accounting for 48.39% of the total suitable growth area.
The results of vacancy analysis (Figure 7) indicate that the total area of the established nature reserves is 4125.33 km2, covering an area of 2537.73 km2 of suitable habitat, accounting for 43.19% of the total suitable habitat. There are still 3337.69 km2 of suitable habitat for giant pandas outside the reserve, accounting for 56.81% of the total habitat area for giant pandas. Bamboo areas, which are giant pandas’ main food source, span 4031.79 km2. Mostly, these consist of Arundinaria fargesii and Fargesia qinlingensis, making up about 83.3% of the key food bamboo areas, while Bambusa vulgaris, Fargesia nitida, and Indocalamus latifolius are other, lesser components. The predicted suitable habitat matches the staple food of giant pandas, which verifies the accuracy of the prediction results. However, some areas are still predicted to be suitable for more habitat and have a distribution of staple bamboo that has not been protected. These protection gaps are mainly distributed in the six regions shown in Figure 7.

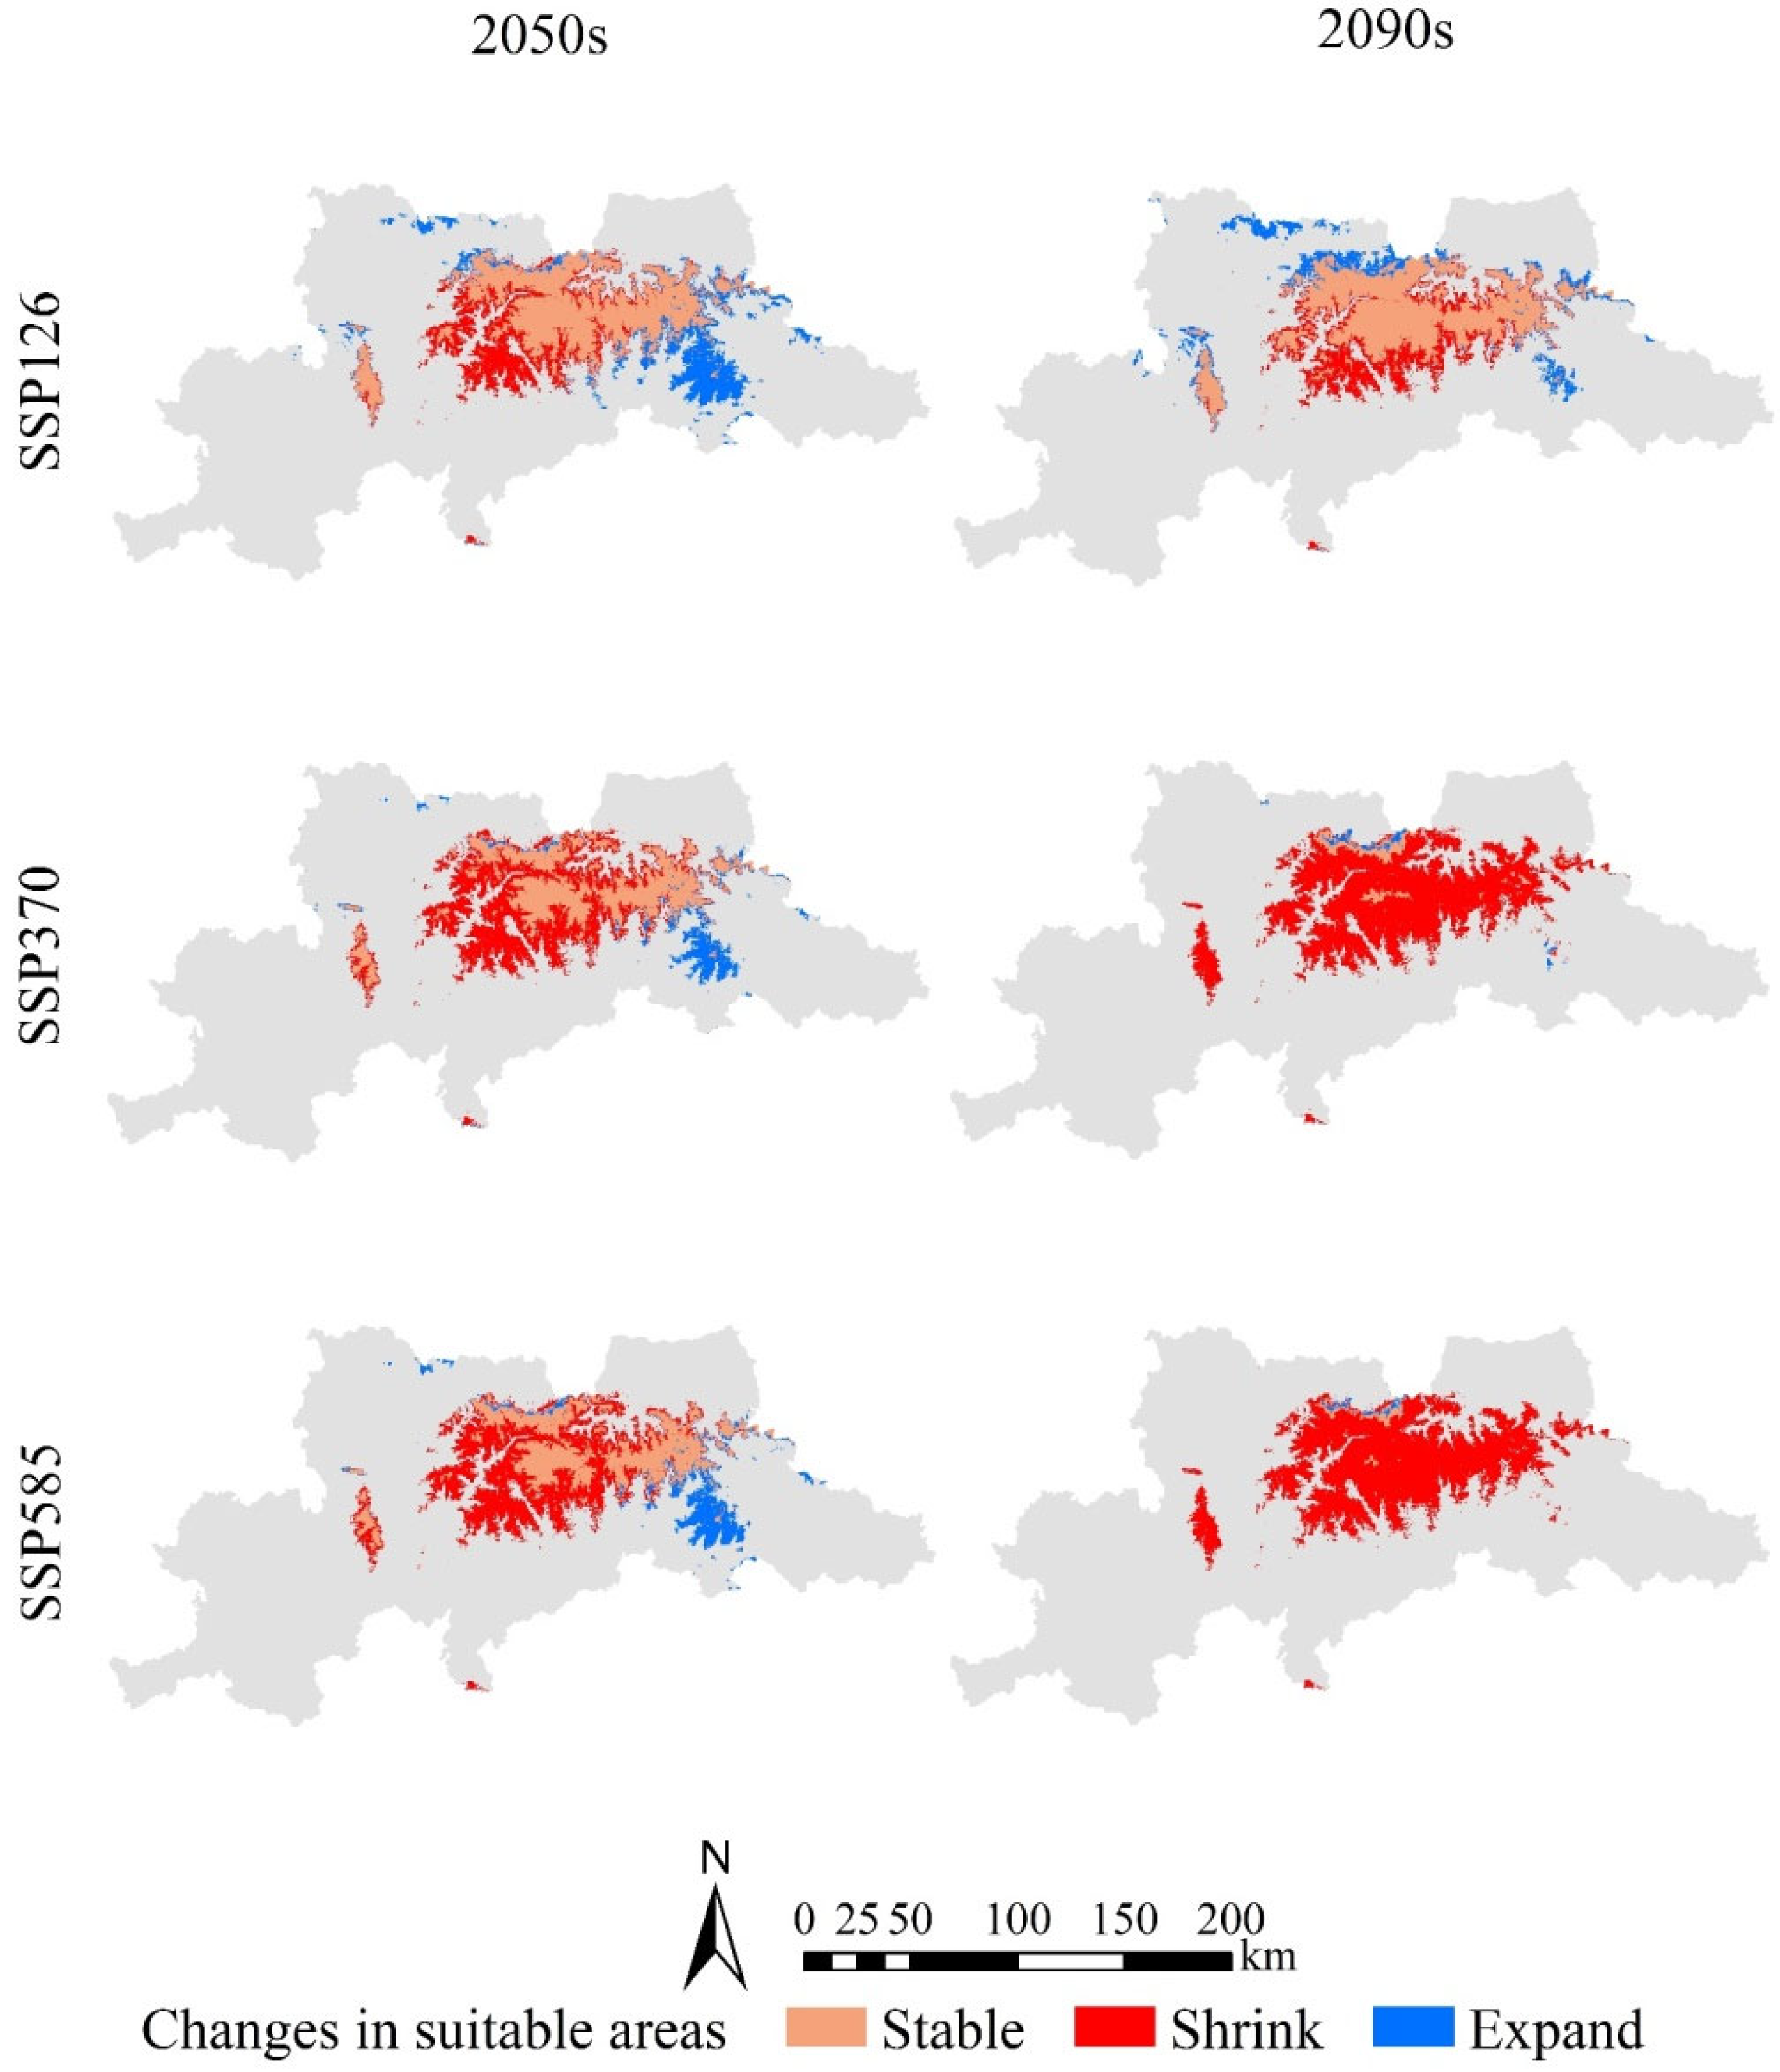
3.5. Distribution and Change of Potential Suitable Habitat of Giant Panda in the Qinling Mountains using Future Climate Scenarios

The AUC values predicted by the MaxEnt model in different climate scenarios in the future are all greater than 0.958 (Table 2), indicating that the prediction results of the model are relatively reliable and can be used to predict and analyze habitat suitability in subsequent climate change scenarios.
Compared with the current climate prediction results, the total suitable living area of giant pandas in the future climate scenario will continuously decrease. The suitable living areas in low, medium and high force scenarios are also shrinking (Table 3). In the SSP585 scenario of the 2090s, the suitable area will shrink the most, with the total suitable area being only 88.45 km2. In the SSP126 scenario of the 2050s, the area of suitable habitat will shrink the least, with the total area shrinking by 2810.48 km2, of which the portion of high fitness areas will shrink by 1013.94 km2, the area of the medium fitness by 1118.79 km2, and the area of low fitness by 677.75 km2.
In climate change scenarios, the potential suitable areas for Qinling giant pandas are concentrated in Taibai, Zhouzhi, Foping, Yang, Ningshan, Liuba, and Mian Counties and other regions (Figure 8). In the SSP126 scenario, compared to the current situation, the border areas of Taibai, Zhouzhi, Foping, and Yang Counties are relatively stable. The suitable area of the high altitude area in Taibai County continued to expand, and the suitable area of the high altitude area in Ningshan County first expanded and then contracted. In the SSP370 scenario, compared with the current situation, the area of suitable areas in Taibai, Zhouzhi, Foping, and Yang Counties shrank significantly in the 2050s, while the areas suitable for growth in high-altitude areas of Ningshan County expanded significantly. By comparing these results with projections for the 2050s, it can be observed that only a small portion of suitable habitats remain in Yang County and Taibai County during the 2090s; the remaining areas shrink completely while experiencing notable expansion solely within high-altitude northern regions of Taibai County. The SSP585 scenario is similar to the SSP370 scenario, but the contraction of the adaptive zone is more pronounced.

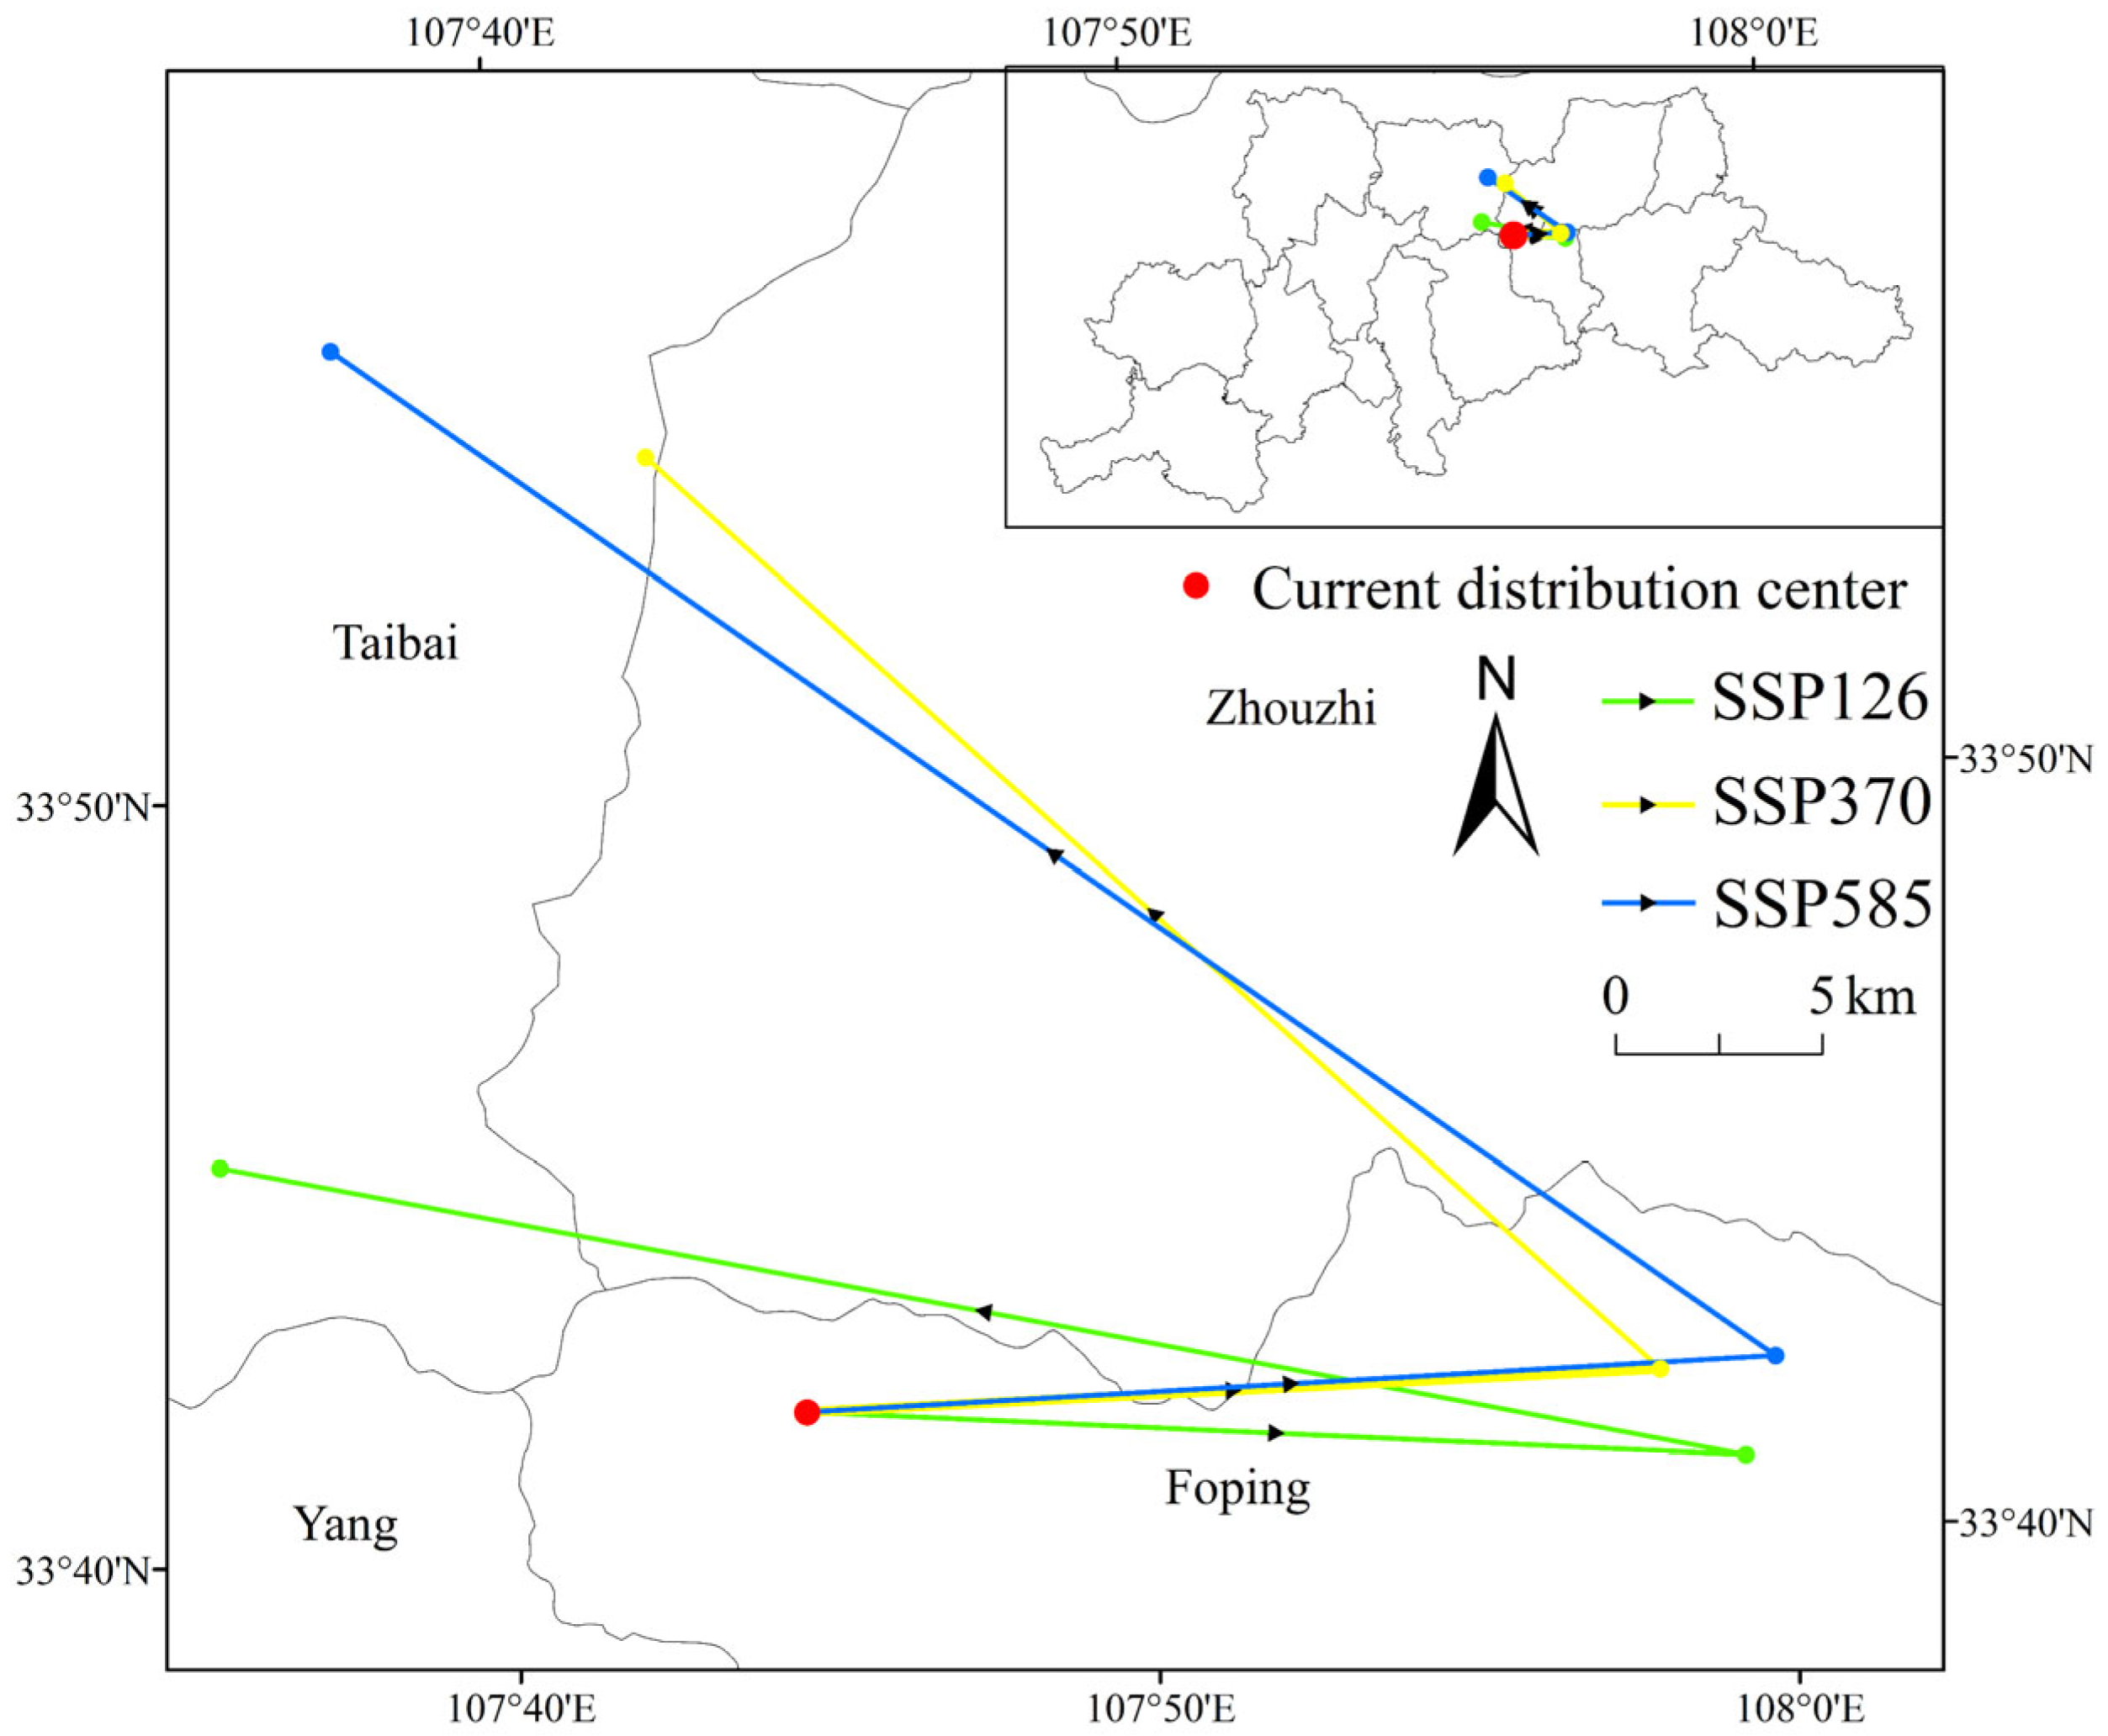
3.6. Centroid Migration and Influencing Factors of Giant Panda in the Qinling Mountains in Climate Change

The centroid of the potential habitat for giant pandas in the context of climate change quantitatively describes the changes in their habitat (Figure 9). The simulation results of the MaxEnt model indicate that the distribution center of giant pandas usually migrates eastward and then northwestward from the current to the future. At present, the distribution center of mass of giant pandas in the Qinling Mountains is located in the northwest of Foping County (107.74° E, 33.7° N). In the future climate scenarios, the centroid of the suitable area will change significantly, migrating from Foping County to Taibai County. In the SSP126 scenario, the centroid of the suitable zone in the 2050s is located in the northeast of Foping County (107.99° E, 33.68° N), with a migration distance of 22.73 km. The centroid of the suitable zone in the 2090s moves towards the northwest direction and reaches the southeast of Taibai County (107.59° E, 33.75° N), the migration distance is 37.57 km; in the SSP370 scenario, the centroid of the suitable zone in 2050s is located in the northeast of Foping County (107.96° E, 33.7° N), with a migration distance of 20.67 km, and the centroid of the suitable zone in 2090s migrates towards the northwest and reaches to the junction of Taibai County and Zhouzhi County (107.3° E, 33.9° N), with a migration distance of 33.02 km; in the SSP585 scenario, the centroid of the suitable zone in 2050s is located in the northeast of Foping County (108° E, 33.7° N), with a migration distance of 23.46 km. In the 2090s, the centroid of the suitable zone migrates to the northwest and reaches the east of Taibai County (107.63° E, 33.93° N), with a migration distance of 42.59 km.
The analysis of 13 environmental factors that significantly impact the distribution of giant pandas in the Qinling Mountains is shown in Figure 10. From the percent contribution, the top three environmental factors are Bio10 (mean temperature of warmest quarter) (46.7%), Bio15 (precipitation seasonality) (21.4%) and Bio12 (annual precipitation) (17%); the cumulative contribution rate is 85.1% (Table 4); in terms of permutation importance, the top three environmental variables are Bio12 (34.9%), Bio10 (23.1%), and Bio18 (Precipitation of warmest quarter) (22.2%); the cumulative contribution rate is 80.2% (Table 4). From the comparison of the importance of the Jackknife, Bio15, Bio10, altitude, and Bio2 are the most crucial. To sum up, Bio15, Bio10, altitude, and Bio2 are the dominant environmental factors affecting the geographical distribution of giant pandas in the Qinling Mountains.
It is generally accepted that when the distribution probability is greater than 0.5, its corresponding ecological factor value is suitable for the growth of the species [32]. The suitable range of Bio15 (precipitation seasonality) is 72–74 mm, the suitable range of Bio10 (mean temperature of warmest quarter) is 11.5–17.5 °C, the suitable range of altitude is 1800–3100 m, and the suitable range of Bio2 (mean diurnal) range is 7.3–7.8 °C (Figure 11).
In different climate scenarios in the future, the dominant environmental factors will remain roughly unchanged, but from the perspective of distribution probability, the suitable range of all leading environmental variables will show an expanding trend, and the suitable range of Bio15 will be 72–78 mm. The suitable range for Bio10 is 11.1–17.2 °C. Altitude suitable range is 1750–3100 m. The suitable range for Bio2 is 6.8–9.7 °C.

4. Discussion

4.1. Analysis of the Correlation between Suitable Habitat and Ecosystem Services of Giant Panda

According to Pearson correlation analysis, there is a significant positive correlation between the suitable habitat index of giant pandas and hydrological regulation services, which is because the giant panda has formed a foraging strategy based on subalpine mangosteen as its staple food after thousands of years of evolution and adaptation [43]. The distribution of bamboo is closely related to the habitat quality of giant pandas. Bamboo forests not only provide sufficient food for giant pandas but also serve as an excellent hiding place for them. High-altitude mountain areas have strong plant growth, high hydrology regulation services, and dense bamboo forests. They can provide abundant food sources and nutrients for giant pandas, making it easier to attract them and resulting in a high habitat index for giant pandas. There is a significant negative correlation between the habitat index of giant pandas and NPP, which may be due to the obvious stratification of plant communities in the vertical direction of giant panda habitat. There are few tree species and low canopy closure in the top layer, which is conducive to the growth and development of Fargesia qinlingensis as the shrub layer. As the dominant species in the shrub layer, Fargesia qinlingensis has the biological characteristics of rapid growth and developed roots, which will inhibit the growth and development of species in the vegetation layer [44]. Therefore, plant richness may not be high in dense bamboo forest areas, affecting the NPP service value level. According to the distribution of NPP, the NPP value is low in areas with higher altitudes, but the giant panda habitat index is high. Which may be due to the influence of human interference and other factors, and giant pandas will migrate to high-altitude areas. Moreover, the habitat selected by giant pandas in the Qinling Mountains has a large slope, and the stress of large slopes and steep slopes in high mountain areas has relatively little evaporation. It is more conducive to promoting the formation of the humid microclimate environment favored by pandas [45]. Previous studies have shown that giant pandas prefer to move and forage in bamboo forests of moderate density. If the bamboo forest is too sparse, and the giant panda has to invest a large amount of energy in feeding, this is not in line with the principle of energetics. Conversely, if the bamboo forest is too dense, it becomes difficult for the giant panda to travel through it. The nutritional value of the dense bamboo forest is often poor, so the giant panda rarely goes there [46]. In addition, giant pandas have obvious seasonal vertical migration, mainly living in high-altitude areas in summer and autumn, and mainly living in low-altitude areas in winter and spring. The nutrition of bamboo, the staple food, is also one of the reasons affecting the migration of giant pandas [47]. However, the panda trace data we obtained was over some time and was not divided according to the season, so the research results have certain limitations.

4.2. Impact of Human Activities on the Potential Geographical Distribution of Giant Pandas

In recent years, with the strengthening of wildlife protection in the Qinling Mountains, human activities such as hunting, logging, and medicinal collection have decreased, providing a period of respite for wildlife [48]. However, the development of socio-economic factors and the continuous expansion of human living areas have led to new disturbances like road construction, which has had a greater impact on habitat protection and population connectivity [49]. From a historical perspective, giant pandas have inhabited warmer regions at lower altitudes but due to human interference, giant pandas have been migrating to higher altitudes to avoid human pressure [50]. In the last century, giant pandas could be found at altitudes as low as 500 m above sea level. Nowadays, they are mainly concentrated in coniferous forests at high altitudes away from human interference [51]. It is evident that forest logging and hunting by humans have significantly impact the survival of giant pandas. This study reveals that above an altitude of 1500 m in the Qinling Mountains, there is a rapid increase in the probability of giant pandas’ presence. This may be attributed to agricultural planting activities being restricted below an altitude of 1400 m due to climate conditions. Furthermore, the prohibition of logging, gathering, and hunting within nature reserves limit human activities above an altitude of 1400 m. The population density of giant pandas is much higher compared to surrounding areas [52]. Other studies also indicate that giant pandas have high selectivity towards altitude [53], but there are variations in their preferred altitude range across different regions. Giant pandas are hydrophilic animals, and the appropriate altitude range not only avoids human interference, but also provides an environment suitable for their main food source, bamboo, to grow, ensuring sufficient resources for them. In addition, this study found that the impact of settlements and roads on the potential geographical distribution of giant pandas cannot be ignored. The closer to settlements and roads, the stronger the interference they are subjected to, resulting in a lower probability of giant pandas’ appearance. The model results show that the probability of giant panda presence increases rapidly beyond 2.5 km from settlements and 1.2 km from roads, indicating that human activities have an undeniable impact on the potential geographical distribution of giant pandas.

4.3. Response of Giant Panda Habitat to Climate Change

Based on the contribution rate, replacement important value and Jackknife test results obtained from the simulation of MaxEnt model, the environmental variables Bio10, Bio15, Bio2, and altitude are the leading factors affecting the potential geographical distribution of wild giant pandas in the Qinling Mountains. This also confirms the significant synergistic relationship between the habitat index of giant pandas and hydrological regulation, which is the most important factor restricting the distribution pattern of giant pandas, precipitation, temperature, and altitude. This finding is also similar to previous research [54], which emphasizes the importance of precipitation and temperature factors affecting the distribution of giant pandas, and confirms the important impact of climate factors on the distribution of giant pandas in the Qinling Mountains.
This study found that the continuous climate change will result in continuous shrinkage of the existing giant panda habitat, with the distribution center shifting eastward and then northwest. The hypothesis that climate warming will lead to habitat degradation at small scales was tested. It is speculated that with global warming, the suitable habitat for giant pandas will gradually shift northward [55]. Although China has implemented the Natural Forest Protection Plan (NFCP) and the GPNPs plan to help restore degraded forests within the panda’s range, habitat loss and fragmentation will still pose significant threats to their survival in the future. Studies have found that climate change will exacerbate both loss and fragmentation of giant panda habitat [56,57]. Fan et al. suggest that climate change could potentially decrease suitable habitat areas for giant pandas in the Qinling Mountains by up to 62%, while also raising the minimum altitude required for giant panda habitation by 500 m [58]. Wang et al. estimated that giant pandas in the Qinling Mountains will lose 49–85% of their habitat in different climate change scenarios [59]. However, our study suggests that climate change could lead to an even more severe reduction in panda habitat area within the Qinling Mountains—up to 99%. When predicting future scenarios, we only consider changes in climate factors, without altering human activity factors. In the scenario of SSP585, the total suitable area of giant pandas in the Qinling Mountains would only be 88.45 km2 at the end of this century. Qing et al. used actual survey data of giant panda bodies, feces, and foraging traces to calculate a minimum habitat area of 114.7 km2 is necessary to sustain the wild population survival of giant pandas within the Qinling Mountains region [60]. Therefore, protecting giant panda habitats should not only consider the impacts of climate change on suitable areas but also address the threat posed by human activities. Measures such as the construction of Qinling National Park, the ECRs, and the delineation of priority zones for biodiversity will be increased to resist the risks of climate change and human stress.

4.4. Conservation Status of Giant Panda Habitat in the Qinling Mountains

Reserve management is an important component of biodiversity conservation. Model simulation results show that the existing Qinling Giant Panda Reserve only covers 46.80% of the total suitable habitats, leaving more than half of these areas inadequately protected, with four highly suitable regions lacking any form of protection. In recent years, the Chinese government has put forward a series of policies including the Natural Forest Protection Program (NFPP), the Sloping Farmland Conversion Program (SLCP), and the Integrated Conservation and Development Program (ICDP), which prohibit the felling of natural forests in protected areas and provide alternative livelihoods for residents [61]. The implementation of China’s National Conservation Project for the Giant Panda and its Habitat (NCPGPH) has increased the habitat of giant pandas by 105.4% from 1990 to 2010 [62]. The establishment of the Giant Panda National Park has connected the local population ecological corridor of giant pandas [8]. The road in the Qinling Mountains is built through long tunnels to avoid habitat fragmentation and destruction, and to help pandas and wild animals communicate through corridors [63]. According to the results of correlation analysis, there is a significant positive correlation between the suitable habitat of giant pandas and hydrological regulation services, and a significant negative correlation with NPP, which verifies the hypothesis that the relationship between the suitable habitat index of giant pandas and its ecosystem services is not uniform was verified. The overall ecosystem services are positively correlated with the suitable habitat index for giant pandas, indicating that ecosystem services could be included in the protection of giant pandas while meeting the goal of protecting their habitat. In the future, through rational planning of protected areas, safe and smooth corridors can be provided for the migration of wild giant panda populations and habitat connectivity can be improved. To provide basis and reference for the planning and development of ecosystem service protection and giant panda habitat protection in the Qinling area.

5. Conclusions

In summary, we studied the habitat status of giant pandas in the Qinling Mountain system, combined ecosystem services with suitable habitats for giant pandas, and explored the relationship between ecosystem services and living conditions of giant pandas. The results show that there is a significant positive correlation between the suitable habitat index and hydrological regulation services and a significant negative correlation with NPP. In the future climate scenario, the distribution of giant panda’s potential habitat will change significantly, and the risk of habitat loss caused by the uncertainty of climate change will increase. Giant pandas belong to a small population with weak migration ability and poor tolerance to environmental changes. Climate change will affect the distribution of bamboo, the staple food of giant pandas, and thus affect the change of the whole habitat. Therefore, we propose to increase natural protected areas and improve habitat connectivity to address the impacts of climate change and human disturbance on giant panda habitat.

Author Contributions

Conceptualization, Q.M. and H.Z.; methodology, H.Z. and Q.M.; investigation, Q.M.; resources, Q.M. and K.L.; data curation, J.L. and Y.G.; writing—original draft preparation, H.Z. and Q.M.; writing—review and editing, J.L. and Y.G.; visualization, H.Z.; supervision, Q.M.; funding acquisition, Q.M. All authors have read and agreed to the published version of the manuscript.

Funding

This research was funded by Xi’an Social Science Planning Fund Project (Program No. 24QL36), the Xi’an International Studies University Graduate Research Fund Project (Program No. 2024SS048), and the Natural Science Basic Research Program of Shaanxi (Program No. 2021JQ-769).

Institutional Review Board Statement

Not applicable.

Data Availability Statement

The original contributions presented in the study are included in the article, further inquiries can be directed to the corresponding author.

Conflicts of Interest

The authors declare no conflicts of interest.

References

  1. Butchart, S.H.M.; Walpole, M.; Collen, B.; Van Strien, A.; Scharlemann, J.P.W.; Almond, R.E.A.; Baillie, J.E.M.; Bomhard, B.; Brown, C.; Bruno, J.; et al. Global Biodiversity: Indicators of Recent Declines. Science 2010, 328, 1164–1168. [Google Scholar] [CrossRef] [PubMed]
  2. Urban, M.C. Accelerating Extinction Risk from Climate Change. Science 2015, 348, 571–573. [Google Scholar] [CrossRef] [PubMed]
  3. Pauli, H.; Gottfried, M.; Reiter, K.; Klettner, C.; Grabherr, G. Signals of Range Expansions and Contractions of Vascular Plants in the High Alps: Observations (1994–2004) at the GLORIA * Master Site Schrankogel, Tyrol, Austria. Glob. Chang. Biol. 2007, 13, 147–156. [Google Scholar] [CrossRef]
  4. Bellard, C.; Bertelsmeier, C.; Leadley, P.; Thuiller, W.; Courchamp, F. Impacts of Climate Change on the Future of Biodiversity. Ecol. Lett. 2012, 15, 365–377. [Google Scholar] [CrossRef] [PubMed]
  5. Wei, W.; Swaisgood, R.R.; Pilfold, N.W.; Owen, M.A.; Dai, Q.; Wei, F.W.; Han, H.; Yang, Z.; Yang, X.Y.; Gu, X.D.; et al. Assessing the Effectiveness of China’s Panda Protection System. Curr. Biol. 2020, 30, 1280–1286.e2. [Google Scholar] [CrossRef] [PubMed]
  6. Wei, F.W.; Swaisgood, R.; Hu, Y.B.; Nie, Y.; Yan, L.; Zhang, Z.J.; Qi, D.W.; Zhu, L.F. Progress in the Ecology and Conservation of Giant Pandas. Conserv. Biol. 2015, 29, 1497–1507. [Google Scholar] [CrossRef] [PubMed]
  7. Gao, J.X. Exploring the Delineation and Supervision of Ecological Protection Redlines in China. Biodivers. Sci. 2015, 23, 705–707. [Google Scholar] [CrossRef]
  8. Huang, Q.Y.; Fei, Y.X.; Yang, H.B.; Gu, X.D.; Songer, M. Giant Panda National Park, a Step towards Streamlining Protected Areas and Cohesive Conservation Management in China. Glob. Ecol. Conserv. 2020, 22, e00947. [Google Scholar] [CrossRef]
  9. Laforest-Lapointe, I.; Paquette, A.; Messier, C.; Kembel, S.W. Leaf Bacterial Diversity Mediates Plant Diversity and Ecosystem Function Relationships. Nature 2017, 546, 145–147. [Google Scholar] [CrossRef]
  10. Qin, A.L.; Liu, B.; Guo, Q.S.; Bussmann, R.W.; Ma, F.Q.; Jian, Z.J.; Xu, G.X.; Pei, S.X. Maxent Modeling for Predicting Impacts of Climate Change on the Potential Distribution of Thuja Sutchuenensis Franch., an Extremely Endangered Conifer from Southwestern China. Glob. Ecol. Conserv. 2017, 10, 139–146. [Google Scholar] [CrossRef]
  11. Chan, K.M.A.; Hoshizaki, L.; Klinkenberg, B. Ecosystem Services in Conservation Planning: Targeted Benefits vs. Co-Benefits or Costs? PLoS ONE 2011, 6, e24378. [Google Scholar] [CrossRef] [PubMed]
  12. Balvanera, P.; Daily, G.C.; Ehrlich, P.R.; Ricketts, T.H.; Bailey, S.-A.; Kark, S.; Kremen, C.; Pereira, H. Conserving Biodiversity and Ecosystem Services. Science 2001, 291, 2047. [Google Scholar] [CrossRef] [PubMed]
  13. Haddad, N.M.; Brudvig, L.A.; Clobert, J.; Davies, K.F.; Gonzalez, A.; Holt, R.D.; Lovejoy, T.E.; Sexton, J.O.; Austin, M.P.; Collins, C.D.; et al. Habitat Fragmentation and Its Lasting Impact on Earth’s Ecosystems. Sci. Adv. 2015, 1, e1500052. [Google Scholar] [CrossRef] [PubMed]
  14. Thomsen, M.S.; Garcia, C.; Bolam, S.G.; Parker, R.; Godbold, J.A.; Solan, M. Consequences of Biodiversity Loss Diverge from Expectation Due to Post-Extinction Compensatory Responses. Sci. Rep. 2017, 7, 43695. [Google Scholar] [CrossRef] [PubMed]
  15. Crist, E.; Mora, C.; Engelman, R. The Interaction of Human Population, Food Production, and Biodiversity Protection. Science 2017, 356, 260–264. [Google Scholar] [CrossRef] [PubMed]
  16. Shen, Y.; Yu, S.X.; Lian, J.Y.; Shen, H.; Cao, H.L.; Lu, H.P.; Ye, W.H. Tree Aboveground Carbon Storage Correlates with Environmental Gradients and Functional Diversity in a Tropical Forest. Sci. Rep. 2016, 6, 25304. [Google Scholar] [CrossRef] [PubMed]
  17. Huang, Y.Y.; Chen, Y.X.; Castro-Izaguirre, N.; Baruffol, M.; Brezzi, M.; Lang, A.; Li, Y.; Härdtle, W.; Von Oheimb, G.; Yang, X.F.; et al. Impacts of Species Richness on Productivity in a Large-Scale Subtropical Forest Experiment. Science 2018, 362, 80–83. [Google Scholar] [CrossRef] [PubMed]
  18. Hector, A.; Bagchi, R. Biodiversity and Ecosystem Multifunctionality. Nature 2007, 448, 188–190. [Google Scholar] [CrossRef] [PubMed]
  19. Wagg, C.; Bender, S.F.; Widmer, F.; Van Der Heijden, M.G.A. Soil Biodiversity and Soil Community Composition Determine Ecosystem Multifunctionality. Proc. Natl. Acad. Sci. USA 2014, 111, 5266–5270. [Google Scholar] [CrossRef]
  20. Balvanera, P.; Siddique, I.; Dee, L.; Paquette, A.; Isbell, F.; Gonzalez, A.; Byrnes, J.; O’Connor, M.I.; Hungate, B.A.; Griffin, J.N. Linking Biodiversity and Ecosystem Services: Current Uncertainties and the Necessary Next Steps. BioScience 2014, 64, 49–57. [Google Scholar] [CrossRef]
  21. Anderson, B.J.; Armsworth, P.R.; Eigenbrod, F.; Thomas, C.D.; Gillings, S.; Heinemeyer, A.; Roy, D.B.; Gaston, K.J. Spatial Covariance between Biodiversity and Other Ecosystem Service Priorities. J. Appl. Ecol. 2009, 46, 888–896. [Google Scholar] [CrossRef]
  22. Fang, Y.Q.; Zhang, X.H.; Wei, H.Y.; Wang, D.J.; Chen, R.D.; Wang, L.K.; Gu, W. Predicting the Invasive Trend of Exotic Plants in China Based on the Ensemble Model under Climate Change: A Case for Three Invasive Plants of Asteraceae. Sci. Total Environ. 2021, 756, 143841. [Google Scholar] [CrossRef] [PubMed]
  23. Zhang, X.Q.; Li, G.Q.; Du, S. Simulating the Potential Distribution of Elaeagnus Angustifolia L. Based on Climatic Constraints in China. Ecol. Eng. 2018, 113, 27–34. [Google Scholar] [CrossRef]
  24. Anoop, N.R.; Babu, S.; Nagarajan, R.; Sen, S. Identifying Suitable Reintroduction Sites for the White-Rumped Vulture (Gyps bengalensis) in India’s Western Ghats Using Niche Models and Habitat Requirements. Ecol. Eng. 2020, 158, 106034. [Google Scholar] [CrossRef]
  25. Songer, M.; Delion, M.; Biggs, A.; Huang, Q. Modeling Impacts of Climate Change on Giant Panda Habitat. Int. J. Ecol. 2012, 2012, 108752. [Google Scholar] [CrossRef]
  26. Qi, Z.X.; Xu, W.H.; Xiong, X.Y.; Ouyang, Z.Y.; Zheng, H.; Gan, D.X. Assessment of potential habitat for Ursus thibetanus in the Qinling Mountains. Biodivers. Sci. 2011, 19, 343–352. [Google Scholar] [CrossRef]
  27. Xu, W.; Luo, C. Application of MaxEnt Model in Rhinopithecus Roxllanae Habitat Assessment in Qingling Mountains. For. Eng. 2010, 26, 23–26. [Google Scholar]
  28. Olson, D.M.; Dinerstein, E. The Global 200: A Representation Approach to Conserving the Earth’s Most Biologically Valuable Ecoregions. Conserv. Biol. 1998, 12, 502–515. [Google Scholar] [CrossRef]
  29. Hull, V.; Zhang, J.D.; Zhou, S.Q.; Huang, J.Y.; Li, R.; Liu, D.; Xu, W.H.; Huang, Y.; Ouyang, Z.Y.; Zhang, H.M.; et al. Space Use by Endangered Giant Pandas. J. Mammal. 2015, 96, 230–236. [Google Scholar] [CrossRef]
  30. Zhao, C.; Yue, B.S.; Ran, J.H.; Moermond, T.; Hou, N.; Yang, X.Y.; Gu, X.D. Relationship between Human Disturbance and Endangered Giant Panda Ailuropoda Melanoleuca Habitat Use in the Daxiangling Mountains. Oryx 2017, 51, 146–152. [Google Scholar] [CrossRef]
  31. Tang, J.; Swaisgood, R.R.; Owen, M.A.; Zhao, X.Z.; Wei, W.; Pilfold, N.W.; Wei, F.W.; Yang, X.Y.; Gu, X.D.; Yang, Z.S.; et al. Climate Change and Landscape-Use Patterns Influence Recent Past Distribution of Giant Pandas. Proc. R. Soc. B Biol. Sci. 2020, 287, 20200358. [Google Scholar] [CrossRef]
  32. Sun, X.; Long, Z.X.; Jia, J.B. A Multi-Scale Maxent Approach to Model Habitat Suitability for the Giant Pandas in the Qionglai Mountain, China. Glob. Ecol. Conserv. 2021, 30, e01766. [Google Scholar] [CrossRef]
  33. Phillips, S.J.; Anderson, R.P.; Schapire, R.E. Maximum Entropy Modeling of Species Geographic Distributions. Ecol. Model. 2006, 190, 231–259. [Google Scholar] [CrossRef]
  34. Qi, D.W.; Hu, Y.B.; Gu, X.D.; Li, M.; Wei, F.W. Ecological Niche Modeling of the Sympatric Giant and Red Pandas on a Mountain-Range Scale. Biodivers. Conserv. 2009, 18, 2127–2141. [Google Scholar] [CrossRef]
  35. Swets, J.A. Measuring the Accuracy of Diagnostic Systems. Science 1988, 240, 1285–1293. [Google Scholar] [CrossRef] [PubMed]
  36. Liu, C.R.; White, M.; Newell, G. Selecting Thresholds for the Prediction of Species Occurrence with Presence-only Data. J. Biogeogr. 2013, 40, 778–789. [Google Scholar] [CrossRef]
  37. Wu, D.; Cao, W.; Huang, L.; Huhe, T.L. Assessing Ecological Effects of Natural Forest Protection Project. J. Changjiang River Sci. Res. Inst. 2023, 40, 73–80. [Google Scholar] [CrossRef]
  38. Xiao, Q.; Hu, D.; Xiao, Y. Assessing Changes in Soil Conservation Ecosystem Services and Causal Factors in the Three Gorges Reservoir Region of China. J. Clean. Prod. 2017, 163, S172–S180. [Google Scholar] [CrossRef]
  39. Ouyang, Z.Y.; Zheng, H.; Xiao, Y.; Polasky, S.; Liu, J.G.; Xu, W.H.; Wang, Q.; Zhang, L.; Xiao, Y.; Rao, E.; et al. Improvements in Ecosystem Services from Investments in Natural Capital. Science 2016, 352, 1455–1459. [Google Scholar] [CrossRef] [PubMed]
  40. Zhu, W.Q.; Pan, Y.Z.; Zhang, J.S. Estimation of net primary productivity of Chinese terrestrial vegetation based on remote sensing. J. Plant Ecol. 2007, 31, 413–424. [Google Scholar] [CrossRef]
  41. Xie, T.; Wang, M.; Su, C.; Chen, W.P. Evaluation of the Natural Attenuation Capacity of Urban Residential Soils with Ecosystem-Service Performance Index (EPX) and Entropy-Weight Methods. Environ. Pollut. 2018, 238, 222–229. [Google Scholar] [CrossRef]
  42. Jopke, C.; Kreyling, J.; Maes, J.; Koellner, T. Interactions among Ecosystem Services across Europe: Bagplots and Cumulative Correlation Coefficients Reveal Synergies, Trade-Offs, and Regional Patterns. Ecol. Indic. 2015, 49, 46–52. [Google Scholar] [CrossRef]
  43. Zhang, Z.J.; Wei, F.W.; Li, M.; Zhang, B.W.; Liu, X.H.; Hu, J.C. Microhabitat Separation during Winter among Sympatric Giant Pandas, Red Pandas, and Tufted Deer: The Effects of Diet, Body Size, and Energy Metabolism. Can. J. Zool. 2004, 82, 1451–1458. [Google Scholar] [CrossRef]
  44. Du, Y.L.; Zhang, Y.; Dong, G.H.; Lou, X.D.; Kang, B. Diversity of Fargesia qinlingensis Community in QinLing Mountains. J. Northwest A F Univ. 2013, 41, 59–66. [Google Scholar] [CrossRef]
  45. Zhang, Z.J.; Hu, J.C. A Study on the Giant Panda’s Habitat Selection. J. Sichuan Teach. Coll. Sci. 2000, 21, 18–21. [Google Scholar] [CrossRef]
  46. Wei, F.W.; Zhou, A.; Hu, J.C.; Wang, W.; Yang, G. Habitat Selection by Giant Pandas in Mabian Dafenging Reserve. Acta Theriol. Sin. 1996, 16, 241–245. [Google Scholar] [CrossRef]
  47. Zhou, S.Q.; Zhang, H.M.; Li, D.S. Conservation and Management Strategies of Habitats Based on the Foraging Behavior of Giant Pandas. Sichuan J. Zool. 2010, 29, 340–345. [Google Scholar]
  48. Viña, A.; McConnell, W.J.; Yang, H.B.; Xu, Z.C.; Liu, J.G. Effects of Conservation Policy on China’s Forest Recovery. Sci. Adv. 2016, 2, e1500965. [Google Scholar] [CrossRef]
  49. Zhang, J.D.; Hull, V.; Ouyang, Z.Y.; Li, R.; Connor, T.; Yang, H.B.; Zhang, Z.J.; Silet, B.; Zhang, H.B.; Liu, J.G. Divergent Responses of Sympatric Species to Livestock Encroachment at Fine Spatiotemporal Scales. Biol. Conserv. 2017, 209, 119–129. [Google Scholar] [CrossRef]
  50. Loucks, C.J.; Lü, Z.; Dinerstein, E.; Wang, H.; Olson, D.M.; Zhu, C.Q.; Wang, D.J. Giant Pandas in a Changing Landscape. Science 2001, 294, 1465. [Google Scholar] [CrossRef]
  51. Qi, D.W.; Zhang, S.N.; Zhang, Z.J.; Hu, Y.B.; Yang, X.Y.; Wang, H.J.; Wei, F.W. Different Habitat Preferences of Male and Female Giant Pandas. J. Zool. 2011, 285, 205–214. [Google Scholar] [CrossRef]
  52. Sun, C.Q.; Zhang, Z.L.; Jin, X.L. QinLing mountains giant panda sub-population quantity and distribution. J. Shaanxi Norm. Univ. Sci. Ed. 2006, 34, 163–167. [Google Scholar]
  53. Huang, L.; Xing, X.C.; Li, W.W.; Zhou, Y.; Zhang, Y.Q.; Xue, C.; Ren, Y.; Kang, J.Q. Altitude Difference Might Contribute to the Genetic Divergence of Giant Panda’ Staple Food Bamboo (Fargesia spathacea Complex) Based on 14 SSR Markers. J. Syst. Evol. 2021, 59, 1051–1064. [Google Scholar] [CrossRef]
  54. Li, X.; Mao, F.J.; Du, H.Q.; Zhou, G.H.; Xing, L.; Liu, T.Y.; Han, N.; Liu, Y.L.; Zhu, D.E.; Zheng, J.L.; et al. Spatiotemporal Evolution and Impacts of Climate Change on Bamboo Distribution in China. J. Environ. Manag. 2019, 248, 109265. [Google Scholar] [CrossRef] [PubMed]
  55. Jian, J.; Jiang, H.; Jiang, Z.S.; Zhou, G.M.; Yu, S.Q.; Peng, S.L.; Liu, S.R.; Liu, S.Y.; Wang, J.X. Predicting Giant Panda Habitat with Climate Data and Calculated Habitat Suitability Index (HSI) Map: Predicting Giant Panda Habitat. Meteorol. Appl. 2014, 21, 210–217. [Google Scholar] [CrossRef]
  56. Xu, W.H.; Ouyang, Z.Y.; Viña, A.; Zheng, H.; Liu, J.G.; Xiao, Y. Designing a Conservation Plan for Protecting the Habitat for Giant Pandas in the Qionglai Mountain Range, China. Divers. Distrib. 2006, 12, 610–619. [Google Scholar] [CrossRef]
  57. Shen, G.Z.; Feng, C.Y.; Xie, Z.Q.; Ouyang, Z.Y.; Li, J.Q.; Pascal, M. Proposed Conservation Landscape for Giant Pandas in the Minshan Mountains, China. Conserv. Biol. 2008, 22, 1144–1153. [Google Scholar] [CrossRef] [PubMed]
  58. Fan, J.T.; Li, J.S.; Xia, R.; Hu, L.L.; Wu, X.P.; Li, G. Assessing the Impact of Climate Change on the Habitat Distribution of the Giant Panda in the Qinling Mountains of China. Ecol. Model. 2014, 274, 12–20. [Google Scholar] [CrossRef]
  59. Wang, F.; Zhao, Q.; McShea, W.J.; Songer, M.; Huang, Q.Y.; Zhang, X.F.; Zhou, L.G. Incorporating Biotic Interactions Reveals Potential Climate Tolerance of Giant Pandas. Conserv. Lett. 2018, 11, e12592. [Google Scholar] [CrossRef]
  60. Qing, J.; Yang, Z.S.; He, K.; Zhang, Z.J.; Gu, X.D.; Yang, X.Y.; Zhang, W.; Yang, B.; Qi, D.W.; Dai, Q. The Minimum Area Requirements (MAR) for Giant Panda: An Empirical Study. Sci. Rep. 2016, 6, 37715. [Google Scholar] [CrossRef]
  61. Yin, R.S. An Integrated Assessment of China’s Ecological Restoration Programs; Springer: Dordrecht, The Netherlands, 2009; pp. 21–38. [Google Scholar]
  62. Xu, W.; Viña, A.; Kong, L.Q.; Pimm, S.L.; Zhang, J.J.; Yang, W.; Xiao, Y.; Zhang, L.; Chen, X.D.; Liu, J.G.; et al. Reassessing the Conservation Status of the Giant Panda Using Remote Sensing. Nat. Ecol. Evol. 2017, 1, 1635–1638. [Google Scholar] [CrossRef] [PubMed]
  63. Cai, Q.; Huang, B.H.; Li, P.; Yang, Z.; Lin, Y.C.; Zhu, Y.; Cheng, H.F.; Zhang, H.F. Wildlife Activities and Migration through Ecological Corridor along Channel of Highway No.108. Shannxi For. Sci. Technol. 2019, 47, 6–9. [Google Scholar]
Figure 1. Workflow for predicting suitable habitats for giant pandas in the Qinling Mountains.
Diversity 16 00412 g001
Figure 2. Giant panda trace point data.
Diversity 16 00412 g002
Figure 3. Habitat index and prediction of suitable habitat for giant panda.
Diversity 16 00412 g003
Figure 4. Spatial distribution pattern of ecosystem services. (a) hydrologic regulation; (b) soil conservation; (c) net primary productivity; (d) total ecosystem services.
Diversity 16 00412 g004
Figure 5. Correlation analysis of suitable habitat index of giant panda and ecosystem services. ** At the 0.01 level, the correlation was significant. * At the 0.05 level, the correlation was significant. HI: suitable habitat index of giant panda; Ewater: hydrological regulation; Esoil: soil conservation; Enpp: net primary productivity; ESsum: total ecosystem service.
Diversity 16 00412 g005
Figure 6. Potential habitat distribution of giant pandas in the Qinling Mountains under current climate conditions.
Diversity 16 00412 g006
Figure 7. Analysis of gaps in wild giant panda protection in the Qinling Mountains.
Diversity 16 00412 g007
Figure 8. Changes in potential suitable habitat areas for giant pandas in the Qinling Mountains in climate change scenarios.
Diversity 16 00412 g008
Figure 9. The change of centroid of giant pandas under climate change.
Diversity 16 00412 g009
Figure 10. Jackknife method to detect the importance of environmental variables.
Diversity 16 00412 g010
Figure 11. Response curve of giant panda suitability probability to dominant environmental variables. (a) Bio15: seasonal variation of precipitation; (b) Bio10: average temperature of the warmest quarter; (c) altitude; (d) Bio2: daily range of average temperature.
Diversity 16 00412 g011
Table 1. Sources of ecosystem service mapping data.
NameAccuracyTimeSource
National average annual rainfall erosivity90 m1980–2010National Earth System Science Data Center
Chinese soil dataset1: 1 millionSecond soil censusBig Data Center Of Sciences In Arid Regions
National DEM (SRTM)90 m2000Computer Network Information Center, Chinese Academy of Sciences
National land cover90 m2000, 2010Institute of Remote Sensing, Chinese Academy of Sciences
National vegetation coverage250 mEvery ten days in 2000 and 2010Institute of Remote Sensing and Digital Earth, Chinese Academy of Sciences
National monthly precipitation map90 mFifty years of average monthly rainfallChinese Ecosystem Research Network
Precipitation runoff relationship National Ecosystem Survey and Assessment of China (2000–2010)
Runoff producing precipitation National Ecosystem Survey and Assessment of China (2000–2010)
Efficiency coefficient of ecosystem hydrological regulation National Ecosystem Survey and Assessment of China (2000–2010)
Net primary productivity250 m2000–2010National Ecosystem Survey and Assessment of China (2000–2010)
Table 2. AUC values of Qinling giant pandas in future climate scenarios.
Climate Change ScenariosYearsAUC Value
Low force scenario SSP1262041–20600.962
2081–21000.958
Moderate to high force scenarios SSP3702041–20600.959
2081–21000.960
High force scenario SSP5852041–20600.958
2081–21000.959
Table 3. Suitable area/km2 for each level of giant pandas in different periods.
Suitable ZoneComparative IndicatorsCurrentSSP126SSP370SSP585
2041–20602081–21002041–20602081–21002041–20602081–2100
Area/km21153.75139.81289.1535.256.4945.757.52
High suitability areaChange area −1013.94−864.6−1118.5−1147.26−1108−1146.23
Proportion %3.310.40.830.10.020.130.02
Area/km21878.64759.85675.67437.1224.36318.7921.18
Medium suitability areaChange area −1118.79−1202.97−1441.52−1854.28−1559.85−1857.46
Proportion %5.382.181.931.250.070.910.06
Area/km22843.032165.281507.91913.95148.131726.7359.75
Low suitability areaChange area −677.75−1335.13−929.08−2694.9−1116.3−2783.28
Proportion %8.146.24.325.480.424.950.17
Area/km229,042.831,853.2732,445.4732,531.8934,739.2332,826.9234,829.77
Unsuitable areaChange area 2810.473402.673489.095696.433784.125786.97
Proportion %83.1791.2292.9293.1799.4994.0199.75
Area/km25875.423064.942472.722386.32178.982091.2788.45
Total suitable areaChange area −2810.48−3402.70−3489.1−5696.44−3784.15−5786.97
Proportion %16.838.787.086.830.515.990.25
Table 4. Dominant environmental variables.
Environmental VariablePercent ContributionPermutation Importance
Bio10 Mean temperature of warmest quarter (°C)46.723.1
Bio15 (precipitation seasonality)21.415.6
Bio12 (annual precipitation (mm))1734.9
Bio2 (mean diurnal range (°C))2.91.4
Distance to roads2.70.4
Bio4 (temperature seasonality (°C))2.50.8
Bio18 Precipitation of warmest quarter (mm)1.322.2
Distance to residents1.30.2
Altitude (m)1.20.6
Vegetation types1.10.1
Slope0.70.4
Aspect0.60.2
Distance to rivers0.40.2
Disclaimer/Publisher’s Note: The statements, opinions and data contained in all publications are solely those of the individual author(s) and contributor(s) and not of MDPI and/or the editor(s). MDPI and/or the editor(s) disclaim responsibility for any injury to people or property resulting from any ideas, methods, instructions or products referred to in the content.

