Application of an Improved Multipoint Optimal Minimum Entropy Deconvolution Adjusted for Gearbox Composite Fault Diagnosis

Abstract
:1. Introduction
2. Basic Theory
2.1. LMD Method
- (1)
- According to all the local extreme points of the signal x(t), calculate the average value and envelope estimate of two adjacent extreme points.
- (2)
- Connect all the points adjacent to the mean values with polylines, and then smooth the line by the sliding average method to obtain the local mean function . The envelope estimates are processed in the same way as the averages to obtain the envelope function .
- (3)
- The local mean function m11(t) is separated in the original signal x(t) to obtain and demodulated:
- (4)
- The above process is iterated to obtain an envelope estimation function . If ≠ 1, then is not a pure frequency modulated signal. The iterative process continues until = 1. The iteration steps are as follows:where:
- (5)
- Calculate the envelope signal (instantaneous amplitude function):
- (6)
- Determine the first PF component that is decomposed by the original signal:
- (7)
- A new signal u1(t) can be obtained by removing PF1(t) from the original signal. The signal is used as the original signal of the above process for iterative process until the obtained signal becomes a monotonic function:
2.2. MOMEDA Method
3. Multi—Fault Feature Recognition Method for CPF—MOMEDA under Strong Noise
- (1)
- Determine the number M of the overall test and the increased noise range A.
- (2)
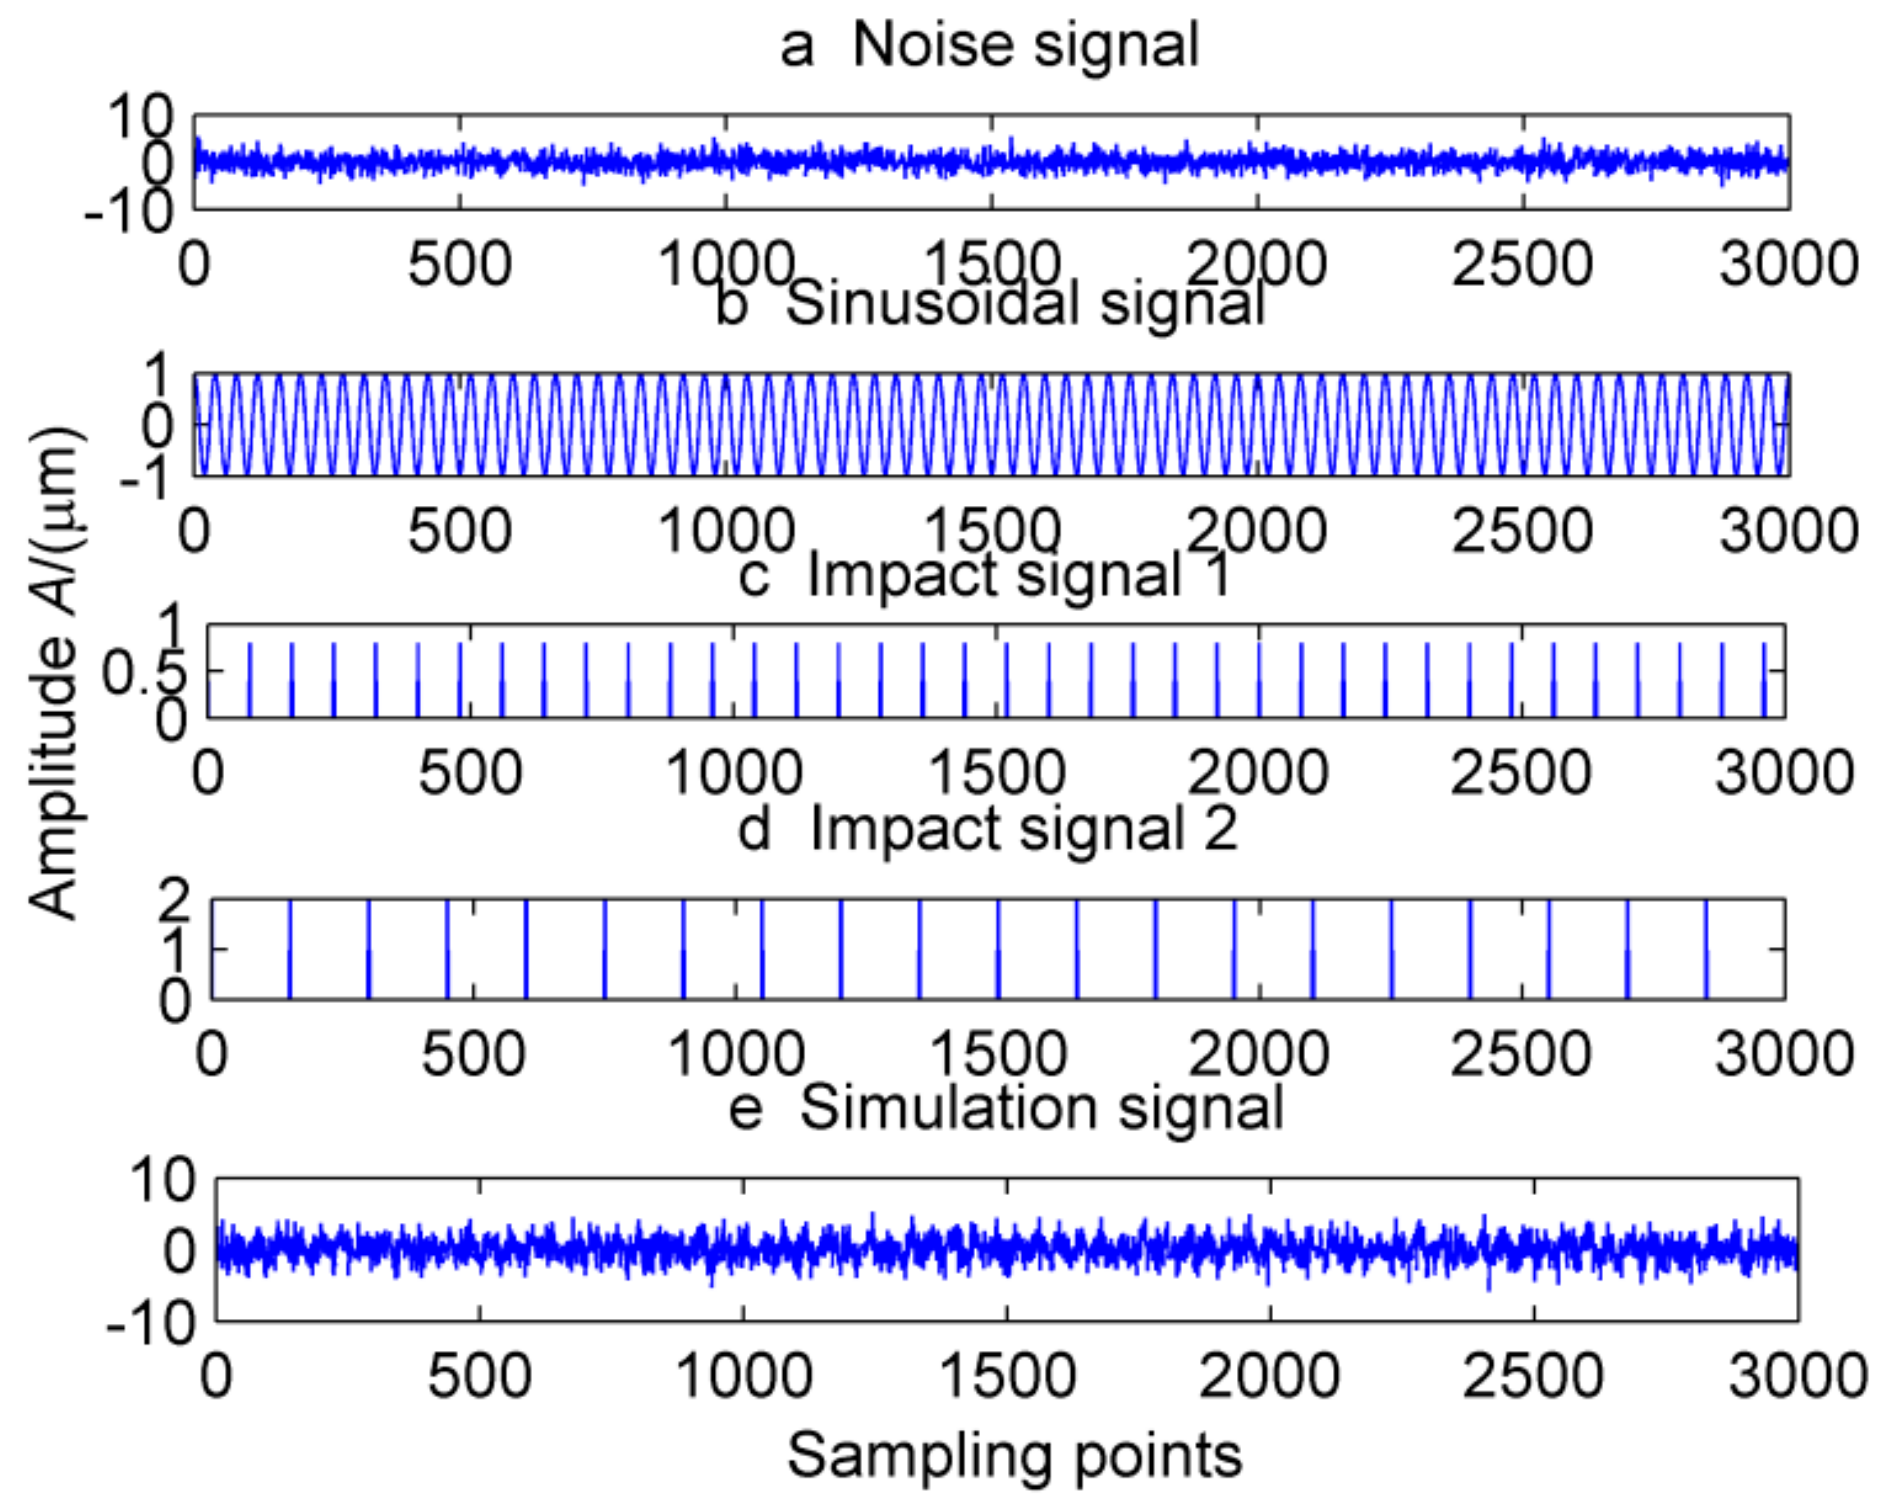
- Add white noise with amplitude A to the original signal and obtain a new signal:where represents the m-th added white noise sequence and represents the noisy signal of the m-th trial.
- (3)
- The additional noise signal is decomposed using LMD.
- (4)
- Repeat steps 2~3 m times, get M group PFS.
- (5)
- Adopt the corresponding PF collection method:where is the i-th PF of m-th trial. The result of decomposition is obtained.
- (6)
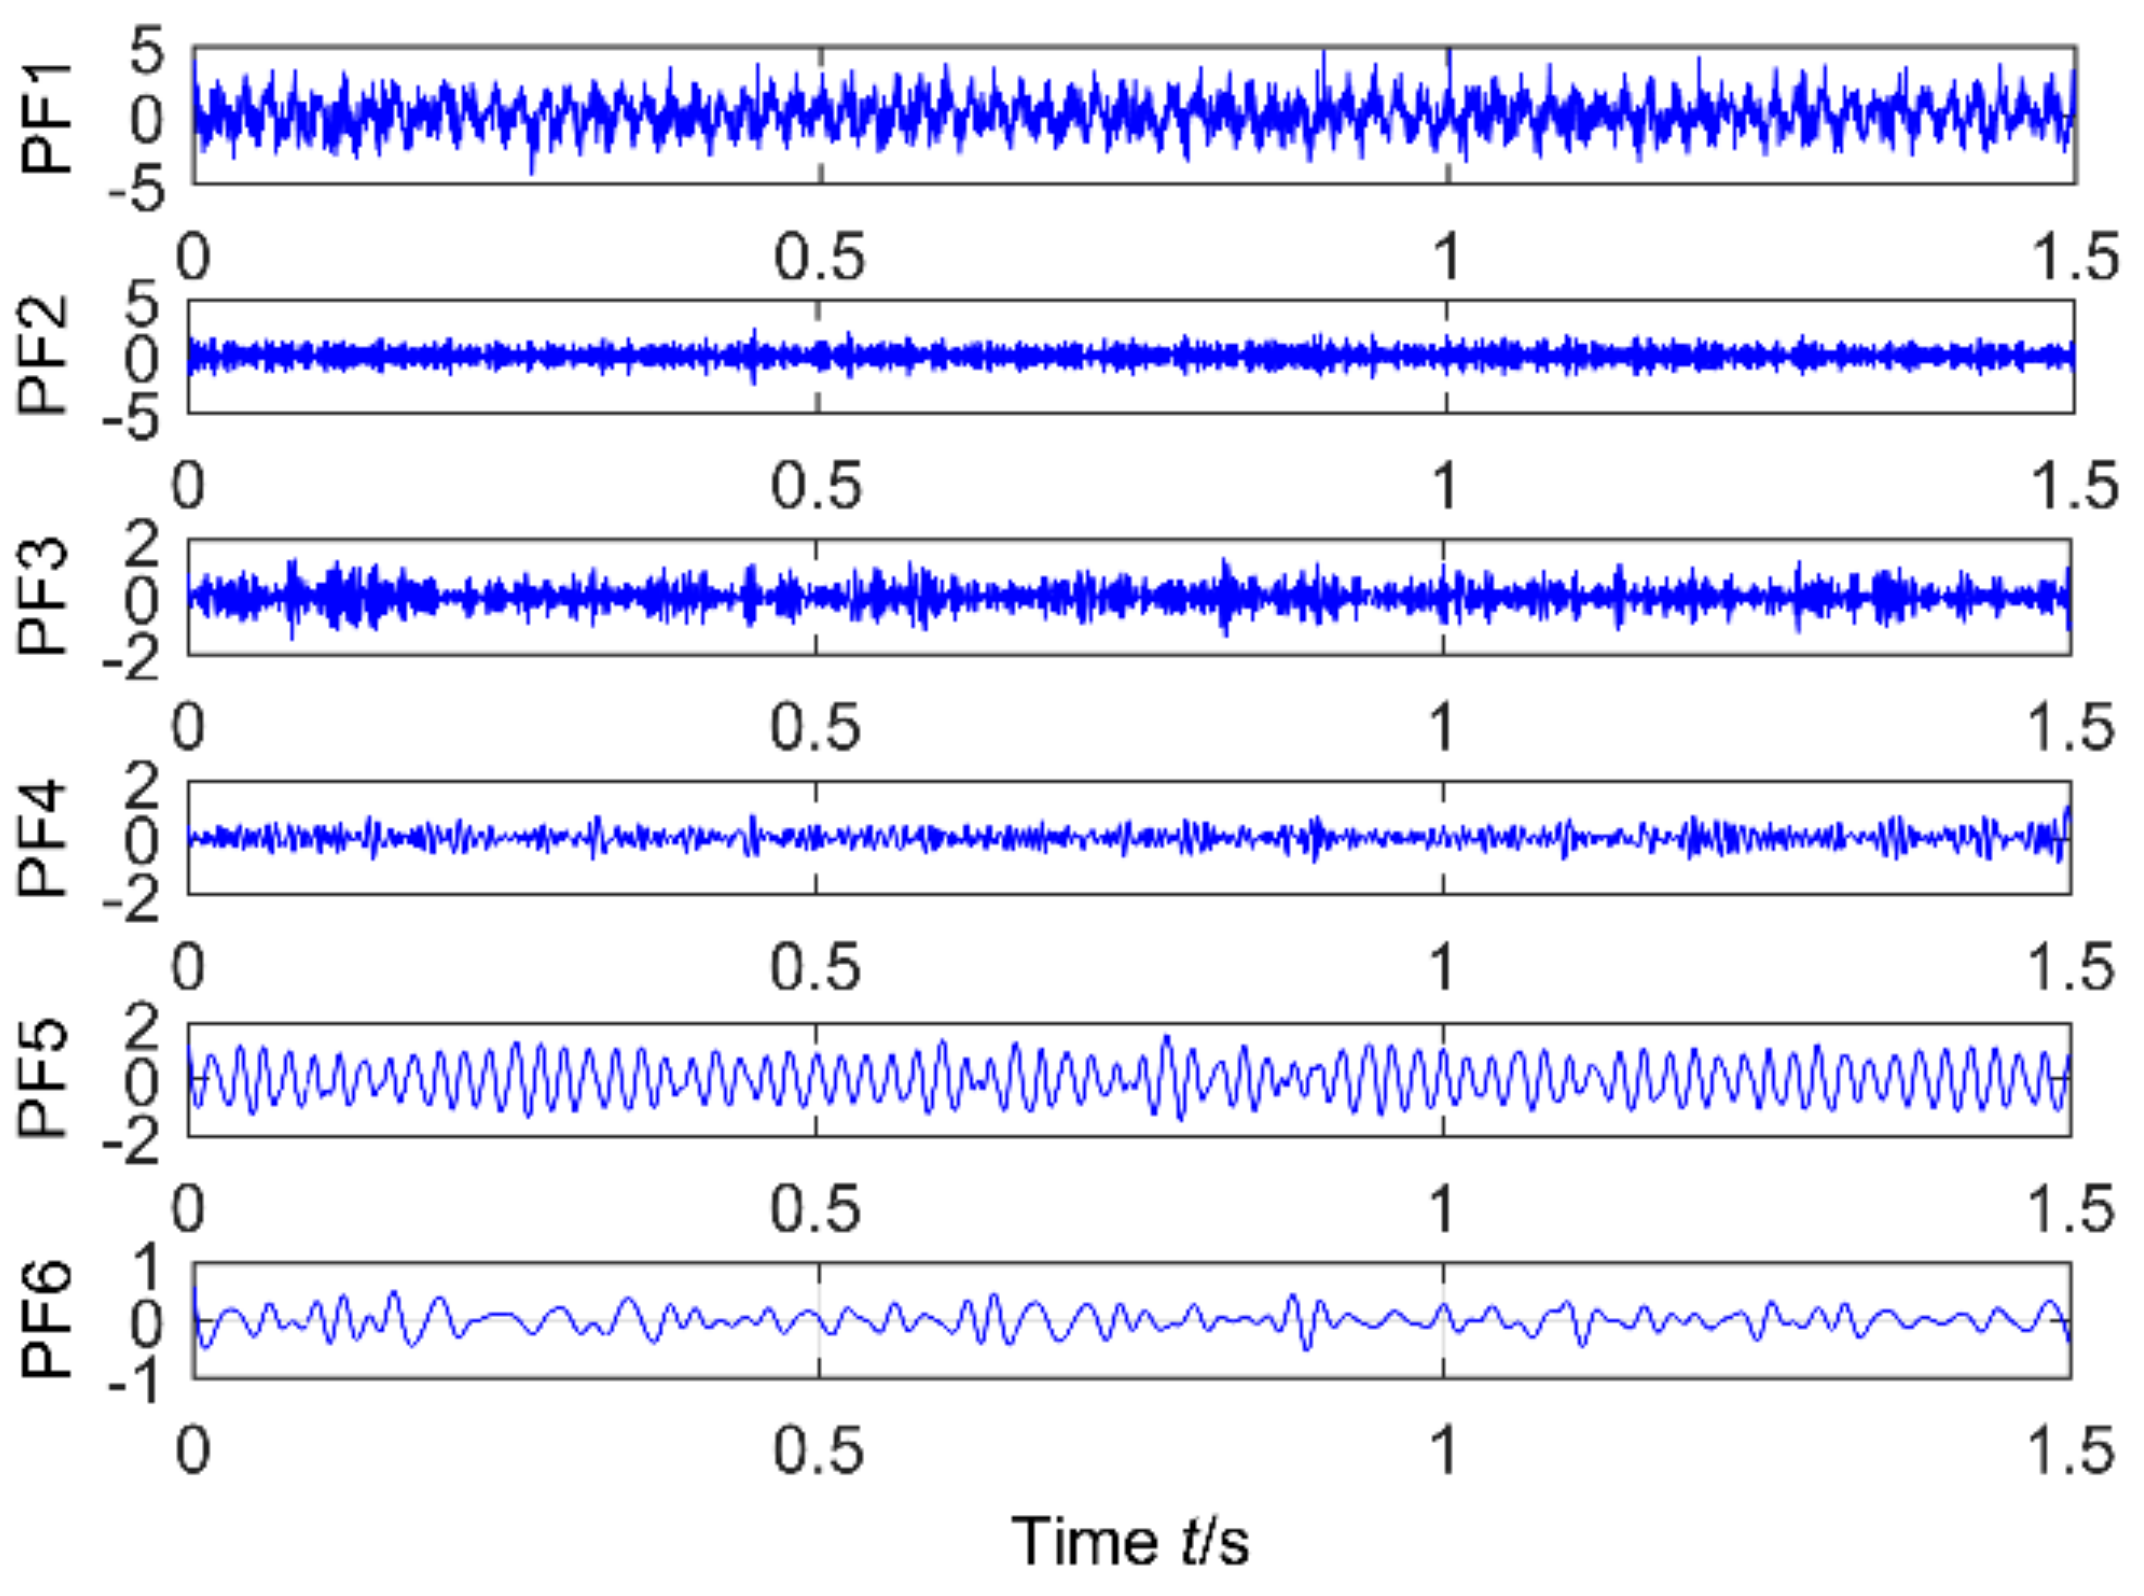
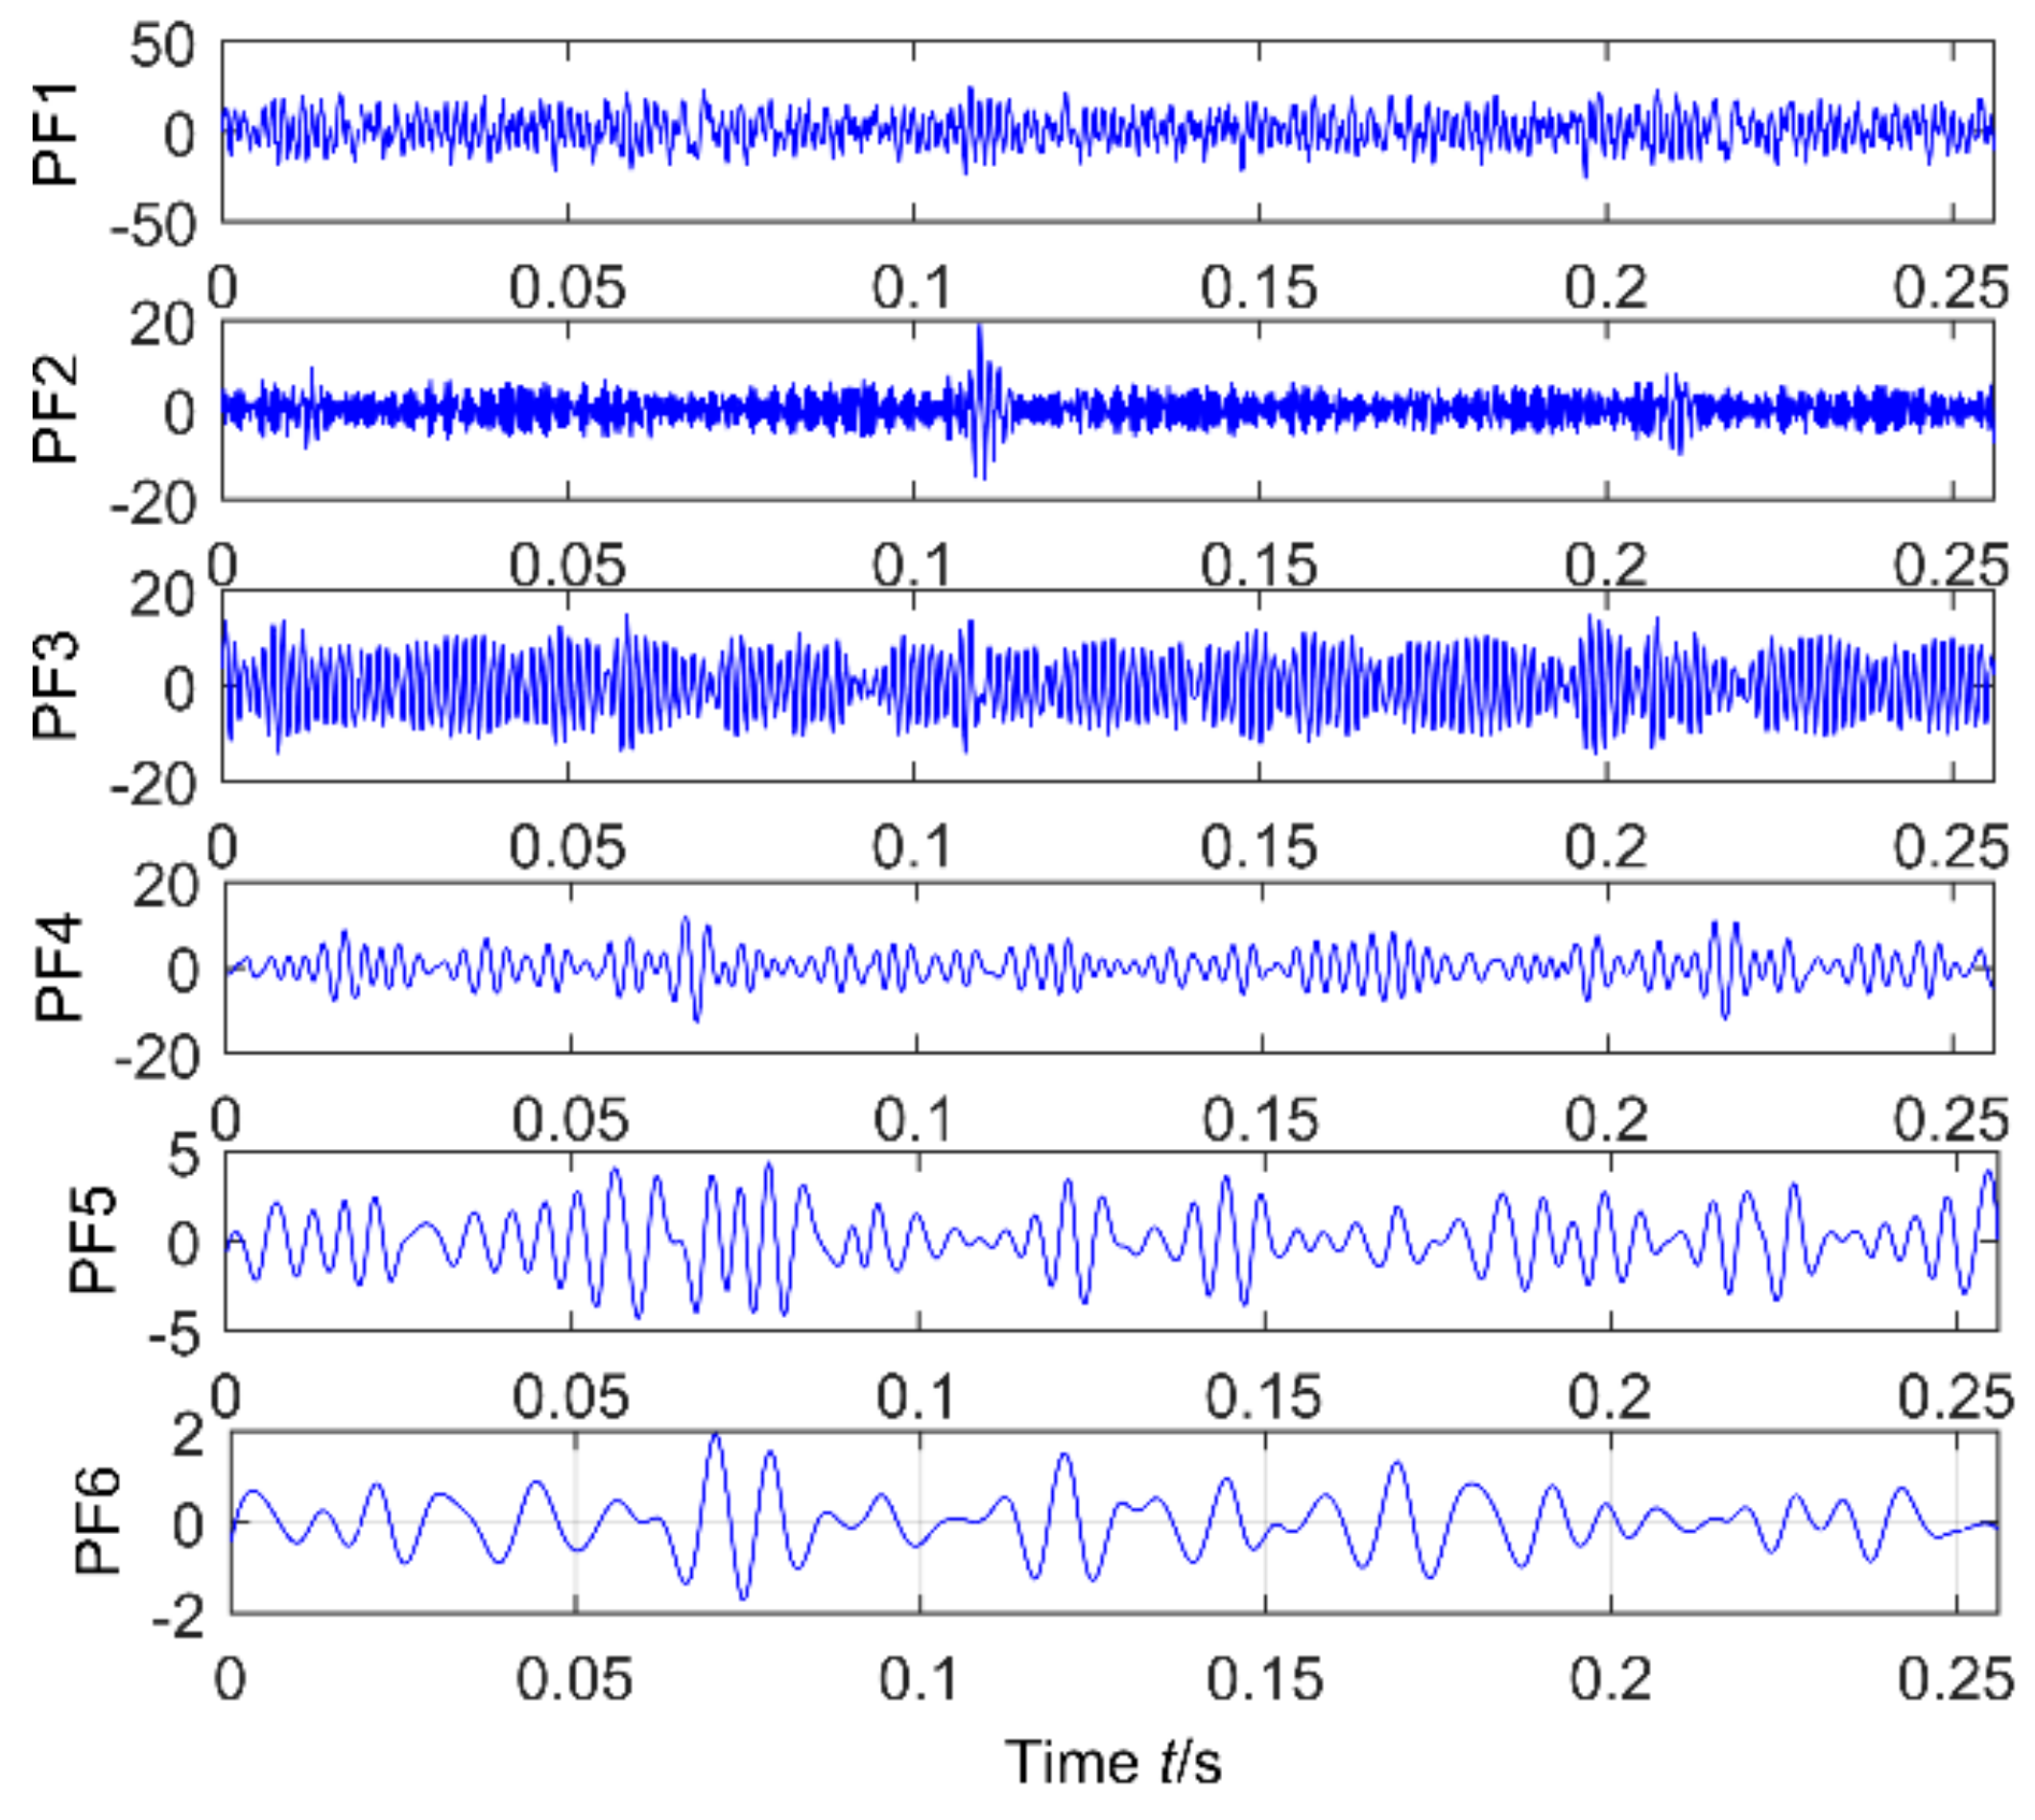
- Get the correlation of PFs with the original signal by ELMD, preserve the strong correlation of PFs, remove the false component and noise components, and improve the signal to noise ratio of the signal.
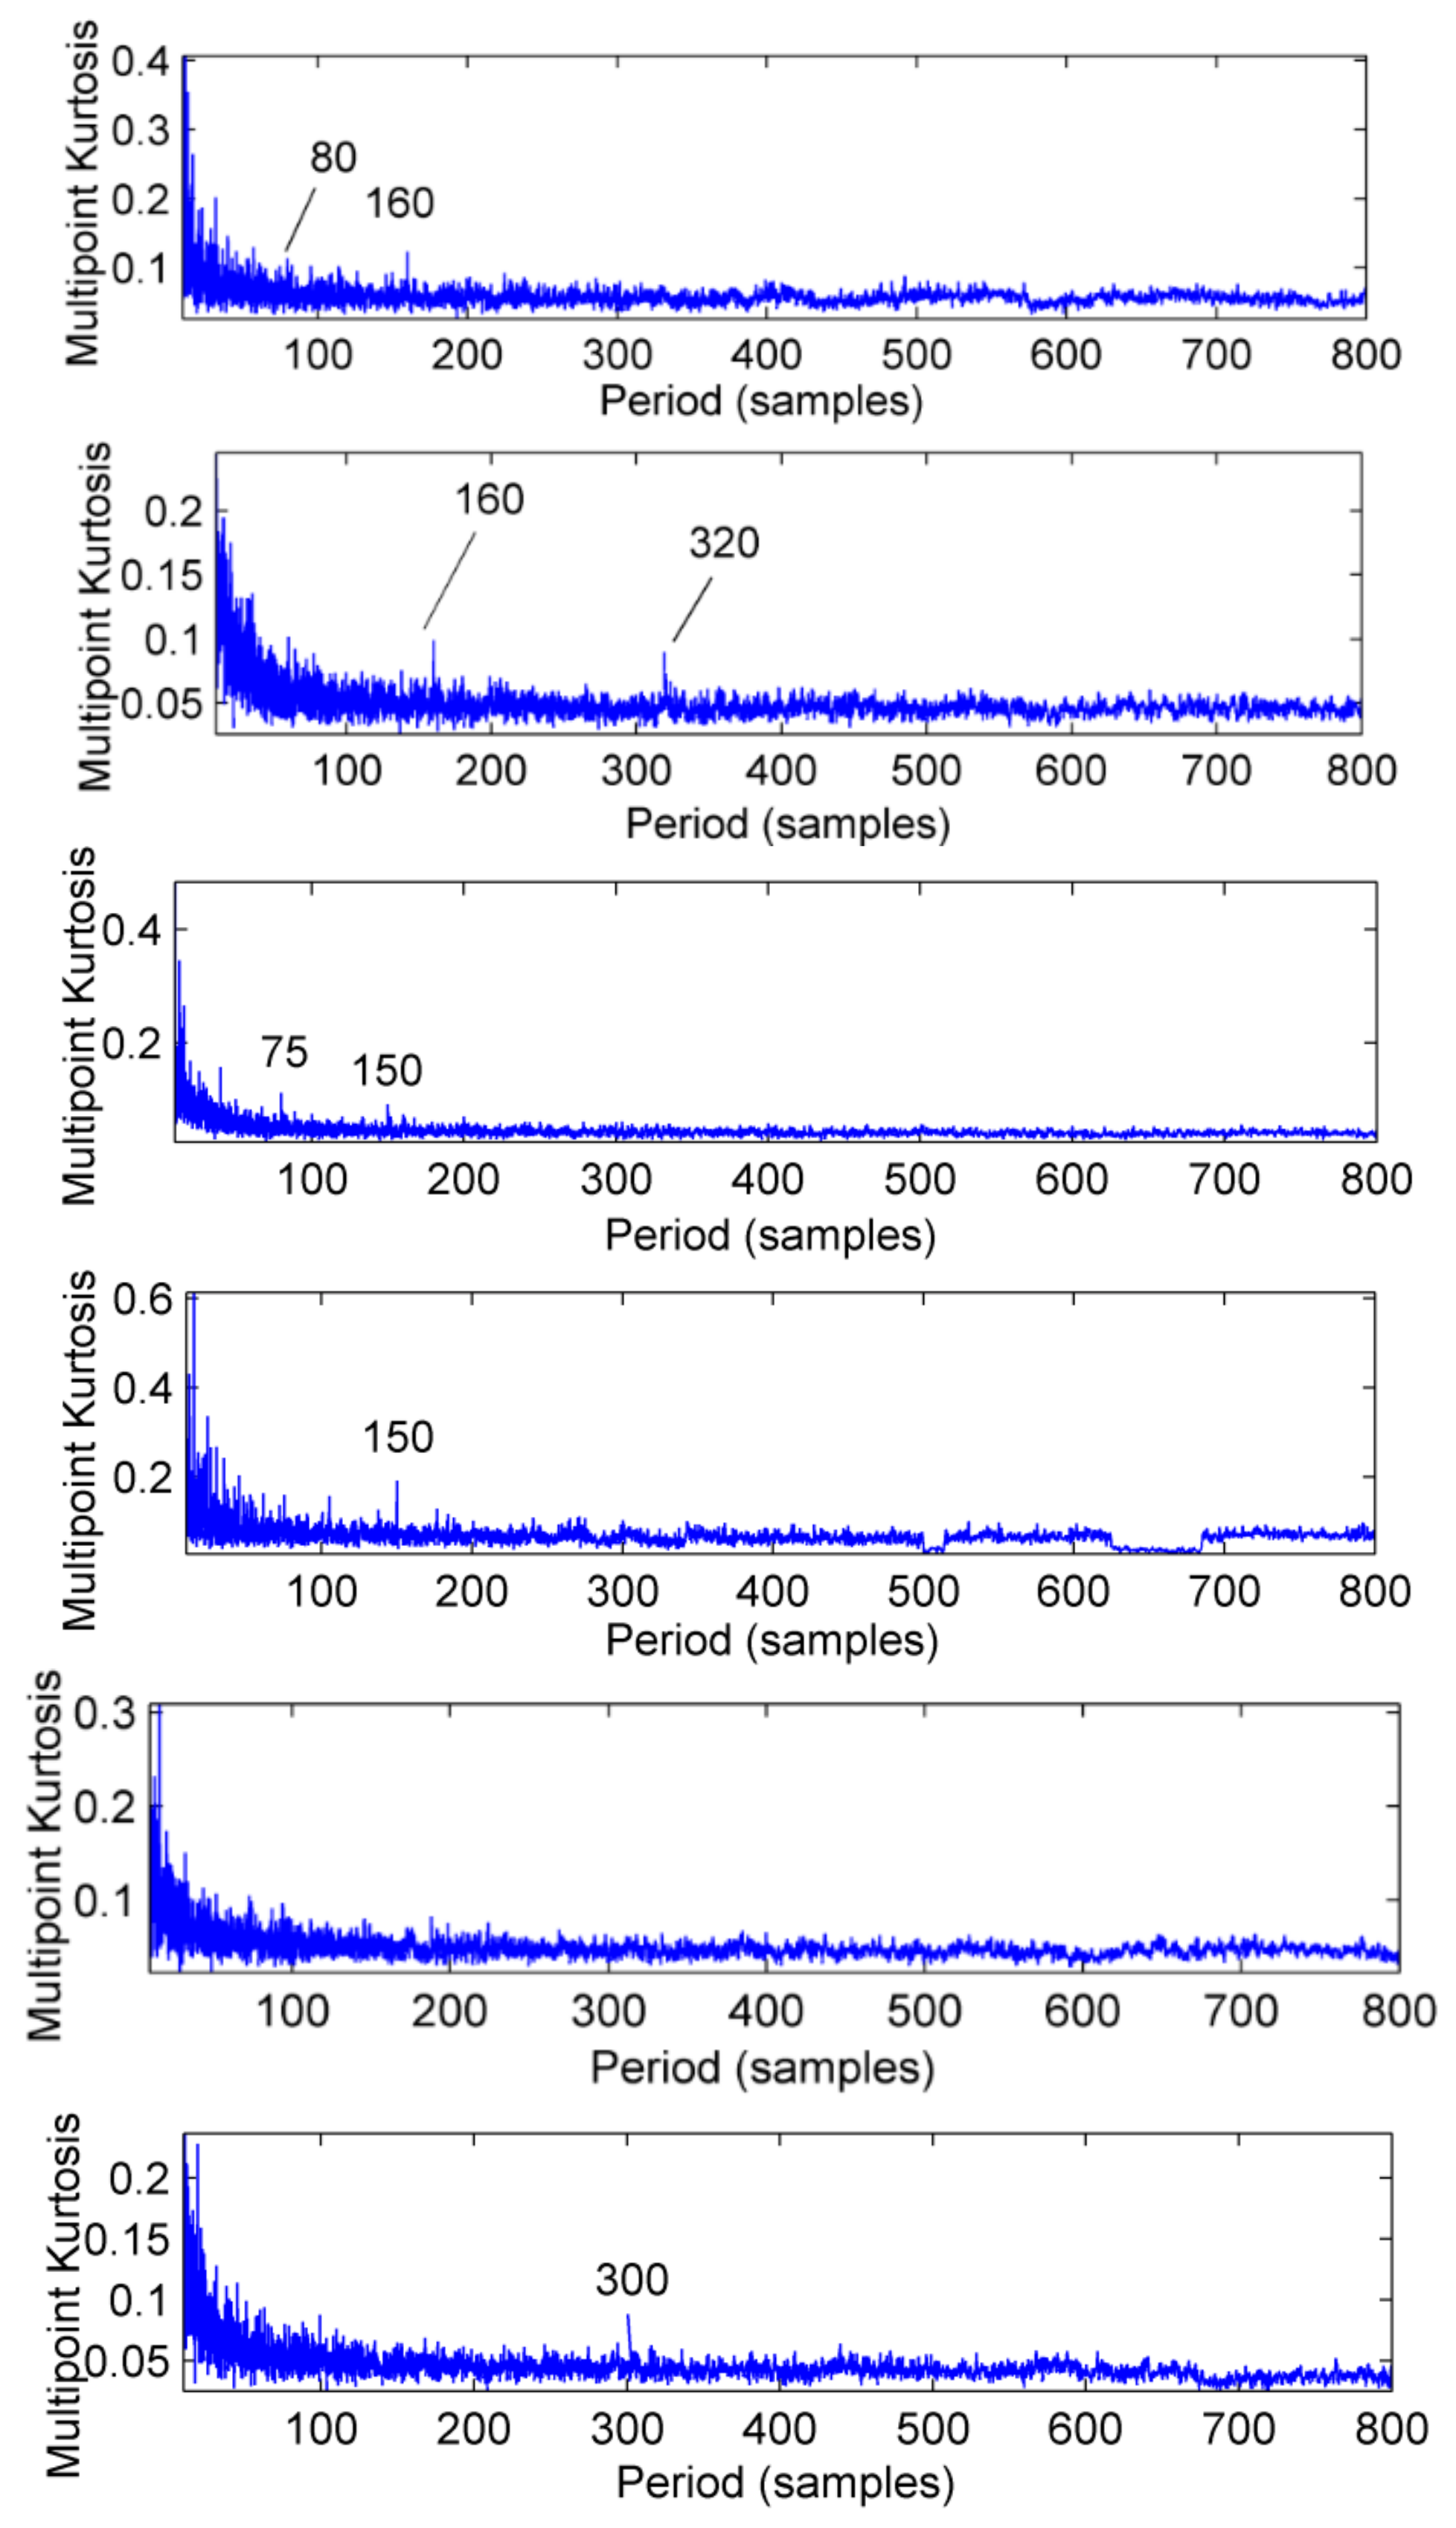
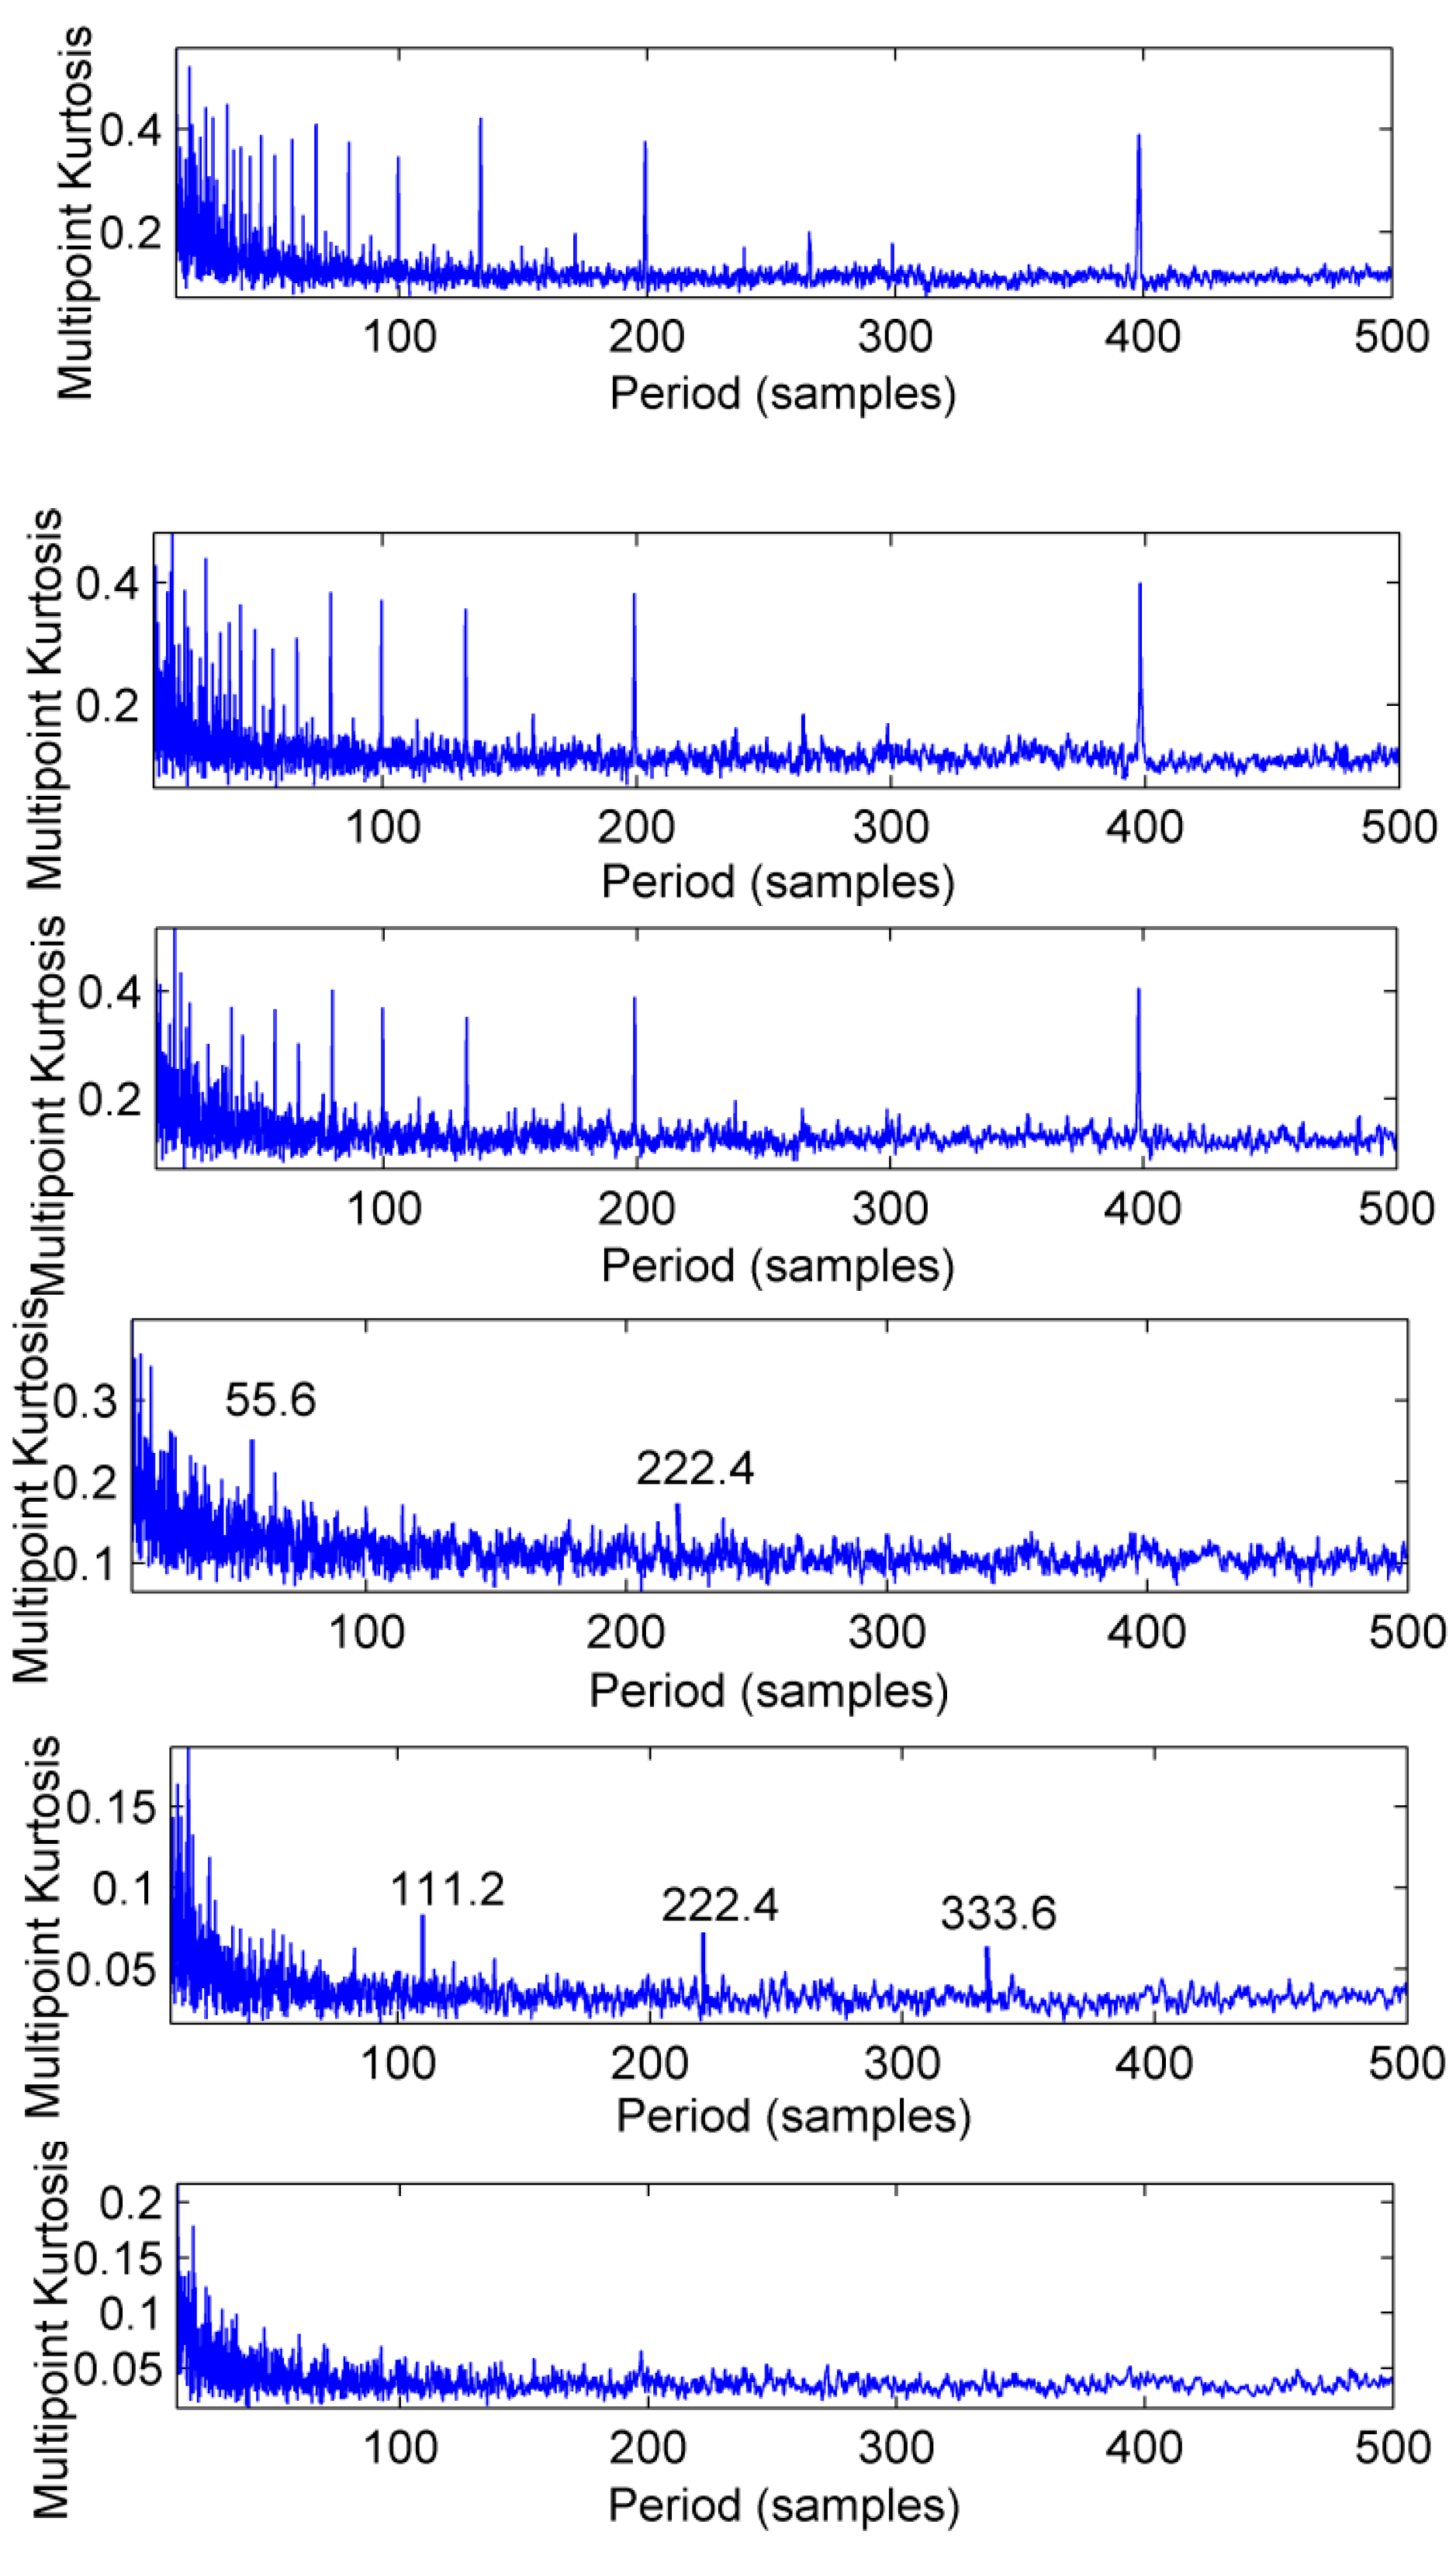
- (7)
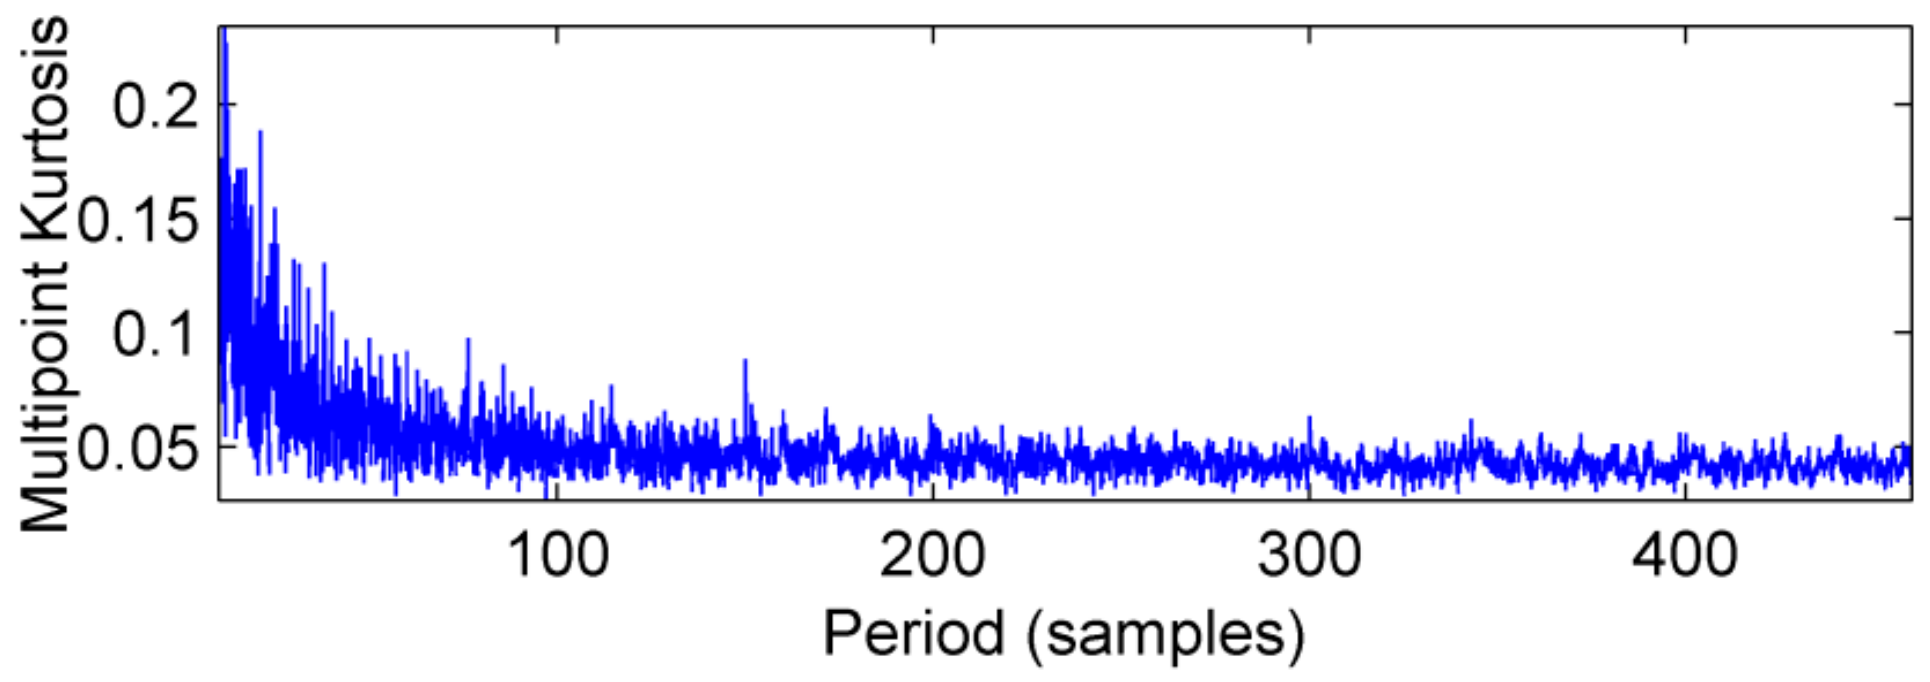
- The remaining PF components are obtained for the multi-point kurtosis (MPK) spectrum, and the periodicity of the impulse signal of each layer PF is determined by the spectrum.
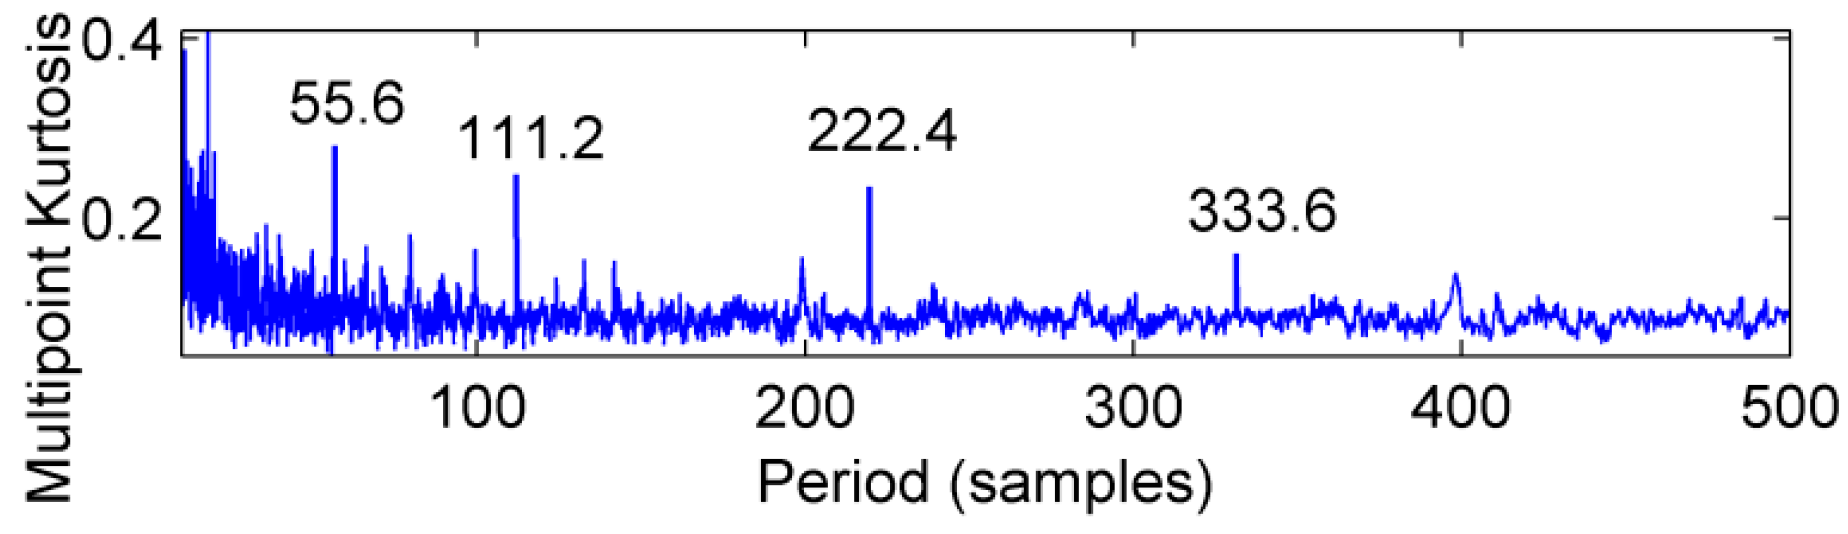
- (8)
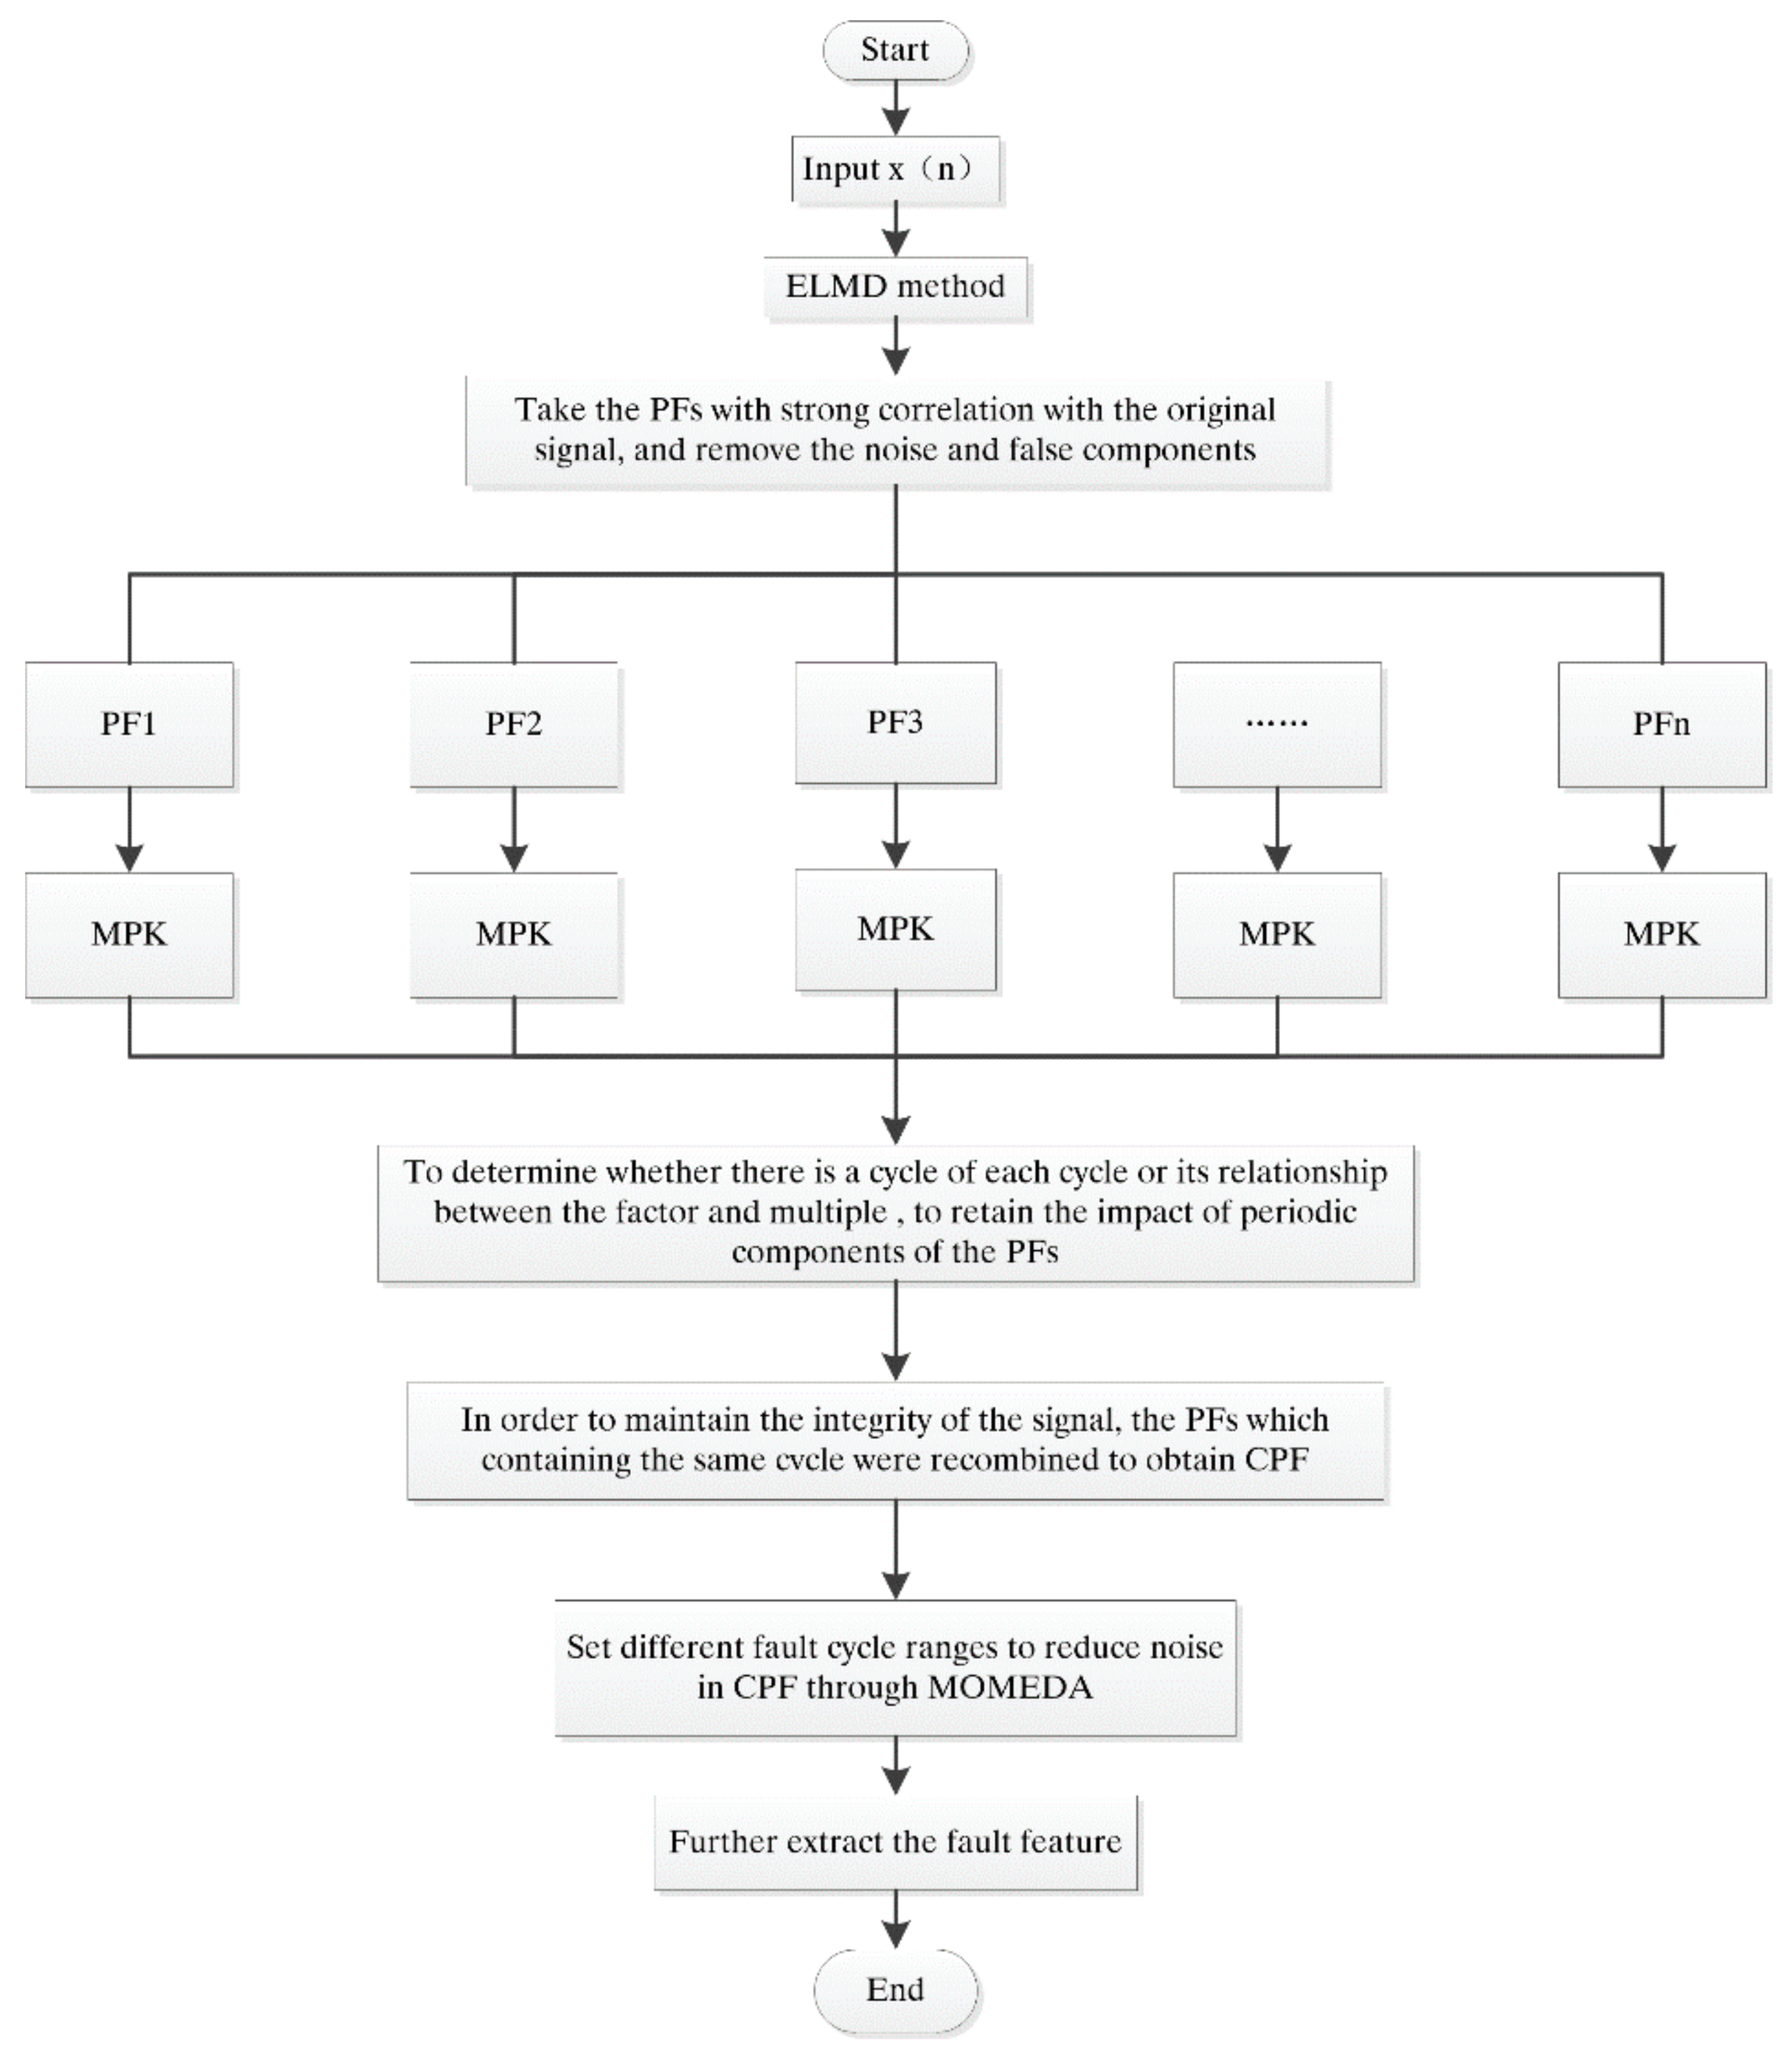
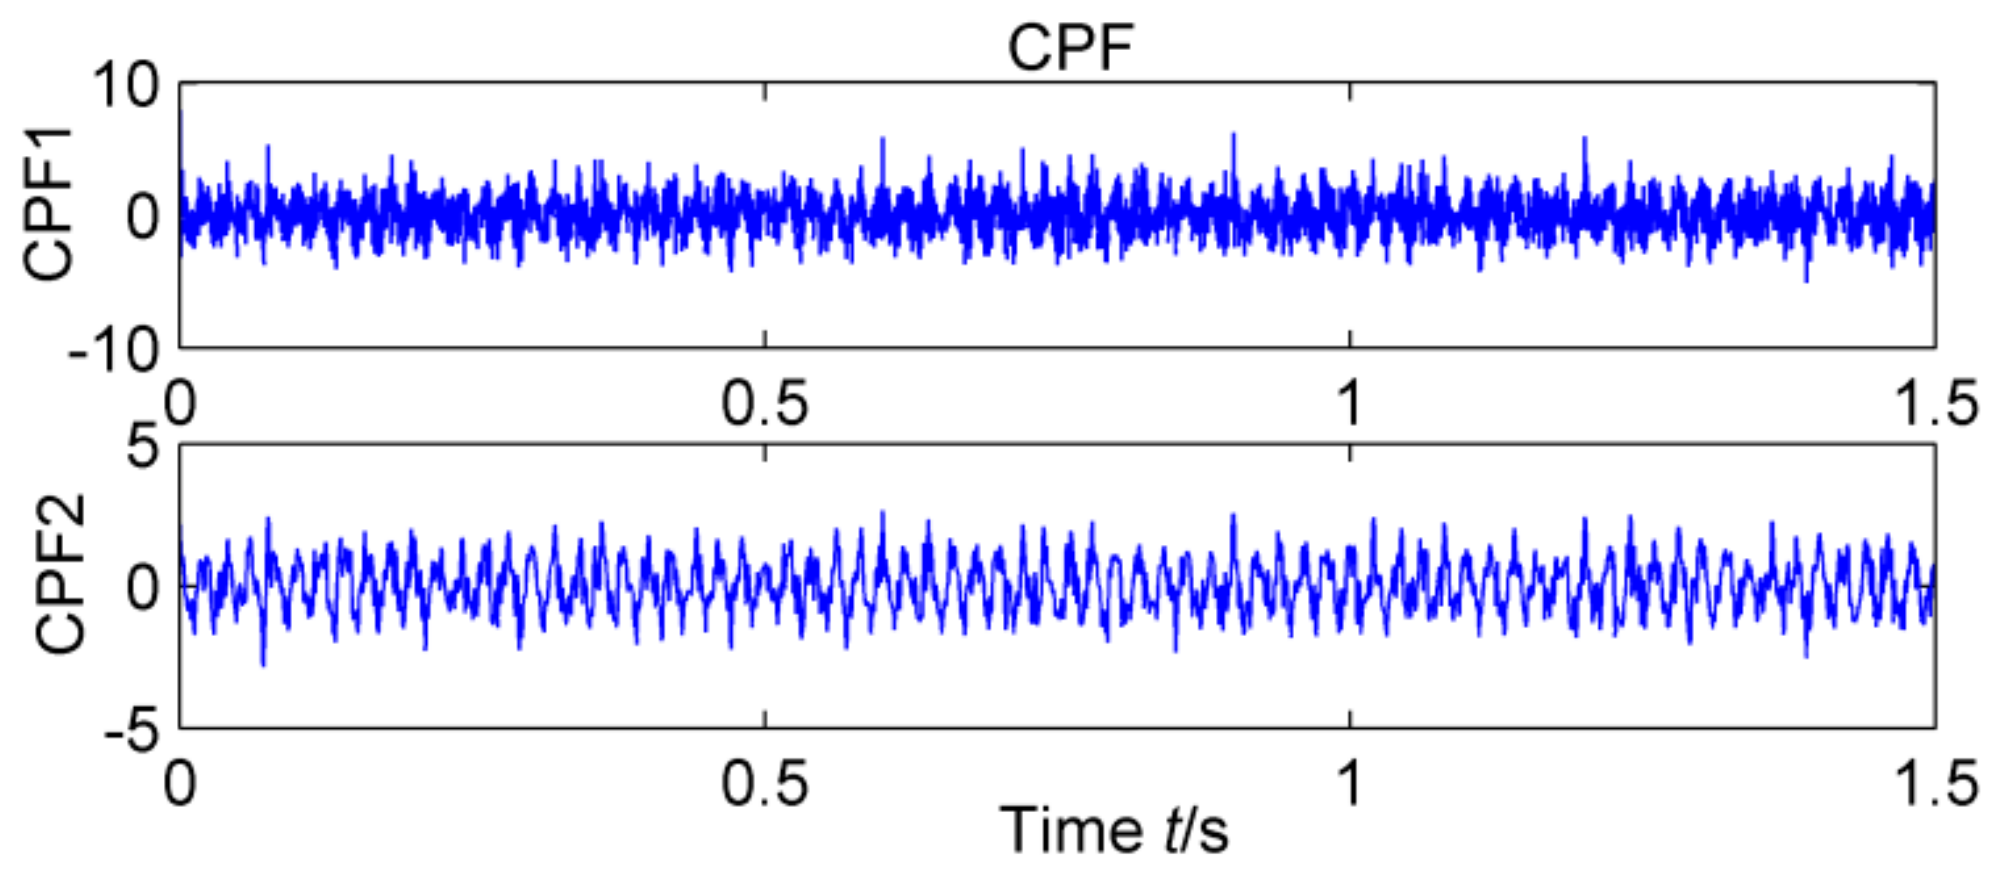
- The new CPF function is reorganized with the same period of PF, which not only enhances the energy of the same fault feature, but also decomposes the different fault features of the original signal into different PFs, this completely avoids the effect of modal aliasing:where m is the maximal number of PF containing the same frequency component in ELMD. CPF2 is obtained by combining other PF with the same periodic component:where m < i ≤ n, n is the maximal number of PF in ELMD, i is the maximum number of layers of another periodic signal. If the original signal contains three or more fault frequency components, it is possible to continue to obtain CPF3 or more like described above. As the ELMD adaptive signal from high to low frequency decomposition in order to get different PFs, so CPF is equivalent to an adaptive filter, it will break the original signal into high and low frequency band product function.
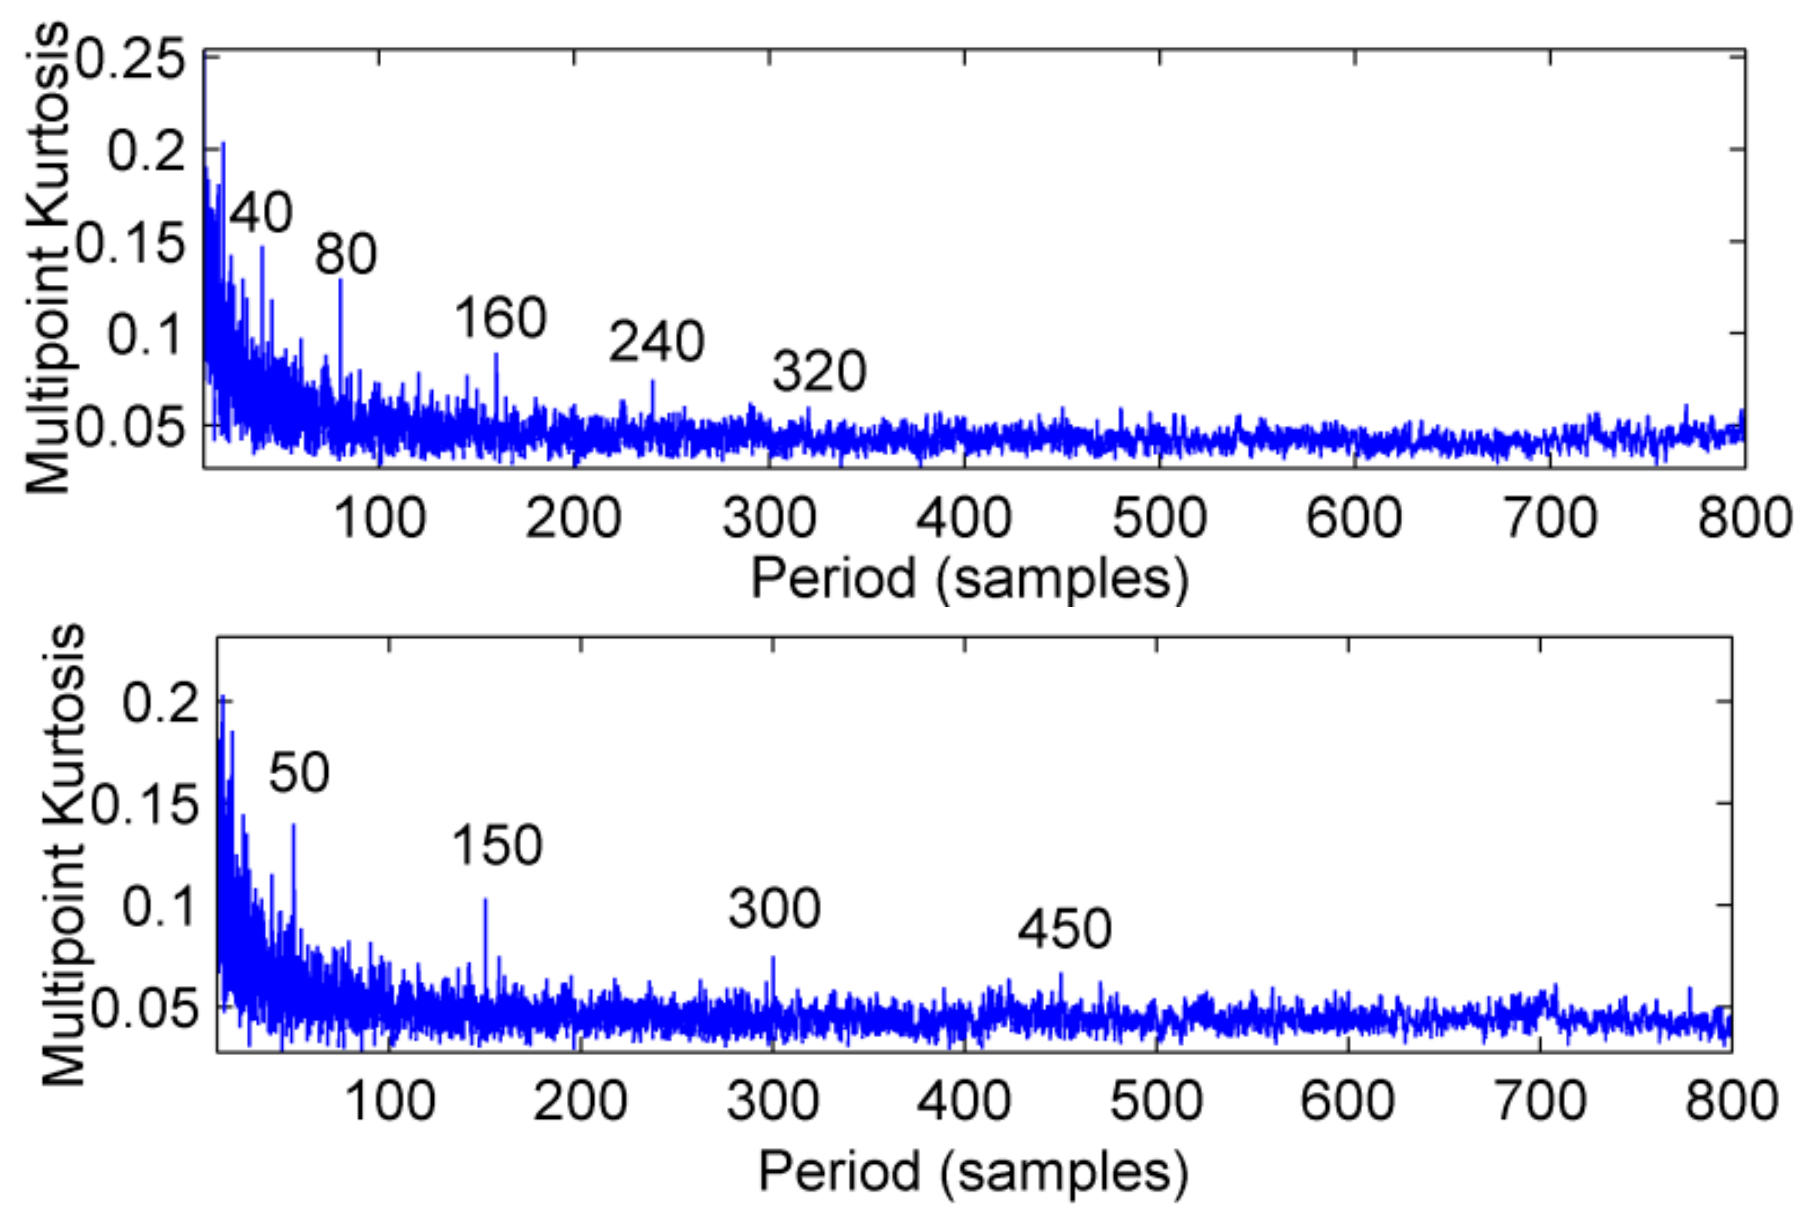
- (9)
- CPF1, CPF2 contains different fault characteristics, cycle components are different, through MOMEDA extract fault characteristics. CPF-MOMEDA fault feature extraction process is shown in Figure 6.
4. Multi-Fault Feature Recognition Experiment of Gearbox under Strong Noise Condition
5. Conclusions
Author Contributions
Acknowledgments
Conflicts of Interest
References
- Janjarasjitt, S.; Ocak, H.; Loparo, K. Bearing condition diagnosis and prognosis using applied nonlinear dynamical analysis of machine vibration signal. J. Sound Vib. 2008, 317, 112–126. [Google Scholar] [CrossRef]
- Randall, R.B.; Antoni, J. Rolling element bearing diagnostics—A tutorial. Mech. Syst. Signal Process. 2011, 25, 485–520. [Google Scholar] [CrossRef]
- Barszcz, T.; JabŁon’ski, A. A novel method for the optimal band selection for vibration signal demodulation and comparison with the Kurtogram. Mech. Syst. Signal Process. 2011, 25, 431–451. [Google Scholar] [CrossRef]
- Zhong, J.H.; Kin, W.P.; Yang, Z.X. Simultaneous-Fault Diagnosis of Gearboxes Using Probabilistic Committee Machine. Sensors 2016, 16, 185. [Google Scholar] [CrossRef] [PubMed]
- Bustos, A.; Rubio, H.; Castejón, C.; García-Prada, J.C. EMD-Based Methodology for the Identification of a High-Speed Train Running in a Gear Operating State. Sensors 2018, 18, 793. [Google Scholar] [CrossRef] [PubMed]
- Wu, Z.; Huang, N.E. Ensemble empirical mode decomposition: A noise assisted data analysis method. Adv. Adapt. Data Anal. 2009, 1, 1–41. [Google Scholar] [CrossRef]
- Liu, Z.W.; Guo, W.; Tang, Z.C. Multi-Sensor Data Fusion Using a Relevance Vector Machine Based on an Ant Colony for Gearbox Fault Detection. Sensors 2015, 15, 21857–21875. [Google Scholar] [CrossRef] [PubMed] [Green Version]
- Ma, Z.C.; Wen, G.; Cheng, J. EEMD Independent Extraction for Mixing Features of Rotating Machinery Reconstructed in Phase Space. Sensors 2015, 15, 8550–8569. [Google Scholar] [CrossRef] [PubMed] [Green Version]
- Lei, Y.G.; Zuo, M.J. Fault diagnosis of rotating machinery using an improved HHT based on EEMD and sensitive IMFs. Meas. Sci. Technol. 2009, 20, 125701–125712. [Google Scholar] [CrossRef]
- Peng, Z.K.; Tse, P.W.; Chu, F.L. A comparison study of improved Hilbert–Huang transform and wavelet transform: Application to fault diagnosis for rolling bearing. Mech. Syst. Signal Process. 2005, 19, 974–988. [Google Scholar] [CrossRef]
- Zhang, J.; Yan, R.; Gao, R.X. Performance enhancement of ensemble empirical mode decomposition. Mech. Syst. Signal Process. 2010, 24, 2104–2123. [Google Scholar] [CrossRef]
- Zhou, Y.; Tao, T.; Mei, X.; Jiang, G.; Sun, N. Feed-axis gearbox condition monitoring using built-in position sensors and EEMD method. Robot. Comput.-Integr. Manuf. 2011, 27, 785–793. [Google Scholar] [CrossRef]
- Wang, Z.J.; Han, Z.N. A novel procedure for diagnosing multiple faults in rotating machinery. ISA Trans. 2015, 55, 208–218. [Google Scholar] [CrossRef] [PubMed]
- Smith, J.S. The local mean decomposition and its application to EEG perception data. J. R. Soc. Interface 2005, 2, 443–454. [Google Scholar] [CrossRef] [PubMed] [Green Version]
- Wang, Z.J.; Wang, J.Y.; Kou, Y.F.; Zhang, J.P.; Ning, S.H.; Zhao, Z.F. Weak Fault Diagnosis of Wind Turbine Gearboxes Based on MED-LMD. Entropy 2017, 19, 277. [Google Scholar] [CrossRef]
- Han, J.J.; Mirko, V.D.B. Microseismic and seismic denoising via ensemble empirical mode decomposition and adaptive thresholding. Geophysics 2015, 80, KS68–KS80. [Google Scholar] [CrossRef]
- Liu, W.Y.; Zhang, W.H.; Han, J.G.; Wang, G.F. A new wind turbine fault diagnosis method based on the local mean decomposition. Renew. Energy 2012, 48, 411–415. [Google Scholar] [CrossRef]
- Wang, L.; Liu, Z.; Miao, Q. Complete ensemble local mean decomposition with adaptive noise and its application to fault diagnosis for rolling bearings. Mech. Syst. Signal Process. 2018, 106, 24–39. [Google Scholar] [CrossRef]
- Geoff, L. McDonald. Multipoint Optimal Minimum Entropy Deconvolution and Convolution Fix: Application to vibration fault detection. Mech. Syst. Signal Process. 2017, 82, 461–477. [Google Scholar]
- Cabrelli, C.A. Minimum entropy deconvolution and simplicity: A noniterative algorithm. Geophysics 1985, 50, 394–413. [Google Scholar] [CrossRef]


© 2018 by the authors. Licensee MDPI, Basel, Switzerland. This article is an open access article distributed under the terms and conditions of the Creative Commons Attribution (CC BY) license (http://creativecommons.org/licenses/by/4.0/).
Share and Cite
Cai, W.; Wang, Z. Application of an Improved Multipoint Optimal Minimum Entropy Deconvolution Adjusted for Gearbox Composite Fault Diagnosis. Sensors 2018, 18, 2861. https://doi.org/10.3390/s18092861
Cai W, Wang Z. Application of an Improved Multipoint Optimal Minimum Entropy Deconvolution Adjusted for Gearbox Composite Fault Diagnosis. Sensors. 2018; 18(9):2861. https://doi.org/10.3390/s18092861
Chicago/Turabian StyleCai, Wenan, and Zhijian Wang. 2018. "Application of an Improved Multipoint Optimal Minimum Entropy Deconvolution Adjusted for Gearbox Composite Fault Diagnosis" Sensors 18, no. 9: 2861. https://doi.org/10.3390/s18092861