1. Introduction
Moving target detection plays a primary and pivotal role in the marine radar system, which aims to completely and accurately detect moving objects from video data. For the non-Gaussian sea clutter and complex backgrounds, using sequential radar images to extract targets of interest such as vessels and low-flying aircraft is a challenging task. The moving target detection problem mainly has two issues, target detection and target tracking. Target detection is explored to find the candidate positions of targets by the video data originated from radar front-end. Target tracking is designed to associate the positions into the trajectories of the targets. As the increased resolution of modern radar, targets would be found in several resolution cells rather than merely appearing in one single resolution cell. Then, the high-resolution radar would receive more than one points per time step from different corner reflectors of a single target. The target is unsuitable to be categorized as a point. Therefore, a hot research topic, extended target detection and tracking, arises recently. The aim of this work is to develop a novel target detection framework to improve the extended target tracking performance by providing more accurate points of targets and fewer false alarm points.
Various algorithms have been developed for multiple extended target tracking (METT). ET-PHD-based algorithms [
1,
2,
3,
4,
5] are capable of estimating the target extent and measurement rates as well as the kinematic state of the target. For the weak extended target, track-before-detect (TBD) methodology, which makes full use of multi-scan, has been employed to develop Hough transformation-based TBD [
6], dynamic programming-based TBD [
7], Grey Wolf optimization-based (GWO) TBD [
8], and particle filter-based methods [
9]. The existing methods [
1,
2,
3,
4,
5,
6,
7,
8,
9] have achieved excellent tracking performance. It is hard to further significantly improve tracking performance by developing delicate tracking algorithms. Therefore, providing more accurate points of targets and less false alarm points by improved extended target detection method is promising to improve the performance of radar systems. The PHD-based filters [
1,
2,
3,
4,
5] are fed with the points provided by an originally ordered statistic constant false alarm rate (OS-CFAR) detector [
10]. Following the work in [
10], more improved versions of CFAR detectors [
11,
12,
13] are developed. Wang C. et al. [
11] present an intensity-space (IS) domain CFAR ship detector. In [
12], clutter modeling has been identified as a viable solution to suppress false detection. Gao G. et al. [
13] develope a statistical model of the filter in nonhomogeneous sea clutter to achieve CFAR detection. However, due to the presence of non-intentional interference (sea clutter, thermal clutter and ground clutter) and the echoes of background (mountains, shores, buildings, islands and motor vehicles), many false alarms exist. The methods in [
10,
11,
12,
13] are insufficient in suppressing the fixed clutter. To address this problem, clutter map-based CFAR (CM-CFAR) methods [
14,
15], which take the full benefits of multi-scans, are proposed. Conte et al. [
14] develop a CM-CFAR relying on a combination of space and time processing. In [
15], the background noise/clutter power is estimated by processing the returns in the map cell from all scans up to the current one. Using temporal information and spatial information simultaneously is another powerful technology that benefits from multi-scans for clutter suppression [
16,
17,
18]. The priority of the methods is identifying the background priors for a video [
16]. The spatial saliency map and the temporal saliency map are calculated in [
17] and spatiotemporal local contrast filter is developed in [
18]. However, drawbacks still exist. Pixels of radar video increase dramatically for the increases of resolution and coverage range. Many more calculations and memory are required for using the detection methods [
10,
11,
12,
13,
14,
15,
16,
17,
18]. Meanwhile, one frame of video must be processed within a radar scanning cycle by limited memory space. However, the methods in [
10,
11,
12,
13,
14,
15,
16,
17,
18] cannot process the video in real time. Meanwhile, the memory requirements of the methods in [
14,
15,
16,
17,
18] are enormous. The above-mentioned shortcomings drastically limit the utilization of the methods in [
10,
11,
12,
13,
14,
15,
16,
17,
18] in engineering.
A series of algorithms has been developed in our former works [
19,
20,
21,
22] to address excellent performance, real-time processing, and low memory requirement simultaneously. A contour tracking algorithm is used in [
19] to meet the real-time processing in advance. The detection approach in [
20], which uses a region growing algorithm, is developed to improve location precision. The methods in [
21,
22] are designed to detect targets in dense targets scenarios such as fleet detection and targets in lanes. To suppress the fixed clutter, an efficient spatiotemporal detection method based on sampling is designed. Meanwhile, the sampling-based spatiotemporal detection method and the methods in [
20,
21,
22] are integrated into the novel detection framework. The methods in [
19,
20,
21] detect targets only by the current frame. In this work, both the current frame and several past frames are utilized to estimate the intensity of the clutter. Compared with former work [
19,
20,
21], more video data are utilized to improve the detection performance. Thus, our former works [
19,
20,
21,
22] are components in the proposed framework. We do not simply piece together these components. The framework is designed to make each component work well with the others. Past frames have not been used in extended target detection before and the detection methods are not combined with target tracking methods in [
19,
20,
21,
22]. Their excellent performance can be improved by fine detection. Meanwhile, computation and memory requirements can be decreased by coarse detection. In the first stage, a sampled map evaluating the clutter intensity of surveillance area is built to suppress the fixed clutter. Unlike spatiotemporal-based filters [
18], little memory is required for sampling on range, azimuth and time axes. The coarse detection is designed to roughly locate the area where targets may exist in advance by uniformly selecting seeds in the whole surveillance area. Only the selected seeds are used to guarantee the real-time processing and low memory requirement. In the fine detection stage, only the areas where targets may exist are processed. The candidate areas are identified into three categories, namely single target, dense targets and sea clutter, by the contours of the areas [
21]. The areas of dense targets are further separated into subareas using the Rain algorithm method [
22]. Each subarea is regarded as an individual target. Excellent performance can be achieved by the fine detection. As presented in
Figure 1, the input of the target detection is the video sequences of radar. The results of target detection are three-dimensional points, i.e. two-dimensional positional information and its measuring time. The measuring time in target tracking algorithms can be simply represented by the frame number (see, e.g., [
1,
2,
3,
4]). Correct points can be obtained by the detection framework to further improve the final tracking performance.
Figure 1 describes the relationship between the radar data processing and the existing methods mentioned above.
The remainder of the work is organized as follows.
Section 2 defines the models and problems.
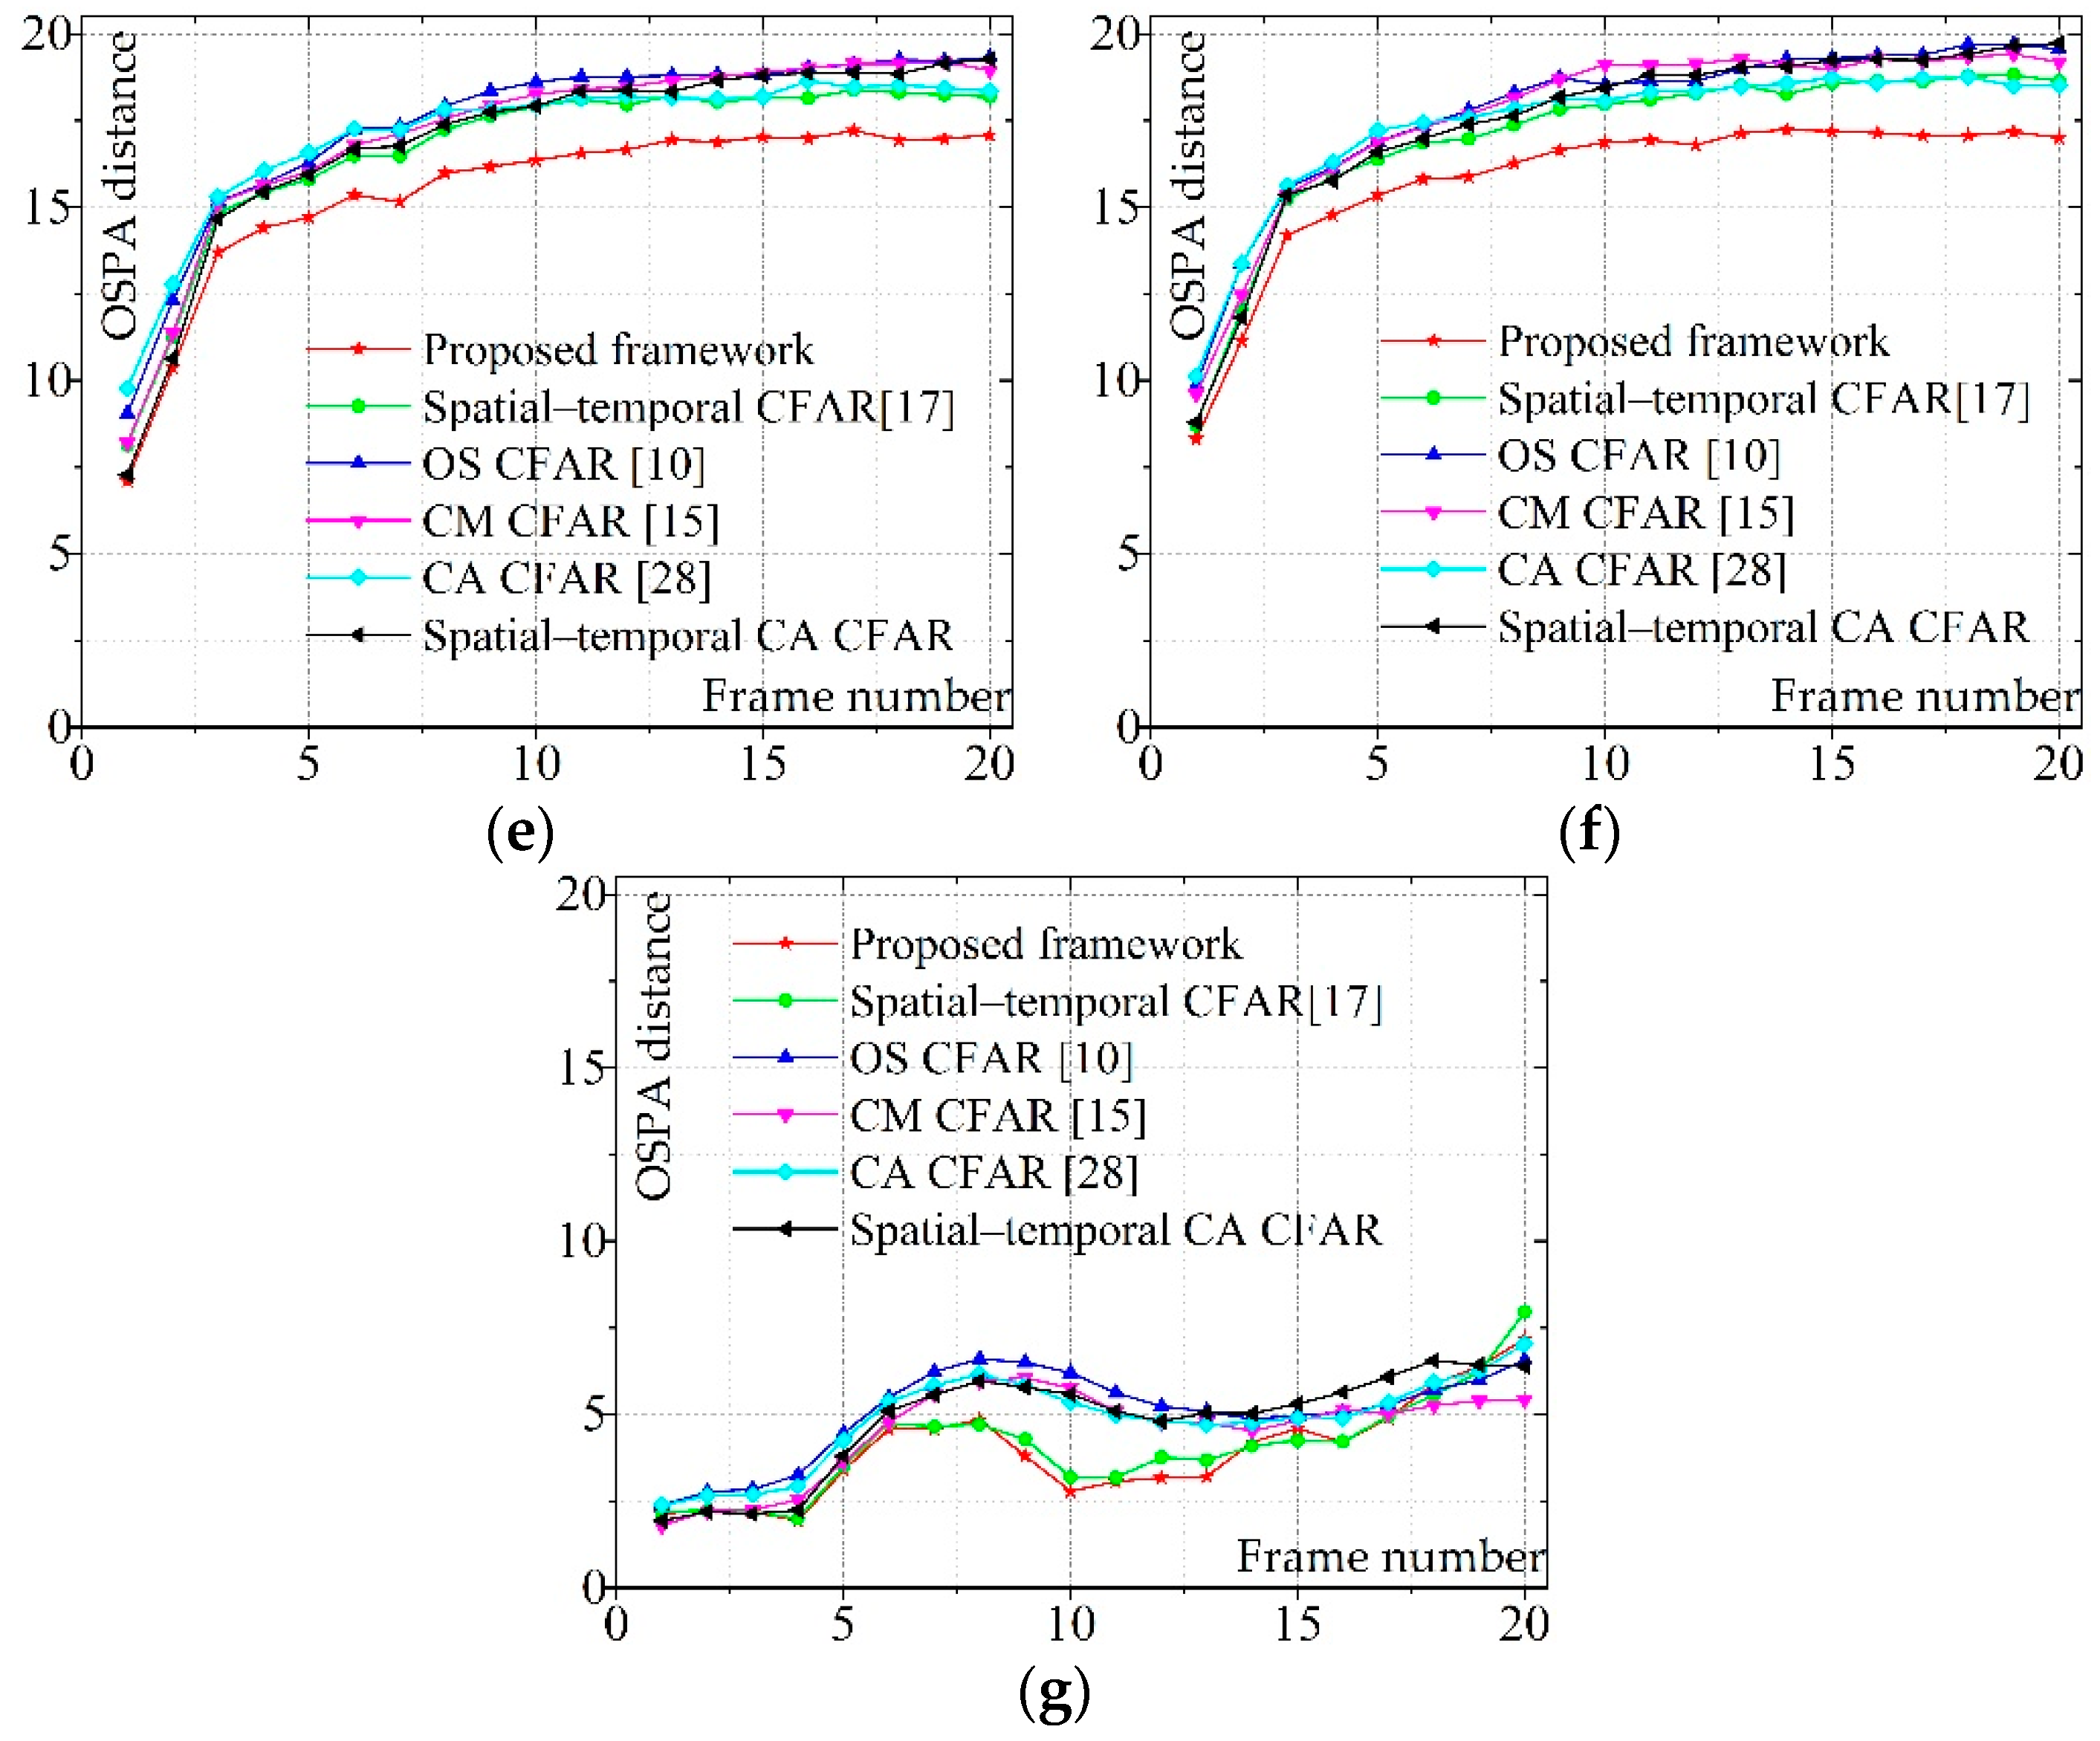
Section 3 presents the implementation of the sampling-based spatiotemporal detection method. In this section, the proposed detection framework is also presented. The superiority of the proposed framework beyond state-of-the-art baselines is substantiated in
Section 4 using real high-resolution marine radar data as well as synthetic data.
Section 5 draws conclusions.
3. Proposed Methods
3.1. Sampling-Based Spatiotemporal Thresholding Method
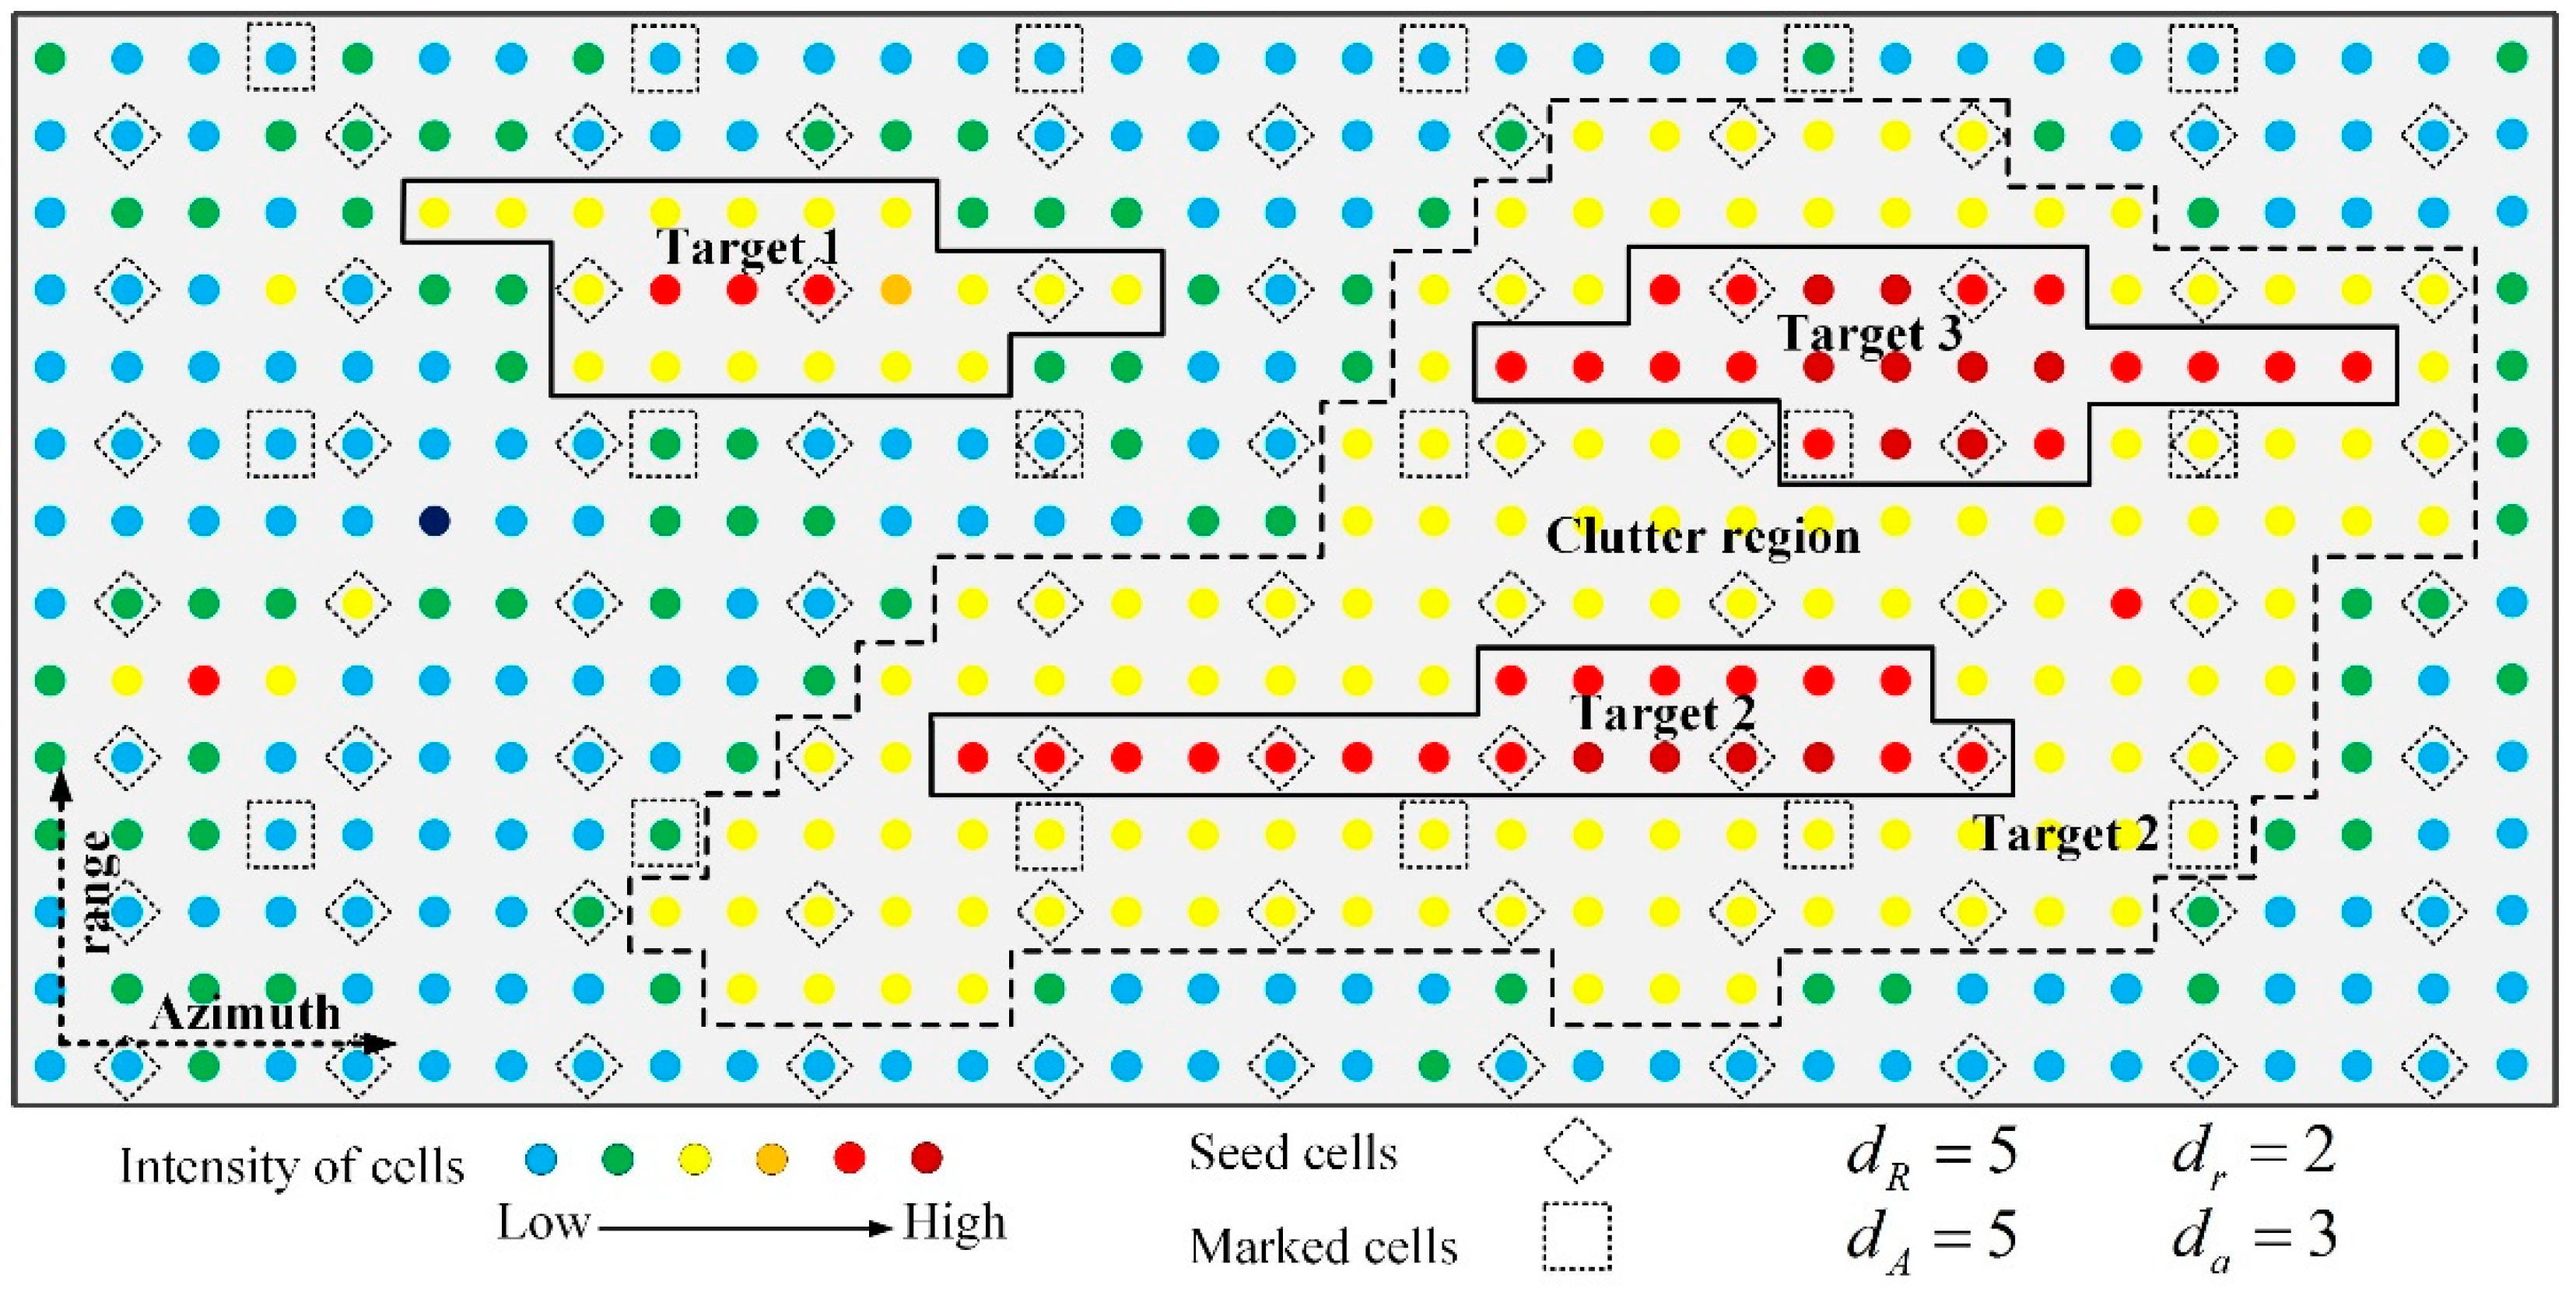
Some clutter regions originate from some huge fixed objects such as buildings and islands. Areas with high sea conditions are also responsible for clutter regions. Clutter regions are much larger than the resolution cell. Meanwhile, as shown by the direct-viewing explanation in
Figure 3a, the measurements are spatially correlated. A sampling-based spatiotemporal thresholding algorithm is proposed with the utilization of the spatial context. The implementation of the method consists of the following steps. The input of the method is
K successive images, each of which has
NR ×
NA pixels. The result is a sampled thresholding map.
Step 1. The sample intervals in range and azimuth, dR and dA, are estimated according to the parameters of the radar and the size of clutter sources. The values of the two sample intervals can be set to dR and dA when the clutter region in the image is no larger than 2dR × 2dA. The sample interval in time dt is related to the variation rate of clutter regions. A larger dt can be set when the area and intensity of the clutter regions are changing slowly.
Step 2. To efficiently monitor the variation of clutter regions, only some of the pixels are uniformly selected from the images. The selected pixels used to evaluate the clutter
Zm are called marked cells here.
Step 3. The sampled spatiotemporal thresholding map
M has (
NR/dR) × (
NA/dA) pixels. The intensity of the pixels can be estimated by the marked cells
Zm. A (2
w + 1) × (2
w + 1) × (
K/dt) local patch is defined in the marked cells. The set of marked cells in the local patch can be regarded as Equation (9) when evaluating the threshold of a marked cell (
r,
a):
Then, the mean intensity of the local image patch at cell (
r,
a) is represented by
m(
r,
a):
Step 4. After obtaining the sampled spatiotemporal thresholding map
M, the intensity of non-marked cell can be estimated by the two-dimensional linear interpolation in Equation (11).
where (
r1,a1), (
r1,a2), (
r2,a1) and (
r2,a2) are the four nearest marked cells.
The result of the sampling-based spatiotemporal thresholding method is the thresholding map
M. Meanwhile, it is worth noting that not all of the intensities of non-marked cells are necessary for fine detection. The intensities of non-marked cells are calculated only when an extended target potentially exists in the area. Only (
NR/dR) × (
NA/dA) × (
K/dt) cells involved in evaluating the sampled map are stored in the processer. Compared with existing spatiotemporal-based methods [
16,
17,
18], many calculations can be saved. Meanwhile, fewer involved cells also means a drastic decrease in computation.
3.2. The Proposed Detection Framework
After the proposed approach above, the spatiotemporal thresholding map that has all
NR ×
NA cells
, M = {
m(
r,
a)|1<
r<
NR,1<
a<
NA }, is available to detect the targets in theory. A contrast map
C, which has
NR ×
NA pixels, is defined first, and the intensity of cell (
r,
a) in the contrast map is denoted by
C(
r,
a):
The input of the proposed detection framework is the contrast map C. Similar to the thresholding map M, the intensities of cells are not calculated if unnecessary. The proposed detection framework consists of two stages, coarse detection and fine detection.
In coarse detection stage, some cells are uniformly selected from the contrast map for efficiency. The input of the coarse detection is the contrast map.
Step 1. The sample intervals in range and azimuth, dr and da, are estimated according to the parameters of the radar and the size of the targets.
Step 2. The approximate locations of targets are found efficiently by uniformly selecting some of the cells from the contrast map
C. The selected cells,
Cs, are called “seed cells”.
Step 3. The candidate areas where targets may exist are found by setting a threshold
Td to the seed cells.
The function of false alarm rate
PFA(
Td) and the function of target detection rate
PD(
Td) can be derived when the parameters of radar and targets are given. The optimal threshold can be obtained by Equation (15).
The derivation and simulation of the expressions for
PFA(
Td) and
PD(
Td) can be found in our previous work [
20].
The results of the coarse detection are the seed cells whose intensities are larger than the threshold. The set of the seed cells is assumed to have Ns elements, i.e. CT = {Csi,1 ≤ i ≤ Ns}.
The second stage is fine detection. The accurate statement of targets is estimated by the seed set CT. The fine detection consists of the following steps.
Step 1. A seed cell in
CT is taken to find the contour of the candidate target in contrast map
C. The multiple contour tracking method in [
19] is utilized to obtain the contours of the area under different thresholds.
Step 2. The area can be grouped into four categories by its contours. If the area is a huge plain without outstanding peaks, the area very likely is unresolved clutter. If the area is larger than a normal target and has several outstanding peaks, the image of the area usually originates from several nearby targets. Then, go to Step 3 for further processing the area. If the area is moderate in size and has an outstanding peak, the image of the area should originate from a single target. Then, go to Step 4. If the area is very small, it is a false alarm. Then, go back to Step 1.
Step 3. The image of multiple targets is partitioned into smaller subareas, each of which can be regarded as a single target. The multilevel thresholding method using the Rain algorithm in [
20] has been developed for this purpose. After obtaining the subareas, go to Step 4.
Step 4. The state of a single target can be estimated by the image of the area. The state includes not only location, size, and posture of the target, but also the texture of the subarea. The texture is promising for improving the association in multi-target tracking [
27]. Then, go to Step 1 to process the next seed cell in
Cs.
To have a better description of the proposed framework, two points are worth noting. The first is the sample intervals in spatiotemporal thresholding method and stage of coarse detection.
Figure 4 presents an example of this relationship. The sample intervals
dR and
dA are utilized to locate the area of a clutter region. Therefore,
dR and
dA are larger than
dr and
da, which are utilized to locate the targets because the clutter regions are much larger than the targets. The sample intervals
dR,
dA,
dr, and
da are related to the parameters of the radar and the size of targets. It assumes that the long axes of an extended target and a clutter region are
lm’ and
Lm’. The lower limits of
lm’ and
Lm are
lmin and
Lmin. Then, according to Equation (6), there are at least
dat azimuth bins and at least
drt range bins whose amplitudes are affected by an extended target.
Similarly, there are at least
dAC azimuth bins and at least
dRC range bins whose amplitudes are affected by a clutter region.
The sample intervals
dR,
dA,
dr, and
da should be no less than the lower limits, i.e.,
The second point is the multiple contours of the candidate area. As presented in
Figure 5, the contours of a single target, nearby targets and false alarm are represented by the black lines of different intensities. The contour of the false alarm is small and irregular. The outstanding peaks in the area of targets can be found by the contours.
The flowchart of the proposed detection framework is presented in
Figure 6. The inputted video and current image are presented in the red dashed box. The video data contain enormous cells to be processed in detection algorithms. The sampled video for spatiotemporal thresholding method is presented in the blue dashed box. Only a few cells need to be stored in the processor, thus much memory is saved. The (
NR/dr) × (
NA/da) selected cells utilized in the stage of coarse detection are presented in the green dashed box. The cells involved in the fine detection are presented in the purple dashed box. The state of targets is estimated using only these cells. A small quantity of involved cells brings a significant decrease in calculations. The black dashed boxes in the bottom of
Figure 6 infer that the areas are clustered into three categories and the points regarding the location of targets can be obtained. The points are the results of the target detection.


