1. Introduction
In recent years, with the continuous development of artificial intelligence (AI), big data, and communication technology, unmanned driving technology has made breakthrough achievements. Unmanned aerial vehicles (UAVs) have gradually entered the civil field from the military field, and unmanned ground vehicles (UGVs) are continually testing on public roads around the world. The research on unmanned ships is also developing rapidly. Major research institutions at home and abroad are investing a large amount of manpower, material resources, and financial resources to carry out theoretical research, technology research, and development of large-tonnage unmanned merchant ships. The key technologies of unmanned ships mainly include situational awareness, intelligent decision-making, motion control, maritime communication, and shore-based remote control, etc., and situational awareness is the premise of all other technologies. The advanced sensors are used to obtain the situation information around unmanned ships, provide basic data support for complex tasks such as intelligent decision-making and motion control, and ensure the autonomous operation safety of unmanned ships [
1].
Currently, ships perceive the maritime environment mainly through two kinds of sensors, namely, radio detection and ranging (RADAR) and automatic identification system (AIS). They transmit the target information to the electronic chart display and information system (ECDIS), which realizes a certain degree of intelligent analysis and decision. However, the maritime navigation environment is complex and variable. RADAR and AIS cannot directly reflect the spatial information of detection targets. The situational awareness cannot be established quickly, and mariners need to confirm the situation. At the same time, RADAR detection is sensitive to meteorological conditions and the shape, size, and material of the target. AIS cannot effectively detect small targets that are not equipped with it or are not turned on. Visible light sensors are intuitive, reliable, informative, and cost-effective [
2]. With the continuous development of computer vision technology, visible light cameras as important situational awareness sensors are gradually being applied to unmanned ships, providing a reliable source of information for intelligent decision-making.
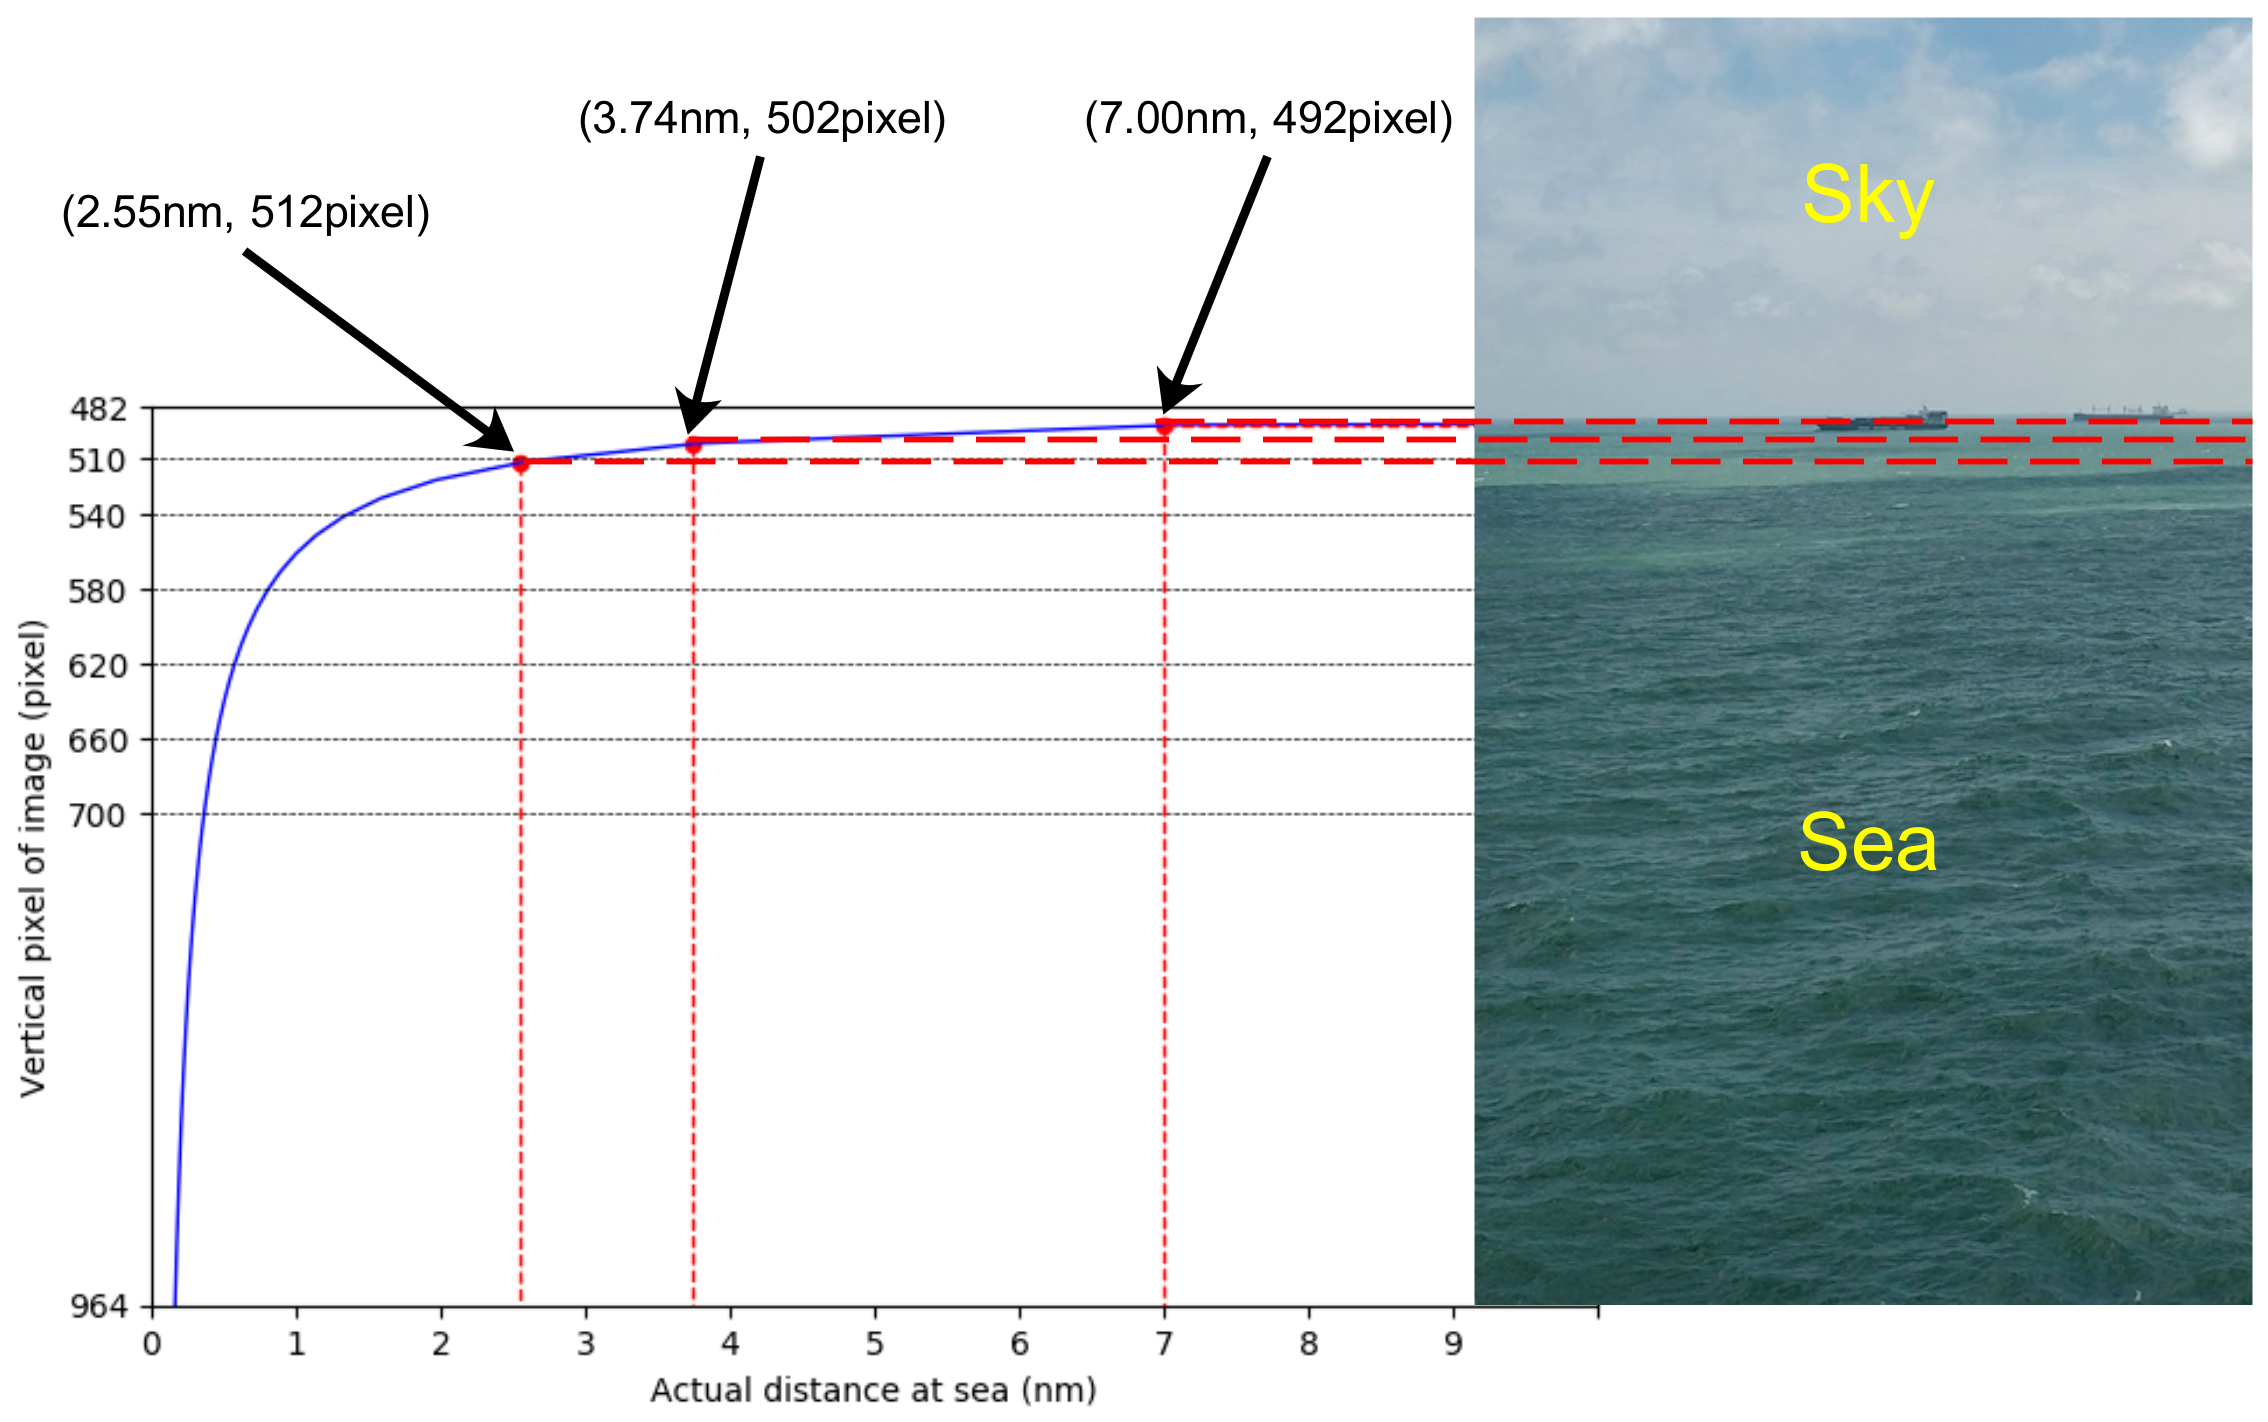
The main targets for maritime detection using cameras include ships, rigs, navigation aids, and icebergs. When maritime targets appear in the field of view of the camera, they must appear in the vicinity of the sea–sky line (SSL). As the distance between the camera and the target approaches, the target gradually enters the sea area. It can be seen that extracting the SSL and performing maritime target detection in its vicinity can greatly reduce the target detection range and reduce the complexity and calculation amount of the algorithm. However, a target near the SSL has a very small area in the image, usually only a few tens or hundreds of pixels, which is easily overwhelmed by the complex sea–sky background, resulting in target missed detection or false detection [
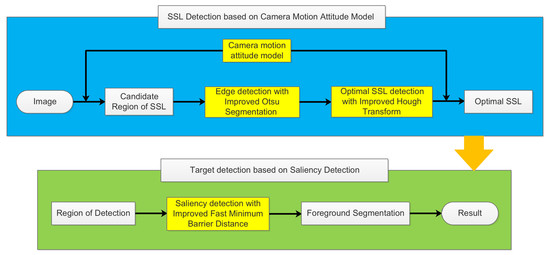
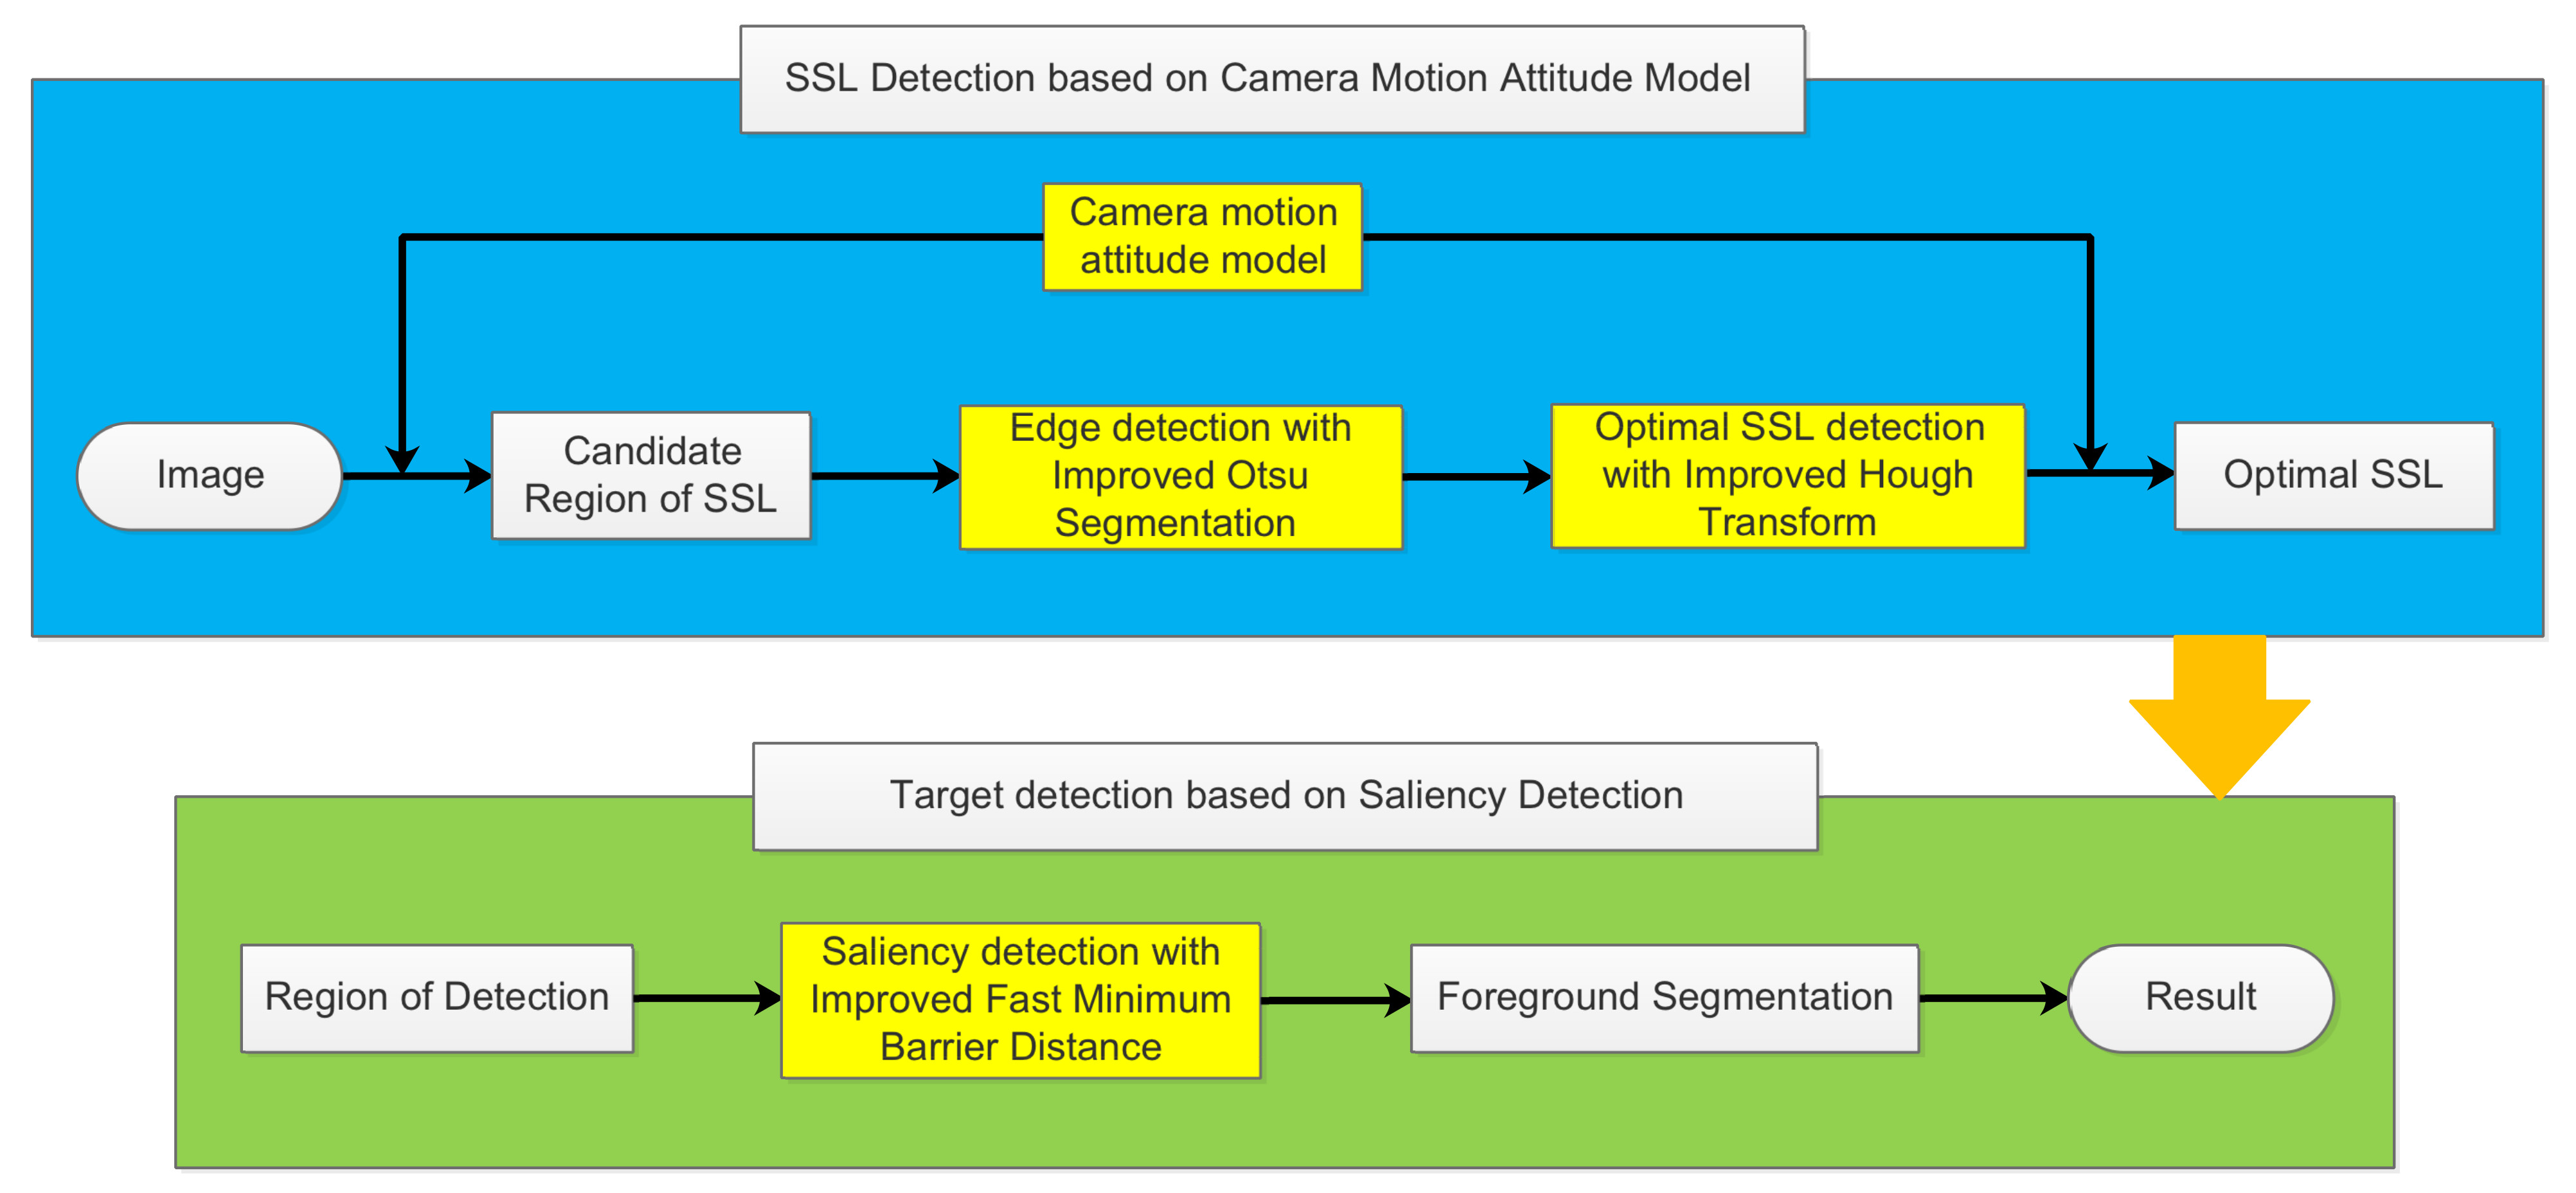
3]. Therefore, this paper proposes an algorithm based on the motion attitude model of a visible light camera for the SSL and its nearby ships.
3. Camera Six-Degrees-of-Freedom Motion Attitude Modeling
In navigation, the ship is sailing in a large circle at sea; the tester with an eye height of
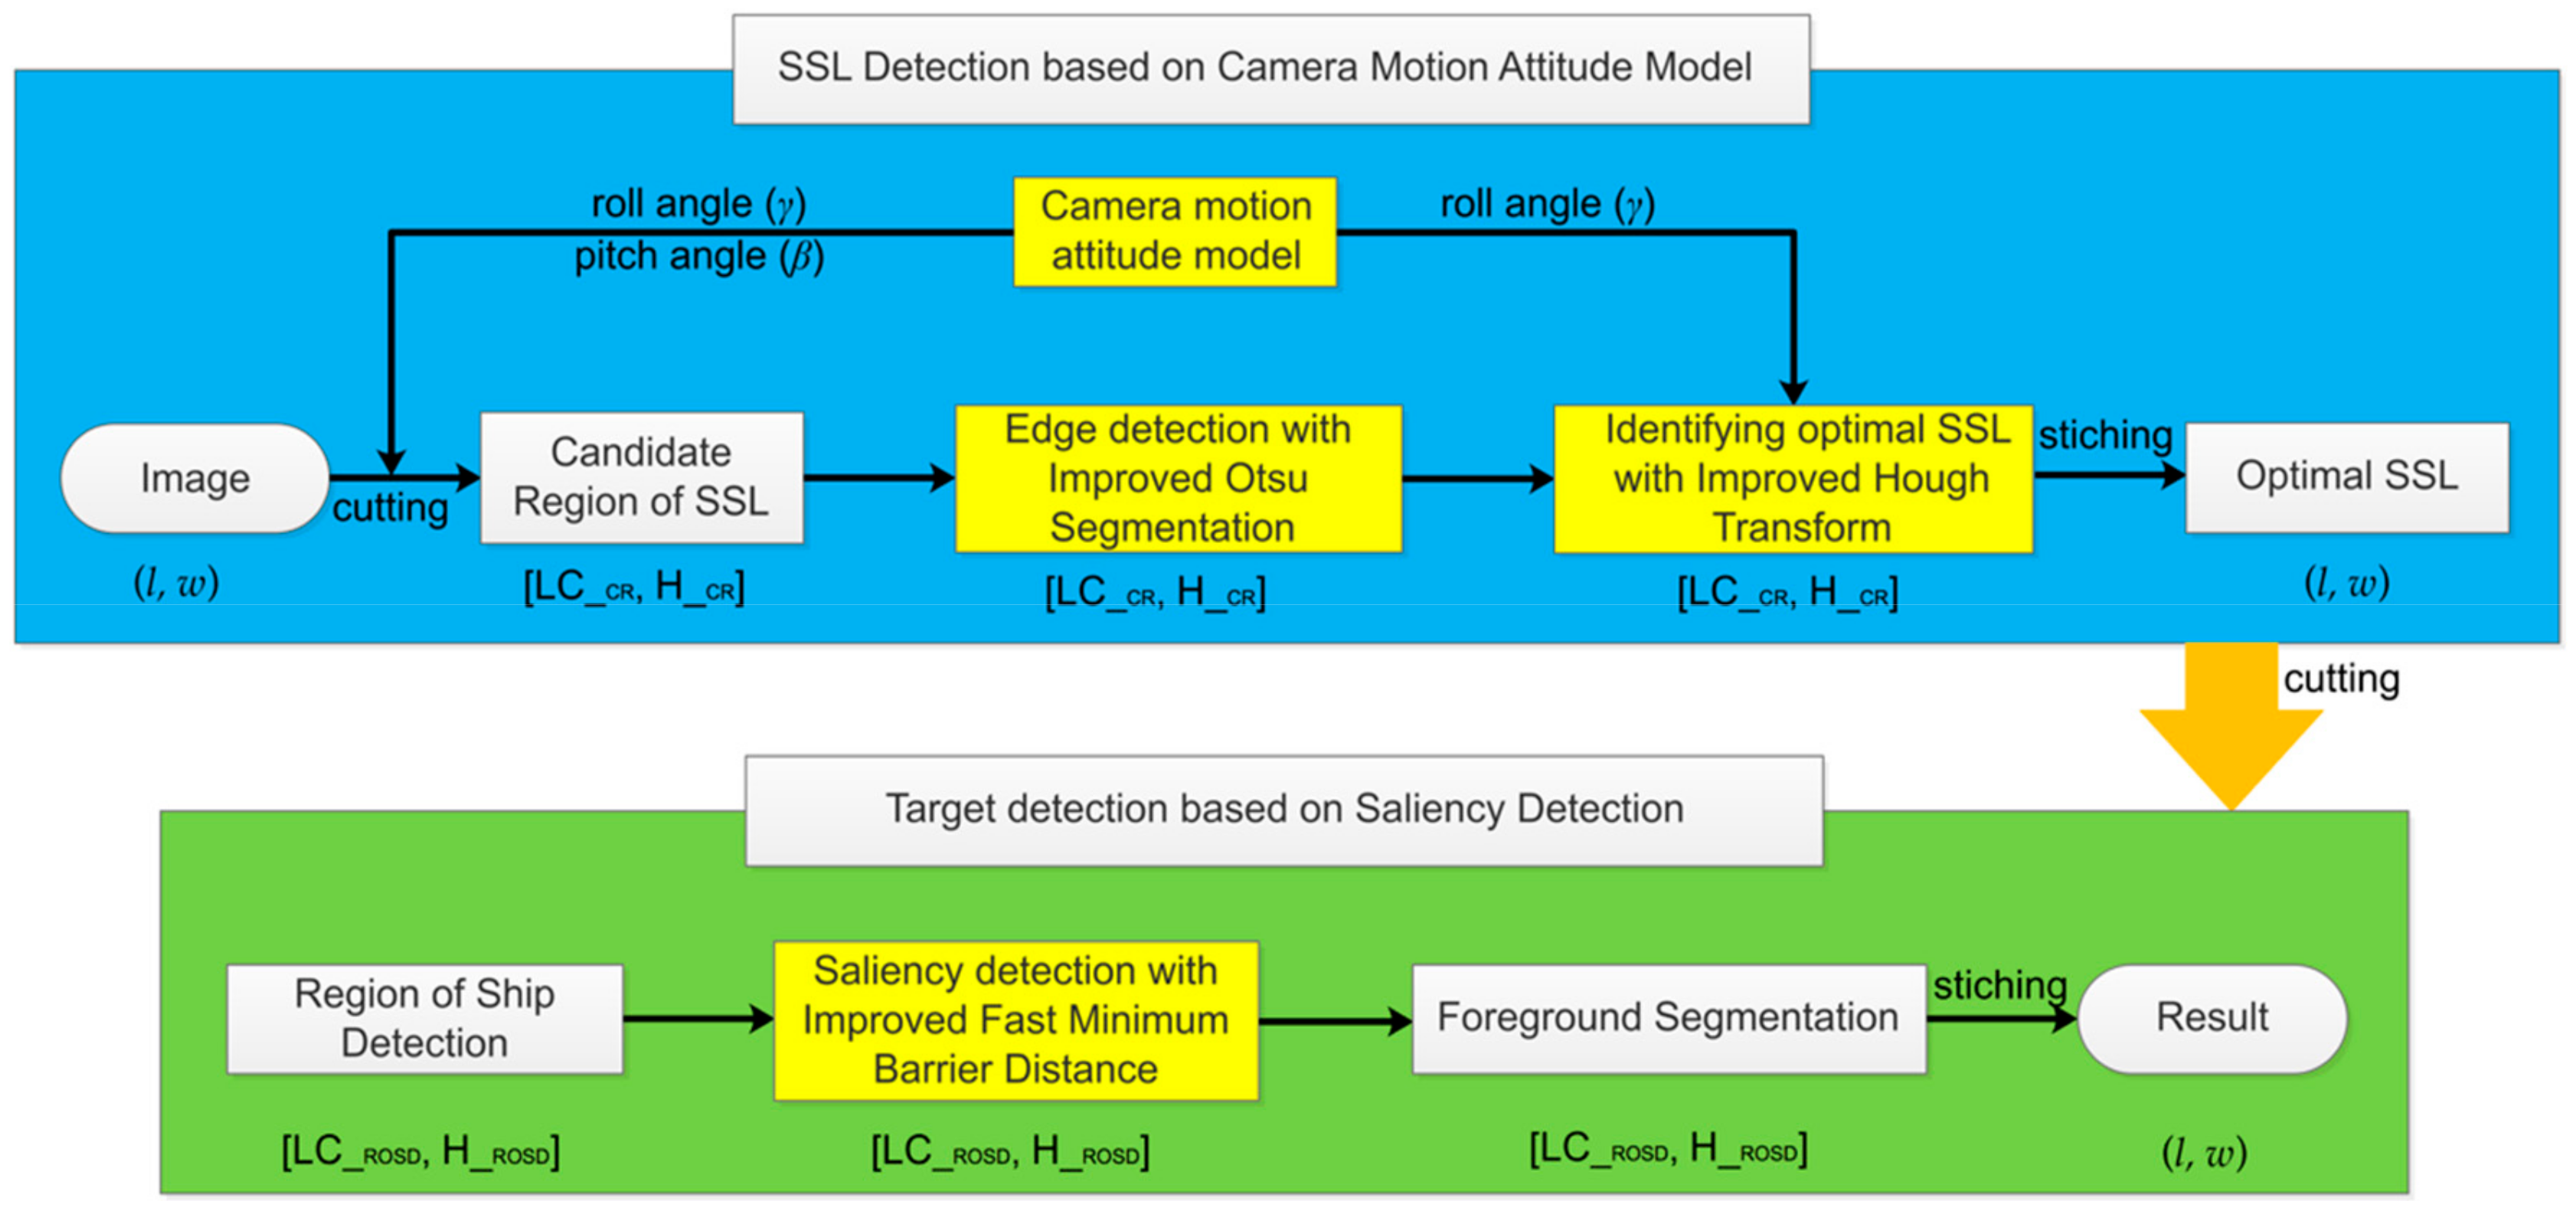
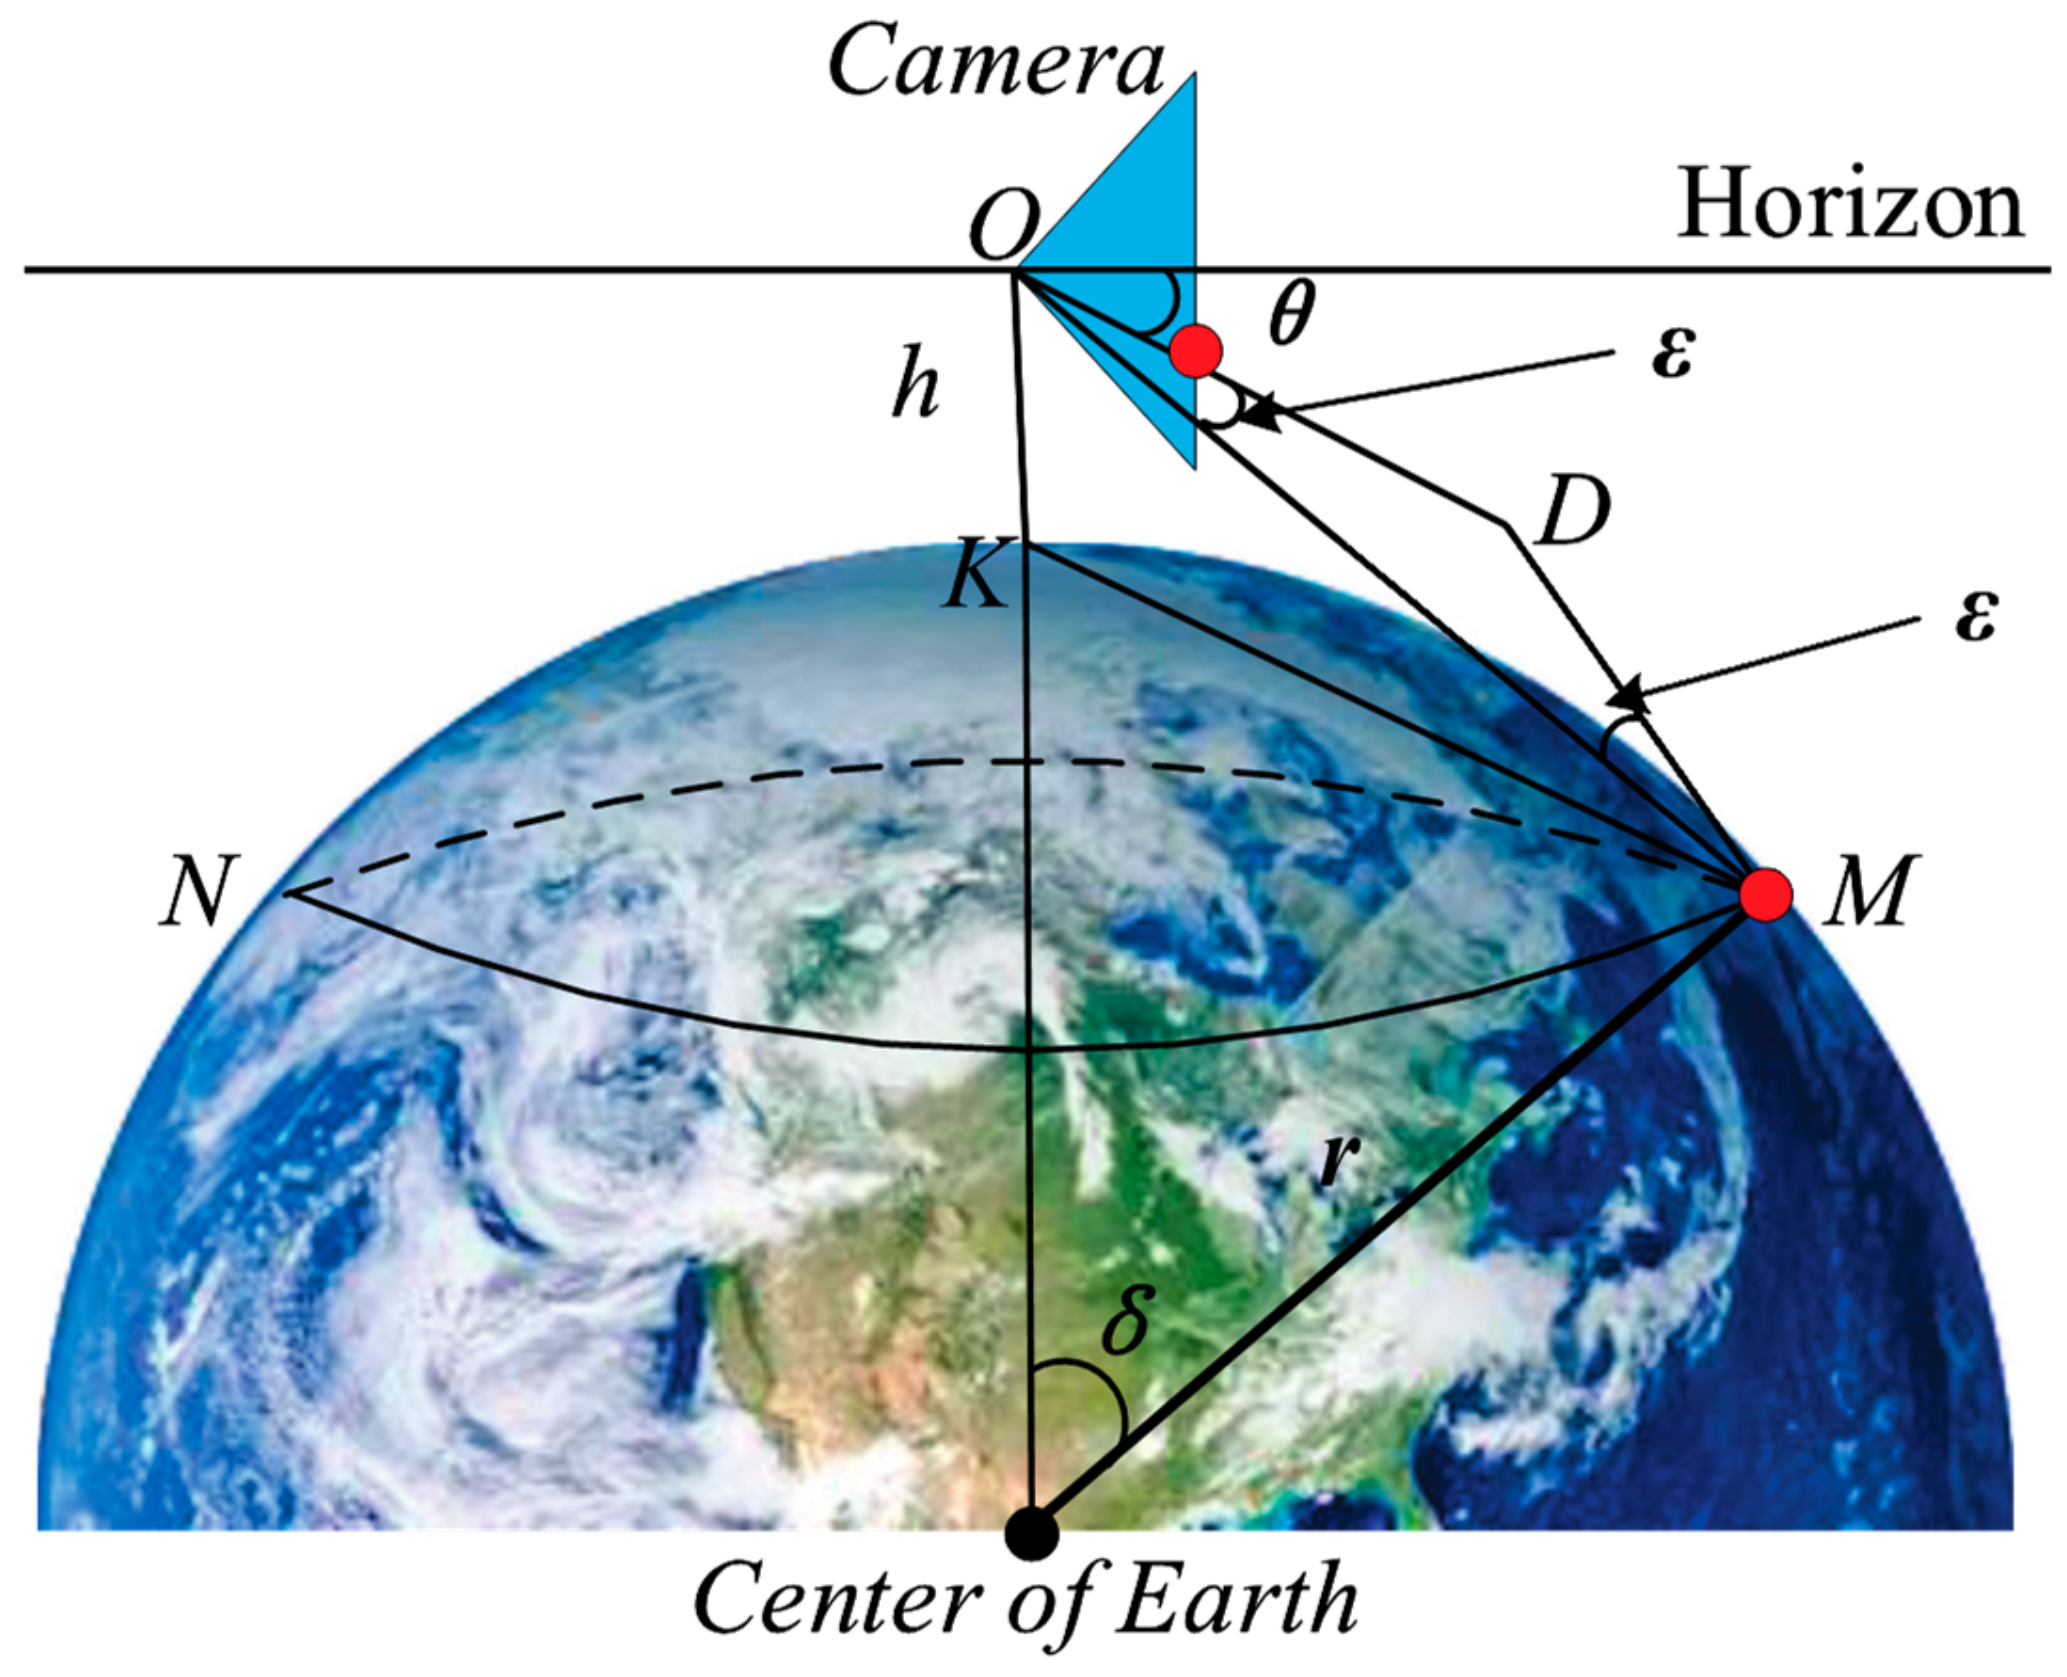
h sees that the farthest sea and the sky intersect into a circle, which is called the tester’s visible horizon, that is, the SSL. In ship vision, we use cameras instead of human eyes for sea target detection and identification. Assuming that the installation position of the camera is
h from the sea level, the geometric relationship can be obtained considering the curvature of the earth and the difference of atmosphere refraction, as shown in
Figure 2. The circle
MN represents the SSL and the blue triangle represents the camera. Before using it, we finished camera calibration and distortion correction [
32]. Therefore, in this analysis, we suppose the optical axis of the camera is parallel to the horizontal plane, which is called the initial state of the camera motion. The point
O is the camera center, the point
K is the projection of the point
O at the sea level,
r represents the radius of the earth,
represents the angle of the ball,
represents the difference of atmosphere refraction, the difference in the navigation is (1/13)
, and the straight line
OM represents the actual distance from camera to the SSL instead of
, which is expressed by
. In the triangle ∆OKM, since both
and
are small angles, we can approximate
and
, and
can be obtained by Equation (1). According to the 1 nautical mile representing 1852 meters in navigation, it can be inferred that the
r is 6366707 m. The position angle
of the SSL in the camera can be obtained by Equation (2).
In order to simplify the projection relationship of the camera, we assume the sea level as a plane, while ignoring the relative motion of the camera and the ship, so that the camera coordinate system coincides with the ship’s motion coordinate system. Next, we model the camera’s six-degrees-of-freedom motion and the SSL position according to the coordinate system projection method [
33].
3.1. Influence of Camera Swaying, Surging, and Yawing Motions on the Position of the SSL
Under the condition of maintaining the initial state, the height h of the camera remains unchanged when the camera only performs the swaying, surging, and yawing motions. It can be known from Equation (1) that is only related to h, so the camera swaying, surging, and yawing motions have no effect on the position of the SSL on the imaging plane.
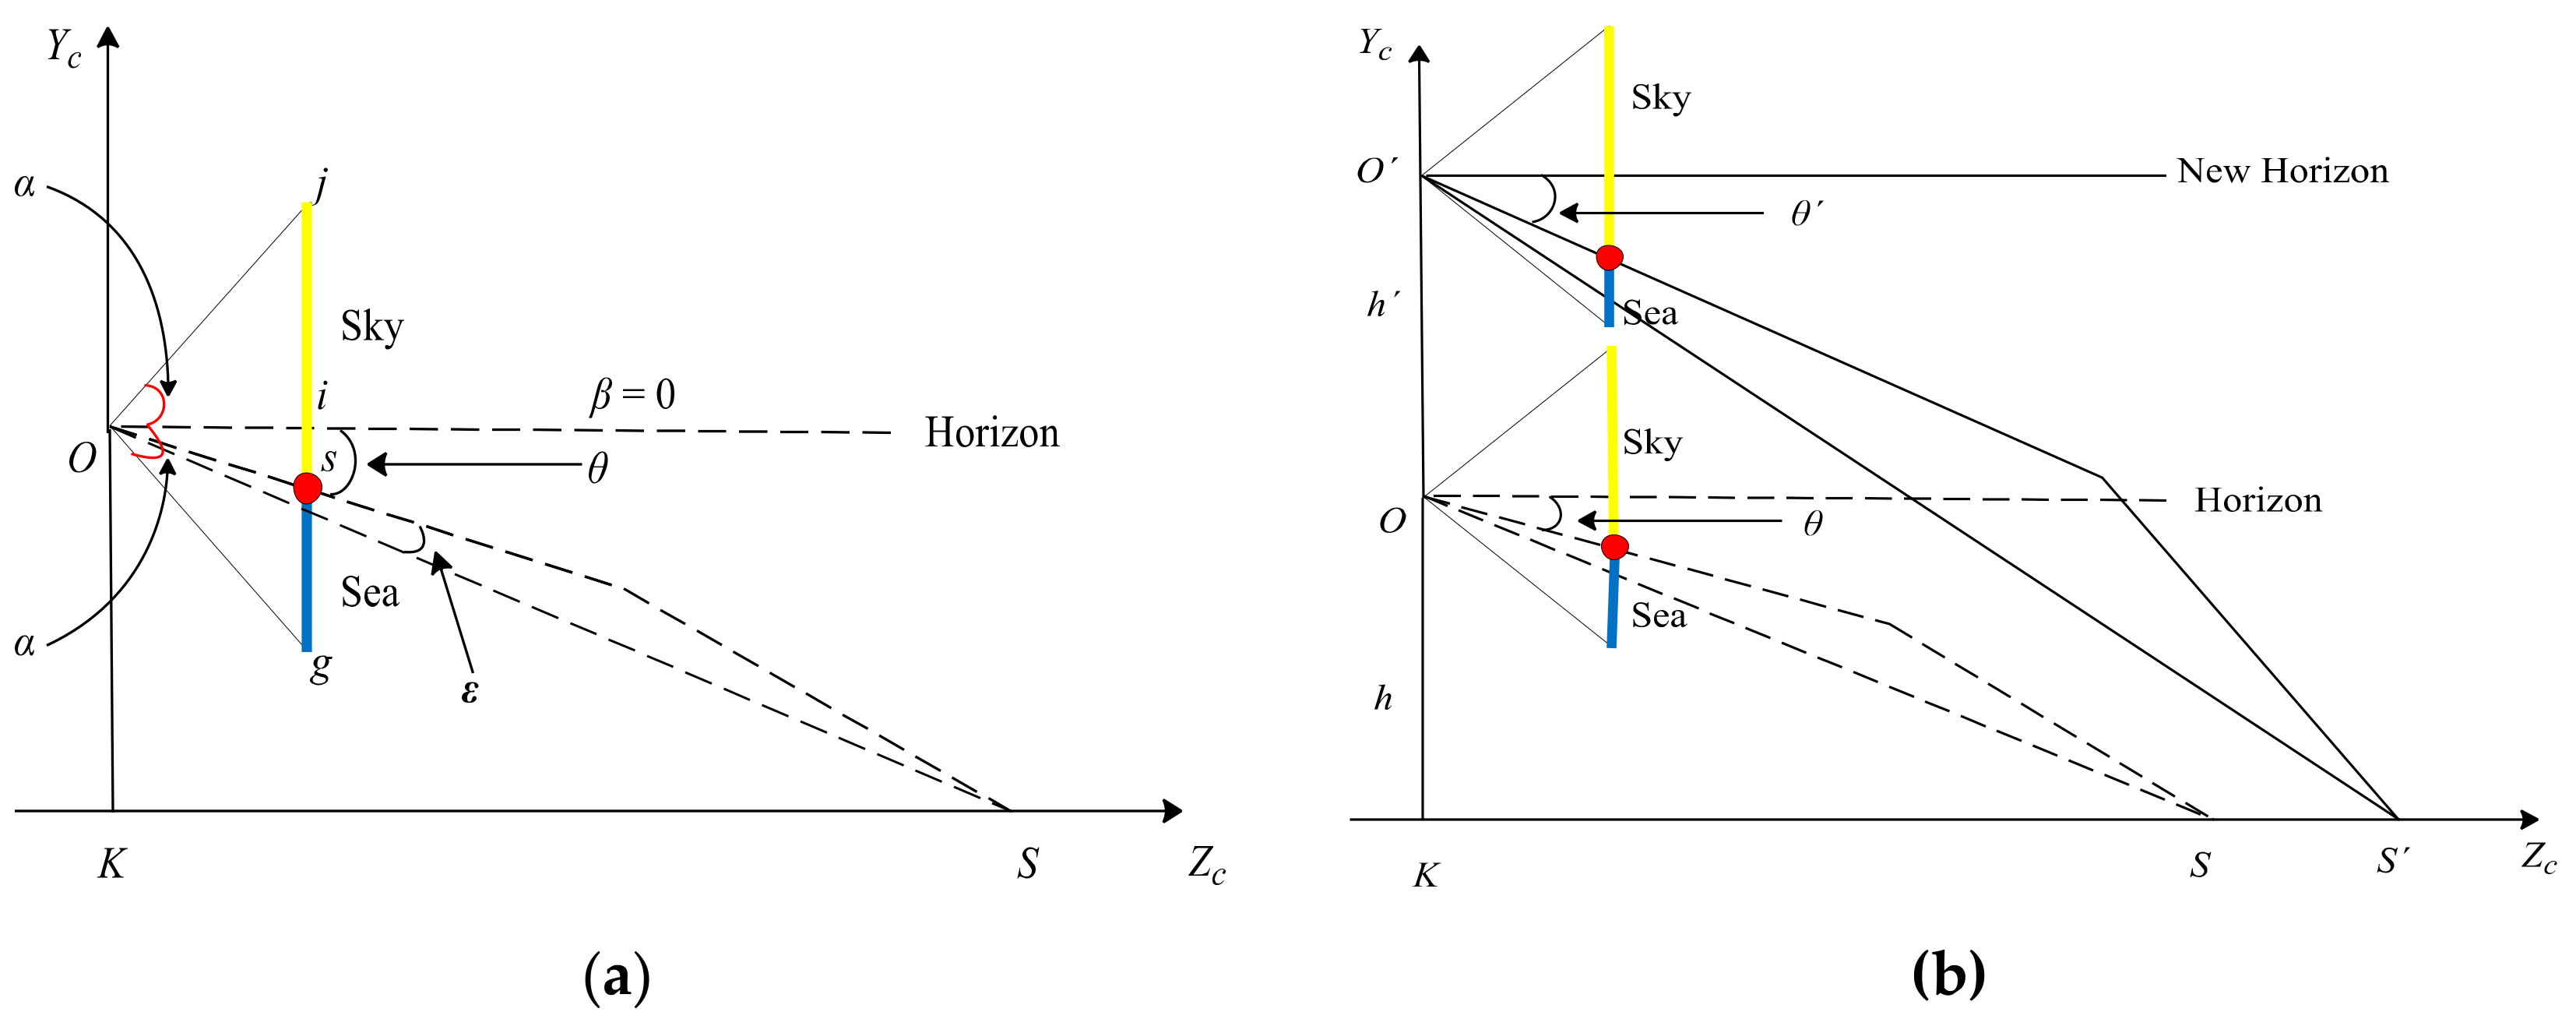
3.2. Influence of Camera Heaving and Pitching Motions on the Position of the SSL
Under the condition of maintaining the initial state, we assume the sea level as a plane according to
Figure 2, and obtain the geometric relationship as shown in
Figure 3a. The triangle represents the camera. In the imaging plane of the camera, the line
js represents the sky area, the line
sg represents the sea area, the point
s represents the projection point of the SSL, and the point
i represents the center point, which is also taken as the origin (0, 0) of the image coordinate system. Assuming that the pitch angle of the camera is represented by
, the camera’s vertical viewing angle is represented by 2
, the longitudinal width of the imaging plane of the camera is
w, and the position of the SSL in the image is represented by
, and
can be obtained by:
3.2.1. Influence of Camera Heaving Motion
Under the condition of maintaining the initial state, when the camera only performs the heaving motion, as shown in
Figure 3b, it is assumed that the heaving height is
, and the point
represents the new position of the camera center. According to Equation (1), the position angle
and the position
can be obtained by:
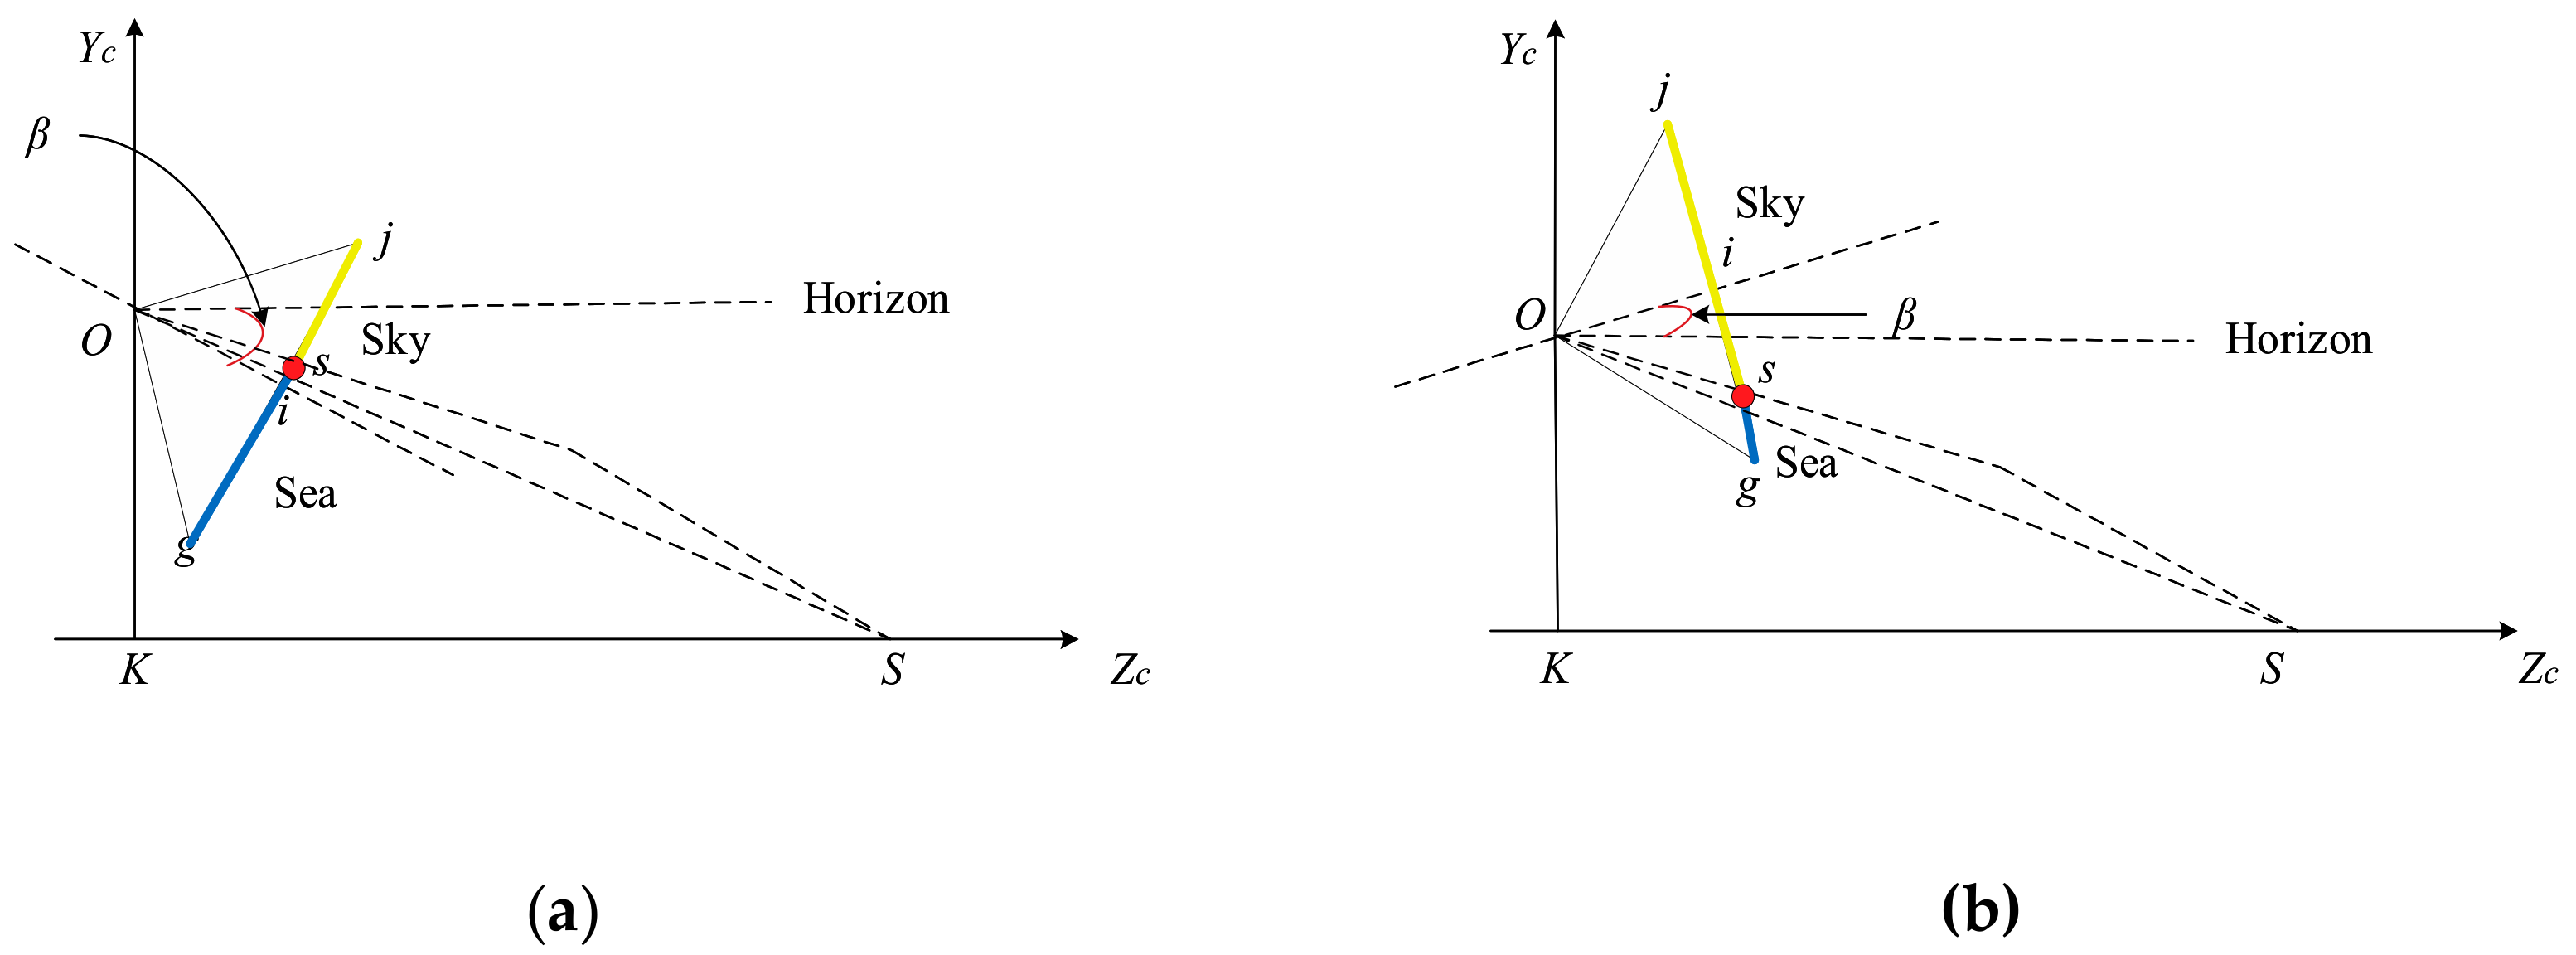
3.2.2. Influence of Camera Pitching Motion
Under the condition of maintaining the initial state, when the camera only performs the pitching motion, as shown in
Figure 4, it is assumed that the pitch angle
clockwise rotation is positive and the counterclockwise rotation is negative. Under
clockwise rotation, when
, the SSL is located at the lower part of the imaging plane center line and gradually approaches it as
increases. When
, the SSL is located at the center line of the imaging plane. When
, the SSL is located on the center line of the imaging plane. As the
increases, it gradually moves away from the center line and close to the top of the image. When
, the SSL is not in the imaging plane, and only the sea area can be seen in the image. Under
counterclockwise rotation, when
, the SSL is located at the lower part of the center line of the imaging plane, and as the
increases, it gradually moves away from the center line and close to the bottom of the image. When
, the SSL is not in the imaging plane, and only the sky area can be seen in the image. According to the above analysis, the position of the SSL after the pitching motion can be obtained by:
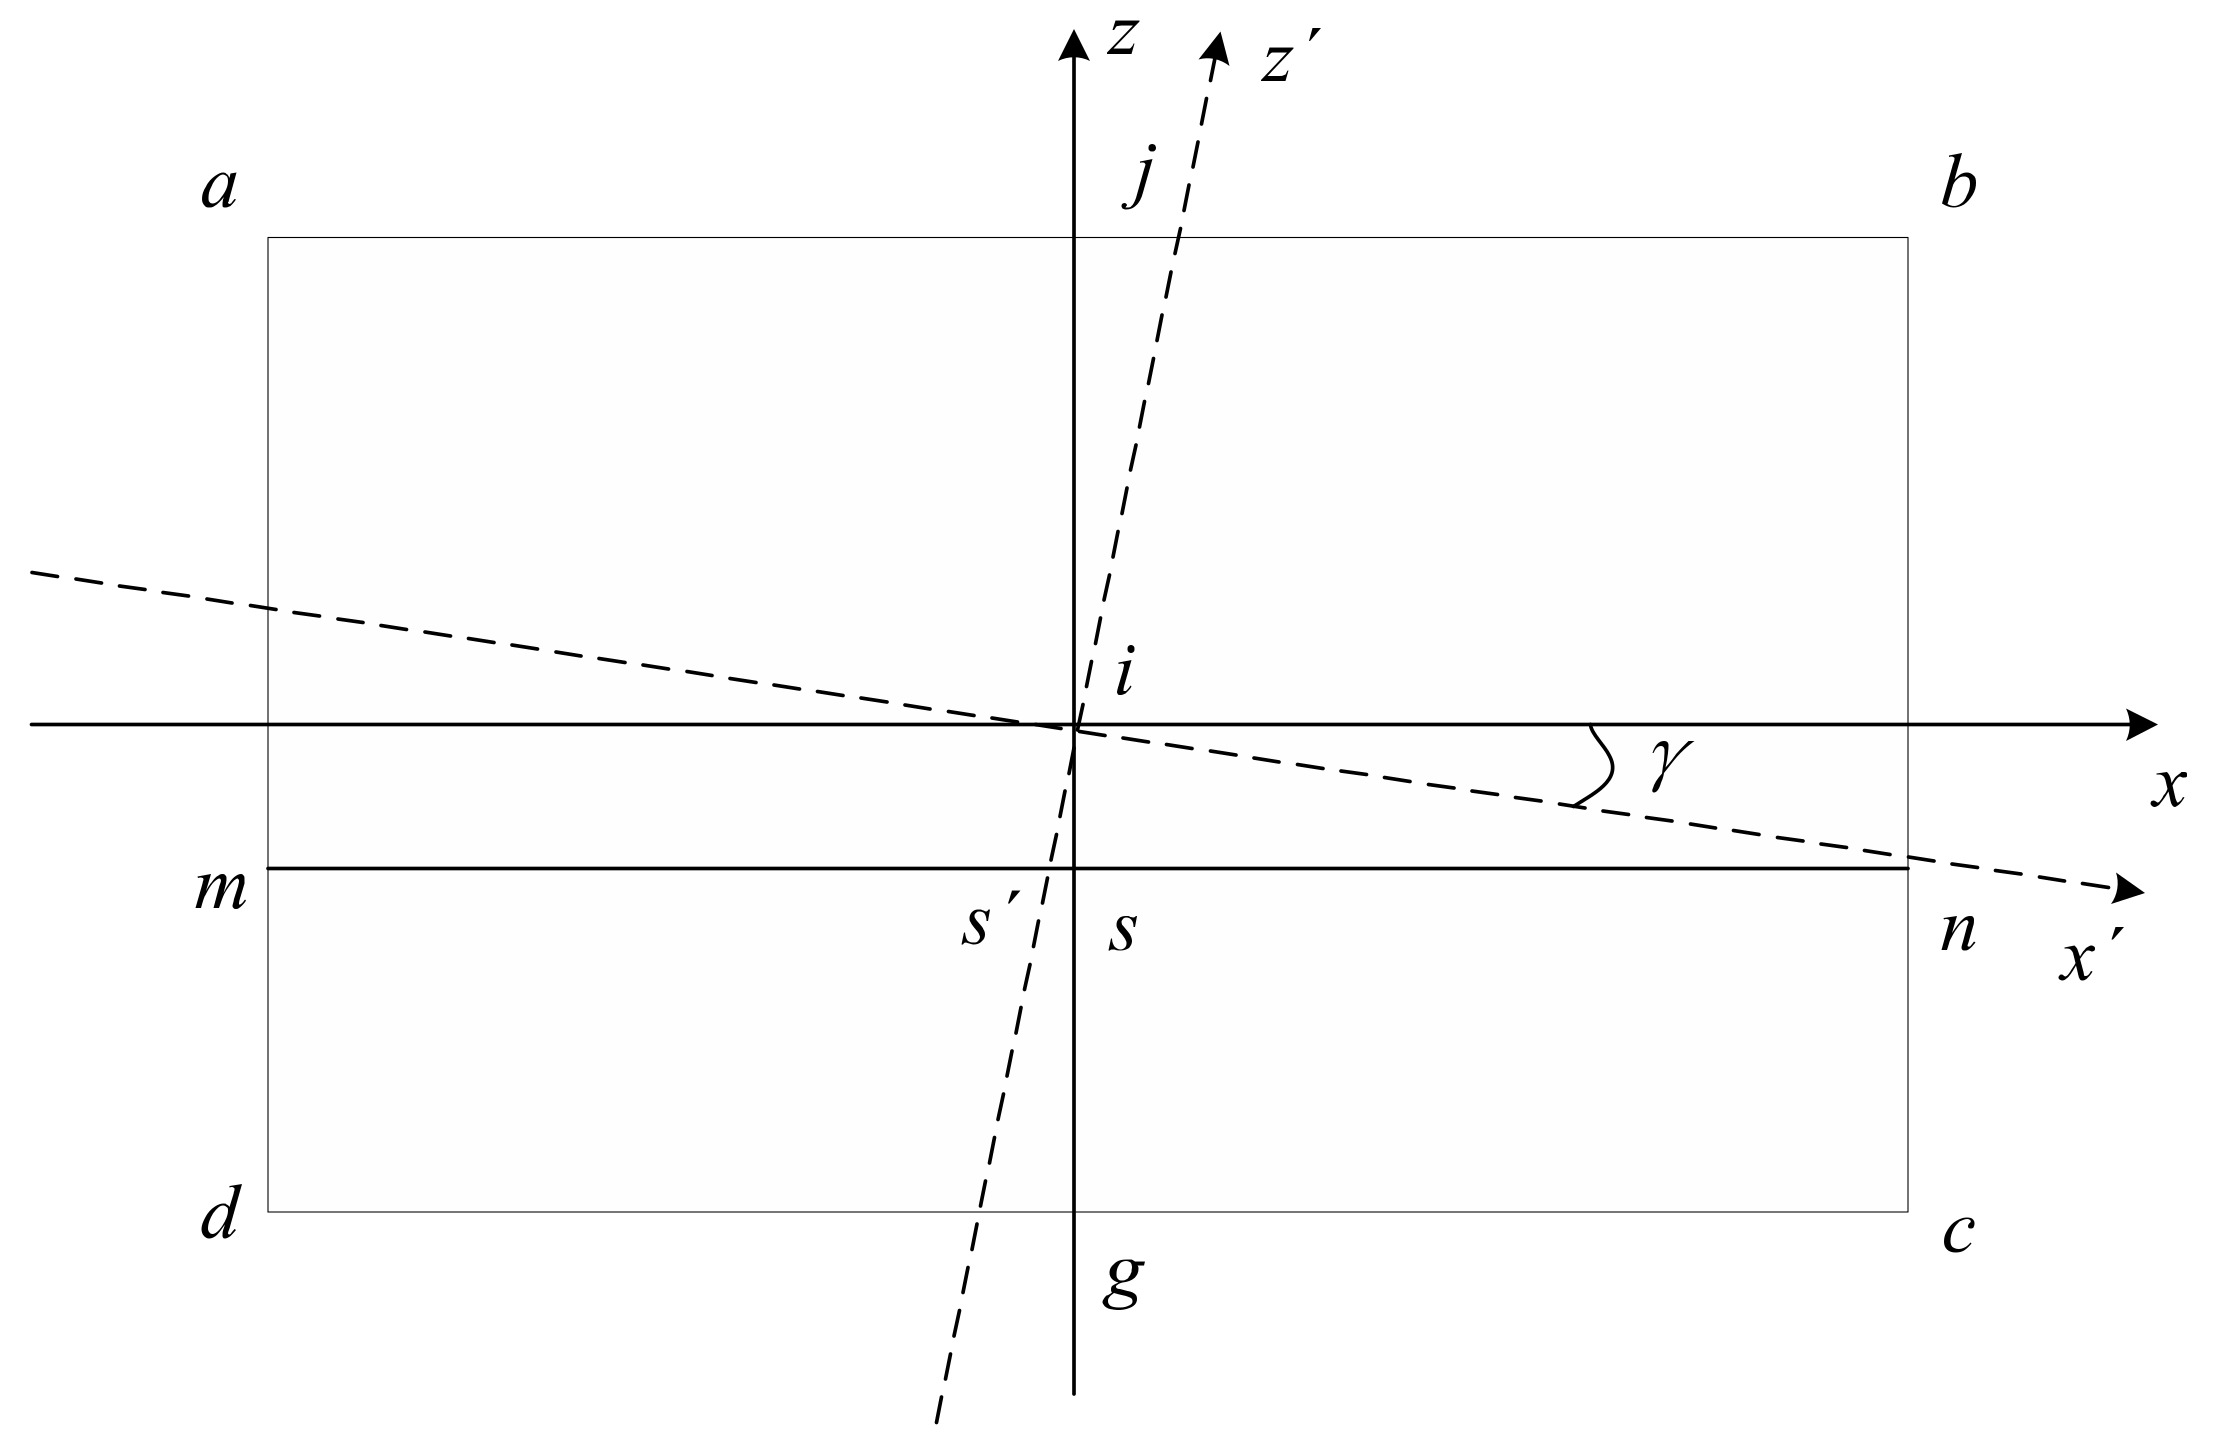
3.3. Influence of Camera Rolling Motion on the Position of the SSL
Under the condition of maintaining the initial state, when the camera only performs the rolling motion, as shown in
Figure 5, it is assumed that the rolling angle
is clockwise rotated (it is the same as
counterclockwise rotation),
is a new image coordinate system, and the SSL intersects the
axis at
. So, the SSL can be expressed by:
Comprehensive analysis of the relationship between the camera six-degrees-of-freedom motion and the SSL shows that when the camera performs the swaying, surging, and yawing motions, the SSL does not change in the image coordinate system. However, when the camera performs the heaving and pitching motions, the SSL performs a translational motion up and down in the image coordinate system, and when the ship performs the rolling motion, the SSL performs a rotational motion in the image coordinate system. Equations (1)–(7) can be used to obtain the estimation equation of the SSL in the image coordinate system, as shown in Equation (8), where the range of
is
. It can be seen from Equation (8) that the height change
generated by the camera’s heaving motion has less influence on the position of the SSL in the image, and it is also much smaller than the installation height of the camera; so, Equation (8) can be simplified to obtain the final SSL estimation equation, as shown in Equation (9).
5. Visual Saliency Detection in the ROSD of the SSL
After obtaining the optimal SSL, we add 30 pixels to the rectangle where the optimal SSL is located, cut it, and define it as the ROSD. In the ROSD, the influence of clouds and sea clutter is small. The long-distance ship is mainly near the SSL, and the sea–sky background is relatively uniform and connected with the boundary part of the area. According to the characteristics of the ROSD, we use the fast minimum barrier distance (FMBD) [
35] to measure the connectivity of the pixel and the region boundary. The algorithm operates directly on the original pixel, and does not have to acquire the superpixel of the image through the region abstraction [
36,
37,
38,
39], which improves the detection performance of the saliency map.
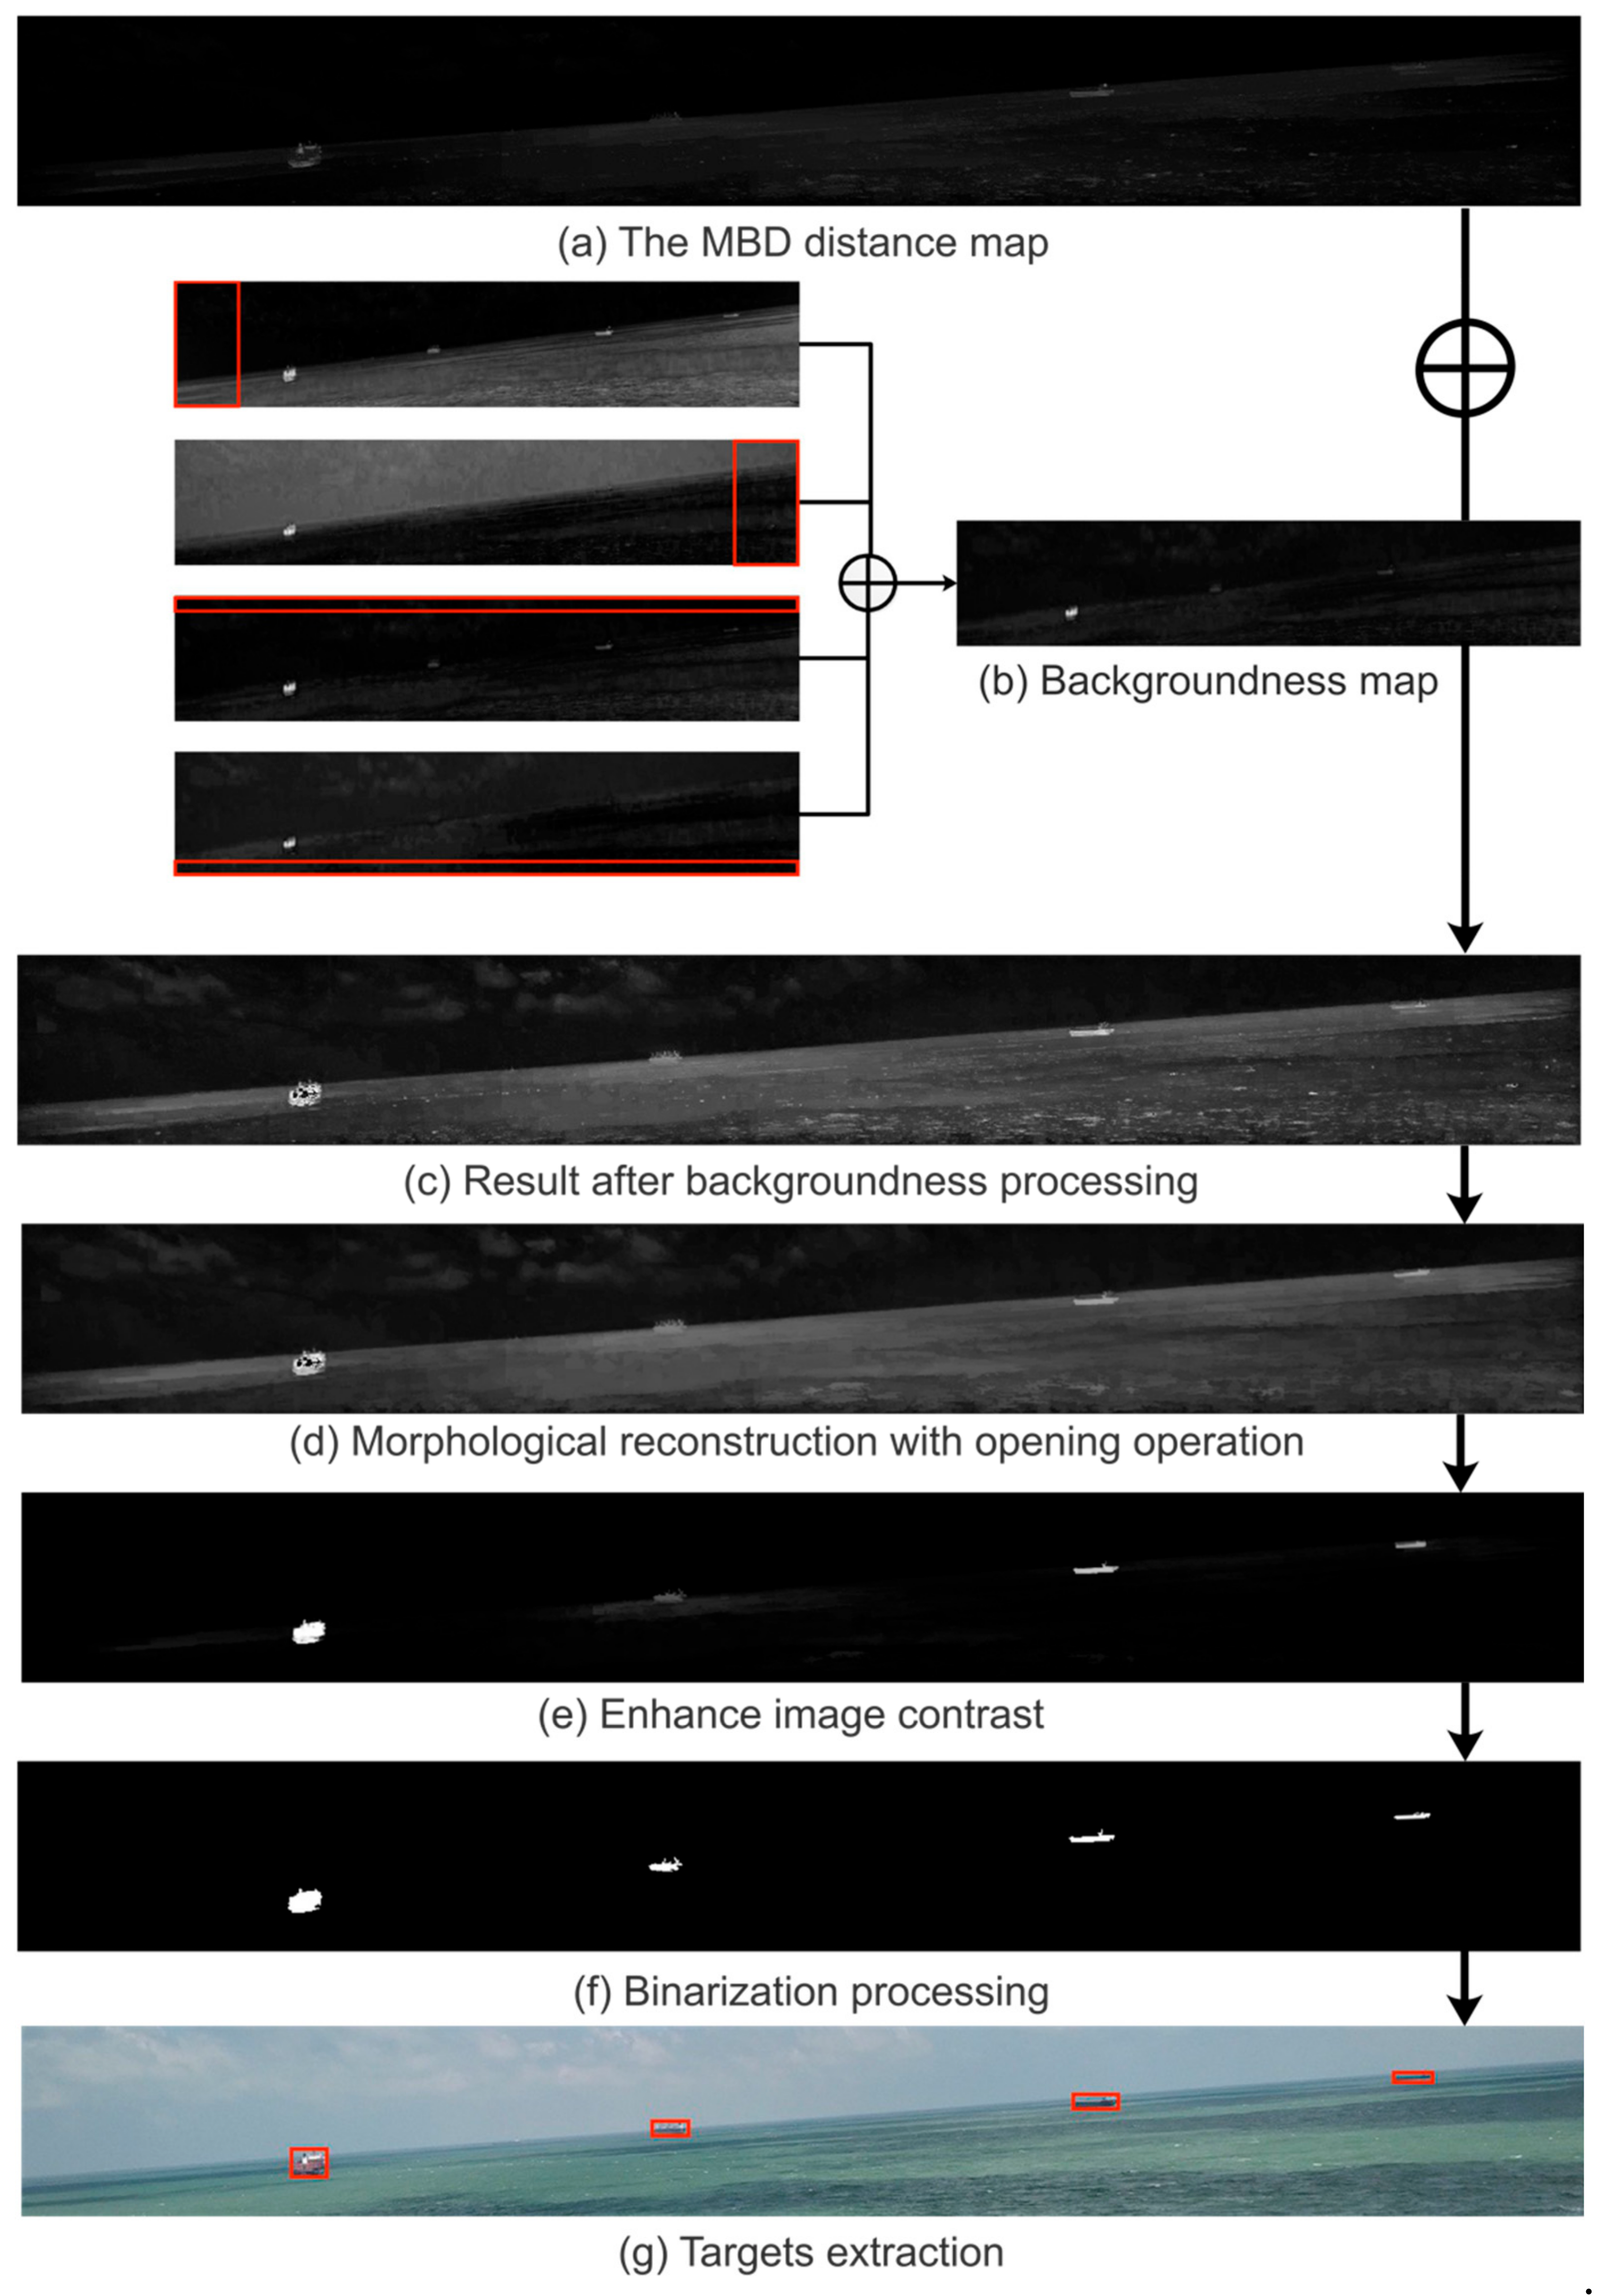
The FMBD algorithm mainly consists of three steps, namely, obtaining the minimum barrier distance (MBD) distance map, backgroundness, and post-processing. We used the same approach as FMBD in the first two steps, but we made appropriate improvements in the post-processing step. The specific algorithm is as follows:
Firstly, we convert the color space of the ROSD from RGB to Lab to better simulate the human visual perception. In each channel, we select a pixel-wide row and column as the seed set
S in the upper, lower, left, and right boundaries of the ROSD region. Then, the FMBD algorithm is used to calculate the path cost function of each pixel in the ROSD region to the set
S, as shown in Equation (16), where
represents any pixel other than the boundary in the image, and
represents the path of the pixel to the set
S. In this paper, we consider four paths adjacent to each pixel point;
represents the pixel value of a point, and the cost function
represents the distance between the highest pixel value and the lowest pixel value on a path.
We scan the ROSD area three times, which are raster scan, inverse raster scan, and raster scan. In each scan, half of the four neighborhoods of each pixel are used; that is, the upper neighborhood and the left neighborhood pixel. The path minimization operation is shown in Equation (17), where
represents the path currently assigned to pixel
,
represents the edge from pixel
to pixel
,
represents the path of
, and the direction is from
to
. Assuming
, you can get Equation (18), where
and
are the maximum and minimum values on the path, respectively.
In summary, when a pixel appears in the region of the salient target, its pixel value should be close to the maximum pixel value on each path, and the cost function here is relatively large. When a pixel appears in the background area, its pixel value should be close to the minimum pixel value on each path, and the cost function here is relatively small. Thereby, the highlighting area can be realized, the background area can be darkened, and the target saliency detection can be completed.
Secondly, after obtaining the FMBD distance maps accumulated in the three-color spaces, we apply the backgroundness cue of the ROSD region to enhance the brightness of the saliency map. In the ROSD, the boundary of the image is the sea–sky background. According to this feature, first, we select 10% of the area in the upper, lower, left, and right directions of the ROSD as the boundary part, and then calculate the Mahalanobis Distance of the color mean between all the pixels and the four boundary areas. Finally, the maximum value of the boundary information is subtracted from the sum of the boundary information obtained from the four regions to obtain a boundary comparison map. Therefore, we can exclude the case where a region may contain a foreground region, as shown in Equation (19), where
and
represent the color mean and covariance of each boundary part, respectively.
Finally, in the post-processing section, the three processing techniques of the original article do not adapt to ship detection near the SSL, so we make appropriate improvements. For the first processing, we replace the previous morphological filtering with morphological reconstruction with opening operation. The specific operation is that we use the structural element
b to erode the saliency map (the saliency map is represented by
) n times to obtain the erosion map
, then use
b to dilate
. Next, we take the minimum value of the dilation map and the original map
, and iterate the process until
no longer changes. The results of our processing can be obtained by Equation (20), where
and
represent the dilation and erosion operations in morphology, respectively. For the second processing, the original processing utilizes the image enhancement technique in the middle of the image, but it is easy to ignore the small targets around, so this paper directly removes this technology. The third processing is consistent with the original article; the sigmoid function is used to increase the contrast between the target and the background region, as shown in Equation (21), where parameter
a is used to control the contrast level of the target and the background.
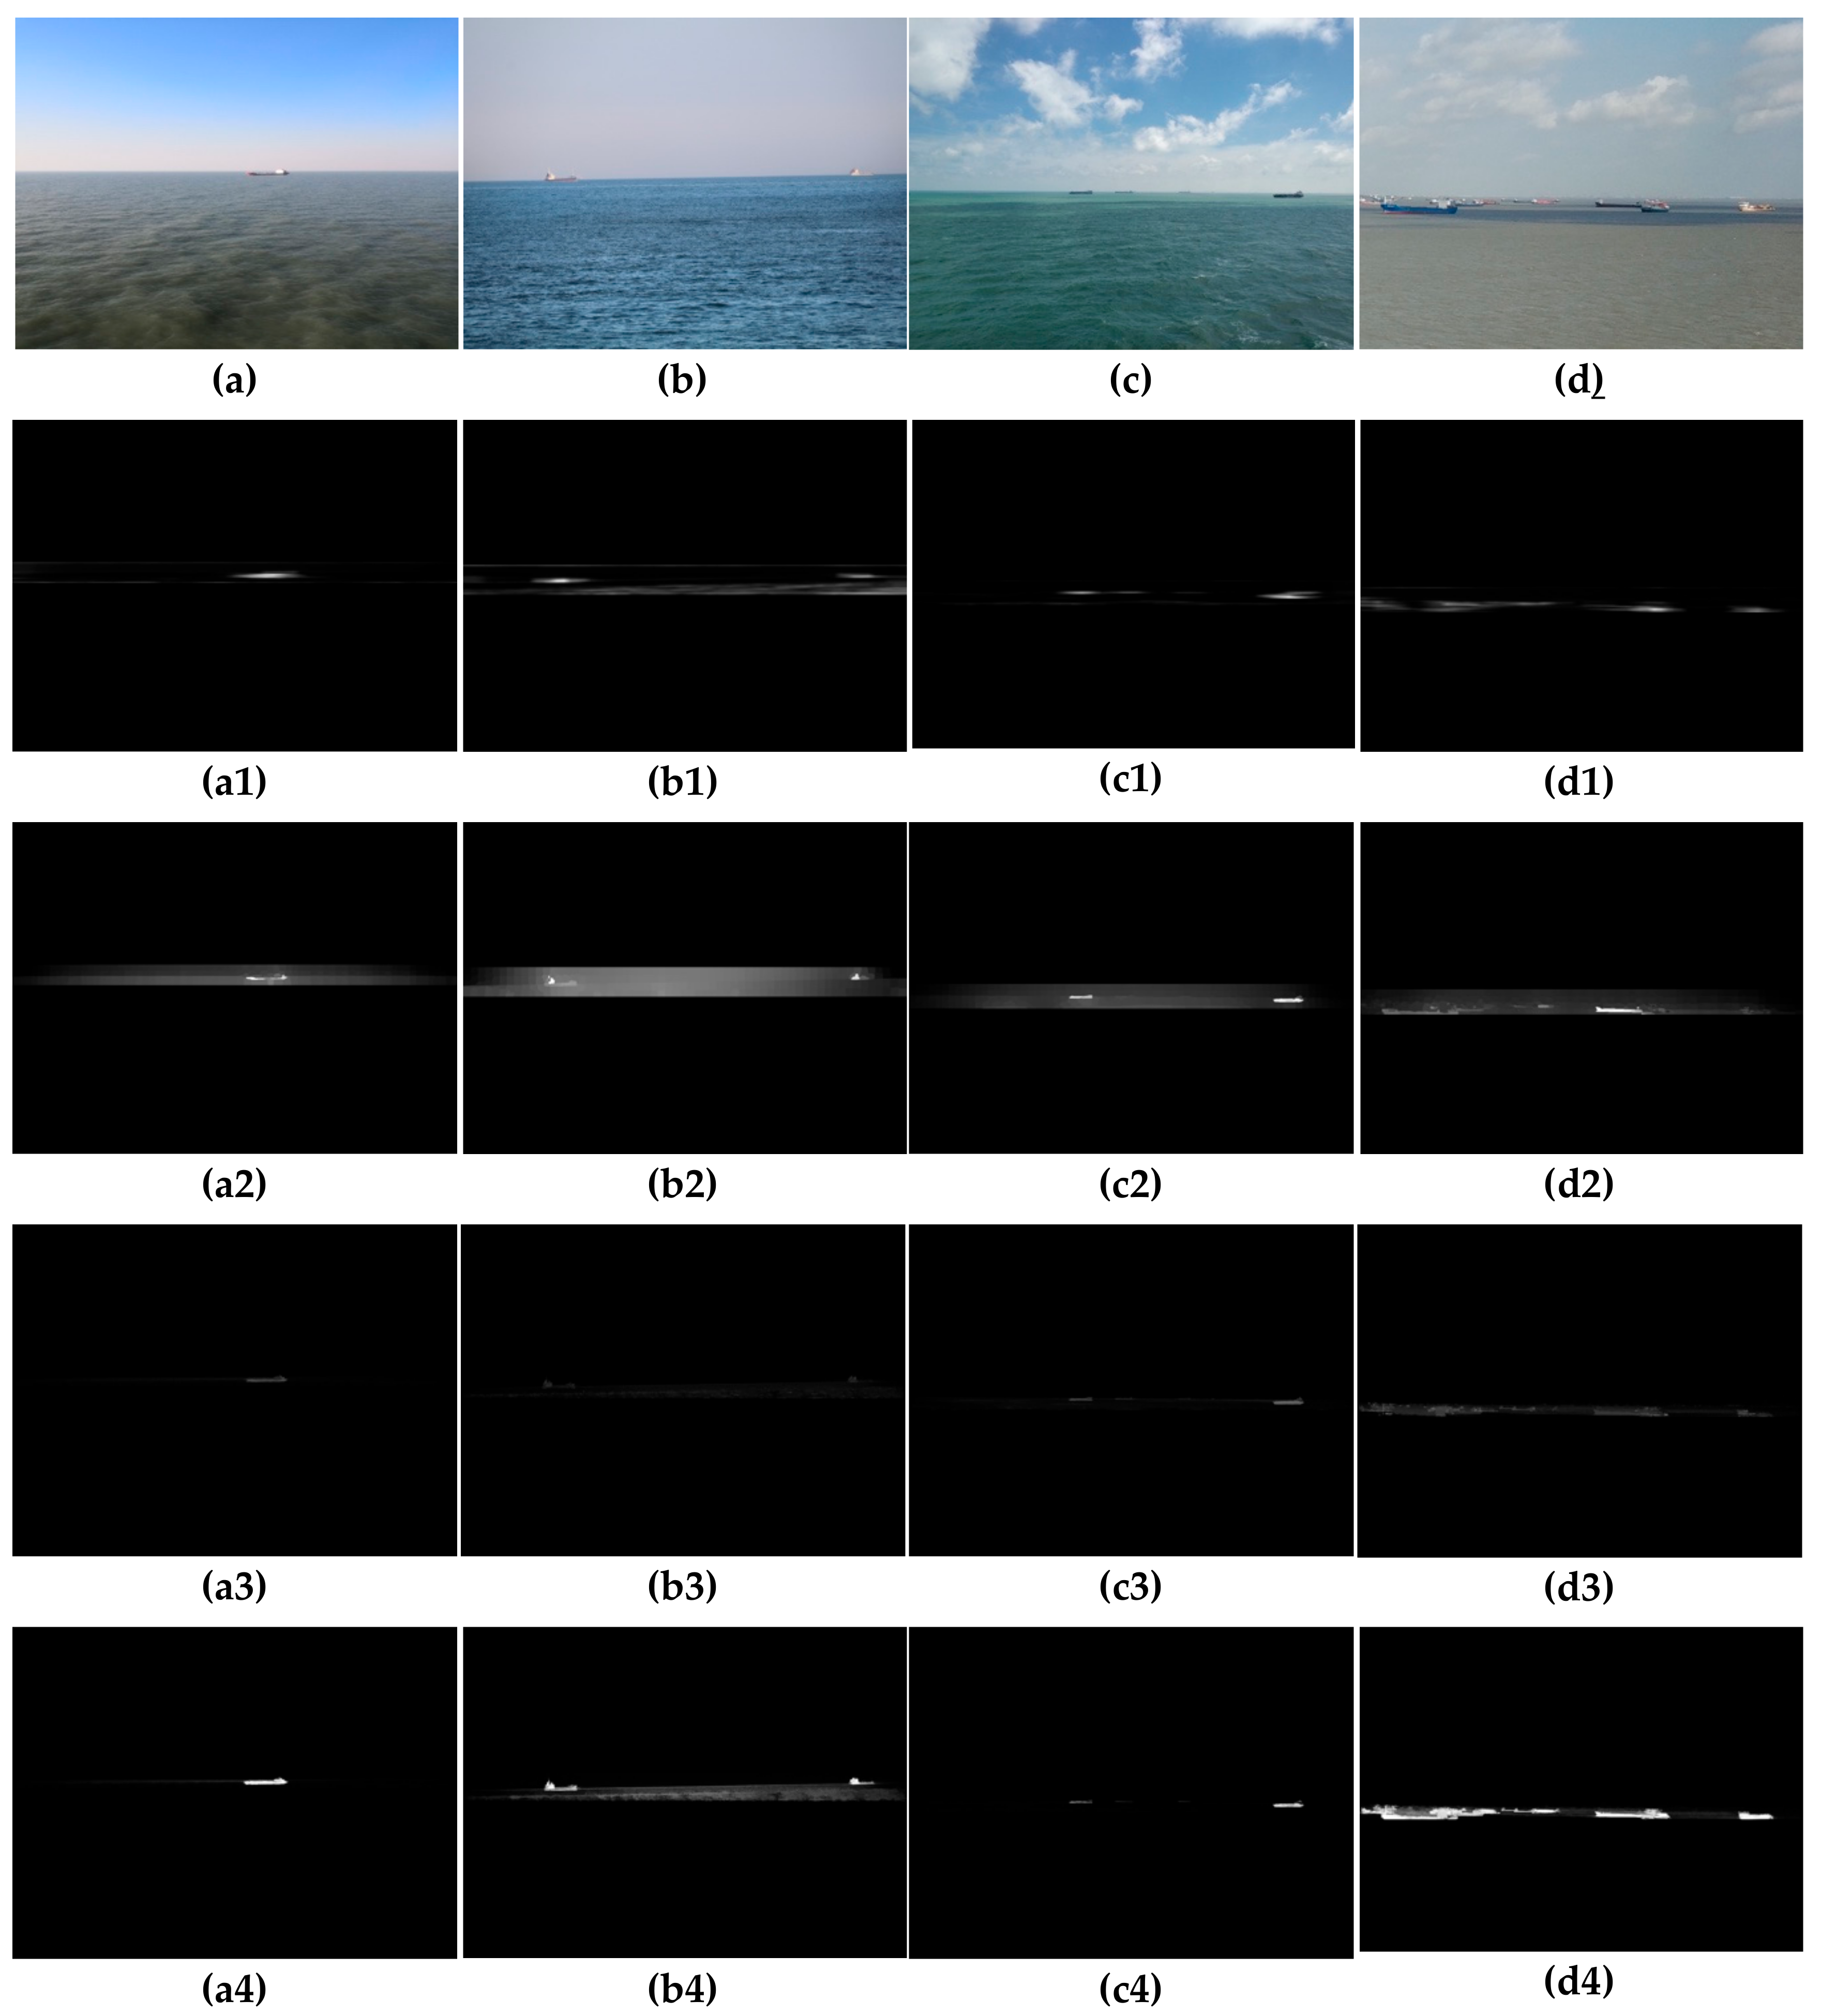
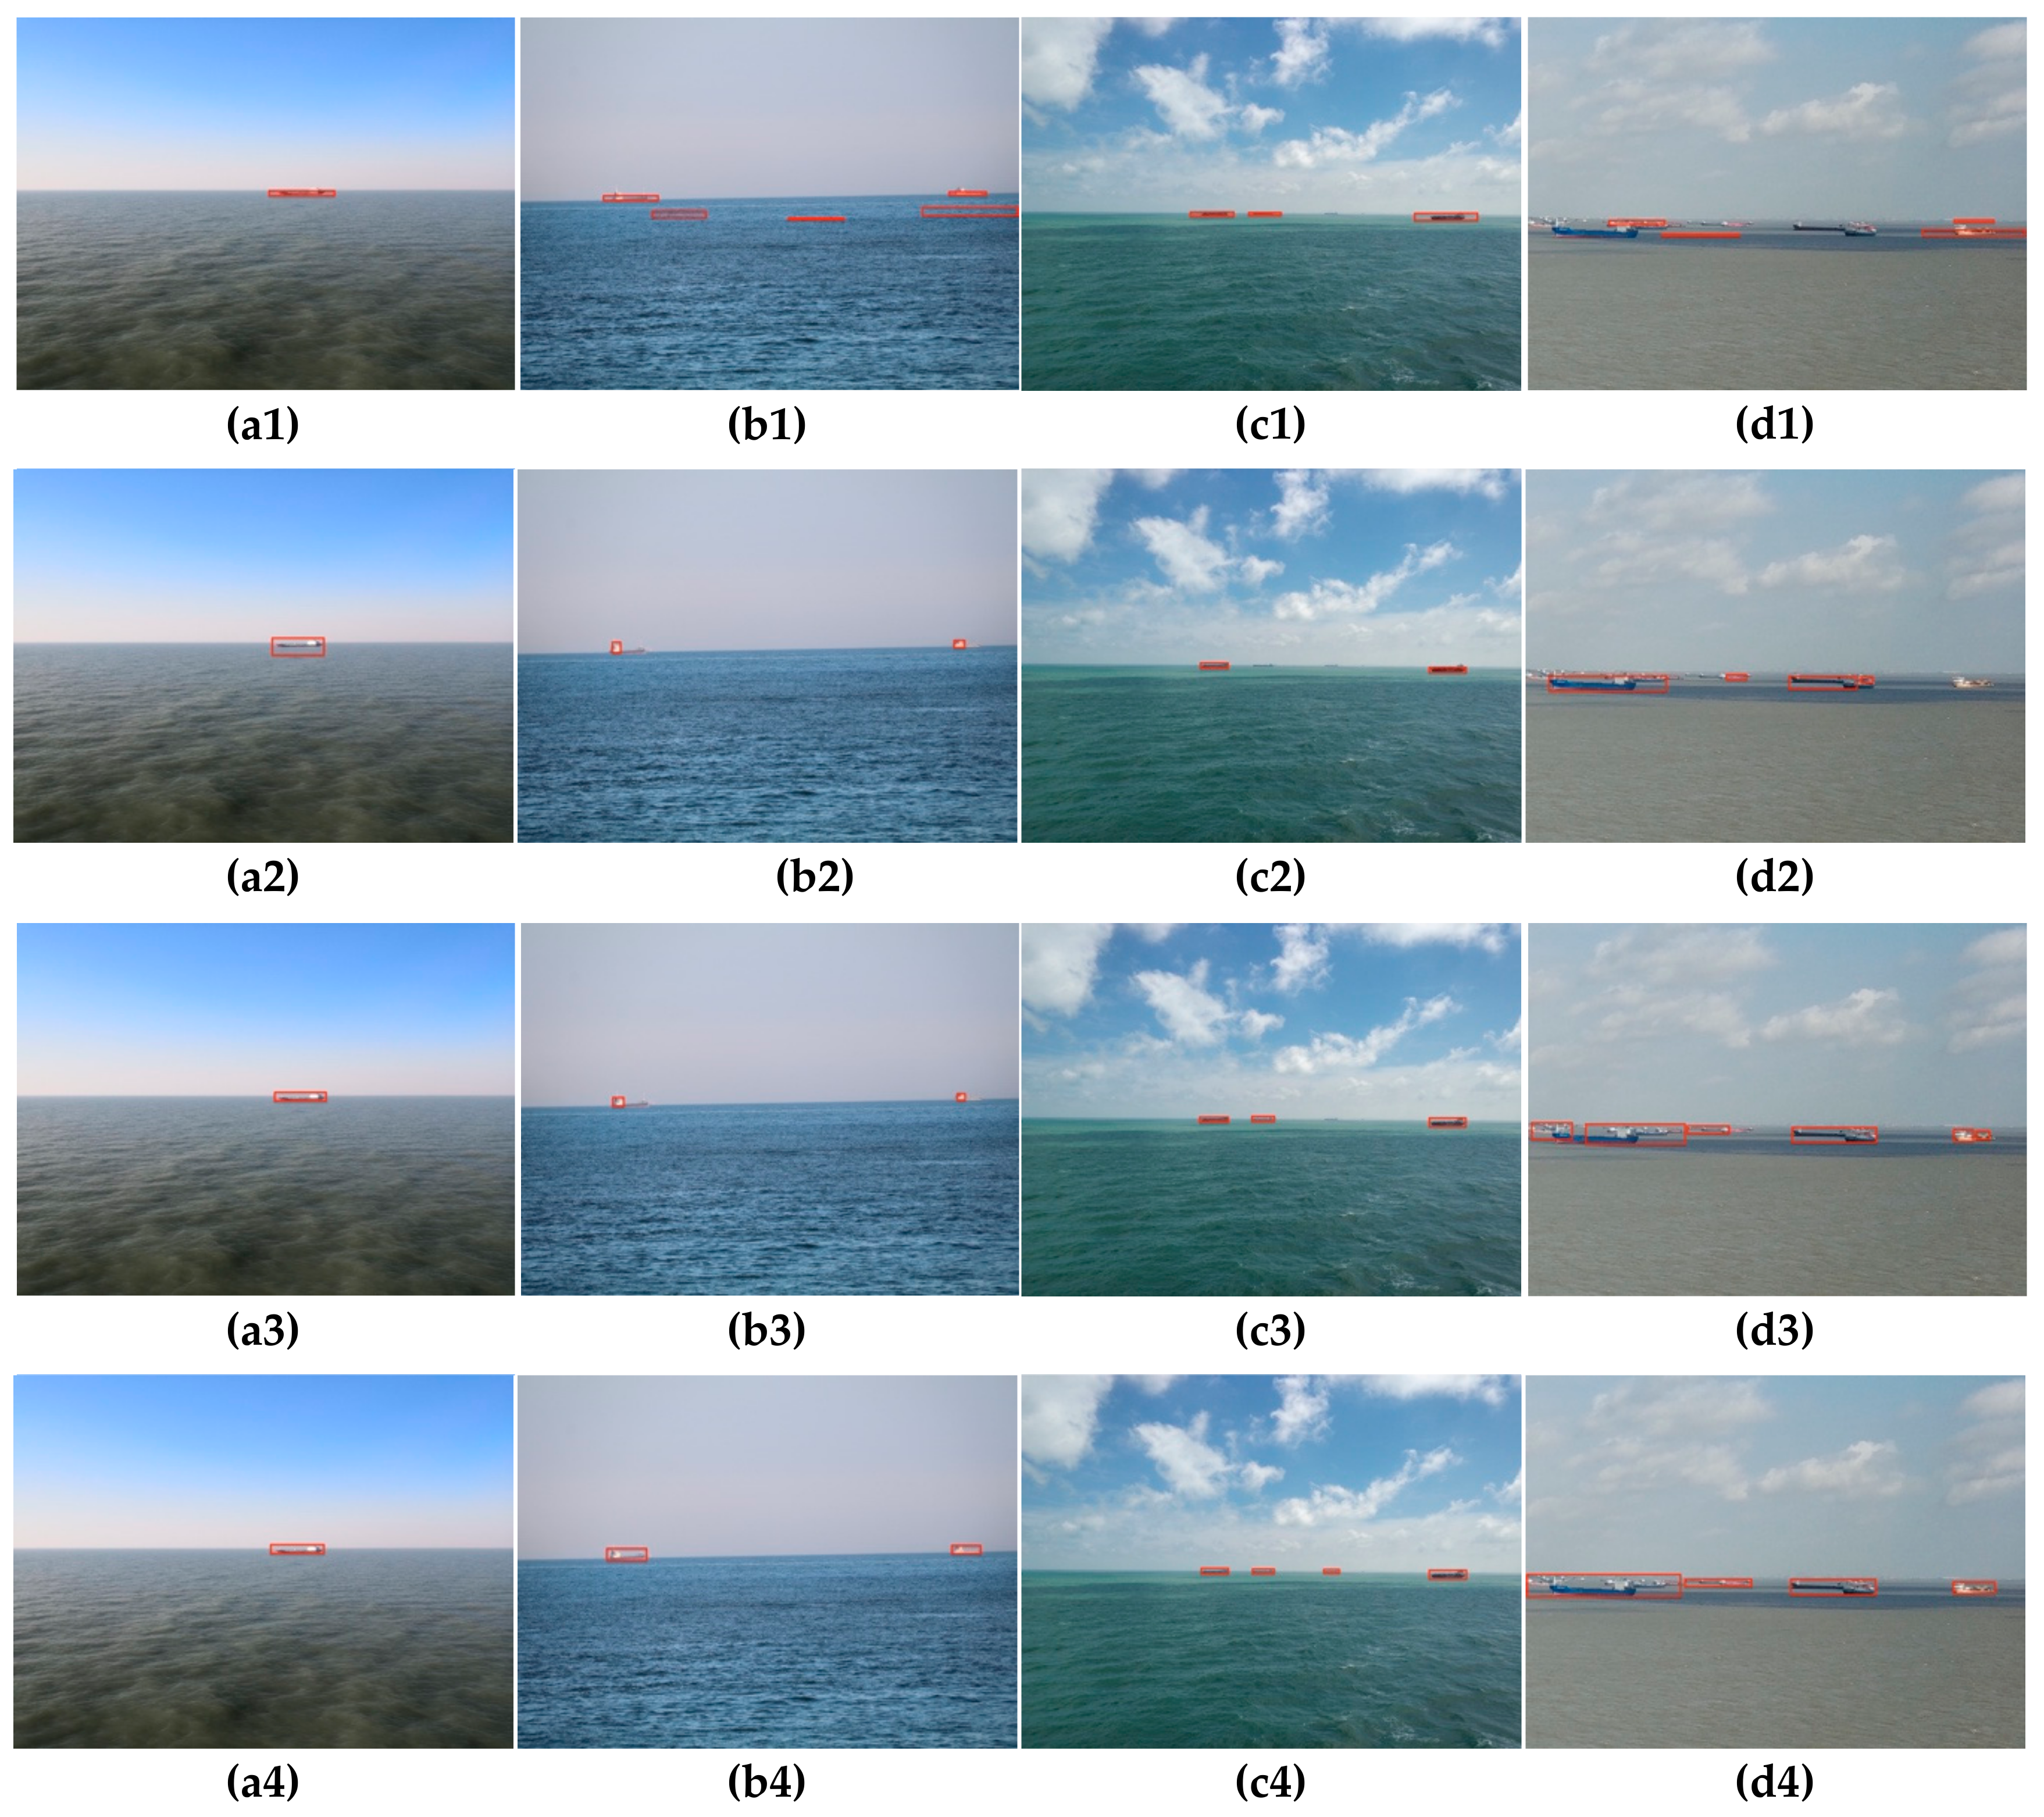
The saliency feature map obtained by the proposed algorithm has the following characteristics: The target part is highlighted, the background part is darkened, and the contrast is obvious. We select the appropriate threshold to test the saliency map, and use the area threshold to extract the final l target ship, eliminating trivial small area interference. The processing of target detection is shown in
Figure 9.
7. Conclusions
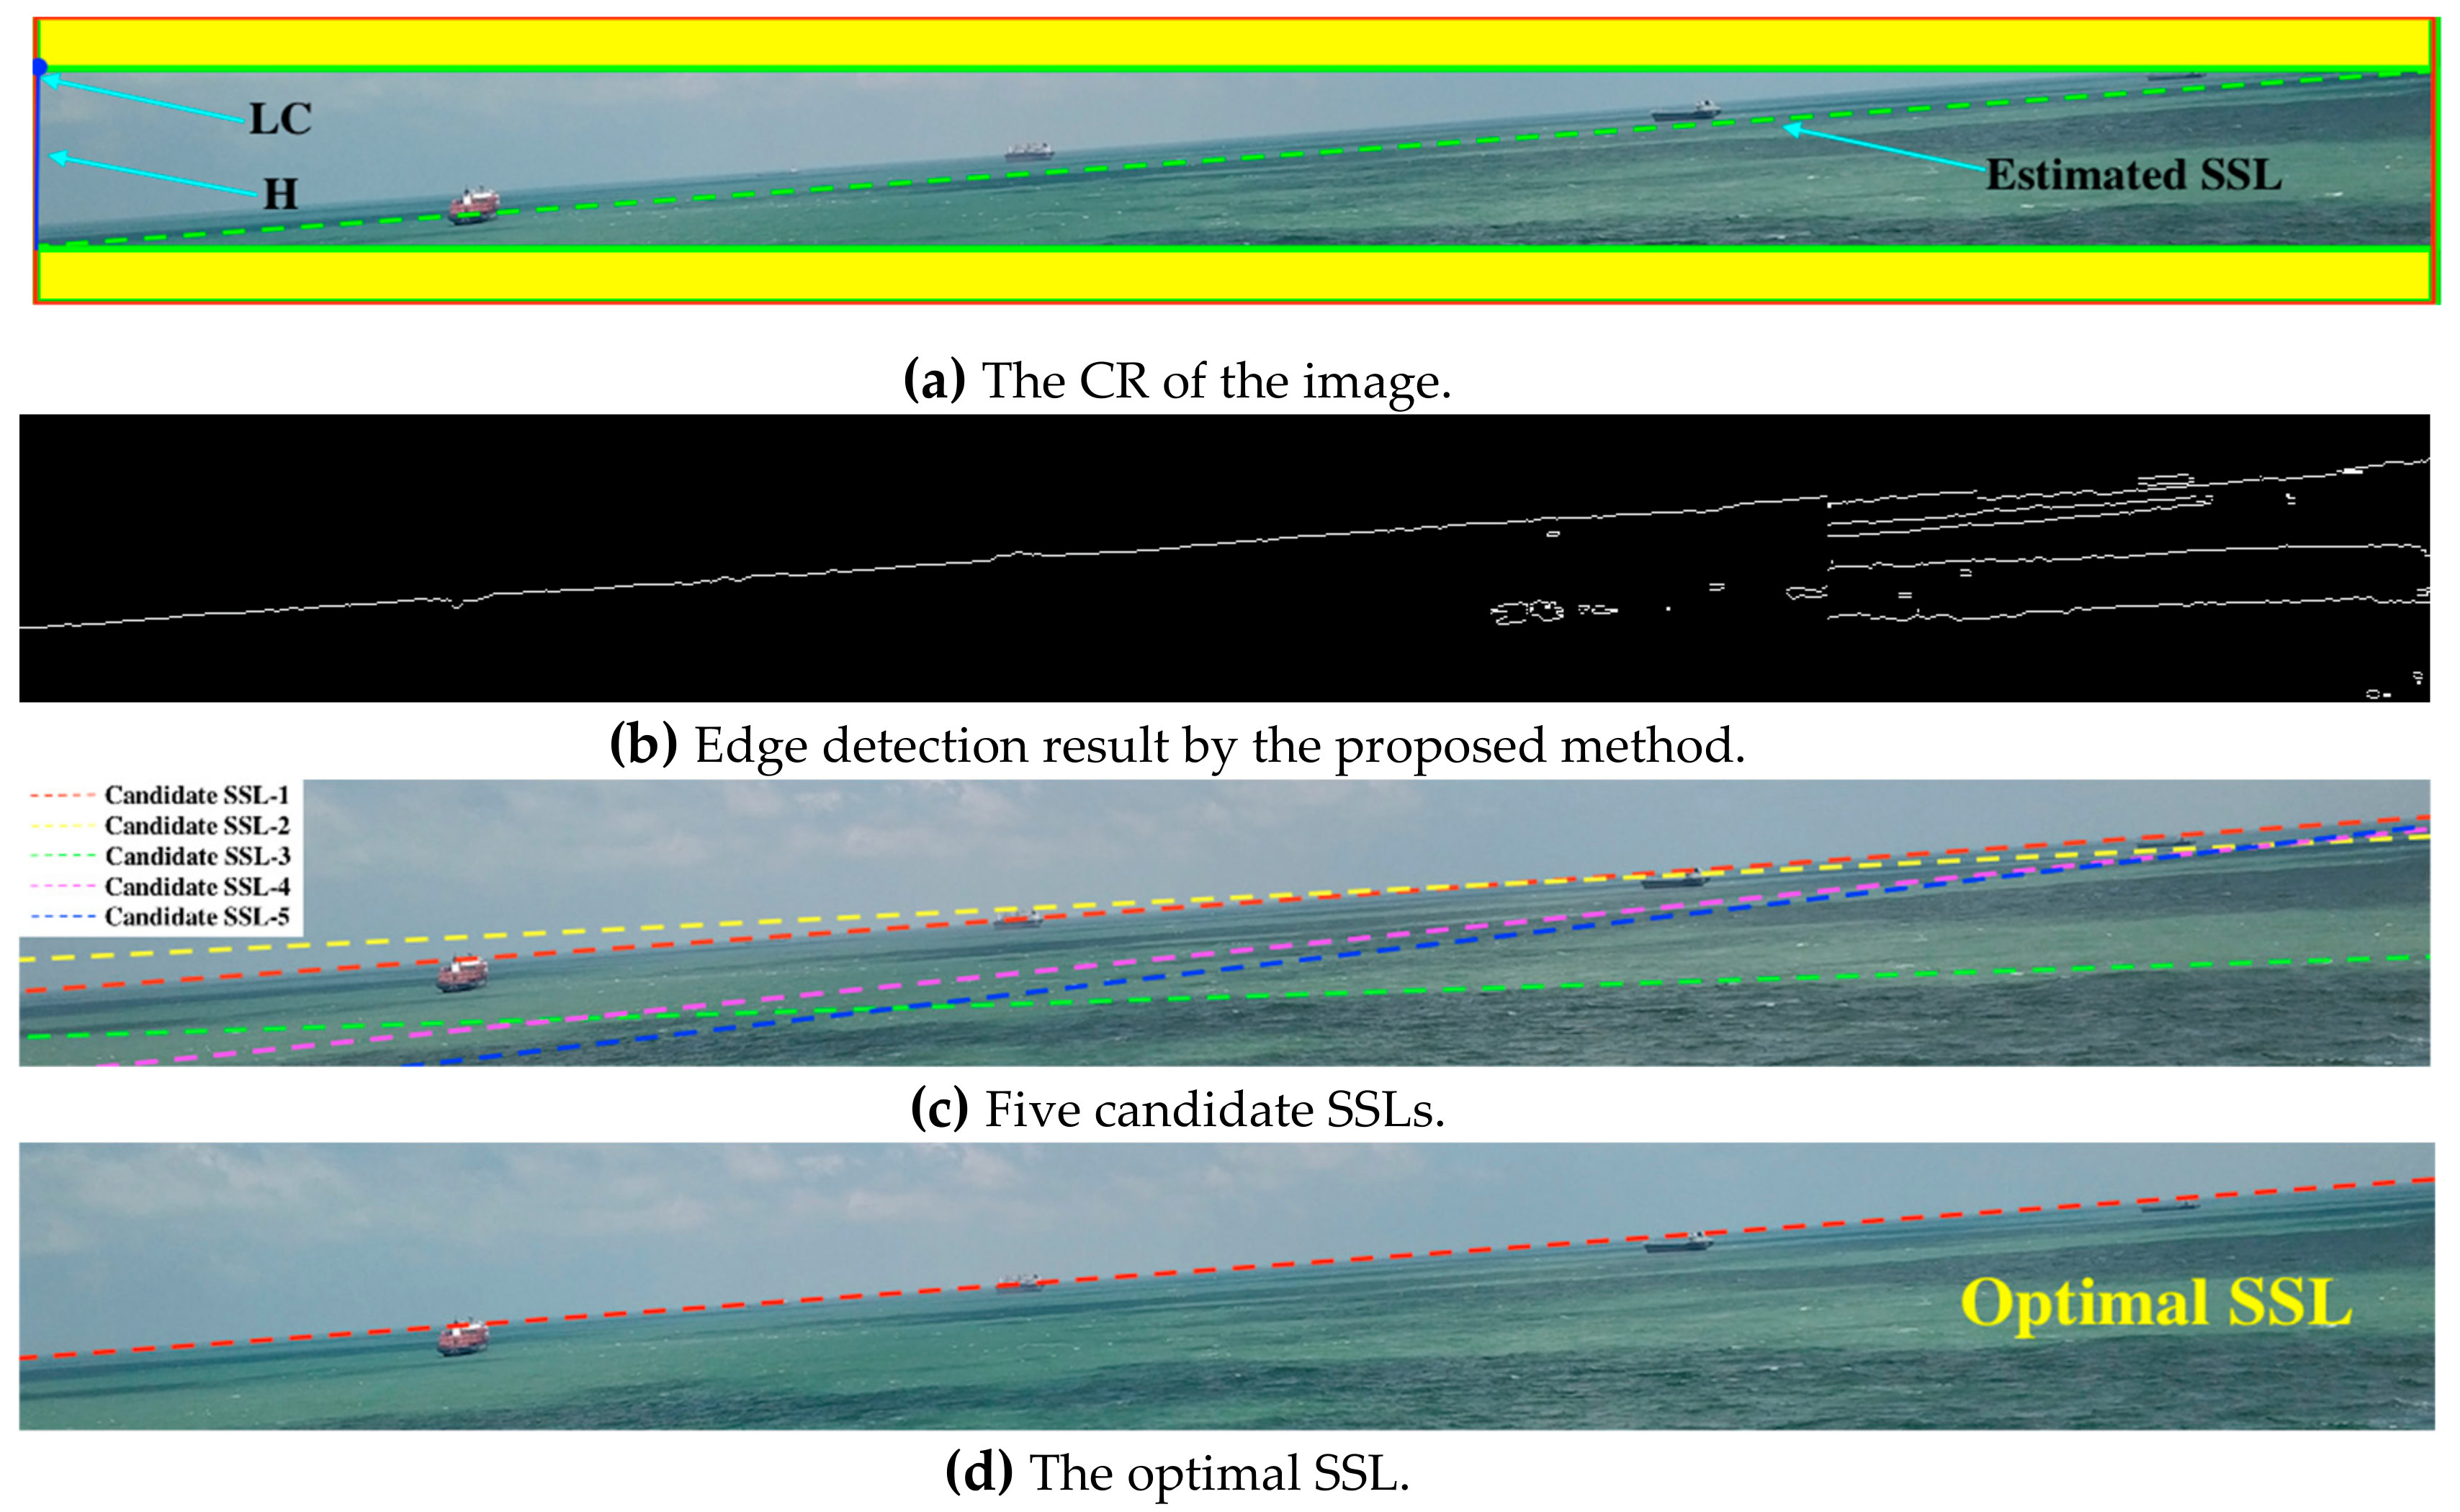
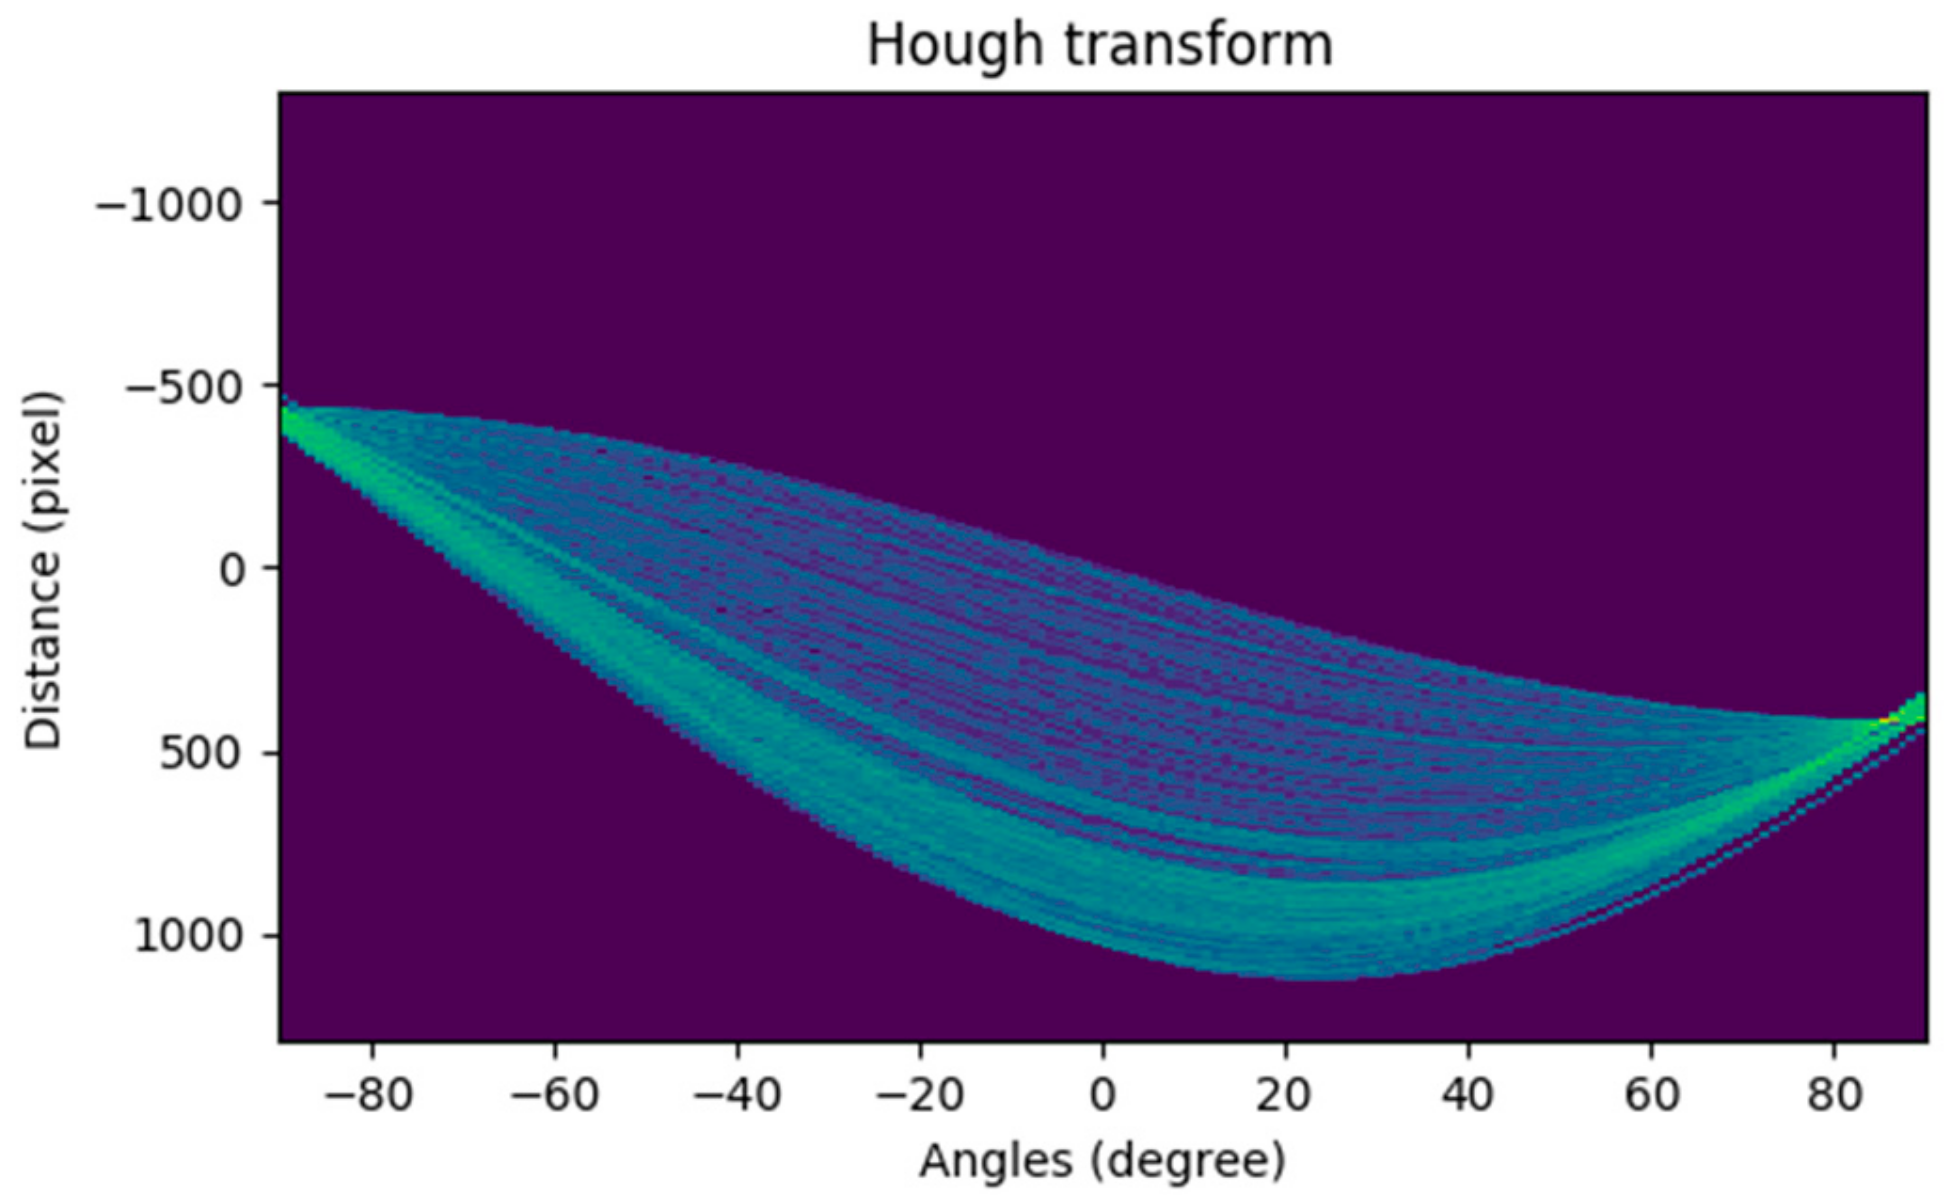
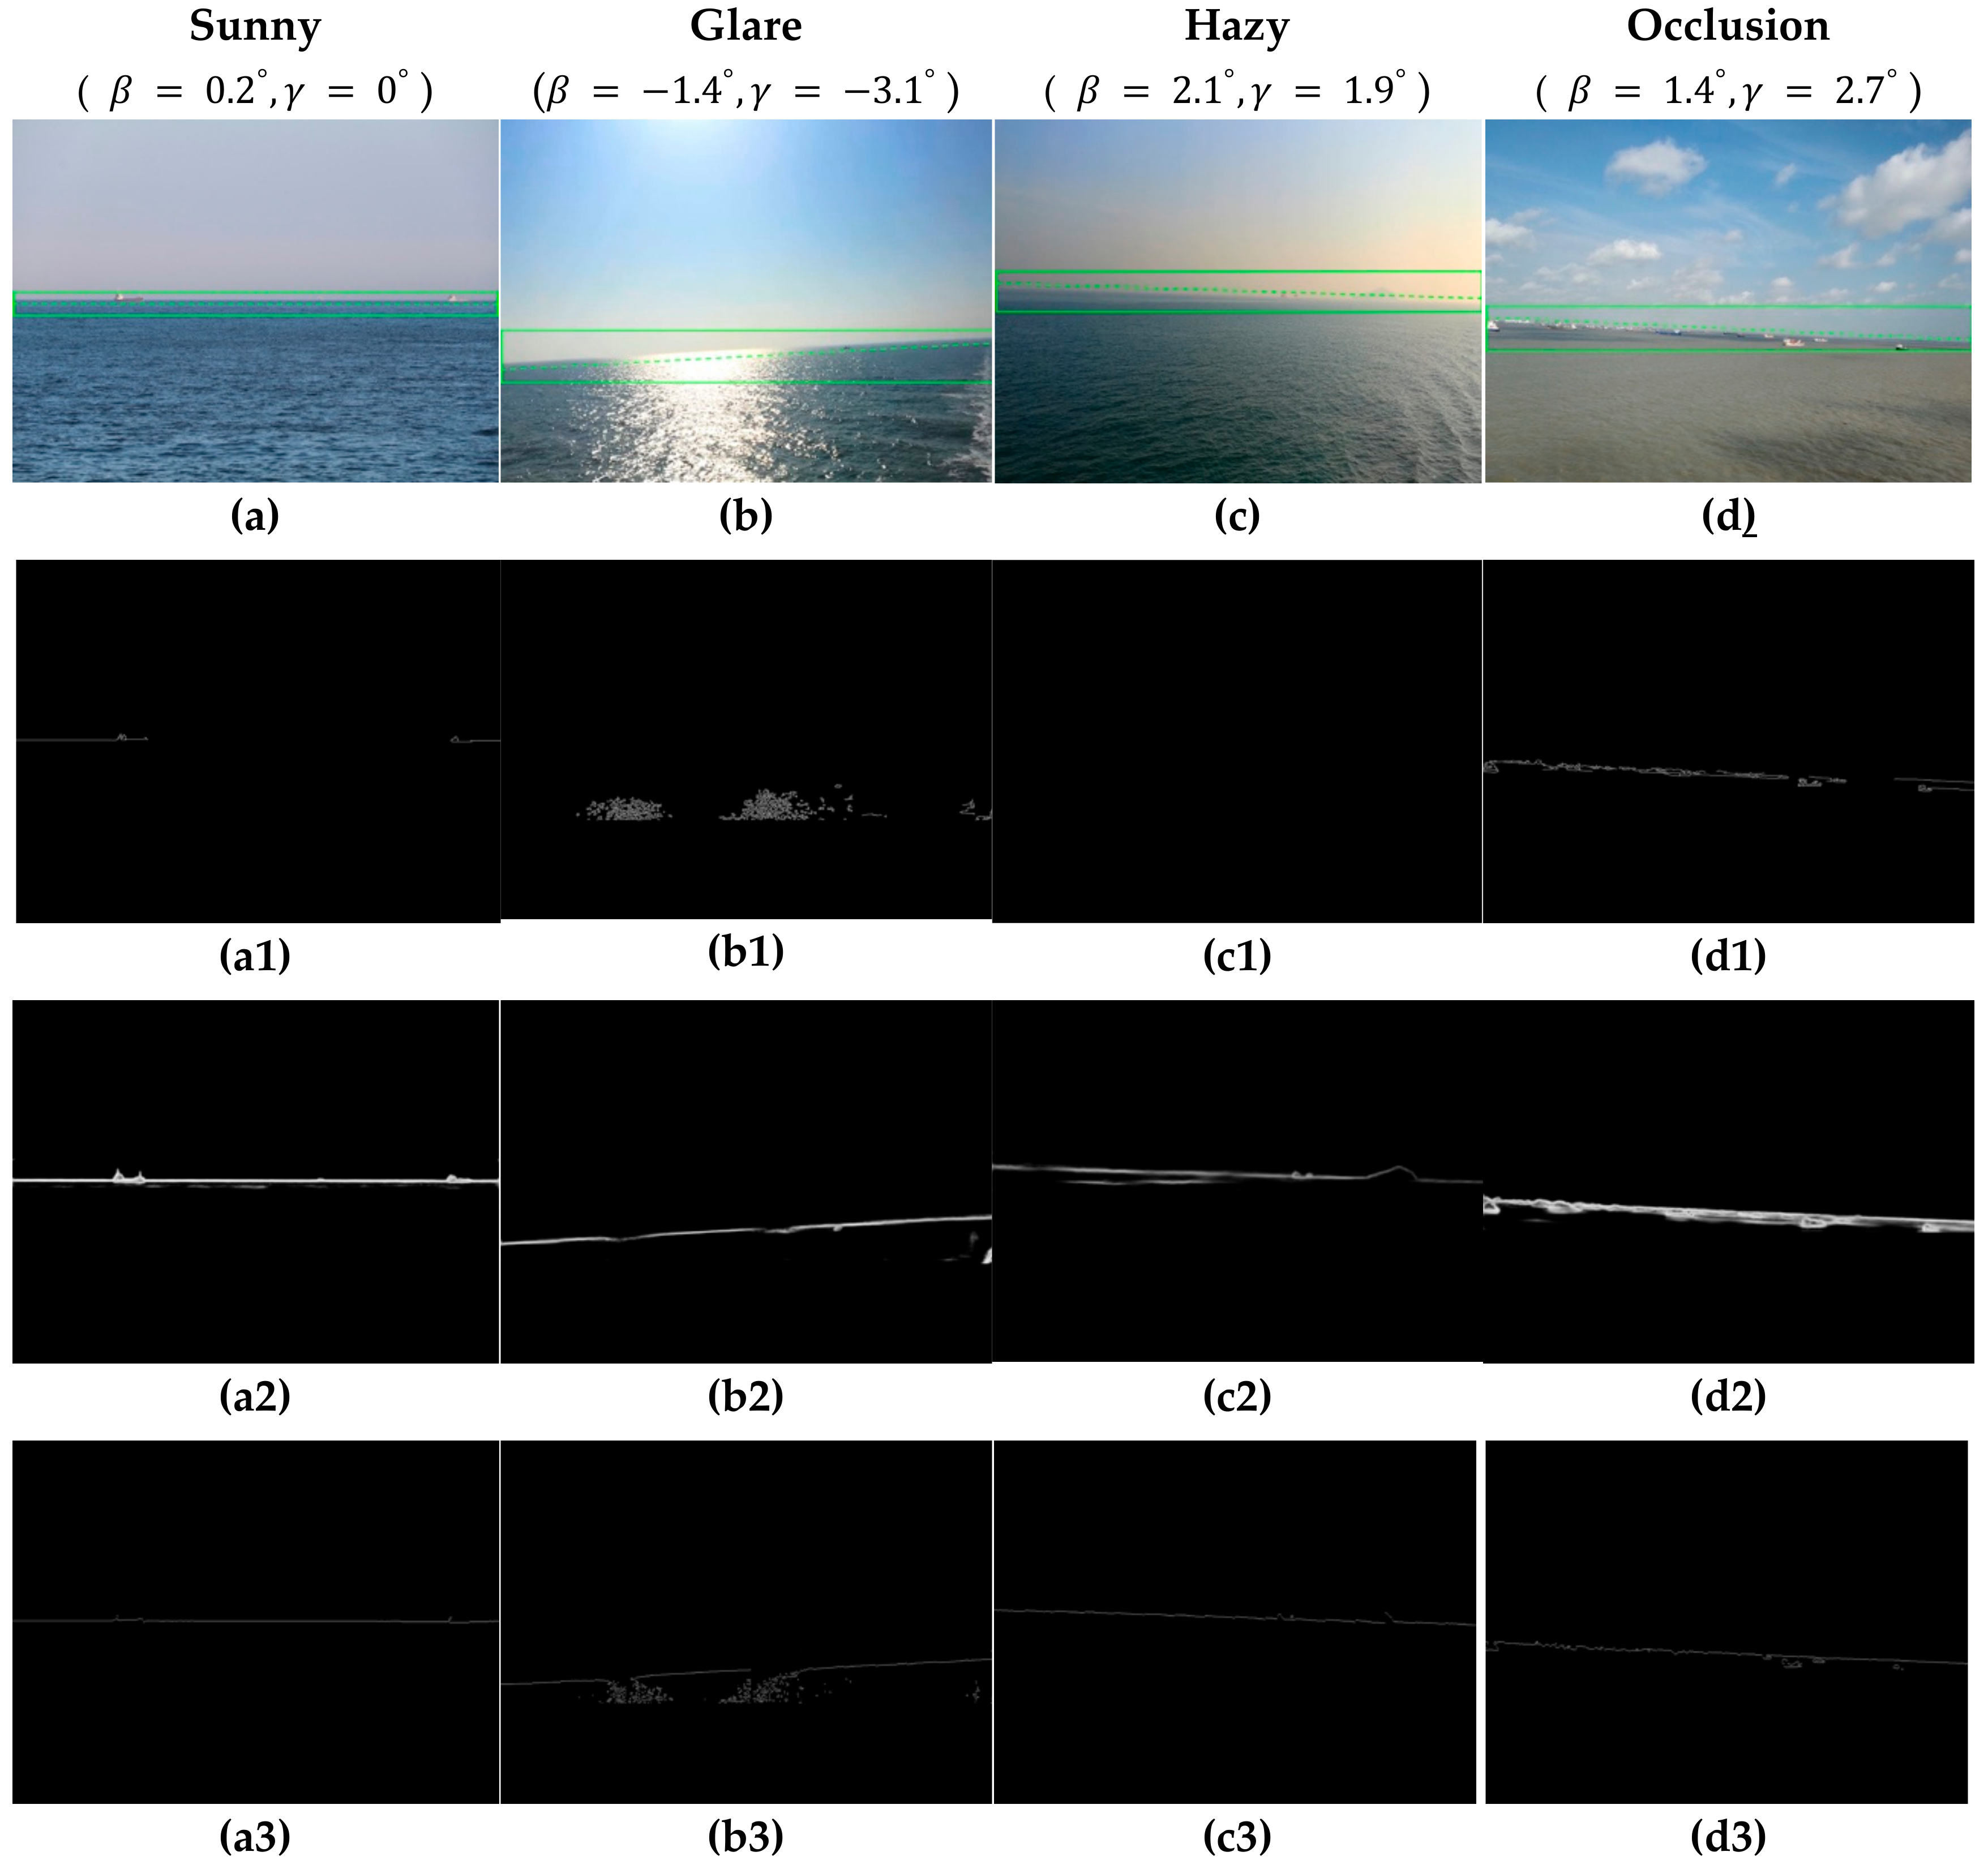
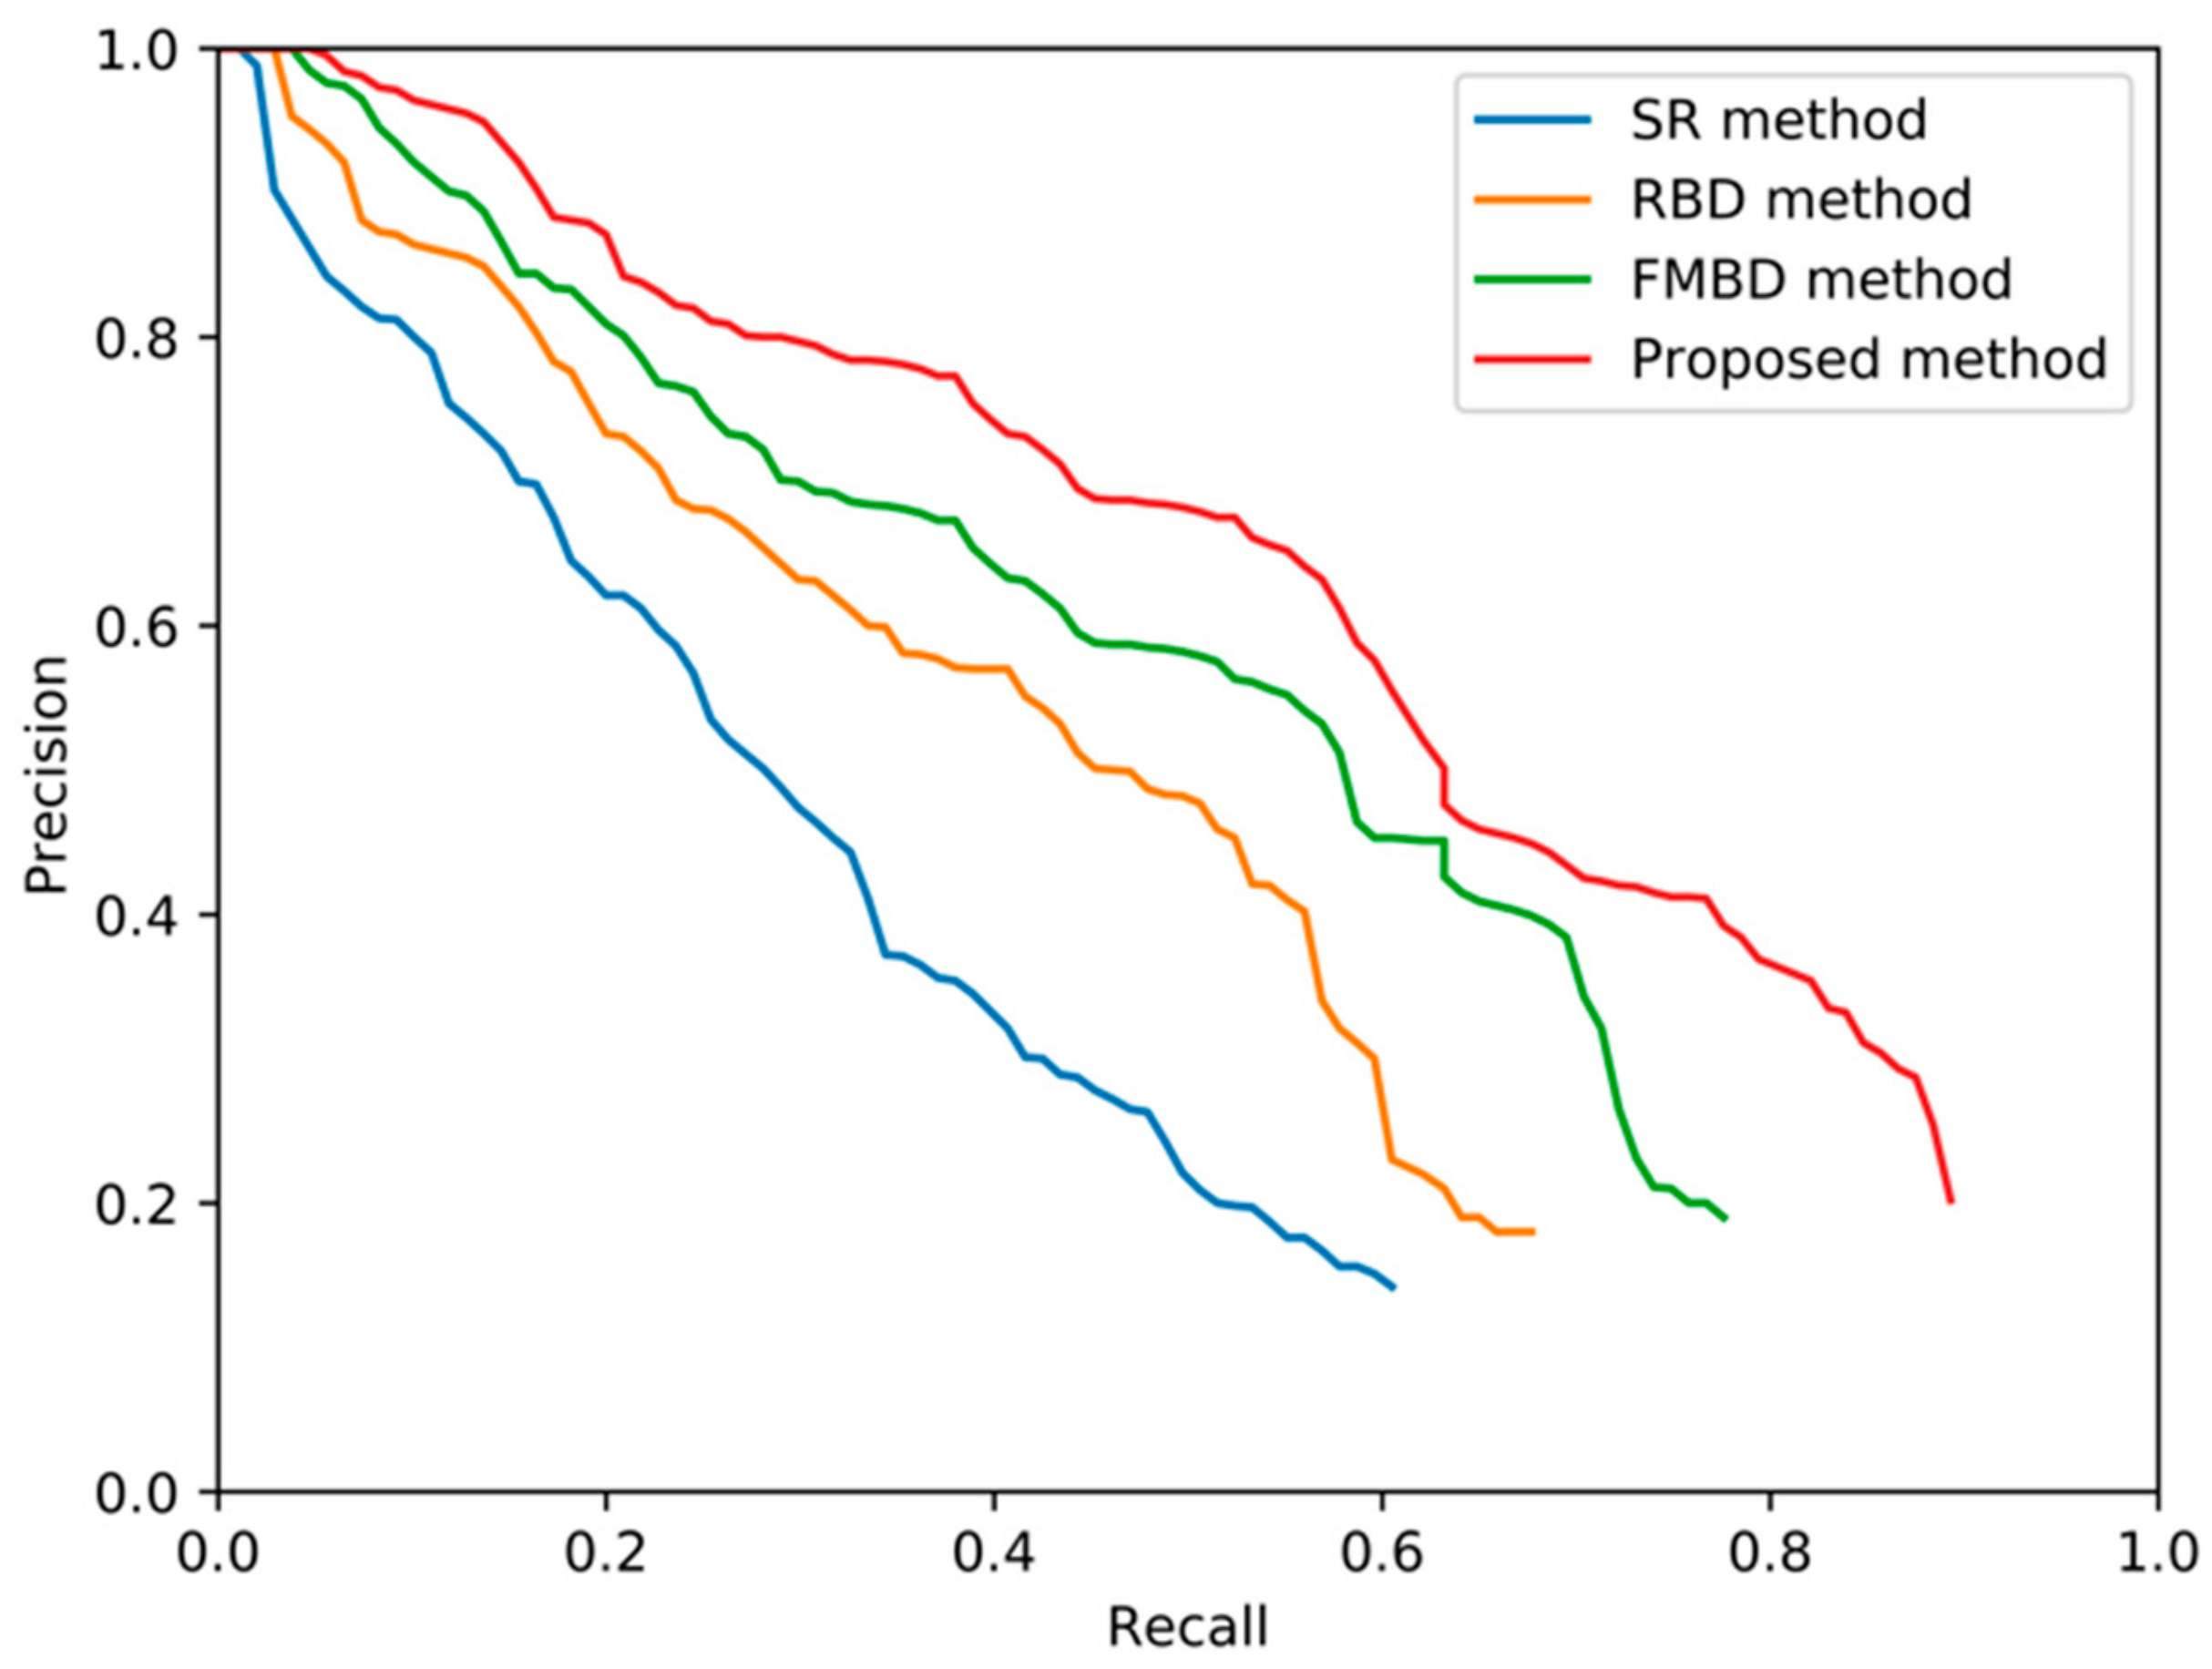
This paper proposes a novel maritime target detection algorithm based on the motion attitude of visible light camera. The camera was fixed on the “YUKUN” ship, and the camera’s motion attitude data was acquired synchronously by the inertial sensor, so that the CR of the SSL on the image could be estimated. Then, the improved local Otsu algorithm was applied to the edge detection in the CR, and the Hough transform was improved to extract the optimal SSL. Finally, the improved FMBD algorithm was used to detect the target ships in the vicinity of the SSL. The experimental results show that the proposed algorithm has obvious advantages compared with the other maritime target detection algorithms. In the test set, the detection precision of the SSL reached 99.67%, effectively overcoming the complex maritime environment. The ship detection precision and recall rates were 68.50% and 88.32%, respectively, which improved the detection precision while avoiding the ship’s missed detection.
The main contribution of this paper is the construction of a camera motion attitude model by analyzing the six-degrees-of-freedom motion of the camera at sea, combined with the maritime target detection algorithm, which narrowed the detection range and improved the detection accuracy. The edge detection algorithm was improved. The local Otsu algorithm was used for edge processing in the CR, which effectively overcame the complex maritime environment. The Hough transform algorithm was improved. The length and angle of the SSL were simultaneously considered as evaluation metrics of the cost function, which effectively improved the accuracy of SSL extraction. The ROSD was detected by the improved the FMBD algorithm. In the post-processing part of the algorithm, the morphological reconstruction with opening operation, was used to replace the previous processing method to smooth the sea–sky background, which effectively improved the target ship’s saliency detection effect.


