Article

Near-Infrared Tunable Laser Absorption Spectroscopic Acetylene Sensor System Using a Novel Three Mirror-Based, Dense Pattern Gas Cell

1
State Key Laboratory of Integrated Optoelectronics, College of Electronic Science and Engineering, Jilin University, 2699 Qianjin Street, Changchun 130012, China
2
Department of Electrical and Computer Engineering, Rice University, 6100 Main Street, Houston, TX 77005, USA
*
Author to whom correspondence should be addressed.
Sensors 2020, 20(5), 1266; https://doi.org/10.3390/s20051266
Submission received: 25 December 2019 / Revised: 13 February 2020 / Accepted: 19 February 2020 / Published: 26 February 2020
(This article belongs to the Special Issue Optical–Resonant Microsensors)

Abstract

:
By contrast with the widely reported traditional two mirror-based Herriott cell, a three mirror-based dense pattern gas cell was proposed, of which the modeling and design were proven to be effective through a comparison between the simulated spot pattern and effective path length and those of the experimental results. A mechanical structure was designed to adjust the position/angle of the three mirrors for aligning the optical path. The experimentally measured reflection number was 60, resulting in an optical path length of ~11 m, which agrees well with the theoretical value of 10.95 m. Combined with a near-infrared laser with a center wavenumber located at an acetylene (C2H2) absorption line of 6521.2 cm−1, a C2H2 sensor system was established to verify the feasibility of the three mirror-based gas cell. Assisted by a data acquisition (DAQ) card, a LabVIEW platform was developed to generate the drive signal of the laser and acquire the second harmonic (2f) signal from the output of the detector. Through Allan variance analysis, the limit of detection (LoD) of the sensor system is 4.36 ppm at an average time of 0.5 s; as the average time exceeds 10 s, the LoD is <1 ppm. The proposed model and design of the three mirror-based gas cell can be used to realize similar gas cells with different absorption path lengths for gas detection based on infrared absorption spectroscopy.

1. Introduction

There are various kinds of gas species in the atmospheric environment of human activity. Some harmful gases are toxic and flammable, e.g. acetylene (C2H2) and methane (CH4) [1,2,3], and they can even cause explosions when the concentration level exceeds the explosion limit. In order to avoid safety accidents, gas detection is particularly important. The available gas detection techniques mainly include infrared absorption spectroscopy, catalytic combustion, and electrochemical approaches [4,5,6,7]. Infrared absorption spectroscopy has the characteristics of high sensitivity, fast response and high stability. Tunable diode laser absorption spectroscopy (TDLAS), an absorption spectroscopy technique, has fast response, high precision, good single-mode characteristics and strong adaptability [8,9,10,11,12]. Moreover, the combination of wavelength modulation spectroscopy (WMS) can improve the detection sensitivity of TDLAS, which is widely used in infrared gas sensor systems.
Based on the Lambert–Beer law, infrared absorption spectroscopy reveals the relationship between light intensity, gas concentration and optical path length. Increasing optical path length can effectively improve the detection sensitivity, where gas cell is a key module in such a sensor. Two classical gas cells are usually used to increase the optical path length: a White cell and a Herriot cell [13,14,15,16]. A White cell uses three spherical mirrors to form a conjugate system, while a Herriot cell uses two parallel spherical mirrors. The distance between the mirrors of a White cell should be the same as the radius of curvature to form a conjugate system, so that the spots are symmetrically distributed up and down. Therefore, the path length is determined by the number of reflections, which is limited by the size of the mirror. For obtaining a long optical path length, it is necessary to select a mirror with a large focal length or a large size, and thus the volume of the gas cell cannot be reduced. Under the condition of paraxial incidence, according to the ABCD optical matrix [17], an elliptically distributed spot pattern can be obtained on the mirror. Furthermore, in recent years, many new types of gas cell were reported. In 2014, Mu et al. proposed a new type of White cell with symmetrical upper and lower spot pattern [18]. The spot distribution is simple and easy to adjust; however, it is not easy to fabricate a rectangular mirror, the number of reflections is limited, and with a long optical path, the cell volume is too large. In 2018, Dong et al. demonstrated a double-ring Herriot gas cell with two optical path lengths, which can be used to measure two gas species or for the detection of a single gas with two measurement ranges [19]. The disadvantage of this cell is that the mirror utilization rate is low and the cell volume is too large. In 2019, Zheng et al. proposed an acetylene sensor based on off-axis integrated-cavity output spectroscopy (OA-ICOS) [1]. The optical path length is greatly affected by the mirror reflectivity. A large optical path length requires an expensive, highly reflective mirror.
In this work, a new type of gas cell structure is proposed and an acetylene sensor system is reported based on the proposed gas cell. By contrast with the traditional two mirror-based gas cell, the position and angle of the three mirrors are flexible because of the use of three spherical mirrors. Compared with previously reported double-ring Herriott gas cell [19], the three mirror-based gas cell has a large spot number and dense spot distribution. Therefore, the three mirror-based gas cell can realize larger optical path length with small mirror size and cell volume. Moreover, the maximum reflection number is achieved when the size of the spot-ring equals the maximum radius of the mirror. The differences of this cell structure are described as below. Firstly, the incident light does not need to be paraxial, which shortens the distance between the mirrors and thus reduces the cell volume and improves the cell stability. Secondly, the reflection of the traditional two mirror-based cell only exists in one dimension. However, another dimension is added in the three mirror-based cell, which leads to a triangular optical reflection and a long optical path with the same cell volume. Finally, with appropriate optimization, the light spot can be distributed on the whole mirror surface, which improves the utilization rate of the mirror. Under the same targeted optical path length, the mirror size and cell volume can be reduced. In other words, under the same cell volume, a long optical path can be achieved for enhancing the sensor sensitivity.

2. Three Mirror-Based Gas Cell

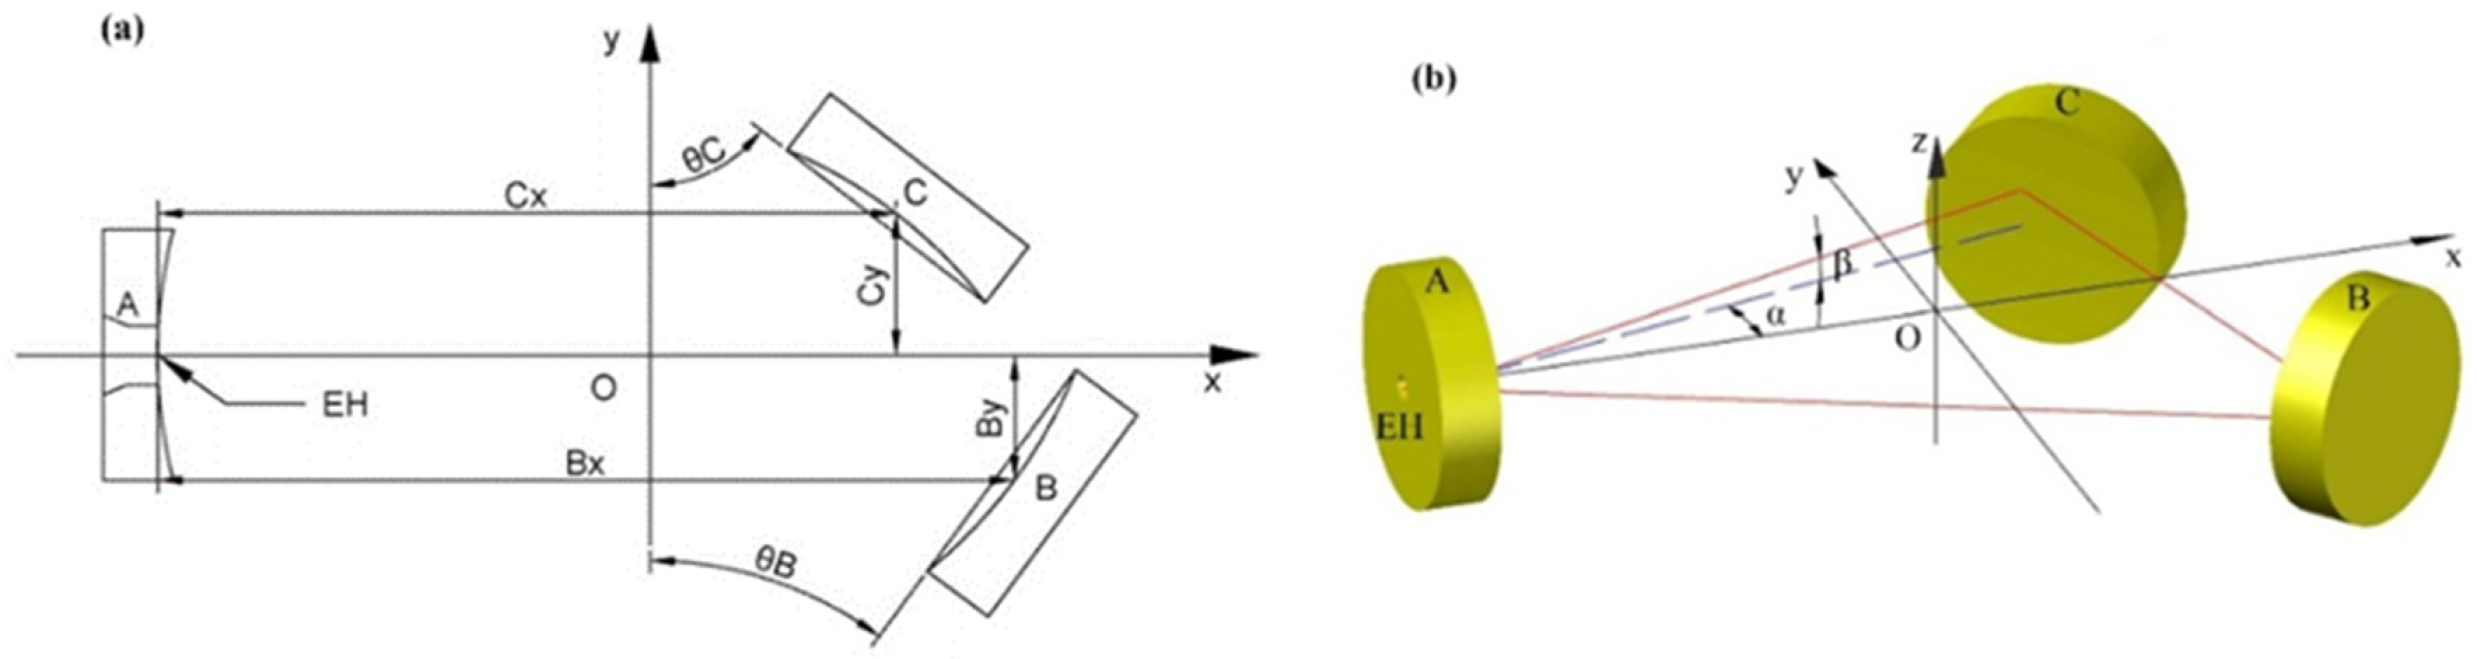
2.1. Gas Cell Structure

The structure of the three mirror-based gas cell is shown in Figure 1a. The spherical center of mirror A is set as the coordinate origin, the direction perpendicular to the mirror A is the x-axis, the direction parallel to the mirror A is the y-axis, and the vertical direction is set to the z-axis. Figure 1b shows a three-dimensional model of the gas cell designed by Auto computer aided design (CAD) software. There is an entrance hole (EH) on mirror A. The direction angle and pitch angle of the entrance light are defined as α and β, respectively. The central distance projected to the x axis between mirror A and mirror C is Cx and that to the y axis is Cy. Similarly, the central distance projected to the x axis between mirror A and mirror B is Bx and that to the y axis is By. The angle between mirror C and the y axis is θC, and that between mirror B and the y axis is θB. The incident light propagates through the EH on mirror A to mirror C and reflects to mirror B. After a certain number of reflections, the light reflects from mirror C and stops reflection after propagating through the EH of mirror A.
In the modelling and simulation of the gas cell, the three mirrors have ideal sphere shape, the center points of the mirrors are located in the same plane which is perpendicular to the horizontal plane, and the effect of the thickness of the mirror is not considered. The incident ray is assumed to be a straight line, regardless of the effects of the angle of the exit ray and the thickness of the mirror on the ray emission. Also, it is assumed that the spot diameter of the laser beam is 1 mm. Light obeys the law of reflection, the reflection angle is equal to the incident angle, and the incident ray, normal line and reflection ray are in the same plane.

2.2. Simulation

When the center of the sphere is (xA, yA, zA) and the focal length of the mirror is f, the equation of the mirror A can be described as:
( x x A ) 2 + ( y y A ) 2 + ( z z A ) 2 = ( 2 f ) 2
The unit normal vector (m, n, k) describing the equation of the line can be obtained from the angle, combining the coordinates of the incident point (x0, y0, z0), the equation of the ray can be described as:
x x 0 m = y y 0 n = z z 0 k
By combining Equations (1) and (2), we can obtain the intersection of the ray and the sphere. When the obtained intersection point is located within the mirror, the reflection is valid. Then the angle of the reflection ray is determined by the law of reflection, and the equation of the reflected ray can be determined. The reflection stops until the desired point of intersection is perforated at the exit of mirror A. In addition, there may be no solution or the intersection point is not on the mirror, and this case will be unconsidered. Also, we added the maximum number of reflections as a loop-stop condition of the program.
Considering the actual size, the spot cannot be near the edge of the mirror or exit partially from the EH during reflection. With an incident laser beam diameter of 1 mm, a simulation program was designed to check whether the position and shape of the reflected spot meet the requirements or not. As shown in Figure 2, the number of reflections and the spot shape on each mirror are obtained under the used simulation parameters in Table 1. When the elevation angle of the incident light increases, the spot will disperse up and down; when the direction angle of the incident light increases, the spot will disperse left and right. Under the same parameters of the mirror, if the incident angle increases, the light continues reflecting among the mirrors which increases the reflection number. However, when the reflected light reaches the boundary of the mirror, the angle cannot be increased any more. By contrast with the incident circular spot, after reflection between the anti-spherical mirrors, the light beam converges and diverges, making the shape of the spot change during reflection.
Since the number of adjustable parameters of the three mirror-based gas cell is more than that of the traditional two mirror-based Herriott cell, it is more meaningful to study the influence of the distance and angle between mirrors on the optical path length and spot distribution. In the selection of mirrors, concave mirrors with convergent function should be used. We tried using an off-axis parabolic mirror to replace one of the mirrors, but it is hard to obtain a long optical length.

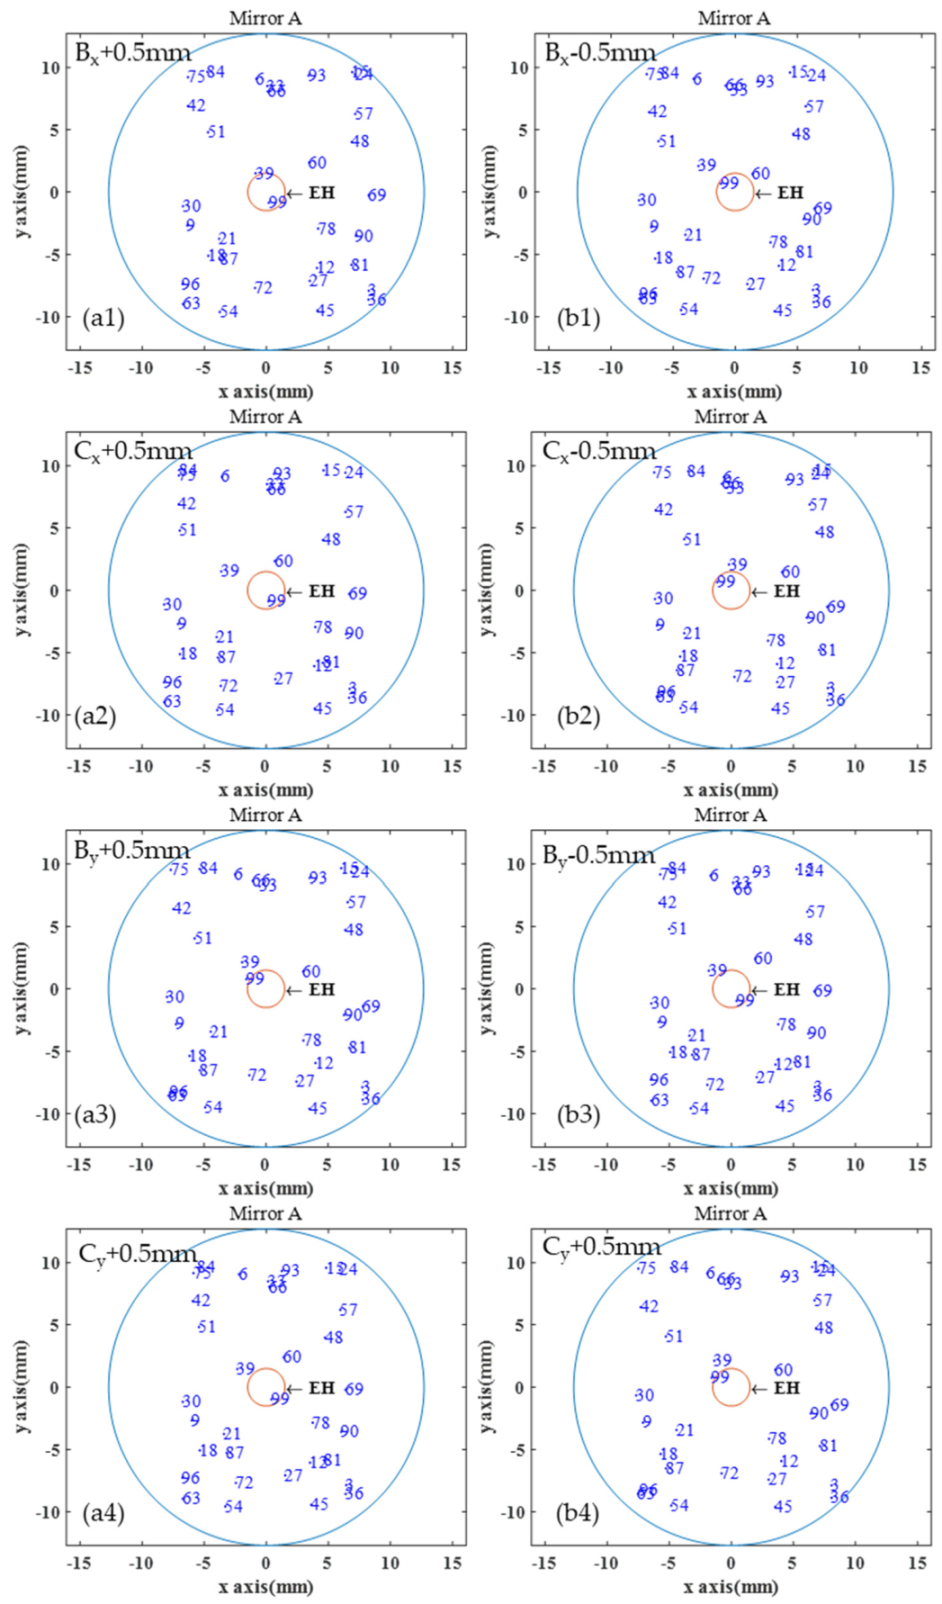
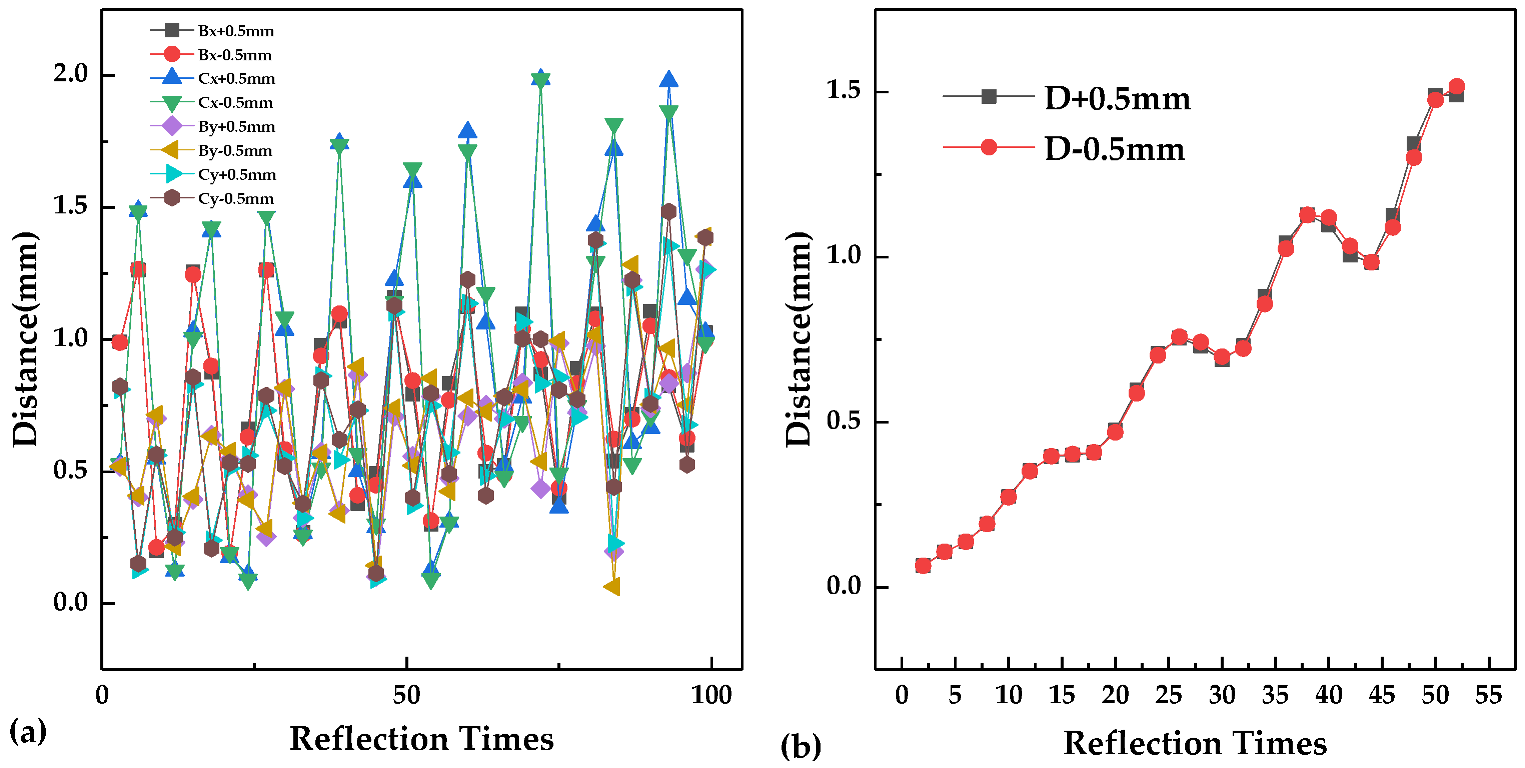
2.3. Mechanical Stability Analysis of the Gas Cell

When the optical path is affected by mechanical vibration, the stability of the optical path is particularly important. Assume that there is an offset added to the simulation parameters in Table 1 to observe the change in the mode pattern. Figure 3 shows the spot distribution on Mirror A with Bx, Cx, By, and Cy increased or decreased by 0.5 mm. The mechanical vibration does not affect only one parameter. The variation of each parameter depends on the vibration intensity. From the simulation result, when there is a slight change in a single parameter, the spot position on Mirror A will not be significantly shifted, and the reflection number and the optical path will not be affected.

2.4. Comparison with the Two Mirror-Based Herriott Cell

A MATLAB program was used to simulate a traditional Herriott cell with the parameters in Table 2, the model of which can be seen in Reference 19. D is the distance between the two Herriott mirrors, f is the focus of the mirrors, the entrance position is (x, y, z) on mirror A, and the entrance angles are α and β. The spot distribution obtained is shown in Figure 4. Figure 4a shows the spot distribution of a two-mirror-based Herriott cell on Mirror A under the designed parameters in Table 2. The exit spot #52 is located at the center of the exit hole, and the optical path is determined to be 12.9 m. Figure 4b is the spot distribution with D increased by 0.5 mm, and Figure 4c shows the spot distribution with D reduced by 0.5 mm. Figure 5 shows the relation between the shift distance of the exit spot on mirror A and the reflection times before and after changes added to Bx, By, Cx, Cy or D for the three mirror-based gas cell and the two mirror-based gas cell. For the two mirror-based Herriott cell, the spot shift distance increases significantly with the number of reflections. The offset distance obtained by the proposed scheme is less affected by the reflection number and is more suitable for achieving a long optical path and a good stability.

3. Gas Cell Development and Measurement

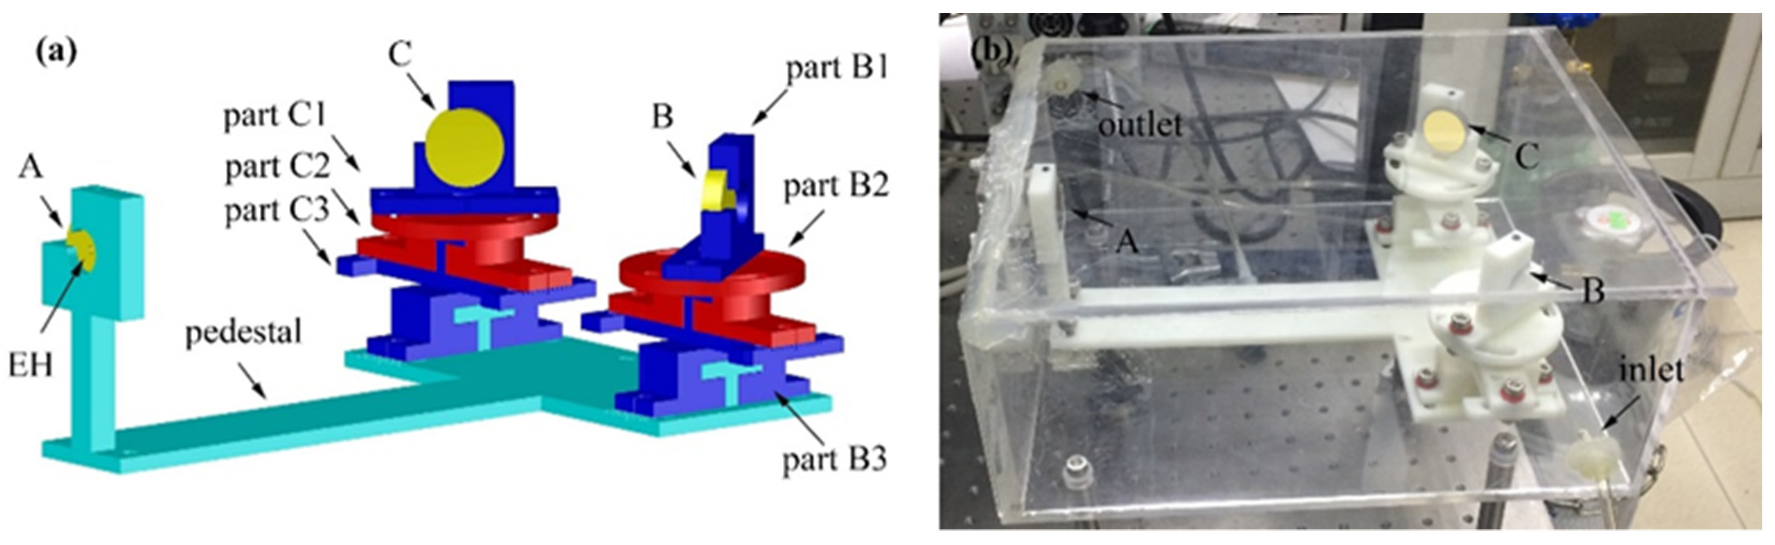
3.1. Mechanical Structure Design

The parameters of the gas cell need a high accuracy to adjust, and therefore it is necessary to design a mechanical structure to assist in adjusting the angles and positions of the three mirrors. According to the simulation parameters of the chamber, a mechanical structure was required, by which the position of the mirror can be changed (±10 mm) and the angle can be rotated by 90°. A 3D model of the mechanical adjust structure is shown in Figure 6a. With a reference to the position of mirror A, the blue elements (part B3 and C3) can adjust the parameters of By and Cy, the red elements (part B2 and C2) can adjust the parameters of Bx and Cx, and the blue mirror frame (part B1 and C1) can adjust the parameters of θB and θC by 90°. Each part of the adjusting structure can change only one parameter without affecting other parameters. The mechanical structure was fabricated and assembled by using a 3D printing technique, and had a size of 247 × 160 × 90 mm3. The mirror with a reflectance of ~98.28% near the wavelength of 1.53 μm was fixed on the mirror frame, and the position was adjusted by observing the mode pattern of the red trace laser. A final structure was obtained with the target spot distribution observed. Furthermore it should be noted that (1) reducing the cell volume can directly improve the response speed of the sensor; (2) a small-volume cell can reduce the total amount of the target gas; (3) a sensor can be made portable with the small cell; (4) The resistance of the size-reduced sensor to mechanical vibration can be improved.
In the cell model, the three mirrors were placed vertically with the same height. But in actual fact, it became a problem to ensure the height of each adjusting elements. The error between the heights of the adjusting elements has less effect on the spot distribution than the parameters between mirrors.
Then the mechanical structure with the three mirrors was fixed in an acrylic sealed box as a gas chamber for gas measurement. There is a window on the front surface of the chamber (WG5150, Thorlabs, Newton, NJ, USA), which allows the laser beam to enter the chamber for reflection. The inlet and outlet air holes are located at both sides of the air chamber. A photo of the developed gas cell is shown in Figure 6b whose dimension size is 287 × 241 × 115 mm3.

3.2. Gas Cell Measurement

The parameters of the gas cell were tuned until the desired spot pattern was obtained. The image of the observed spot is shown for mirror A, B and C in Figure 7. The pattern obtained shows good agreement with the simulated results shown in Figure 2, which proves the accuracy of the gas cell model and theory.
The number of reflections determines the optical length, but the number of visible spots does not determine the optical length. However, the spot distribution can be used for the adjustment of the optical path, and the optical length needs to be measured accurately through the optical length calibration experiment. Therefore, as long as the number of the visible spots reaches the expected value, the optical length can meet the design requirement. In the system, the red laser was used to adjust the optical path, and the spot distribution can be observed directly. By blocking some spot and observing the residual spot shape, such as the 21st spot and the 18th spot on mirror A, which are in a thin strip perpendicular to each other, we can judge whether the optical length meets the design requirement. If the number of reflections increases, the intensity of the beam gets weak to a certain extent, and a high-power laser is preferred. If the number of spots is too large, image analysis can be considered to identify the number of spots by boundary extraction and other algorithms.
Then we determined the effective absorption path length of the gas cell under this configuration. As shown in Figure 7d,e, when the 54th spot on mirror A is blocked, the 55th and 58th spot on mirror C disappear, while the other spots on mirror C remain unchanged, indicating that the number of reflections is ~60. This results in an optical path length of 10.95 m with 60 reflections.
In the simulation, the reflection number is 99, and the number obtained in the experiment is much less than that in the simulation. As can be seen from Figure 2, the 60th spot on mirror A was very close to the EH. Due to the accumulation of errors in various parameters, the 60th spot was ejected from the incoming perforation, causing the reflection to stop. Efforts were made to increase the reflection number but it is difficult to do so since there is no specific formula for the relation between the gas cell parameters and the spot distribution.
By blocking the spot, the reflection number of the spot can be observed. By blocking the 54th spot on mirror A, all spots after spot 54 should disappear. However, only two spots disappeared on mirror C, 55 and 58, and the total number of spots on each mirror was the same; also, two spots disappeared on mirror A, namely 57 and 60. Combined with simulation results, spot 60 was very close to the perforation, so it can be inferred that spot 60 was emitted from the EH. The spot distribution indicates that all the light is emitted after 60 reflections and no light continues to reflect in the air chamber.
An experiment was performed to verify the optical path. The optical path length of the chamber was experimentally measured using a C2H2 sample with a concentration level of 2000 ppm. The drive signal of the distributed feedback (DFB) laser is a 5 Hz sawtooth signal. When there is no acetylene gas in the chamber, the output signal from the detector should be a 5 Hz triangular wave. When the 2000 ppm acetylene is injected, the optical power received by the detector decreases. The measured output signal from the detector is shown in Figure 8. The maximum attenuation voltage was 0.723 V (V1), and the original signal voltage without acetylene absorption was 0.762 V (V2), which was derived from the linear fitting curve. The bias voltage of the detector was 0.688 V (V0) without laser irradiation. Therefore, according to Equation (3), it is written as:
α = l n ( ( V 2 V 0 ) / ( V 1 V 0 ) )
and the absorbance (a) is calculated to be 0.736. Compared to the simulation result on the SpectraPlot website [20], the obtained optical path length is therefore determined to be 11.0 m, which is in good agreement with the theoretical result of 10.95 m.

4. Performance of the C2H2 Sensor

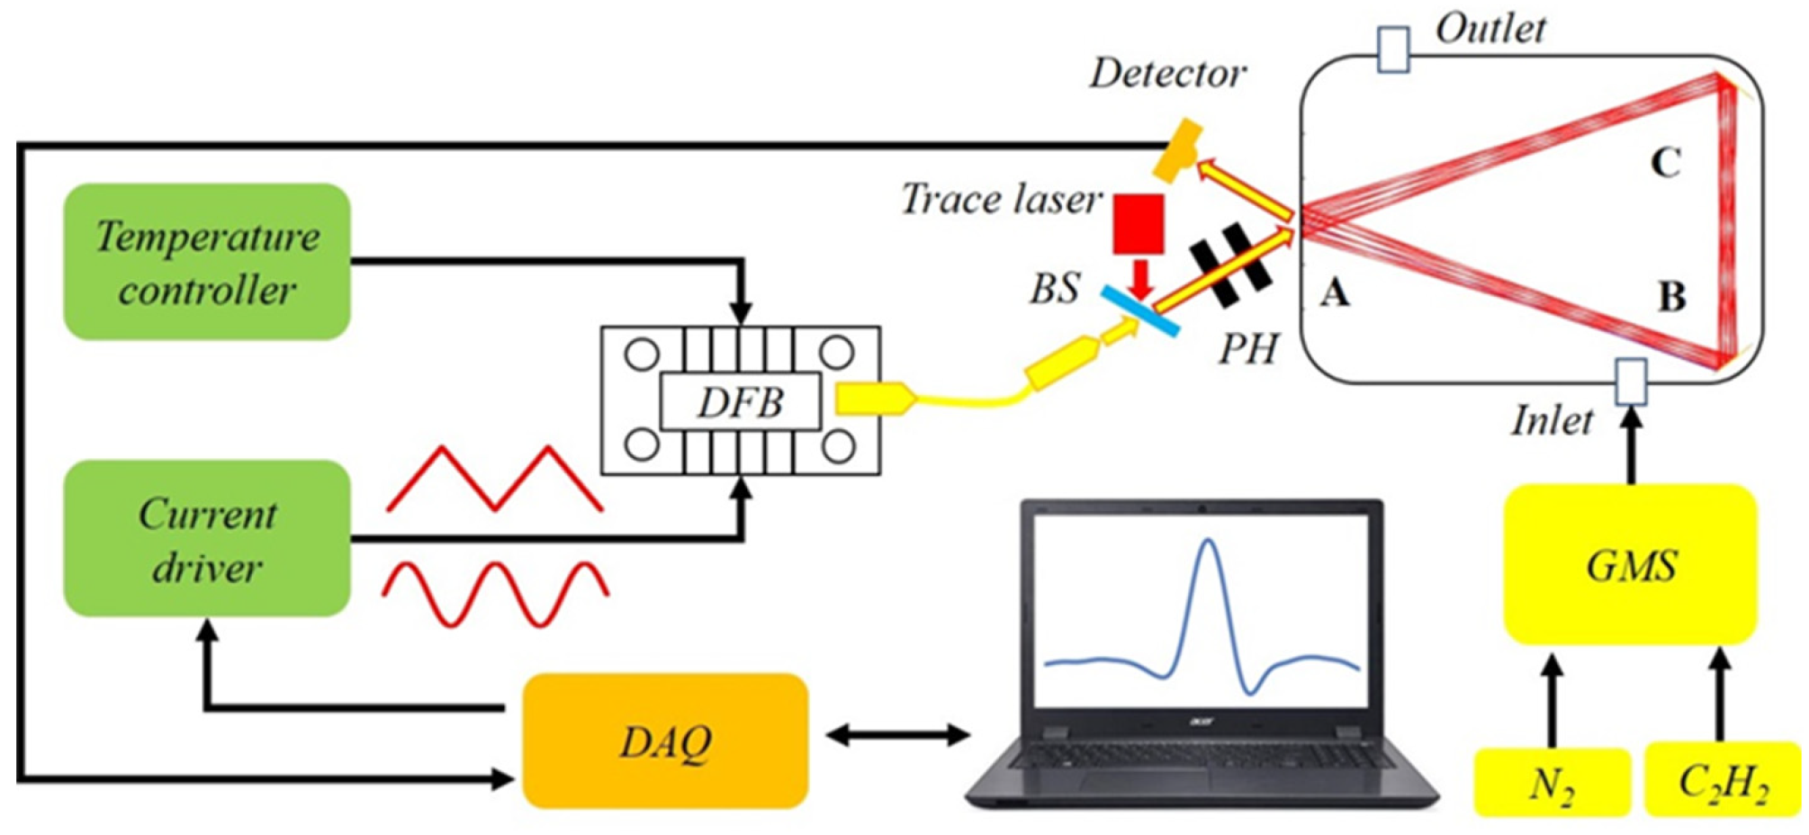
4.1. Sensor Configuration

As shown in Figure 9, the structure of the sensor system is similar to the system previously reported by our group [19]. The three mirror-based gas cell was used instead of the traditional Herriott cell [19], and only one detector was adopted for single-gas measurements. With a gas mixing system (GMS, Series 4000, Environics, Tolland, CT, USA), 2000 ppm C2H2 and pure N2 were used to produce gas samples with different concentration levels for experiments. The specific parameters of the system are summarized and shown in Table 3.
With a data acquisition (DAQ) card, a LabVIEW platform was developed to control the current and temperature of the laser. The optical path was aligned with a visible trace laser. The output laser beam was overlapped with the red laser beam through a beam splitter (BS) and two pinholes (PH). The combined beam enters the multi-pass cell and reaches the detector after multiple reflections. The output signal from the detector was delivered to the LabVIEW platform for post data processing and analysis.

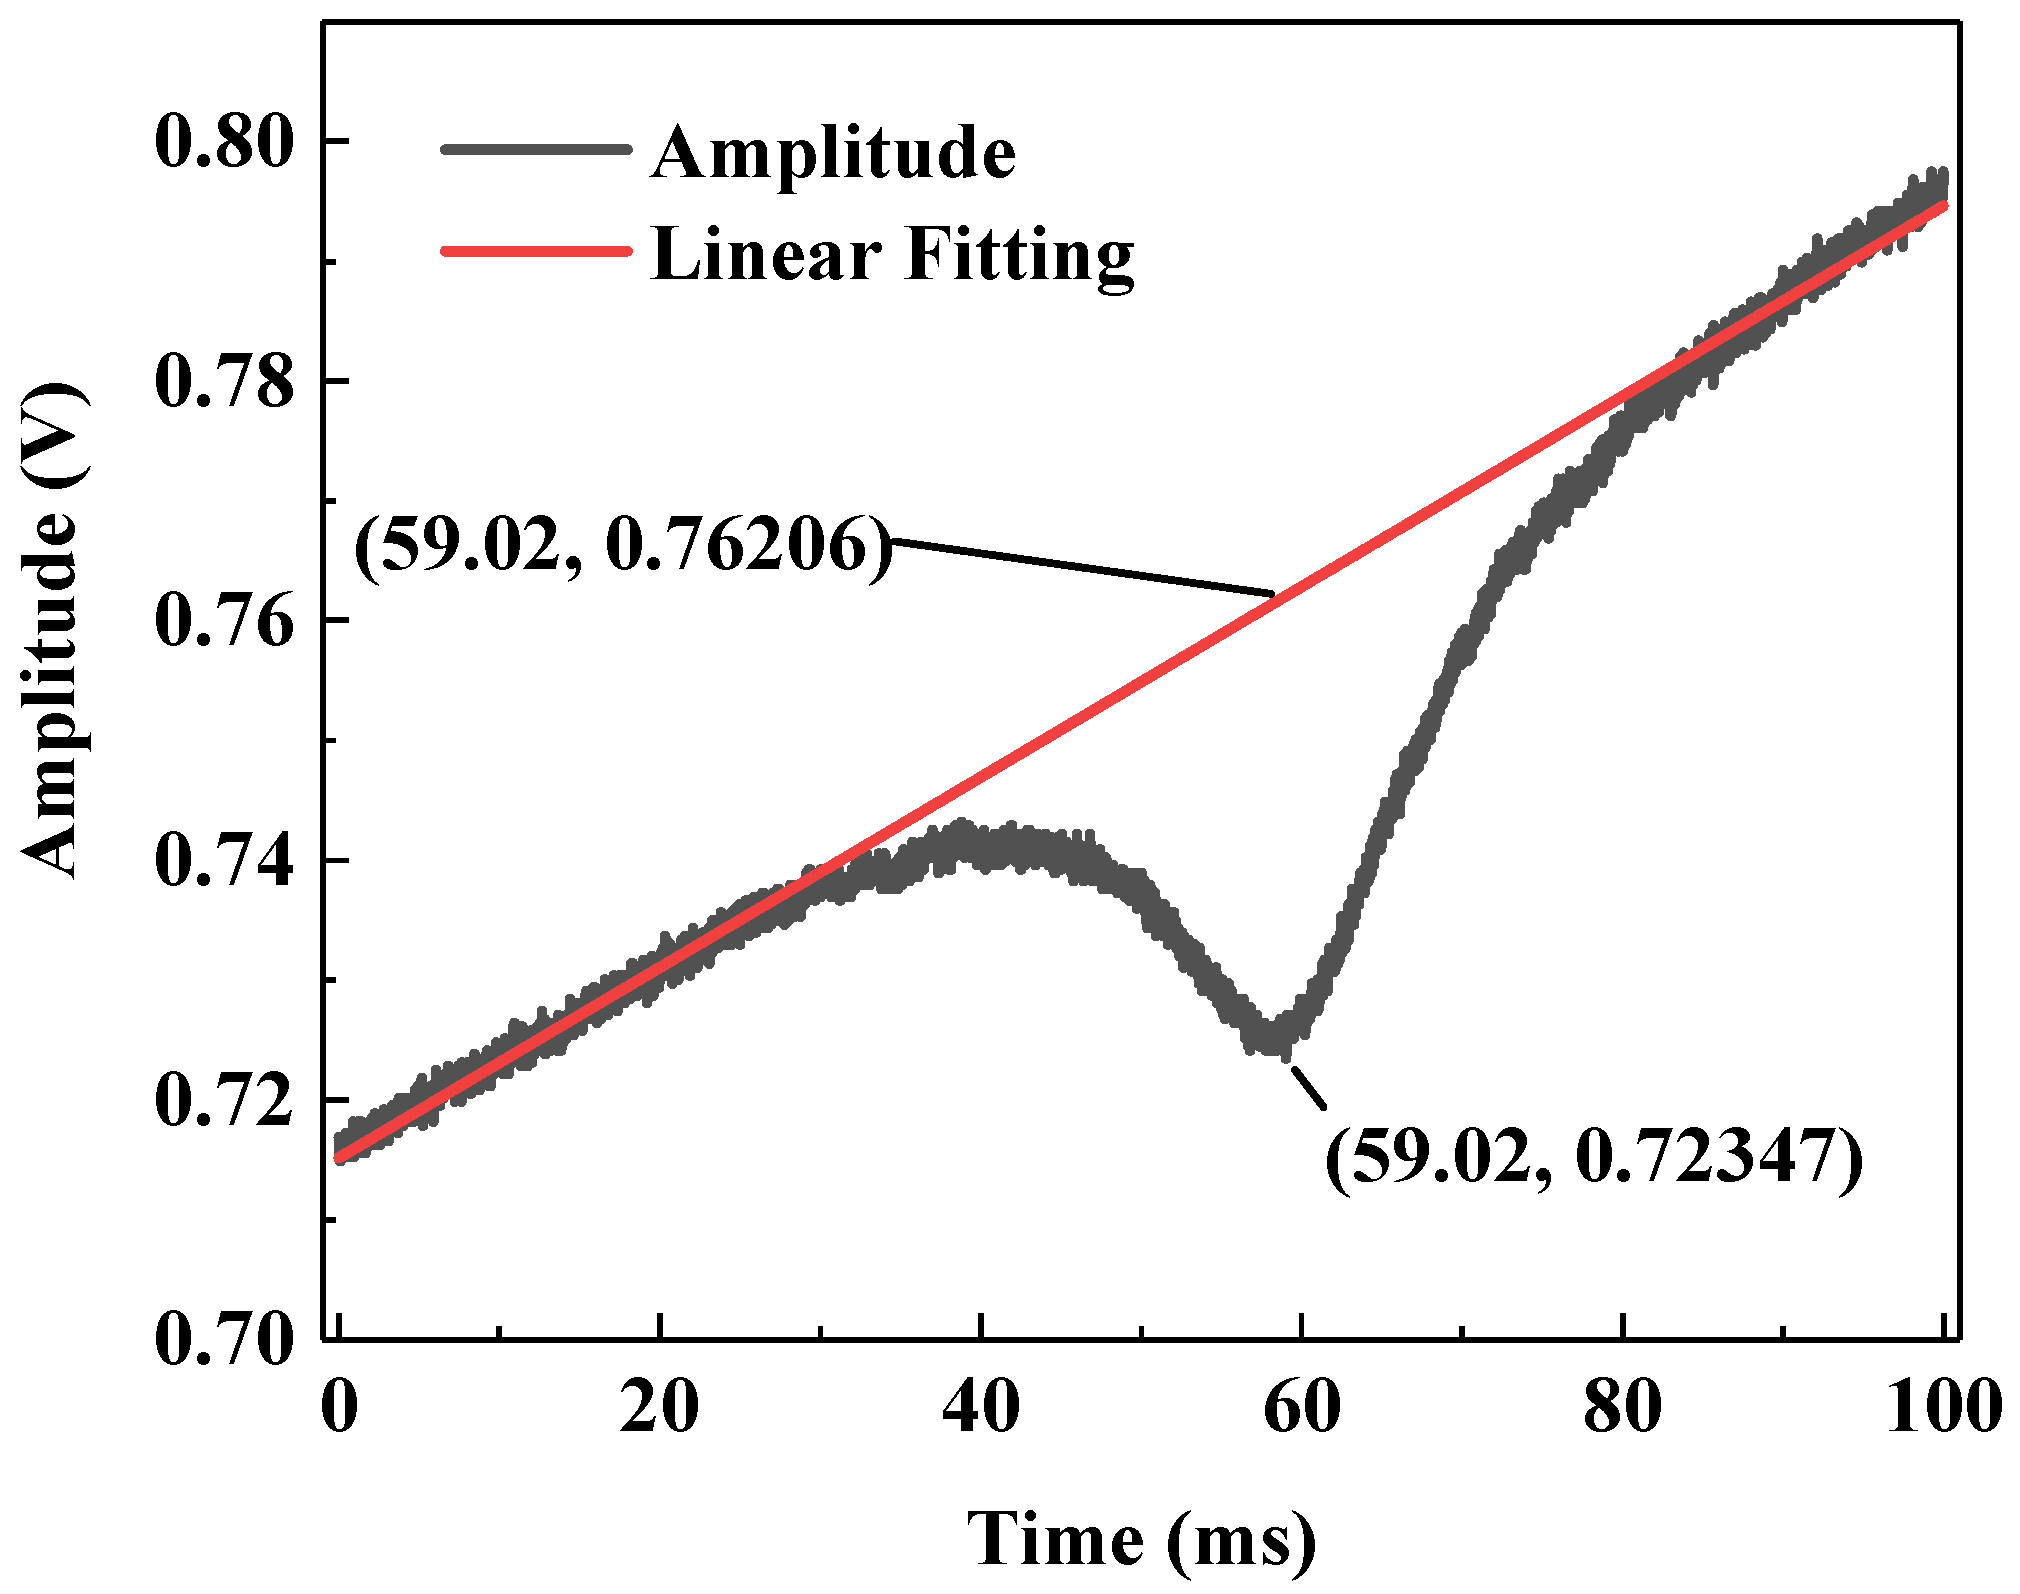
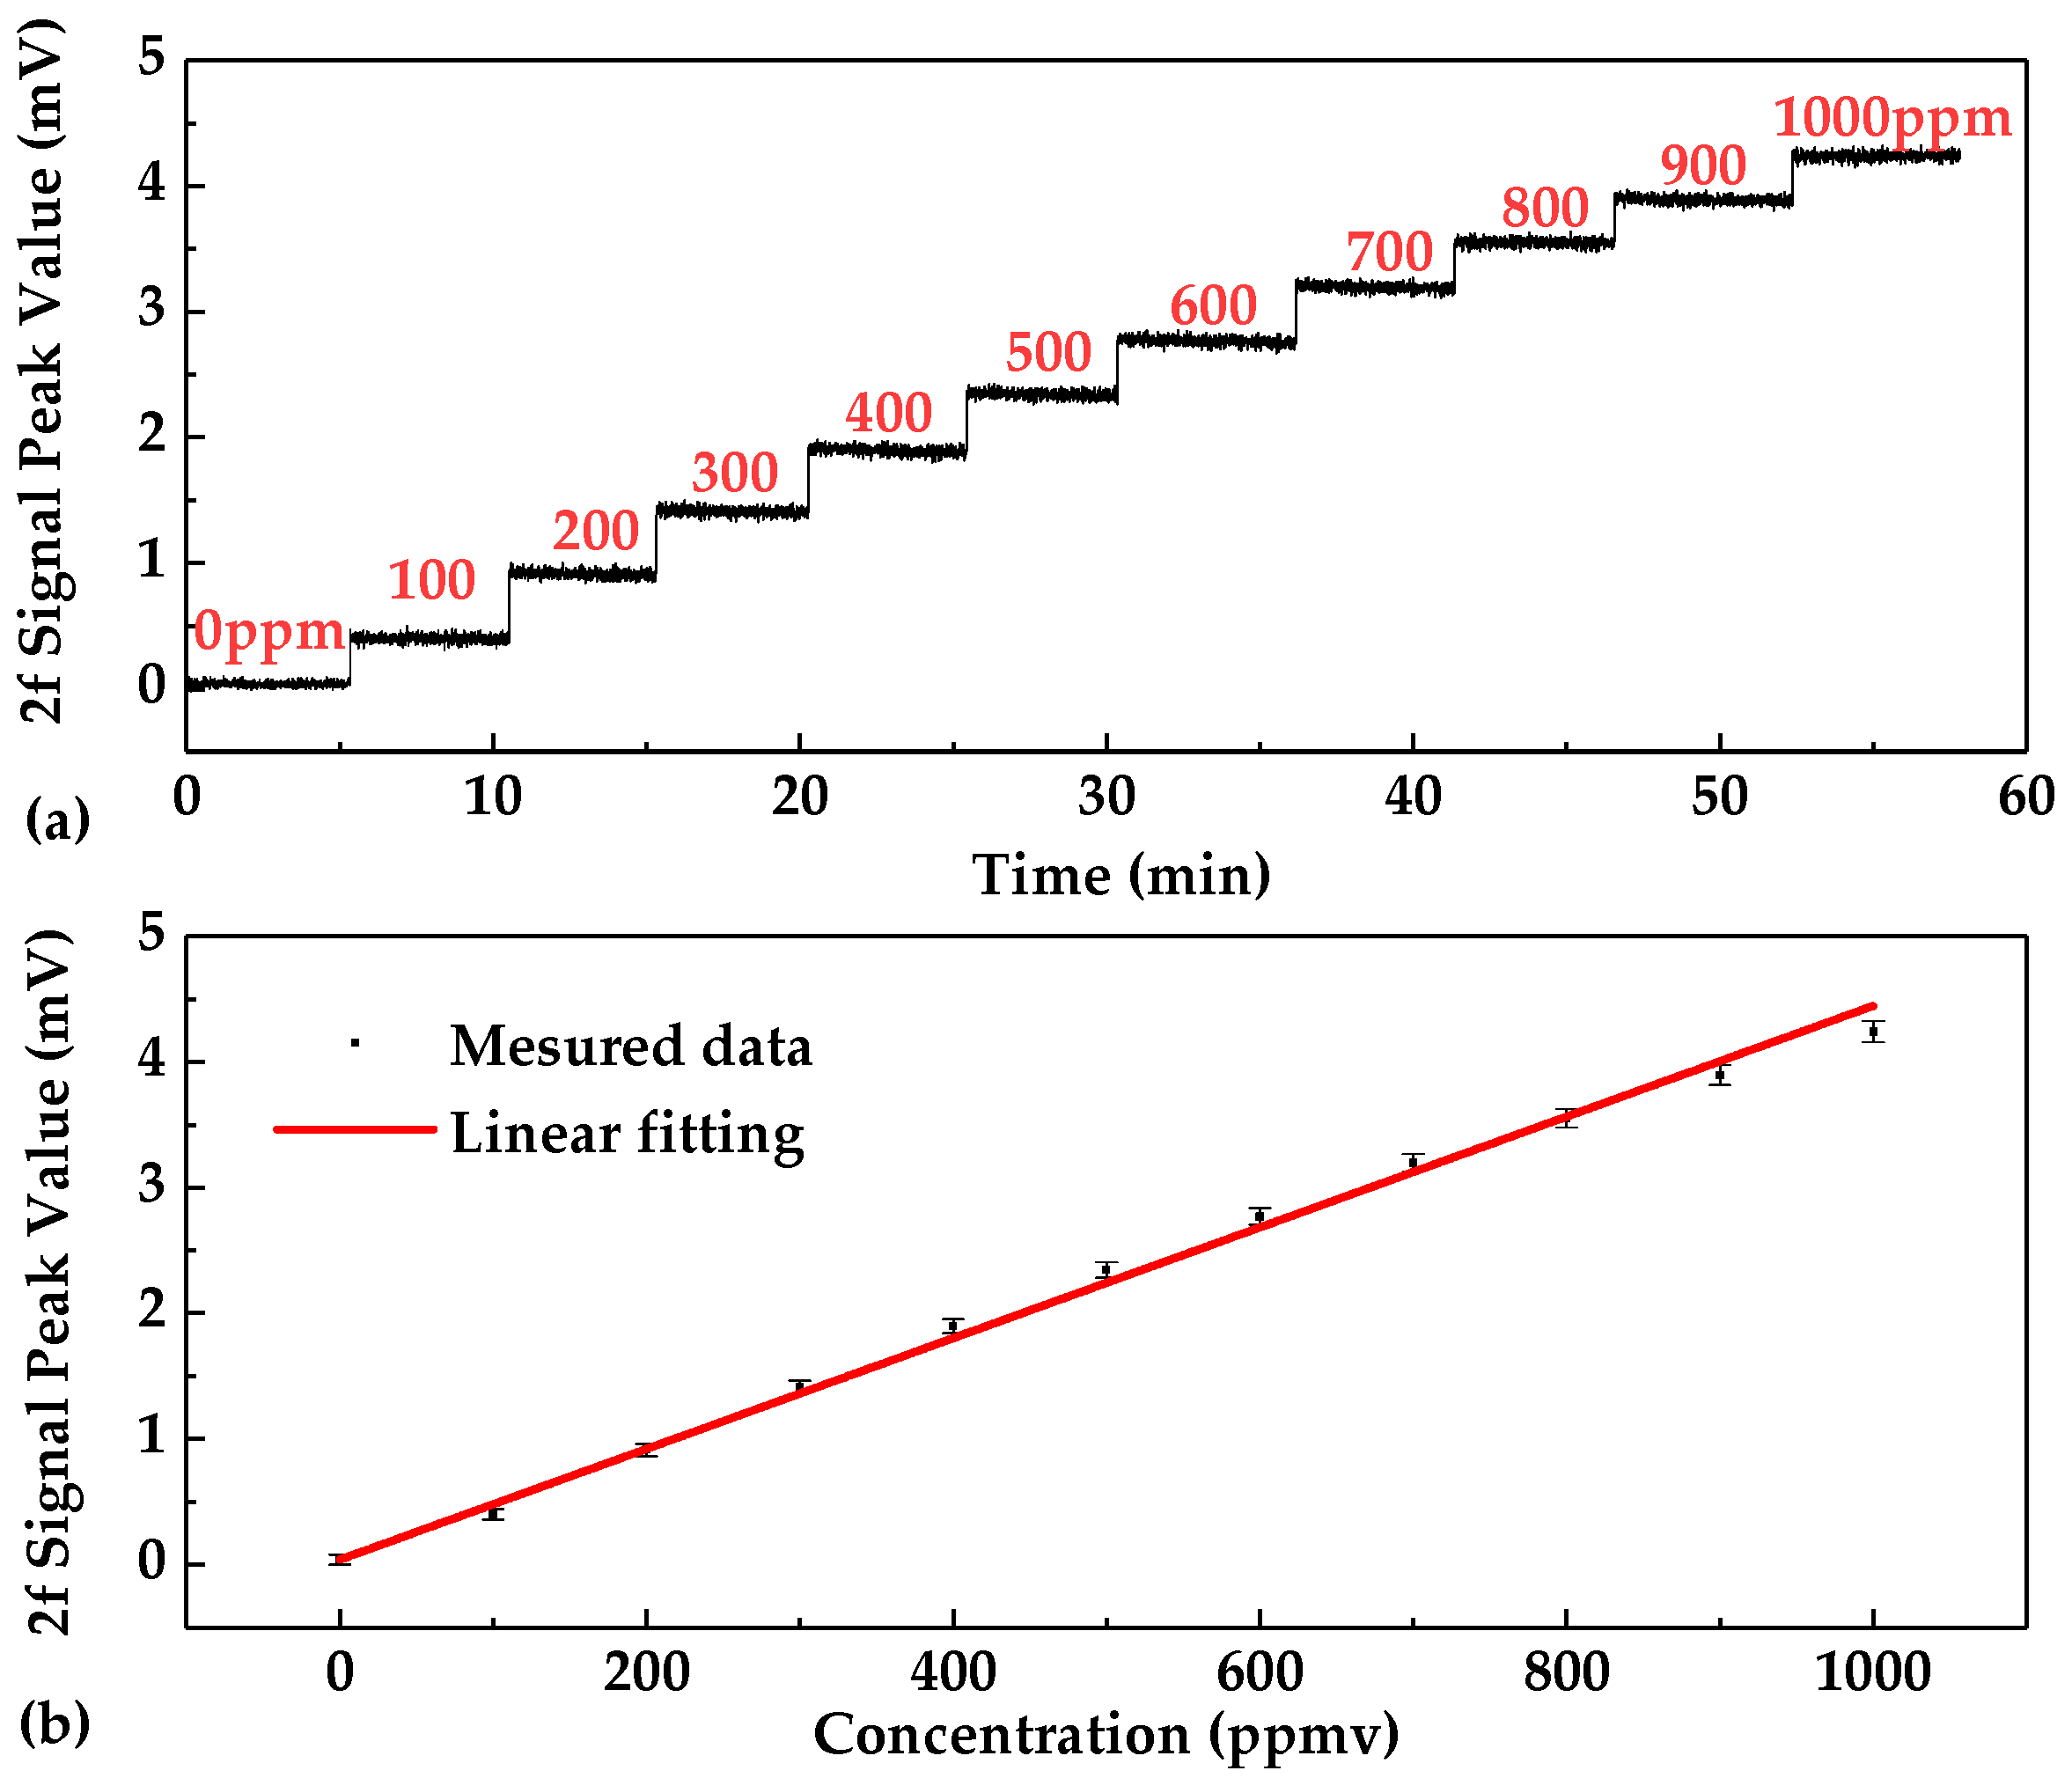
4.2. Calibration and Data Fitting

The output signal of the detector is transmitted to the laptop for 2f signal extraction based on LabVIEW. The C2H2 gas samples in the concentration range of 0–1000 ppmv with a step of 100 ppmv were prepared using the gas mixing system. Within the concentration range of 0–1000 ppm, the measured 2f signals for the gas samples with different concentration levels are shown in Figure 10.
Because the peak value of the 2f signal is linear with the concentration [21], the 2f signal amplitude was used to calibrate the sensor. As shown in Figure 11a, each gas sample was measured for ~5 min, and ~800 data points were obtained and then the mean value of the 2f signal amplitude was calculated and plotted as a function of C2H2 concentration. The linear relationship between the concentration (C) and the second harmonic peak (2f signal amplitude) is shown in Figure 11b. A fitting linear equation is observed and shown by Equation (4) (R-square value: 99.88%), given by:
2 f _ P e a k V a l u e ( m V ) = 0.00437 × C ( p p m ) + 0.03995
The fitting curve indicates a good linear relationship (R-square value: 99.88%) between the 2f amplitude and C2H2 concentration. The different errors for different concentration levels may result from the gas-mixing system for preparing different gas samples.

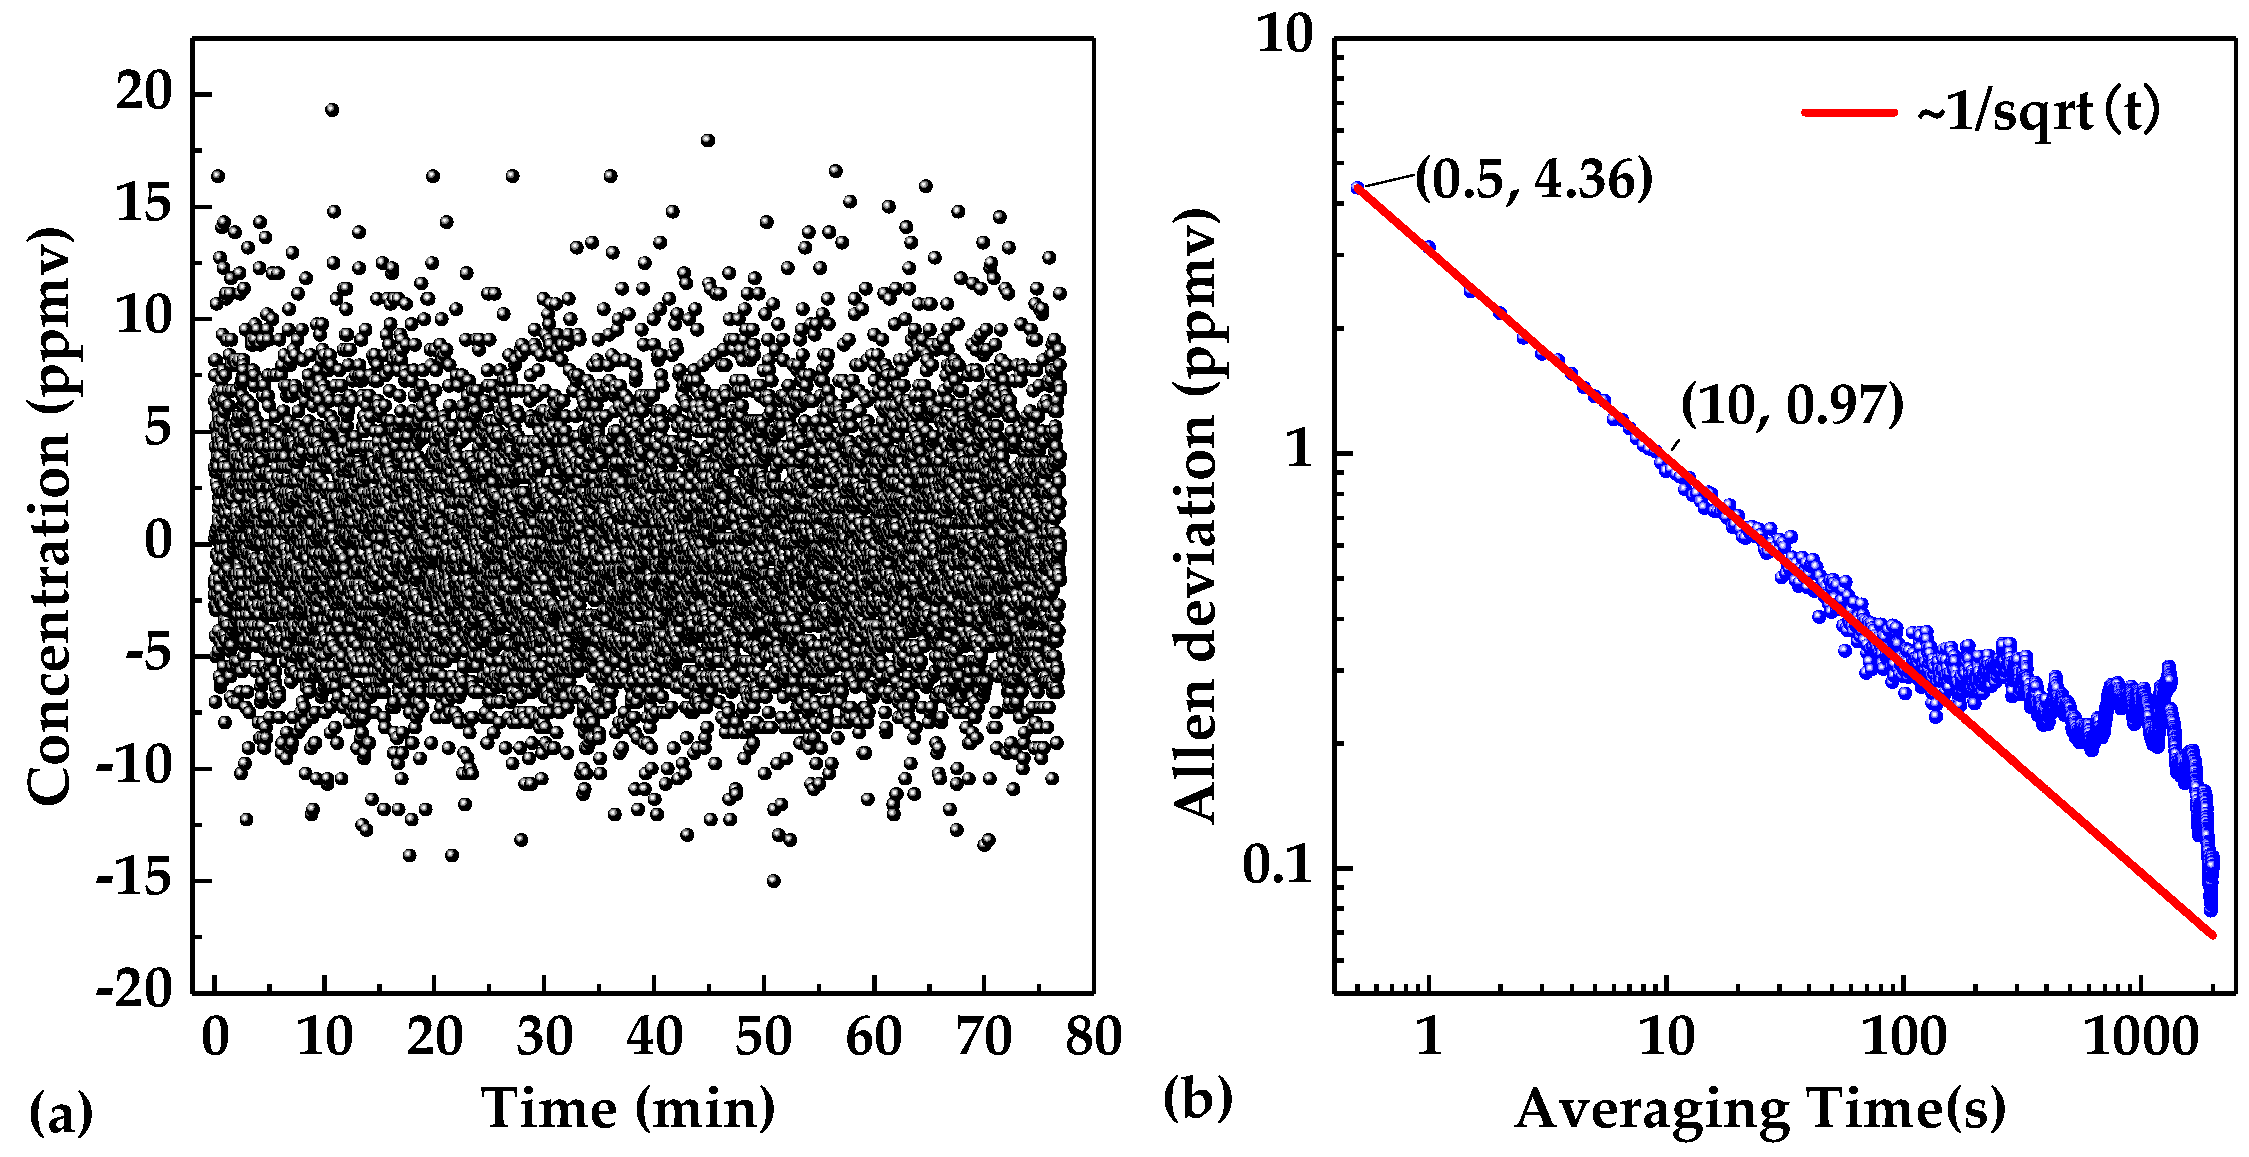
4.3. Sensor Stability

Sensor stability can be analyzed by carrying out an Allan deviation analysis on the sensor system. N2 was injected into the gas chamber for 2 h, and meanwhile, the 2f peak values were acquired and recorded via the LabVIEW platform. The 2f peak values were then converted into concentration levels according to Equation (4), as shown in Figure 12a. Under a C2H2 concentration level of 0 ppmv, the variation range of the acetylene sensor reading was from −15 ppmv to 20 ppmv. The noise of the sensor system leads to a fluctuation range of the measurement result, which can be reduced by averaging. Therefore Allan deviation can be used to analyze the limit of detection (LoD) under different averaging time. The LoD for different averaging time (τ) can be calculated by Allan deviation, as shown in Figure 12b. When the averaging time was 0.5 s, the LoD of the system was ~4.36 ppmv; when the averaging time exceeded 10 s, the LoD could be lower than 1 ppm. The Allan deviation decreased obeying the rule of ~1/√τ with τ ≤ 100 s. This indicated that the dominated noise in the system is White–Gaussian noise that can be removed by simply using the data averaging method.

5. Conclusions

A novel three mirror-based dense-pattern gas cell was proposed for gas detection based on infrared absorption spectroscopy. The gas cell had a smaller volume and a higher utilization rate due to the use of three mirrors than the traditional Herriott gas cell based on two mirrors. In order to accurately tune the positions and angles of the three mirrors, a novel mechanical structure was fabricated. A C2H2 sensor system was presented using this gas cell by targeting the line located at 6521.2 cm−1. Using the 2f-based WMS technique, C2H2 measurements were carried out to validate the accuracy of the modeling and formulation of the three mirror-based dense pattern gas cell. Future work is still required to find the rule of spot distribution on the three mirrors, which is important for improving the utilization rate of the mirrors and enlarging the optical path length with a small cell volume and a high reflection of the mirror.

Author Contributions

Methodology, G.Z.; software, G.Z. and Z.M.; validation, G.Z. and J.W.; resources, Y.W. and C.Z.; writing-original draft preparation, G.Z. and C.Z.; writing-review and editing, Y.Z. and F.K.T.; supervision, Y.W and C.Z. All authors have read and agreed to the published version of the manuscript.

Funding

This research was funded by the National Key R&D Program of China (No. 2016YFD0700101), National Natural Science Foundation of China (Nos. 61775079, 61627823, 61960206004), Science and Technology Development Program of Jilin Province, China (Nos. 20180201046GX, 20190101016JH).

Conflicts of Interest

The authors declare no conflict of interest.

References

  1. Zheng, K.Y.; Zheng, C.T.; Yao, D.; Liu, Z.D.; Li, J.H.; Zhang, Y.; Wang, Y.D.; Tittle, F.K. A near-infrared C2H2/CH4 dual-gas sensor system combining off-axis integrated-cavity output spectroscopy and frequency-division-multiplexing-based wavelength modulation spectroscopy. Analyst 2019, 144, 2003–2010. [Google Scholar] [CrossRef] [PubMed]
  2. Liu, N.W.; Deng, H.; He, T.B.; Liu, Y.; Zhang, L.; Li, J.S. Measurements of new absorption lines of acetylene at 1.53 μm using a tunable diode laser absorption spectrometer. Spectrochim. Acta Part A Mol. Biomol. Spectrosc. 2017, 186, 1–7. [Google Scholar] [CrossRef] [PubMed]
  3. Ma, G.M.; Zhao, S.J.; Jiang, J.; Song, H.T.; Li, C.R.; Luo, Y.T.; Wu, H. Tracing acetylene dissolved in transformer oil by tunable diode laser absorption spectrum. Sci. Rep. 2017, 7, 14961. [Google Scholar] [CrossRef] [PubMed] [Green Version]
  4. Kwak, D.; Lei, Y.; Maric, R. Ammonia gas sensors: A comprehensive review. Talanta 2019, 204, 713–730. [Google Scholar] [CrossRef] [PubMed]
  5. Alves, T.S.; Santos, J.S.; Fiorucci, A.R.; Arruda, G.J. A new simple electrochemical method for the determination of bisphenol a using bentonite as modifier. Mater. Sci. Eng. C Mater. Biol. Appl. 2019, 105, 110048. [Google Scholar] [CrossRef] [PubMed]
  6. Li, S.Z.; Dong, L.; Wu, H.P.; Yin, X.K.; Ma, W.G.; Zhang, L.; Yin, W.B.; Sampaolo, A.; Patimisco, P.; Spagnolo, V.; et al. Simultaneous multi-gas detection between 3 and 4 μm based on a 2.5-m multipass cell and a tunable fabry-perot filter detector. Spectrochim. Acta Part A Mol. Biomol. Spectrosc. 2019, 216, 154–160. [Google Scholar] [CrossRef] [PubMed]
  7. Shao, L.G.; Fang, B.; Zheng, F.; Qiu, X.B.; He, Q.X.; Wei, J.L.; Li, C.L.; Zhao, W.X. Simultaneous detection of atmospheric CO and CH4 based on TDLAS using a single 2.3 μm DFB laser. Spectrochim. Acta Part A Mol. Biomol. Spectrosc. 2019, 222, 117118. [Google Scholar] [CrossRef] [PubMed]
  8. Wang, B.; Lu, H.F.; Chen, C.; Chen, L.; Lian, H.Q.; Dai, T.X.; Chen, Y. Near-infrared C2H2 detection system based on single optical path time division multiplexing differential modulation technique and multi-reflection chamber. Appl. Sci. 2019, 9, 2637. [Google Scholar] [CrossRef] [Green Version]
  9. Li, X.; Fan, X.T.; He, Y.B.; Chen, B.; Yao, L.; Hu, M.; Kan, R.F. Development of a compact tunable diode laser absorption spectroscopy based system for continuous measurements of dissolved carbon dioxide in seawater. Rev. Sci. Instrum. 2019, 90, 065110. [Google Scholar] [CrossRef] [PubMed]
  10. Xie, Y.L.; Chang, J.; Chen, X.H.; Sun, J.C.; Zhang, Q.D.; Wang, F.P.; Zhang, Z.W.; Feng, Y.W. A DFB-LD internal temperature fluctuation analysis in a TDLAS system for gas detection. IEEE Photonics J. 2019, 11, 6801708. [Google Scholar] [CrossRef]
  11. Yang, C.G.; Mei, L.; Deng, H.; Xu, Z.Y.; Chen, B.; Kan, R.F. Wavelength modulation spectroscopy by employing the first harmonic phase angle method. Opt. Express 2019, 27, 12137–12146. [Google Scholar] [CrossRef] [PubMed]
  12. Li, C.L.; Shao, L.G.; Meng, H.Y.; Wei, J.L.; Qiu, X.B.; He, Q.S.; Ma, W.G.; Deng, L.H.; Chen, Y.Q. High-speed multi-pass tunable diode laser absorption spectrometer based on frequency-modulation spectroscopy. Opt. Express 2018, 26, 29330–29339. [Google Scholar] [CrossRef] [PubMed]
  13. Hayashi, D.; Nakai, J.; Minami, M.; Kamimoto, T.; Deguchi, Y. Simultaneous measurement of CH4 concentration and temperature distributions in a semiconductor process chamber. J. Phys. D Appl. Phys. 2019, 52, 485107. [Google Scholar] [CrossRef]
  14. Cui, R.Y.; Dong, L.; Wu, H.P.; Li, S.Z.; Yin, X.K.; Zhang, L.; Ma, W.G.; Yin, W.B.; Tittel, F.K. Calculation model of dense spot pattern multi-pass cells based on a spherical mirror aberration. Opt. Lett. 2019, 44, 1108–1111. [Google Scholar] [CrossRef] [PubMed] [Green Version]
  15. Yang, X.C.; Duan, L.C.; Zhang, H.W.; Lu, Y.; Wang, G.Y.; Yao, J.Q. Highly sensitive dual-wavelength fiber ring laser sensor for the low concentration gas detection. Sens. Actuator B Chem. 2019, 296, 126637. [Google Scholar] [CrossRef]
  16. Ma, Z.M.; Luo, Z.C.; Chang, T.Y.; Cheng, L.Y.; Wu, C.J.; Cui, H.L. Methane optical sensing system with polarization rotation gas cell. IEEE Sens. J. 2019, 19, 7415–7424. [Google Scholar]
  17. Yang, M.; Li, C.L.; Wei, J.L. A novel design of mutipass herriott type cell. Acta Sin. Quantum Opt. 2013, 19, 189–194. [Google Scholar]
  18. Mu, Y.J.; Chen, Y.; Hu, M.Y. Study and design of a kind of multi-pass white cell. Opt. Tech. 2014, 40, 345–348. [Google Scholar]
  19. Dong, M.; Zheng, C.T.; Yao, D.; Zhong, G.Q.; Miao, S.Z.; Ye, W.L.; Wang, Y.D.; Tittel, F.K. Double-range near-infrared acetylene detection using a dual spot-ring herriott cell (DSR-HC). Opt. Express 2018, 26, 12091. [Google Scholar] [CrossRef] [Green Version]
  20. Available online: http://www.spectraplot.com/absorption (accessed on 9 January 2019).
  21. Reid, J.; Labrie, D. Second-harmonic detection with tunable diode lasers-comparison of experiment and theory. Appl. Phys. B 1981, 26, 203–210. [Google Scholar] [CrossRef]
Figure 1. (a) The structural parameters in the XOY plane and (b) the three-dimensional CAD model of the three-mirror-based gas cell.
Sensors 20 01266 g001
Figure 2. The simulated reflection number and spot distribution on mirror A, B and C.
Sensors 20 01266 g002
Figure 3. The simulated reflection number and spot distribution on mirror A with (a1) Bx + 0.5 mm, (b1) Bx − 0.5 mm, (a2) Cx + 0.5 mm, (b2) Cx − 0.5 mm, (a3) By + 0.5 mm, (b3) By − 0.5 mm, (a4) Cy + 0.5 mm, (b4) Cy − 0.5 mm.
Sensors 20 01266 g003
Figure 4. The spot distribution of a two mirror-based Herriott cell on Mirror A with (a) D, (b) D + 0.5 mm and (c) D − 0.5 mm.
Sensors 20 01266 g004
Figure 5. (a) Relation between the shift distance of the exit spot on mirror A and the reflection times before and after changes added to Bx, By, Cx, Cy for the three mirror-based gas cell. (b) Relation between the shift distance of the exit spot on mirror A and the reflection times before and after changes added to D for the two mirror-based gas cell.
Sensors 20 01266 g005
Figure 6. (a) A 3D model of the mechanical adjusting structure. (b) A photo of the developed gas cell for gas detection with a gas inlet and an outlet.
Sensors 20 01266 g006
Figure 7. The measured spot shape and distribution on (a) mirror A, (b) mirror B, and (c) mirror C for the optimized three mirror-based gas cell. (d) The 55th and 58th spots on mirror C. (e) Spot distribution on mirror C after blocking the 54th spot.
Sensors 20 01266 g007
Figure 8. Measured C2H2 absorption signal (black curve) with the reported three mirror-based gas cell at a concentration level of 2000 ppmv. The red curve shows the background fitting signal.
Sensors 20 01266 g008
Figure 9. Schematic of the near-infrared C2H2 sensor system using the three mirror-based gas cell, including an electrical system, an optical system, as well as a gas sampling system.
Sensors 20 01266 g009
Figure 10. The observed 2f signals in the C2H2 concentration range of 0–1000 ppm.
Sensors 20 01266 g010
Figure 11. (a) Measured 2f signal amplitude versus calibration time t for different C2H2 concentration levels ranging from 0 to 1000 ppmv. (b) Experimental data dots and fitting curve of C2H2 concentration versus the 2f signal amplitude.
Sensors 20 01266 g011
Figure 12. (a) C2H2 concentration measurements of the sample with zero concentration for a time period of >1 hour. (b) Allan deviation plot of the C2H2 sensor with a sampling interval of 0.5 s based on the data shown in Figure 12a.
Sensors 20 01266 g012
Table 1. The parameters used in the simulation in Figure 2.
ParametersBxByCxCyθBθCαβ
Value201mm63 mm201 mm63 mm53°53°19.5°
Table 2. The parameters used in the simulation of Herriott.
ParametersDfxyzαβ
Value248 mm100 mm−199.7 mm9 mm0 mm−2.1°2.5°
Table 3. The parameters and models of the key modules used in the sensor system.
ModuleLaserLaser Current Driver and Temperature Controller
Wavenumber rangeModelCurrent rangeTemperature
Value/Type6520.4−6522.0 cm−1LDTC0520, Wavelength Electronics, USA38–96 mA23.8 °C
ModuleDetectorData acquisition card
ModelModelSampling rate
Value/TypePDA10, Thorlabs, USAUSB-6211, National Instrument, USA100 kHz

