Effects and Mechanism of Surface Water Wettability and Operating Frequency on Response Linearity of Flexible IDE Capacitive Humidity Sensor


Abstract
:1. Introduction
2. Materials and Methods
2.1. Fabrication of Flexible IDE Capacitive Humidity Sensor
2.2. Measurement of Humidity Response and Analysis of Response Linearity
2.3. FEM Simulation of IDE Capacitive Humidity Sensor
3. Results and Discussion
3.1. Effect of Surface Water Wettability and Operating Frequency on Response Linearity
3.2. Effects of Surface Water Droplets on Sensor Capacitance
3.3. Mechanism for the Effects of Surface Water Wettability and Operating Frequency
4. Conclusions
Author Contributions
Funding
Institutional Review Board Statement
Informed Consent Statement
Data Availability Statement
Conflicts of Interest
References
- Fenner, R.; Zdankiewicz, E. Micromachined water vapor sensors: A review of sensing technologies. IEEE Sens. J. 2001, 1, 309–317. [Google Scholar] [CrossRef]
- Farahani, H.; Wagiran, R.; Hamidon, M.N. Humidity sensors principle, mechanism, and fabrication technologies: A comprehensive review. Sensors 2014, 14, 7881–7939. [Google Scholar] [CrossRef] [Green Version]
- Najeeb, M.A.; Ahmad, Z.; Shakoor, R.A. Organic thin-film capacitive and resistive humidity sensors: A focus review. Adv. Mater. Interfaces 2018, 5, 1800969. [Google Scholar] [CrossRef]
- Reddy, A.S.G.; Narakathu, B.B.; Atashbar, M.Z.; Rebros, M.; Hrehorova, E.; Bazuin, B.J.; Joyce, M.K.; Fleming, P.D.; Pekarovicova, A. Printed capacitive based humidity sensors on flexible substrates. Sens. Lett. 2011, 9, 869–871. [Google Scholar] [CrossRef]
- Oprea, A.; Bârsan, N.; Weimar, U.; Bauersfeld, M.-L.; Ebling, D.; Wöllenstein, J. Capacitive humidity sensors on flexible RFID labels. Sens. Actuators B Chem. 2008, 132, 404–410. [Google Scholar] [CrossRef]
- Rivadeneyra, A.; Fernández-Salmerón, J.; Agudo, M.; López-Villanueva, J.A.; Capitan-Vallvey, L.F.; Palma, A.J. Design and characterization of a low thermal drift capacitive humidity sensor by inkjet-printing. Sens. Actuators B Chem. 2014, 195, 123–131. [Google Scholar] [CrossRef]
- Li, B.; Tian, Q.; Su, H.; Wang, X.; Wang, T.; Zhang, D. High sensitivity portable capacitive humidity sensor based on In2O3 nanocubes-decorated GO nanosheets and its wearable application in respiration detection. Sens. Actuators B Chem. 2019, 299, 126973. [Google Scholar] [CrossRef]
- Lan, L.; Le, X.; Dong, H.; Xie, J.; Ying, Y.; Ping, J. One-step and large-scale fabrication of flexible and wearable humidity sensor based on laser-induced graphene for real-time tracking of plant transpiration at bio-interface. Biosens. Bioelectron. 2020, 165, 112360. [Google Scholar] [CrossRef] [PubMed]
- Mraović, M.; Muck, T.; Pivar, M.; Trontelj, J.; Pleteršek, A. Humidity sensors printed on recycled paper and cardboard. Sensors 2014, 14, 13628–13643. [Google Scholar] [CrossRef] [Green Version]
- Romero, F.J.; Rivadeneyra, A.; Salinas-Castillo, A.; Ohata, A.; Morales, D.P.; Becherer, M.; Rodriguez, N. Design, fabrication and characterization of capacitive humidity sensors based on emerging flexible technologies. Sens. Actuators B Chem. 2019, 287, 459–467. [Google Scholar] [CrossRef]
- Boudaden, J.; Steinmaßl, M.; Endres, H.-E.; Drost, A.; Eisele, I.; Kutter, C.; Müller-Buschbaum, P. Polyimide-based capacitive humidity sensor. Sensors 2018, 18, 1516. [Google Scholar] [CrossRef] [Green Version]
- Schubert, P.J.; Navin, J.H. A polyimide-based capacitive humidity sensor. IEEE Trans. Electron Devices 1985, 32, 1220–1223. [Google Scholar] [CrossRef]
- Matsuguchi, M.; Sadaoka, Y.; Sakai, Y. A capacitive-type humidity sensor using cross-linked poly(methyl methacrylate) thin films. J. Electrochem. Soc. 1991, 38, 1862–1865. [Google Scholar] [CrossRef]
- Ducéré, V.; Bernès, A.; Lacabanne, C. A capacitive humidity sensor using cross-linked cellulose acetate butyrate. Sens. Actuators B Chem. 2005, 106, 331–334. [Google Scholar] [CrossRef] [Green Version]
- Sadaoka, Y. Chapter 3: Capacitive-type relative humidity sensor with hydrophobic polymer films. In Solid State Gas Sensing; Comini, E., Faglia, G., Sberveglieri, G., Eds.; Springer: New York, NY, USA, 2009; pp. 109–151. [Google Scholar]
- Zhou, R.; Li, J.; Jiang, H.; Li, H.; Wang, Y.; Briand, D.; Camara, M.; Zhou, G.; de Rooij, N.F. Highly transparent humidity sensor with thin cellulose acetate butyrate and hydrophobic AF1600X vapor permeating layers fabricated by screen printing. Sens. Actuators B Chem. 2019, 281, 212–220. [Google Scholar] [CrossRef]
- Fan, Z.; Zhi, C.; Wu, L.; Zhang, P.; Feng, C.; Deng, L.; Yu, B.; Qian, L. UV/ozone-assisted rapid formation of high-quality tribological self-assembled monolayer. Coatings 2019, 9, 762. [Google Scholar] [CrossRef] [Green Version]
- Lin, T.-Y.; Pfeiffer, T.T.; Lillehoj, P.B. Stability of UV/ozone-treated thermoplastics under different storage conditions for microfluidic analytical devices. RCS Adv. 2017, 7, 37374. [Google Scholar] [CrossRef] [Green Version]
- Lee, J.-W.; Hwang, W. Simple fabrication of superoleophobic titanium surfaces via hierarchical microhorn/nanoporous structure growth by chemical acid etching and anodization. J. Alloys Compd. 2017, 728, 966–970. [Google Scholar] [CrossRef]
- Kang, Y.; Ju, S. Graphene-filter-mounted tin-oxide-nanowire-transistor for chemical sensor. Semicond. Sci. Technol. 2018, 33, 125013. [Google Scholar] [CrossRef]
- Lee, Y.; Cha, S.H.; Kim, Y.-W.; Choi, D.; Sun, J.-Y. Transparent and attachable ionic communicators based on self-cleanable triboelectric nanogenerators. Nat. Commun. 2018, 9, 1804. [Google Scholar] [CrossRef]
- Li, X.B.; Larson, S.D.; Zyuzin, A.S.; Mamishev, A.V. Design principles for multichannel fringing electric field sensors. IEEE Sens. J. 2006, 6, 434–440. [Google Scholar] [CrossRef]
- Goswami, M.P.; Montazer, B.; Sarma, U. Design and characterization of a fringing field capacitive soil moisture sensor. IEEE Trans. Instrum. Meas. 2019, 68, 913–922. [Google Scholar] [CrossRef]
- Liu, Y.; Su, C.; Ren, X.; Fan, C.; Zhou, W.; Wang, F.; Ding, W. Experimental study on surface modification of PET films under bipolar nanosecond-pulse dielectric barrier discharge in atmospheric air. Appl. Surf. Sci. 2014, 313, 53–59. [Google Scholar] [CrossRef]
- Küchler, F.; Färber, R.; Franck, C.M. Humidity and temperature effects on the dielectric properties of PET film. In Proceedings of the 38th IEEE Electrical Insulation Conference (EIC), Virtual, 22 June–3 July 2020; pp. 179–183. [Google Scholar]
- Angulo-Sherman, A.; Mercado-Uribe, H. Dielectric spectroscopy of water at low frequencies: The existence of an isopermitive point. Chem. Phys. Lett. 2011, 503, 327–330. [Google Scholar] [CrossRef] [Green Version]
- Choi, J.M.; Kim, T.W. Humidity sensor using an air capacitor. Trans. Electr. Electron. Mater. 2013, 14, 182–186. [Google Scholar] [CrossRef] [Green Version]
- Cular, S. The Measurement and Uncertainty of Air Dielectric Capacitors from 1 kHz to 10 MHz. Available online: https://www.osti.gov/servlets/purl/1504063 (accessed on 1 June 2021).
- Jensen, K.R.; Fojan, P.; Jensen, R.L.; Gurevich, L. Water condensation: A multiscale phenomenon. J. Nanosci. Nanotechnol. 2014, 14, 1859–1871. [Google Scholar] [CrossRef]
- Yang, Q.; Sun, P.Z.; Fumagalli, L.; Stebunov, Y.V.; Haigh, S.J.; Zhou, Z.W.; Grigorieva, I.V.; Wang, F.C.; Geim, A.K. Capillary condensation under atomic-scale confinement. Nature 2020, 588, 250–253. [Google Scholar] [CrossRef]
- Yamada, Y.; Ikuta, T.; Nishiyama, T.; Takahashi, K.; Takata, Y. Droplet nucleation on a well-defined hydrophilic–hydrophobic surface of 10 nm order resolution. Langmuir 2014, 30, 14532–14537. [Google Scholar] [CrossRef] [PubMed]
- Varanasi, K.K.; Hsu, M.; Bhate, N.; Yang, W.; Deng, T. Spatial control in the heterogeneous nucleation of water. Appl. Phys. Lett. 2009, 95, 094101. [Google Scholar] [CrossRef]
- Kajiya, T.; Schellenberger, F.; Papadopoulos, P.; Vollmer, D.; Butt, H.-J. 3D imaging of water-drop condensation on hydrophobic and hydrophilic lubricant-impregnated surfaces. Sci. Rep. 2016, 6, 23687. [Google Scholar] [CrossRef] [PubMed] [Green Version]
- Ranathunga, D.T.S.; Shamir, A.; Dai, X.; Nielsen, S.O. Molecular dynamics simulations of water condensation on surfaces with tunable wettability. Langmuir 2020, 36, 7383–7391. [Google Scholar] [CrossRef] [PubMed]


| Surface | Before Surface Treatment | After UVO Irradiation | After SAM Coating |
|---|---|---|---|
| PET | 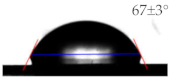 |  | 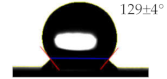 |
| Ag |  |  |  |
Publisher’s Note: MDPI stays neutral with regard to jurisdictional claims in published maps and institutional affiliations. |
© 2021 by the authors. Licensee MDPI, Basel, Switzerland. This article is an open access article distributed under the terms and conditions of the Creative Commons Attribution (CC BY) license (https://creativecommons.org/licenses/by/4.0/).
Share and Cite
Yang, W.S.; Han, S.; Lim, G.-R.; Kim, H.Y.; Hong, S.-H. Effects and Mechanism of Surface Water Wettability and Operating Frequency on Response Linearity of Flexible IDE Capacitive Humidity Sensor. Sensors 2021, 21, 6633. https://doi.org/10.3390/s21196633
Yang WS, Han S, Lim G-R, Kim HY, Hong S-H. Effects and Mechanism of Surface Water Wettability and Operating Frequency on Response Linearity of Flexible IDE Capacitive Humidity Sensor. Sensors. 2021; 21(19):6633. https://doi.org/10.3390/s21196633
Chicago/Turabian StyleYang, Woo Seok, Seungoh Han, Gyu-Ri Lim, Hyun You Kim, and Sung-Hoon Hong. 2021. "Effects and Mechanism of Surface Water Wettability and Operating Frequency on Response Linearity of Flexible IDE Capacitive Humidity Sensor" Sensors 21, no. 19: 6633. https://doi.org/10.3390/s21196633