Author Contributions
Conceptualization, J.Z., B.P., H.S., A.S. and B.A.; methodology, J.Z.; software, J.Z.; validation, J.Z. and B.P.; formal analysis, J.Z.; investigation, J.Z.; resources, J.Z., B.P. and B.A.; data curation, J.Z.; writing—original draft preparation, J.Z.; writing—review and editing, J.Z., B.P., H.S., A.S. and B.A.; visualization, J.Z.; supervision, B.P., H.S., A.S. and B.A.; project administration, B.A., B.P. and J.Z.; funding acquisition, B.A. All authors have read and agreed to the published version of the manuscript.
Figure 1.
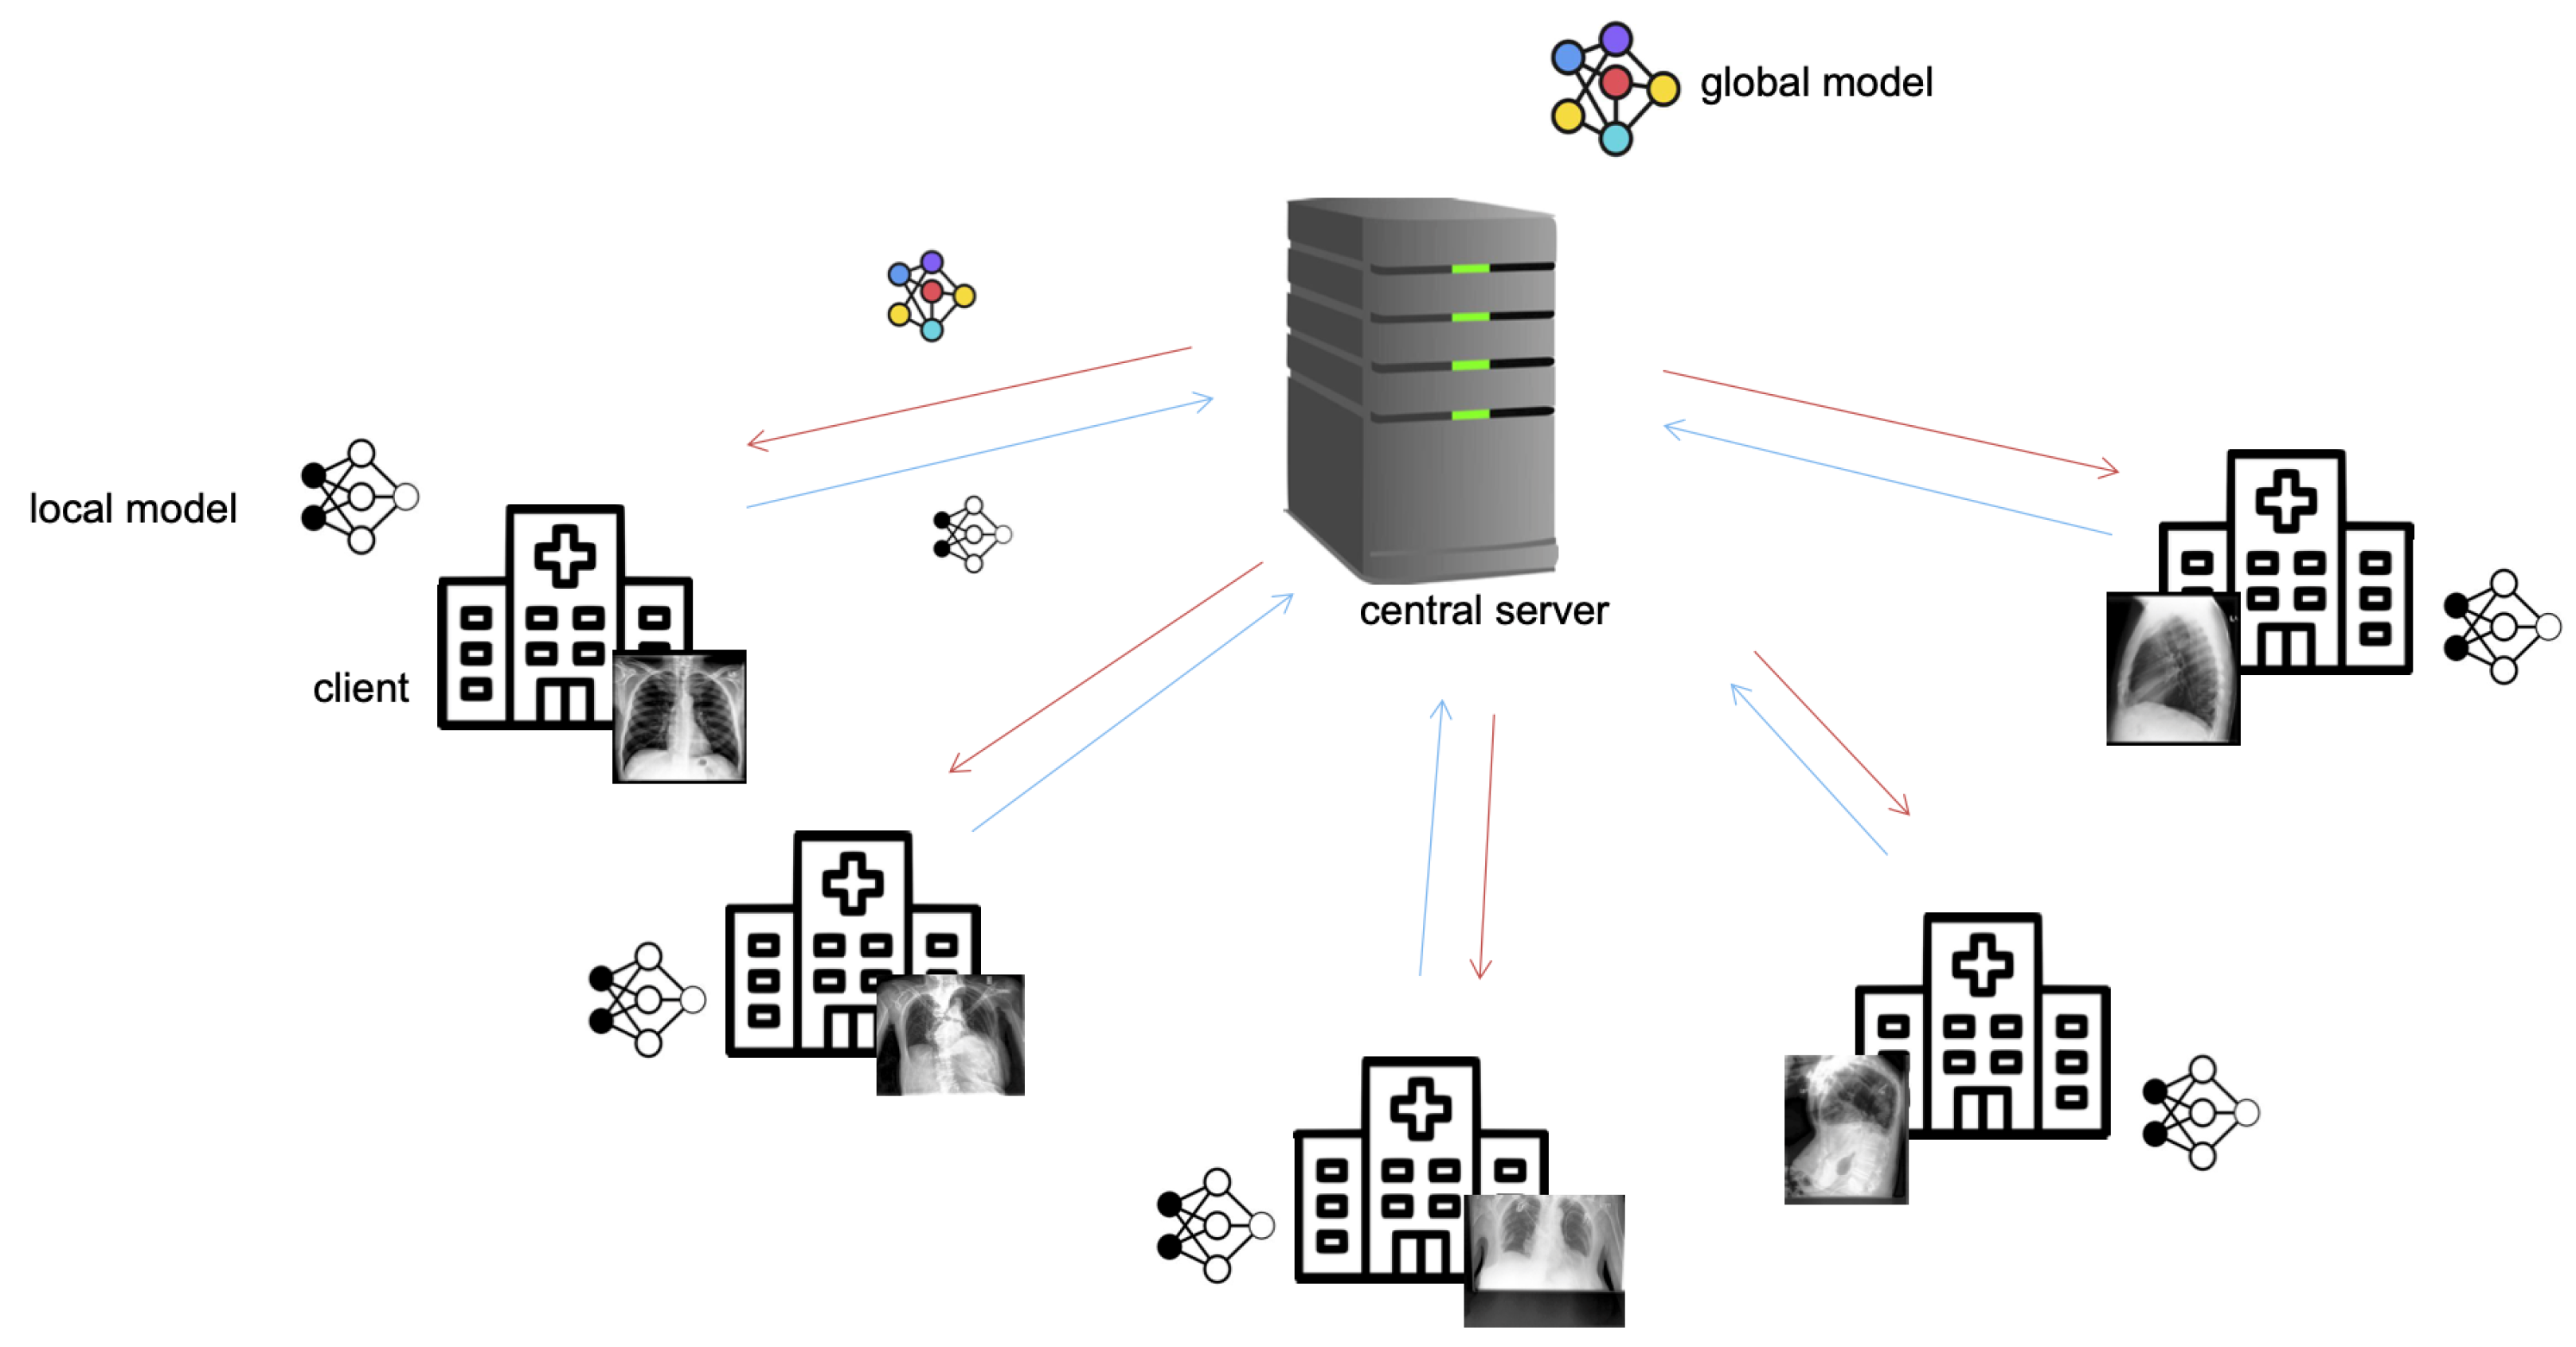
In the federated learning setup, the server first initializes a model and distributes the model parameters to its clients. Over several iterations, each client trains the model individually on its data for a defined number of local epochs, sends the parameters of its locally trained model back to the server for aggregation, and receives a global model, aggregated from all trained local models.
Figure 1.
In the federated learning setup, the server first initializes a model and distributes the model parameters to its clients. Over several iterations, each client trains the model individually on its data for a defined number of local epochs, sends the parameters of its locally trained model back to the server for aggregation, and receives a global model, aggregated from all trained local models.
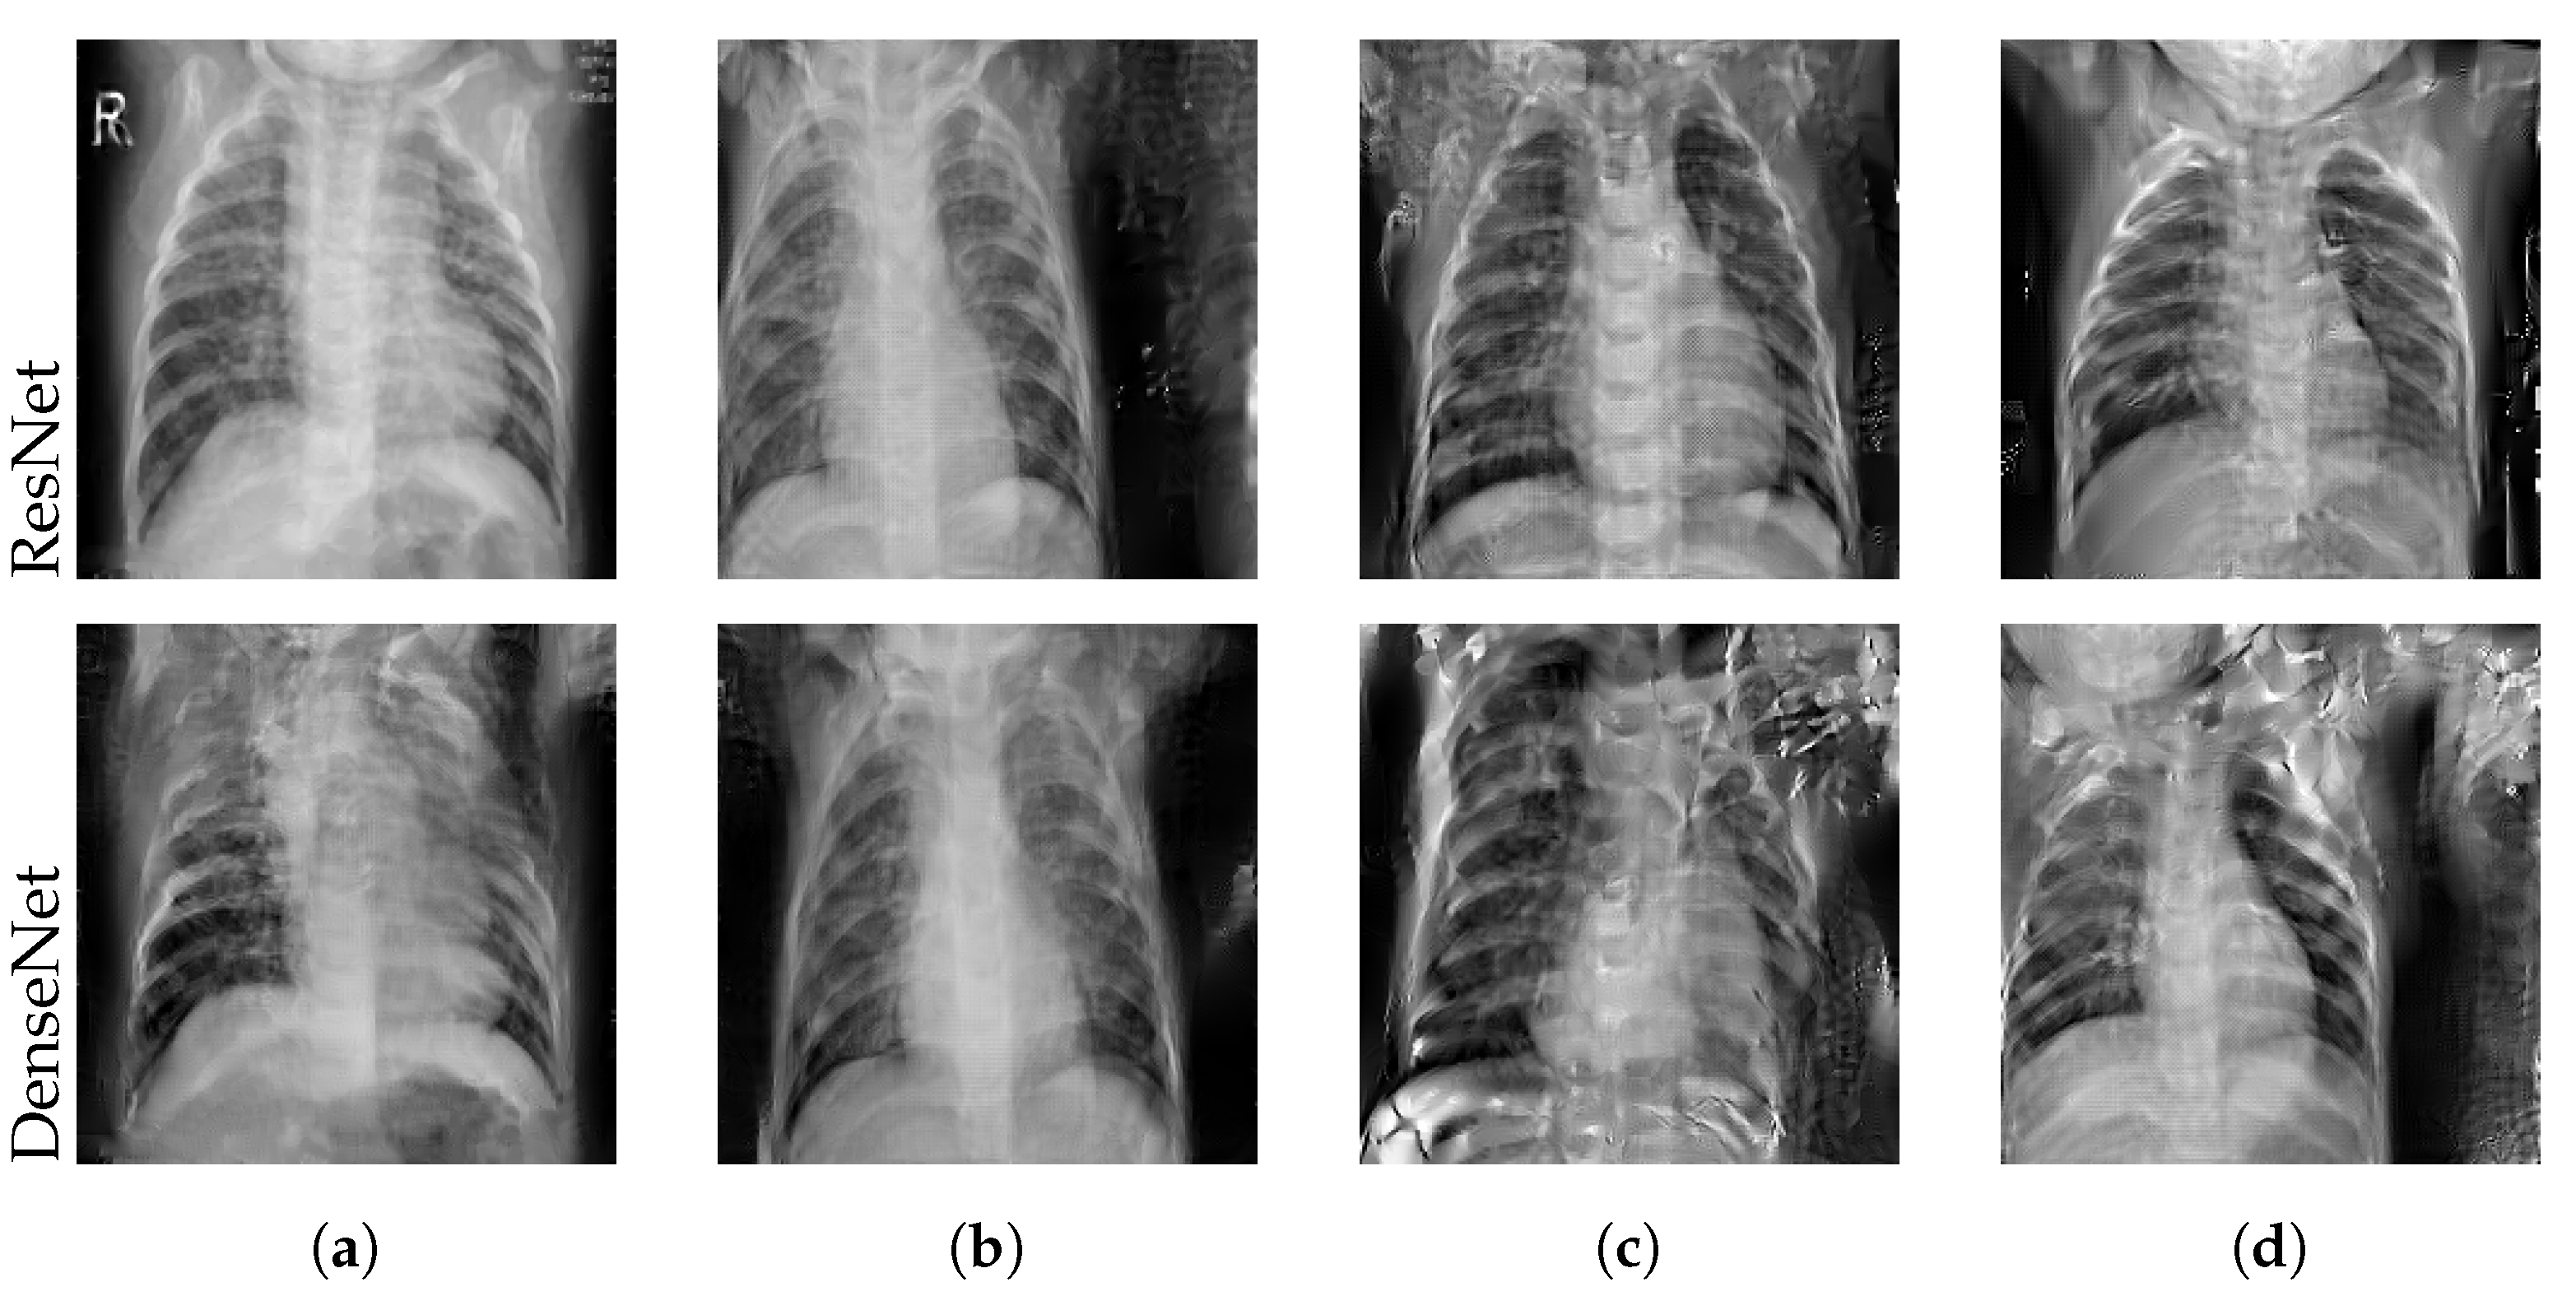
Figure 2.
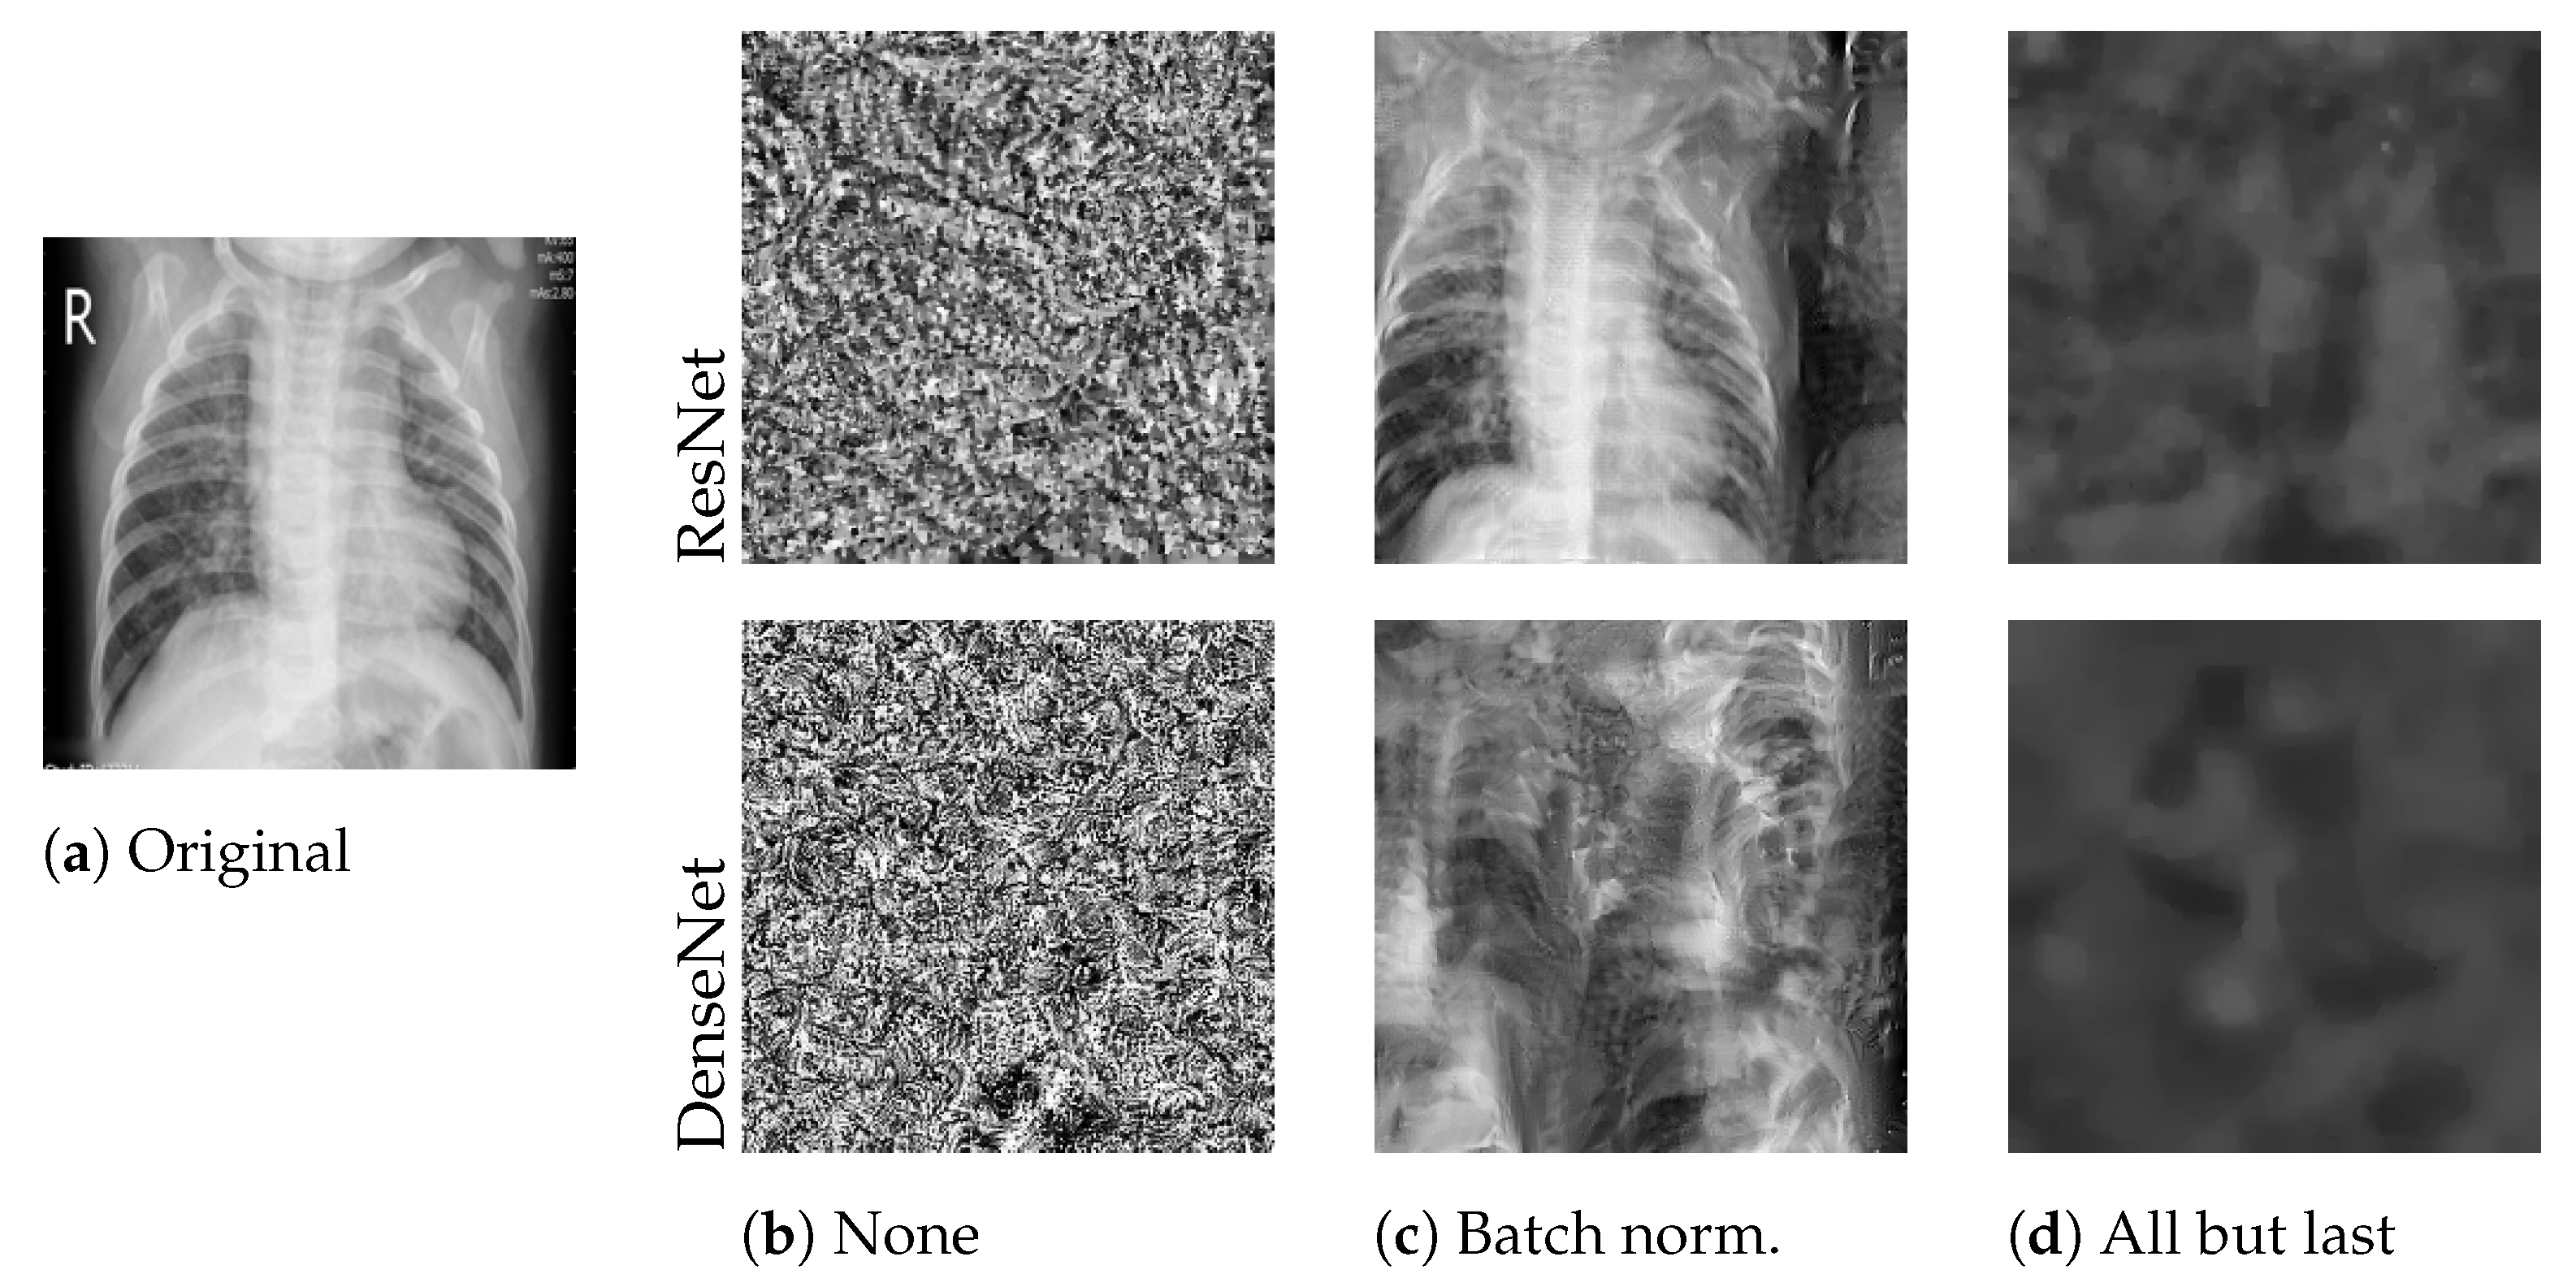
Best reconstructed images with varying layer freezing techniques. We attacked the locally trained model from a client holding a single Mendeley image (a). None (b) refers to full model training, Batch norm. (c) to freezing batch normalization layers, and All but last (d) to only training the output layer.
Figure 2.
Best reconstructed images with varying layer freezing techniques. We attacked the locally trained model from a client holding a single Mendeley image (a). None (b) refers to full model training, Batch norm. (c) to freezing batch normalization layers, and All but last (d) to only training the output layer.
Figure 3.
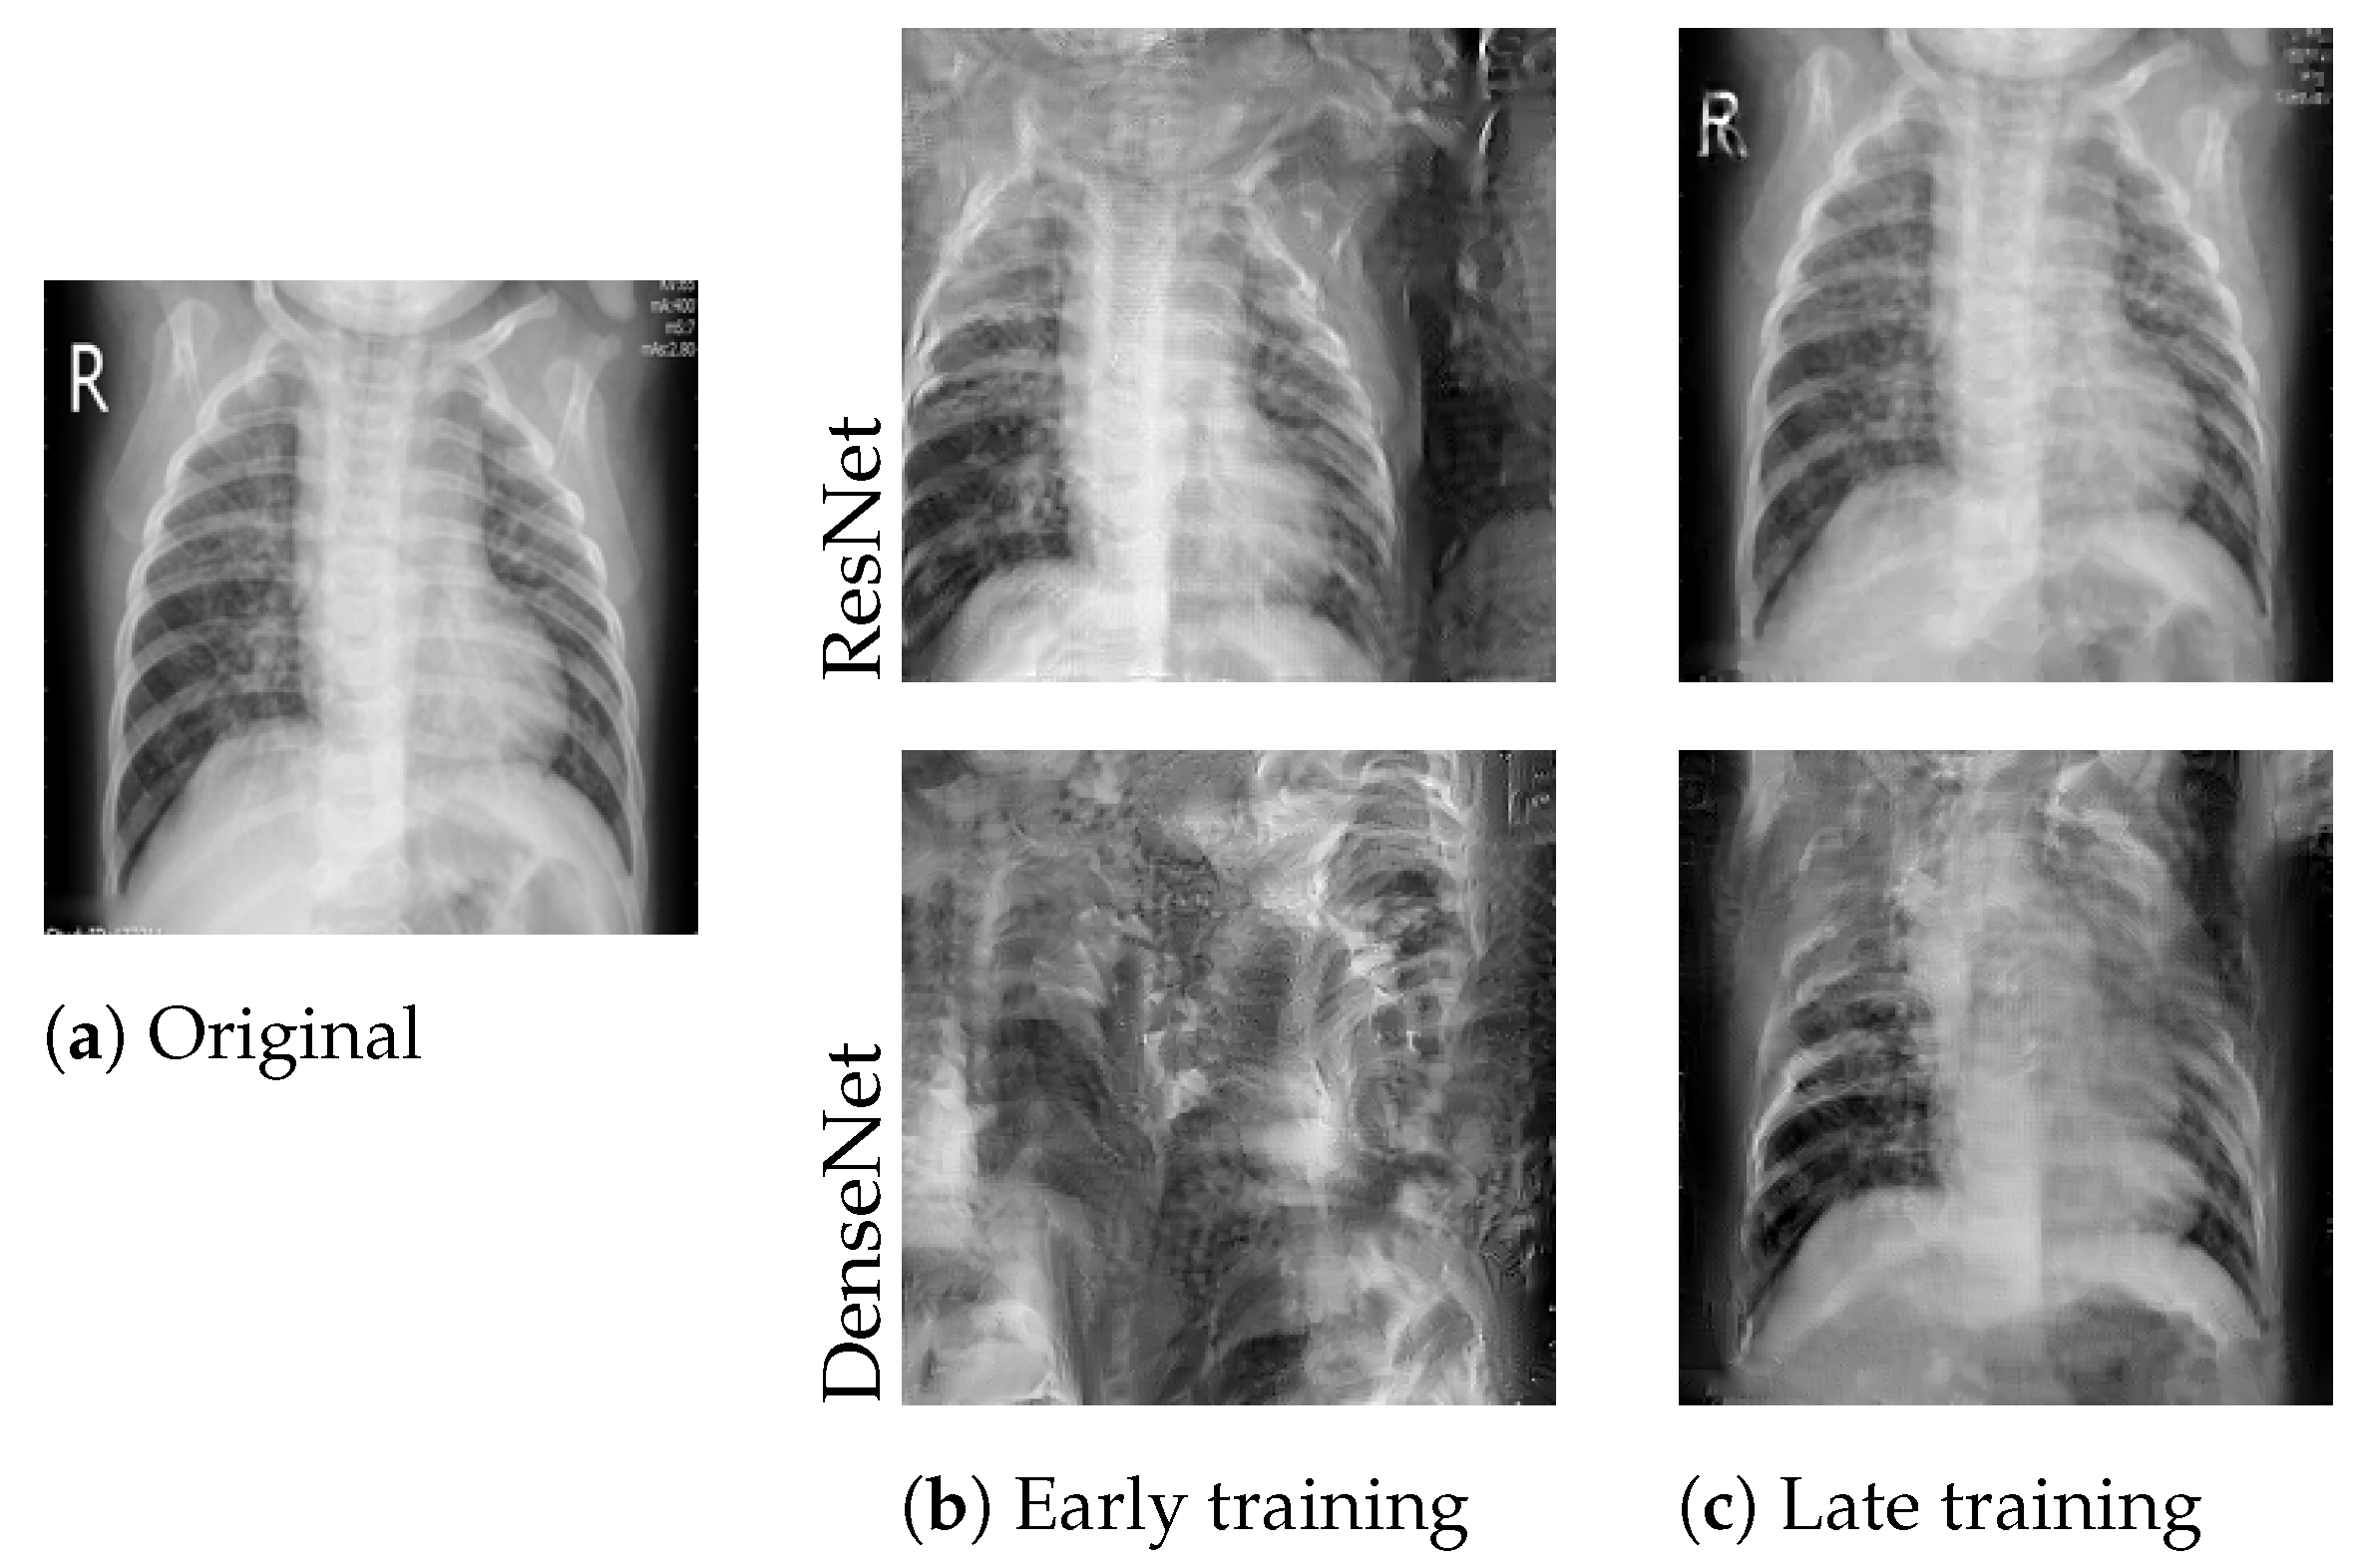
Best reconstructions of the image shown in (a) after the first (b) and after the fourth (c) communication round. Reconstruction quality increased significantly after several rounds of training.
Figure 3.
Best reconstructions of the image shown in (a) after the first (b) and after the fourth (c) communication round. Reconstruction quality increased significantly after several rounds of training.
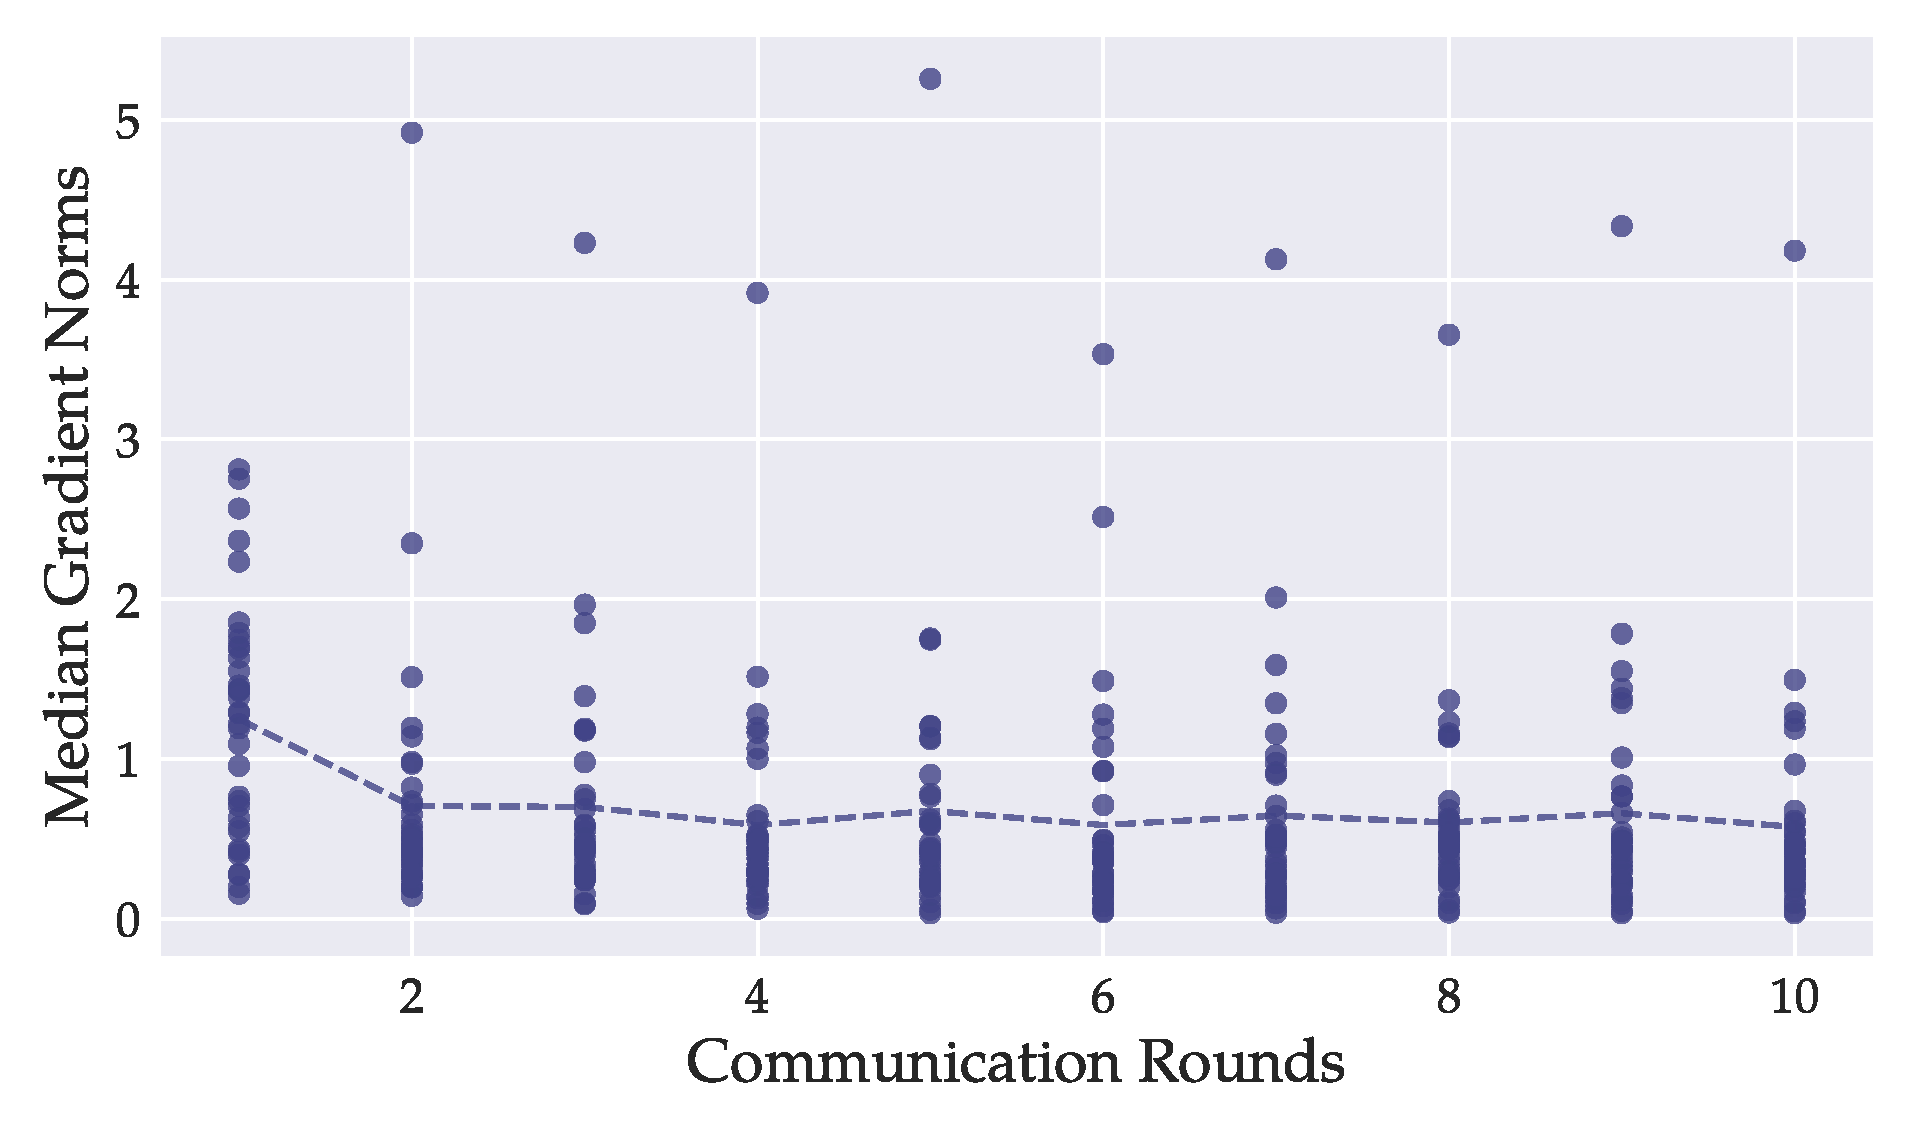
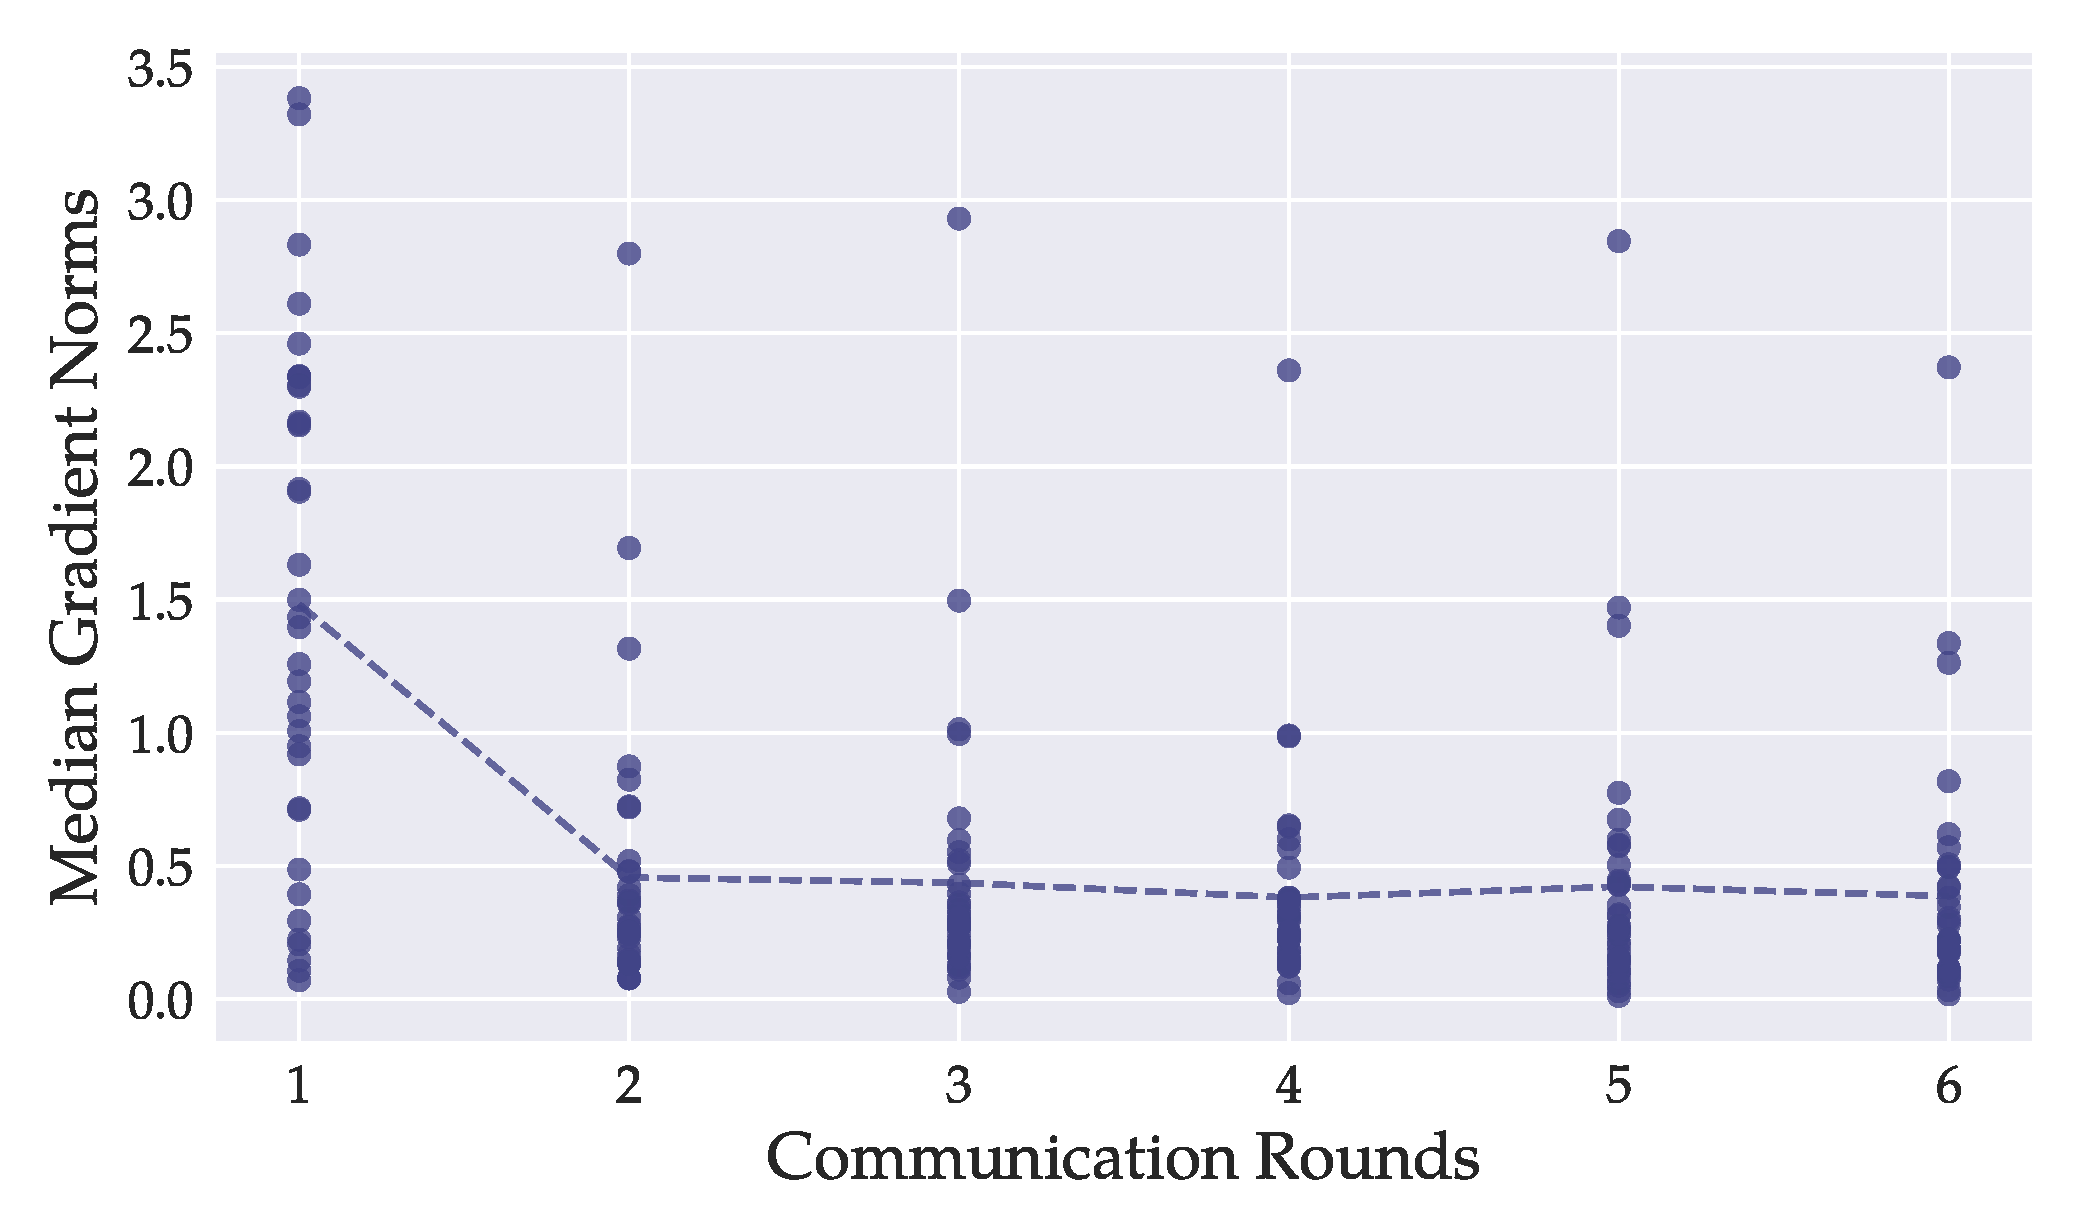
Figure 4.
For each model layer of the DenseNet121, we tracked the median -norms during training of every local model. Each dot represents the mean of one layer-median over all local models. The dashed line depicts the overall mean of all per-layer -norm medians. Most layers’ -norms were greater during the first round of training than in later stages. In our experiments, image reconstruction was better on models from later rounds, suggesting that the magnitude of gradient -norms is not a primary indicator for attack success.
Figure 5.
Best reconstructed images out of each batch of size (a) 1, (b) 2, (c) 4, and (d) 10. While other samples from those batches were not affected by the attack, the privacy of these examples’ original X-rays has been severely breached, regardless of the batch size.
Figure 5.
Best reconstructed images out of each batch of size (a) 1, (b) 2, (c) 4, and (d) 10. While other samples from those batches were not affected by the attack, the privacy of these examples’ original X-rays has been severely breached, regardless of the batch size.
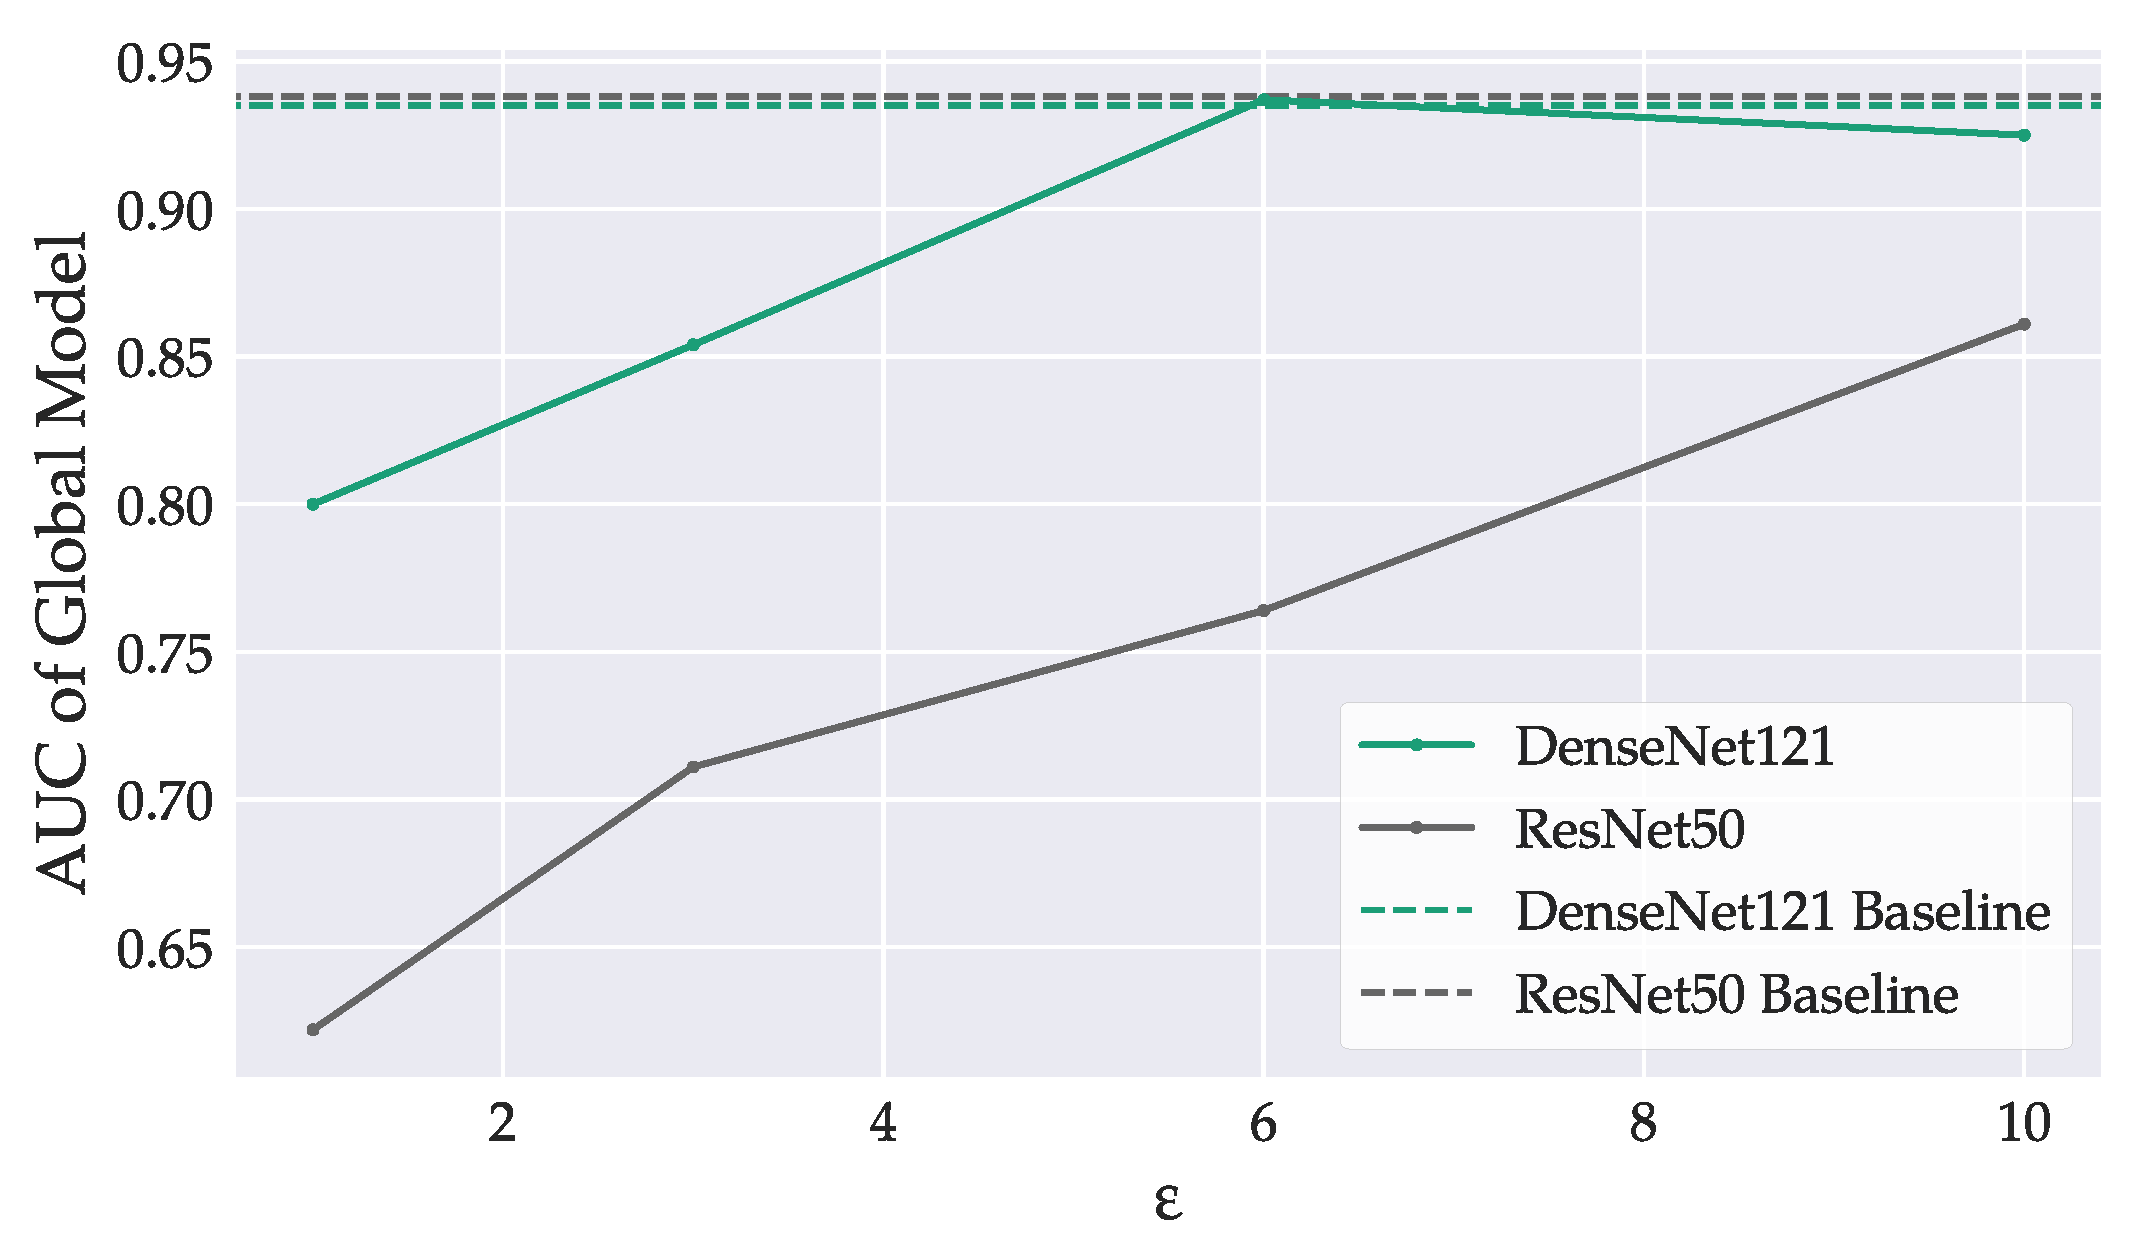
Figure 6.
Model performance, evaluated on the clients’ test sets in dependence on the privacy budget . Baselines mark the peak performance of global non-private models. Stronger privacy guarantees degraded model accuracy.
Figure 6.
Model performance, evaluated on the clients’ test sets in dependence on the privacy budget . Baselines mark the peak performance of global non-private models. Stronger privacy guarantees degraded model accuracy.
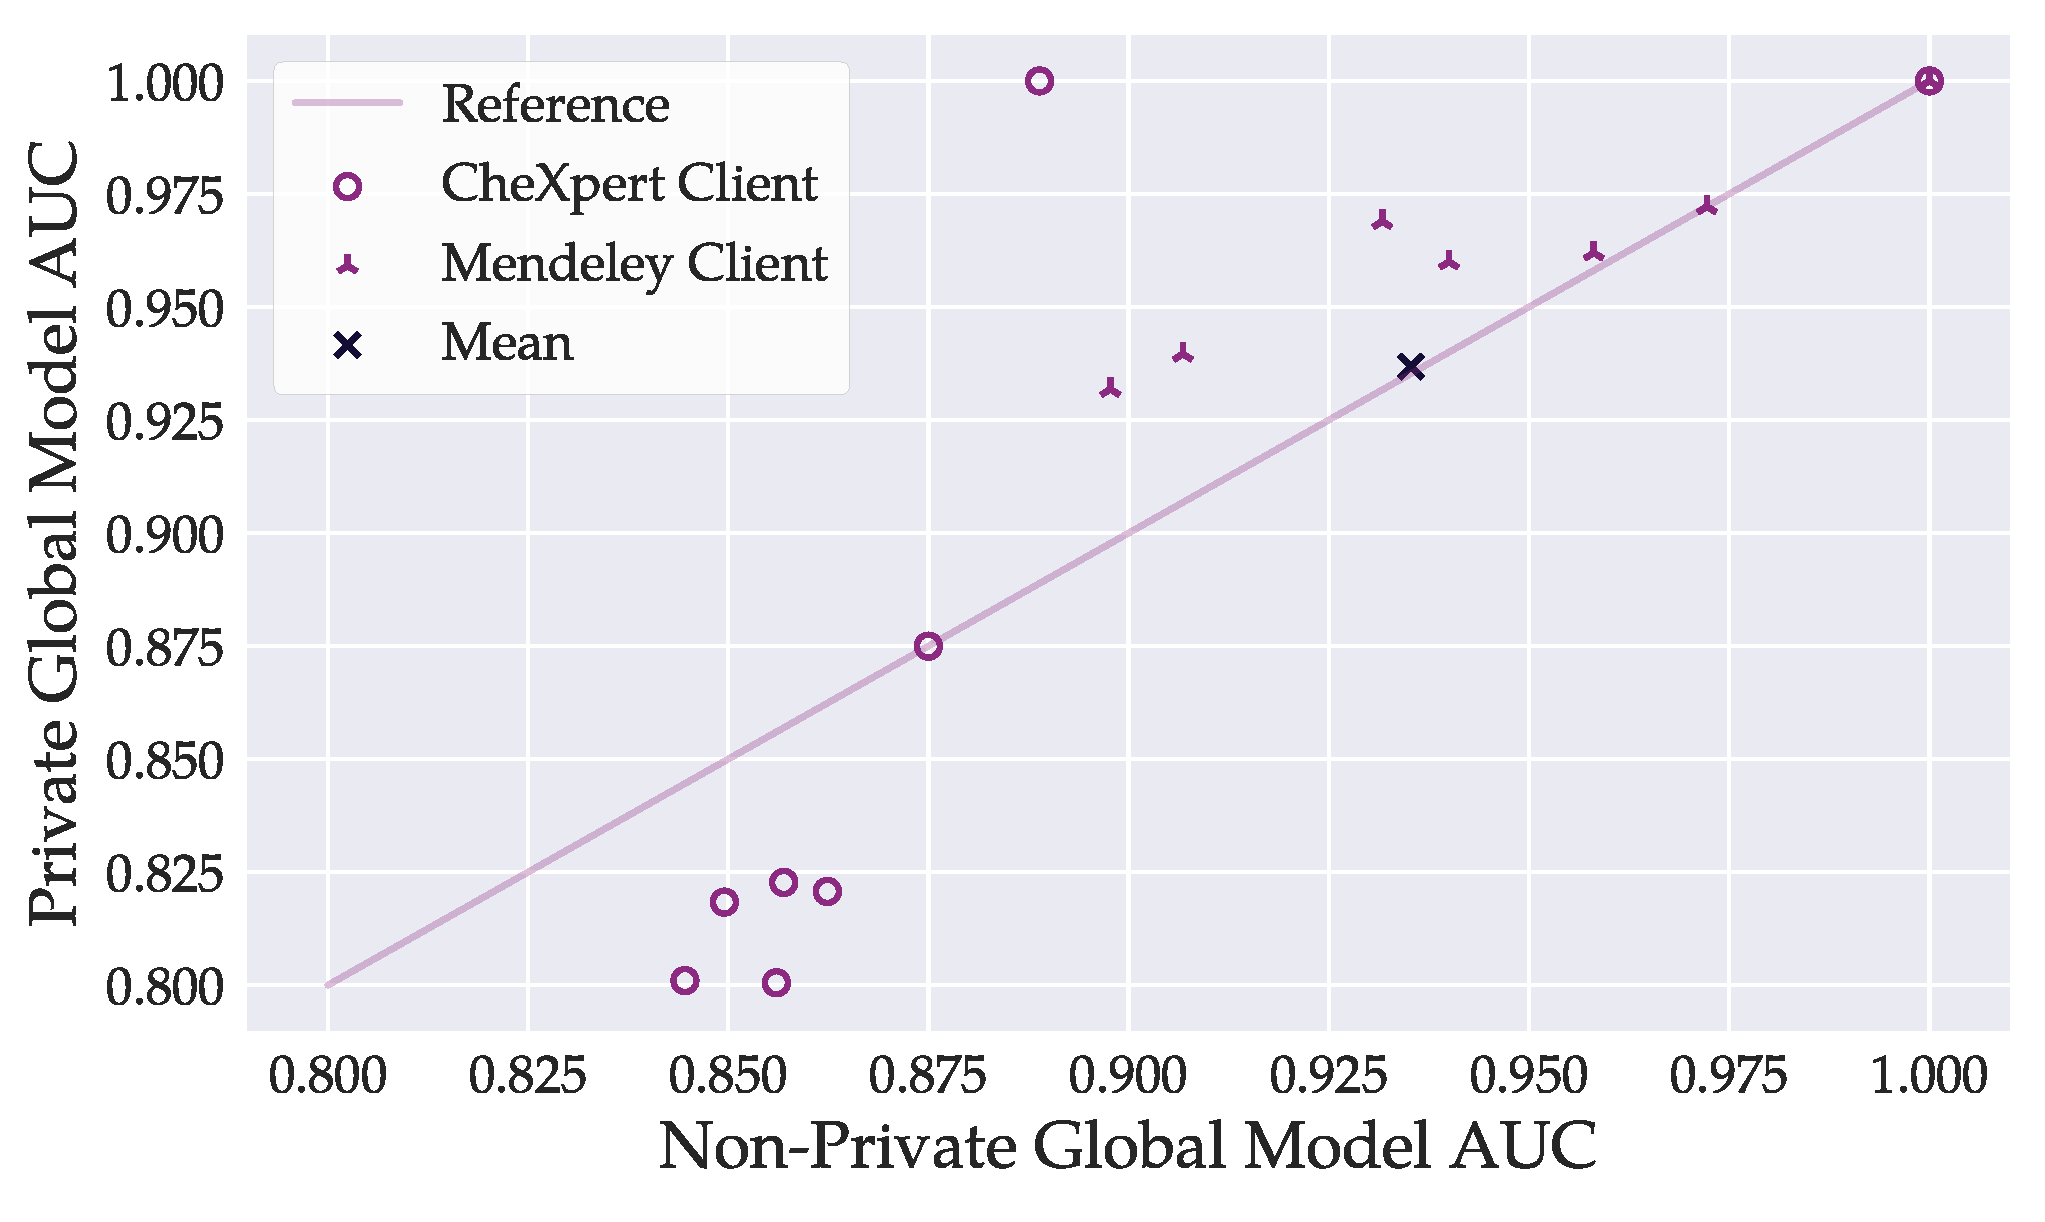
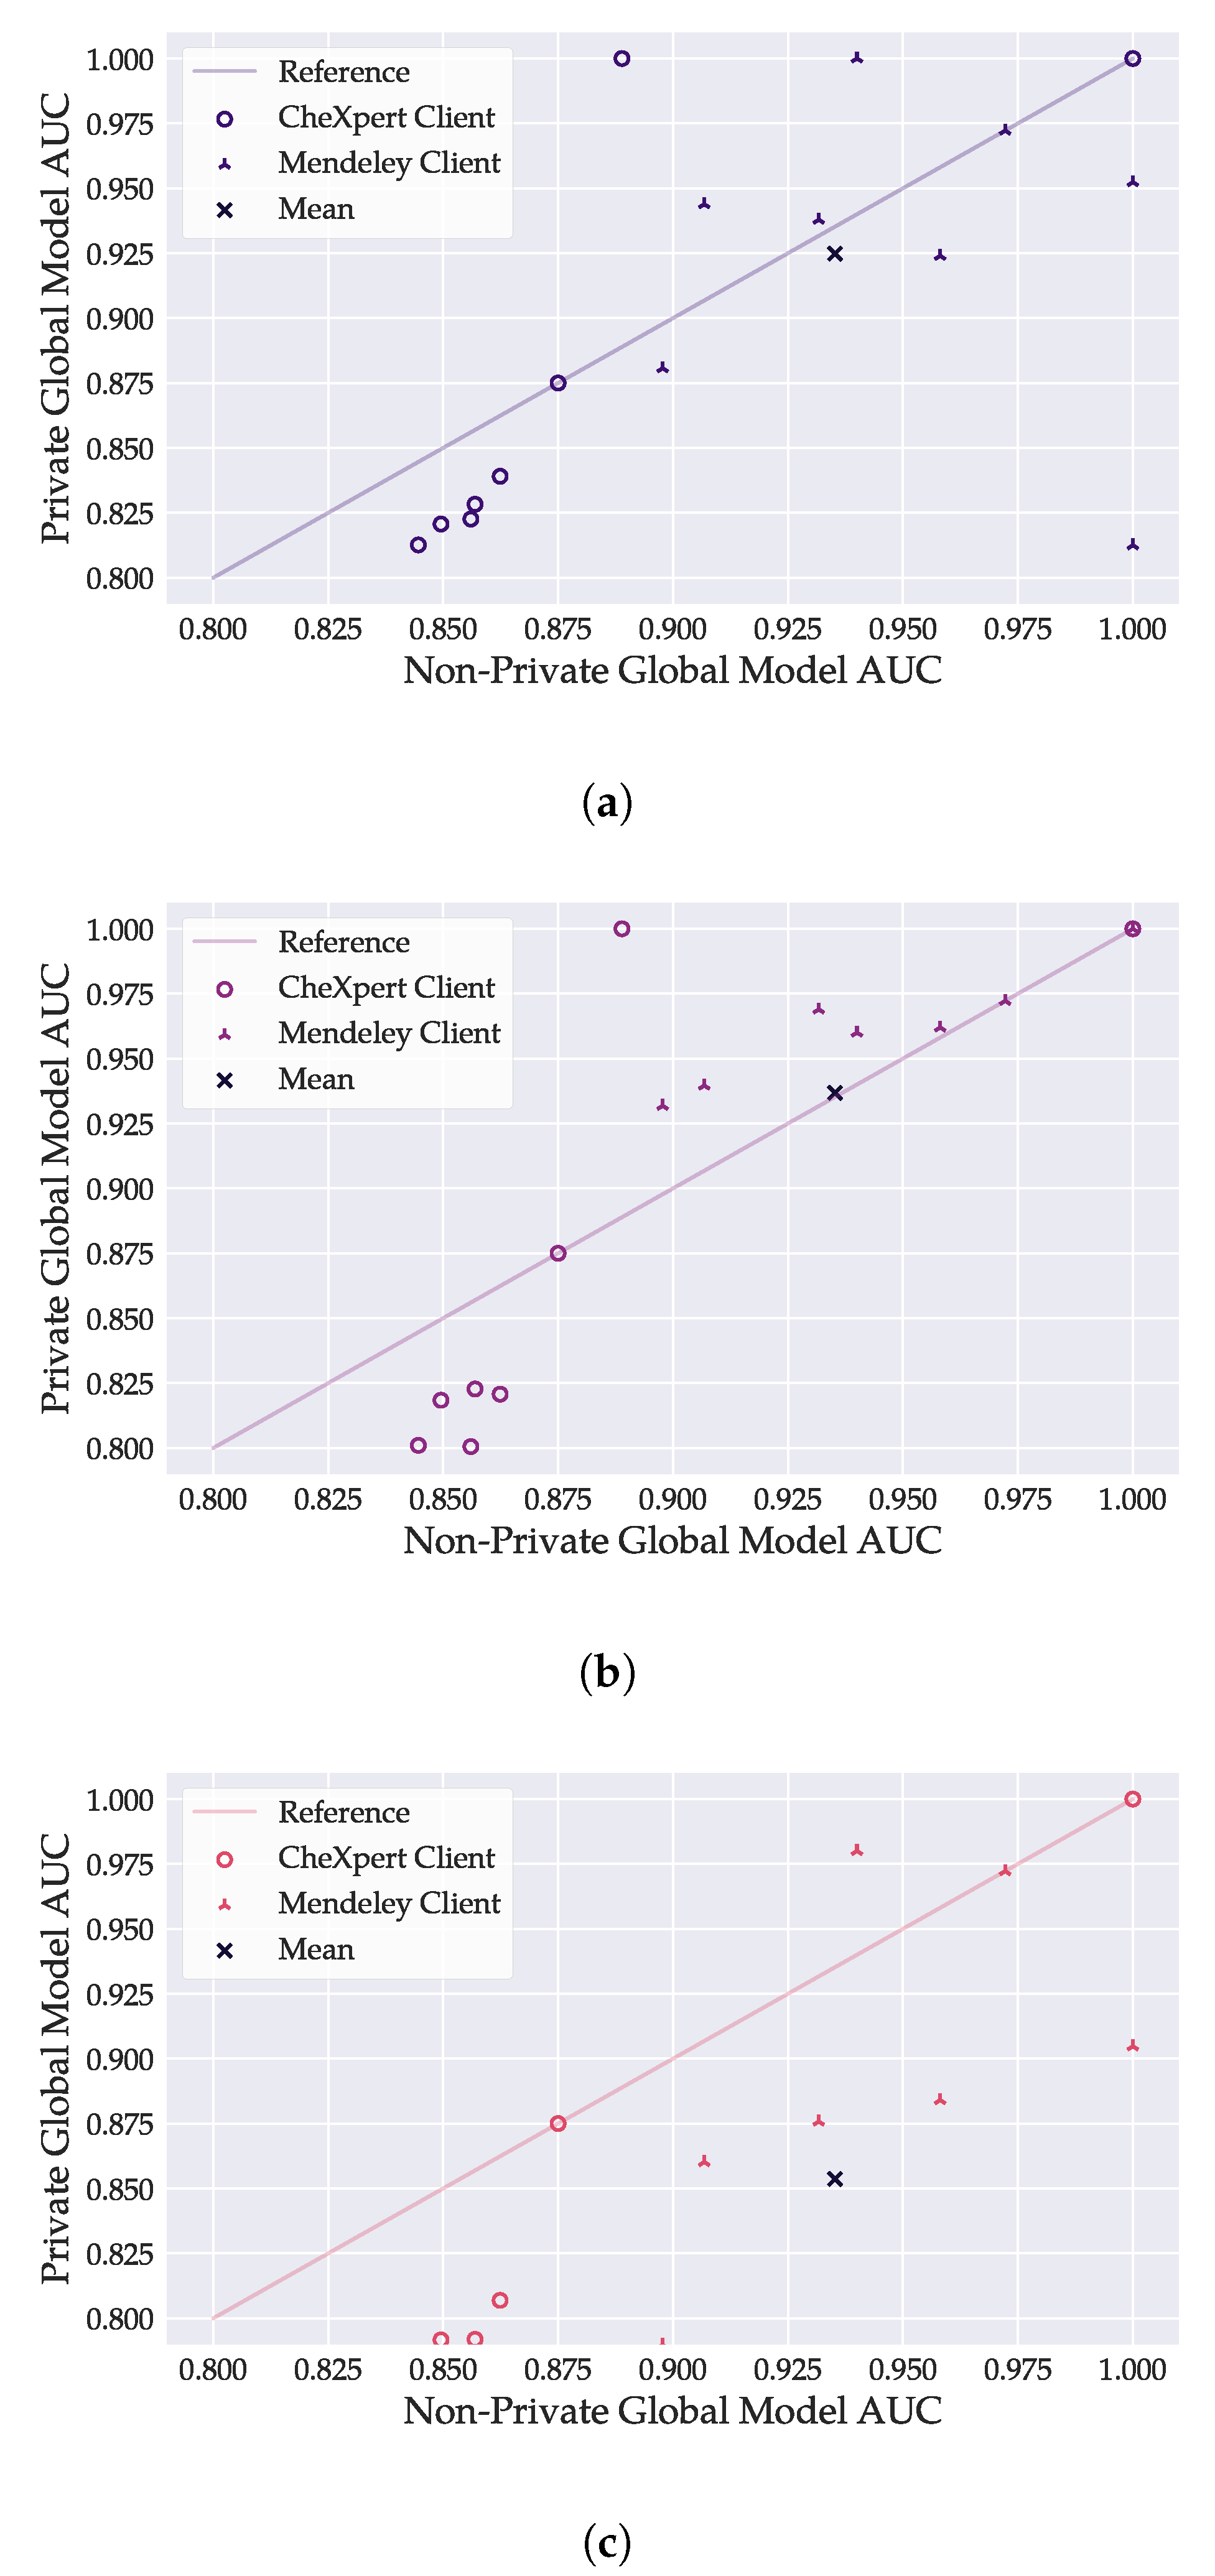
Figure 7.
Comparison of per-client AUC values achieved by the best global DenseNet121 model between private () and non-private training. The bottom left circle markers belong to CheXpert clients with large datasets. Privacy demanded a higher cost in model accuracy on CheXpert clients. The figure does not consider AUC values below . Markers may overlap.
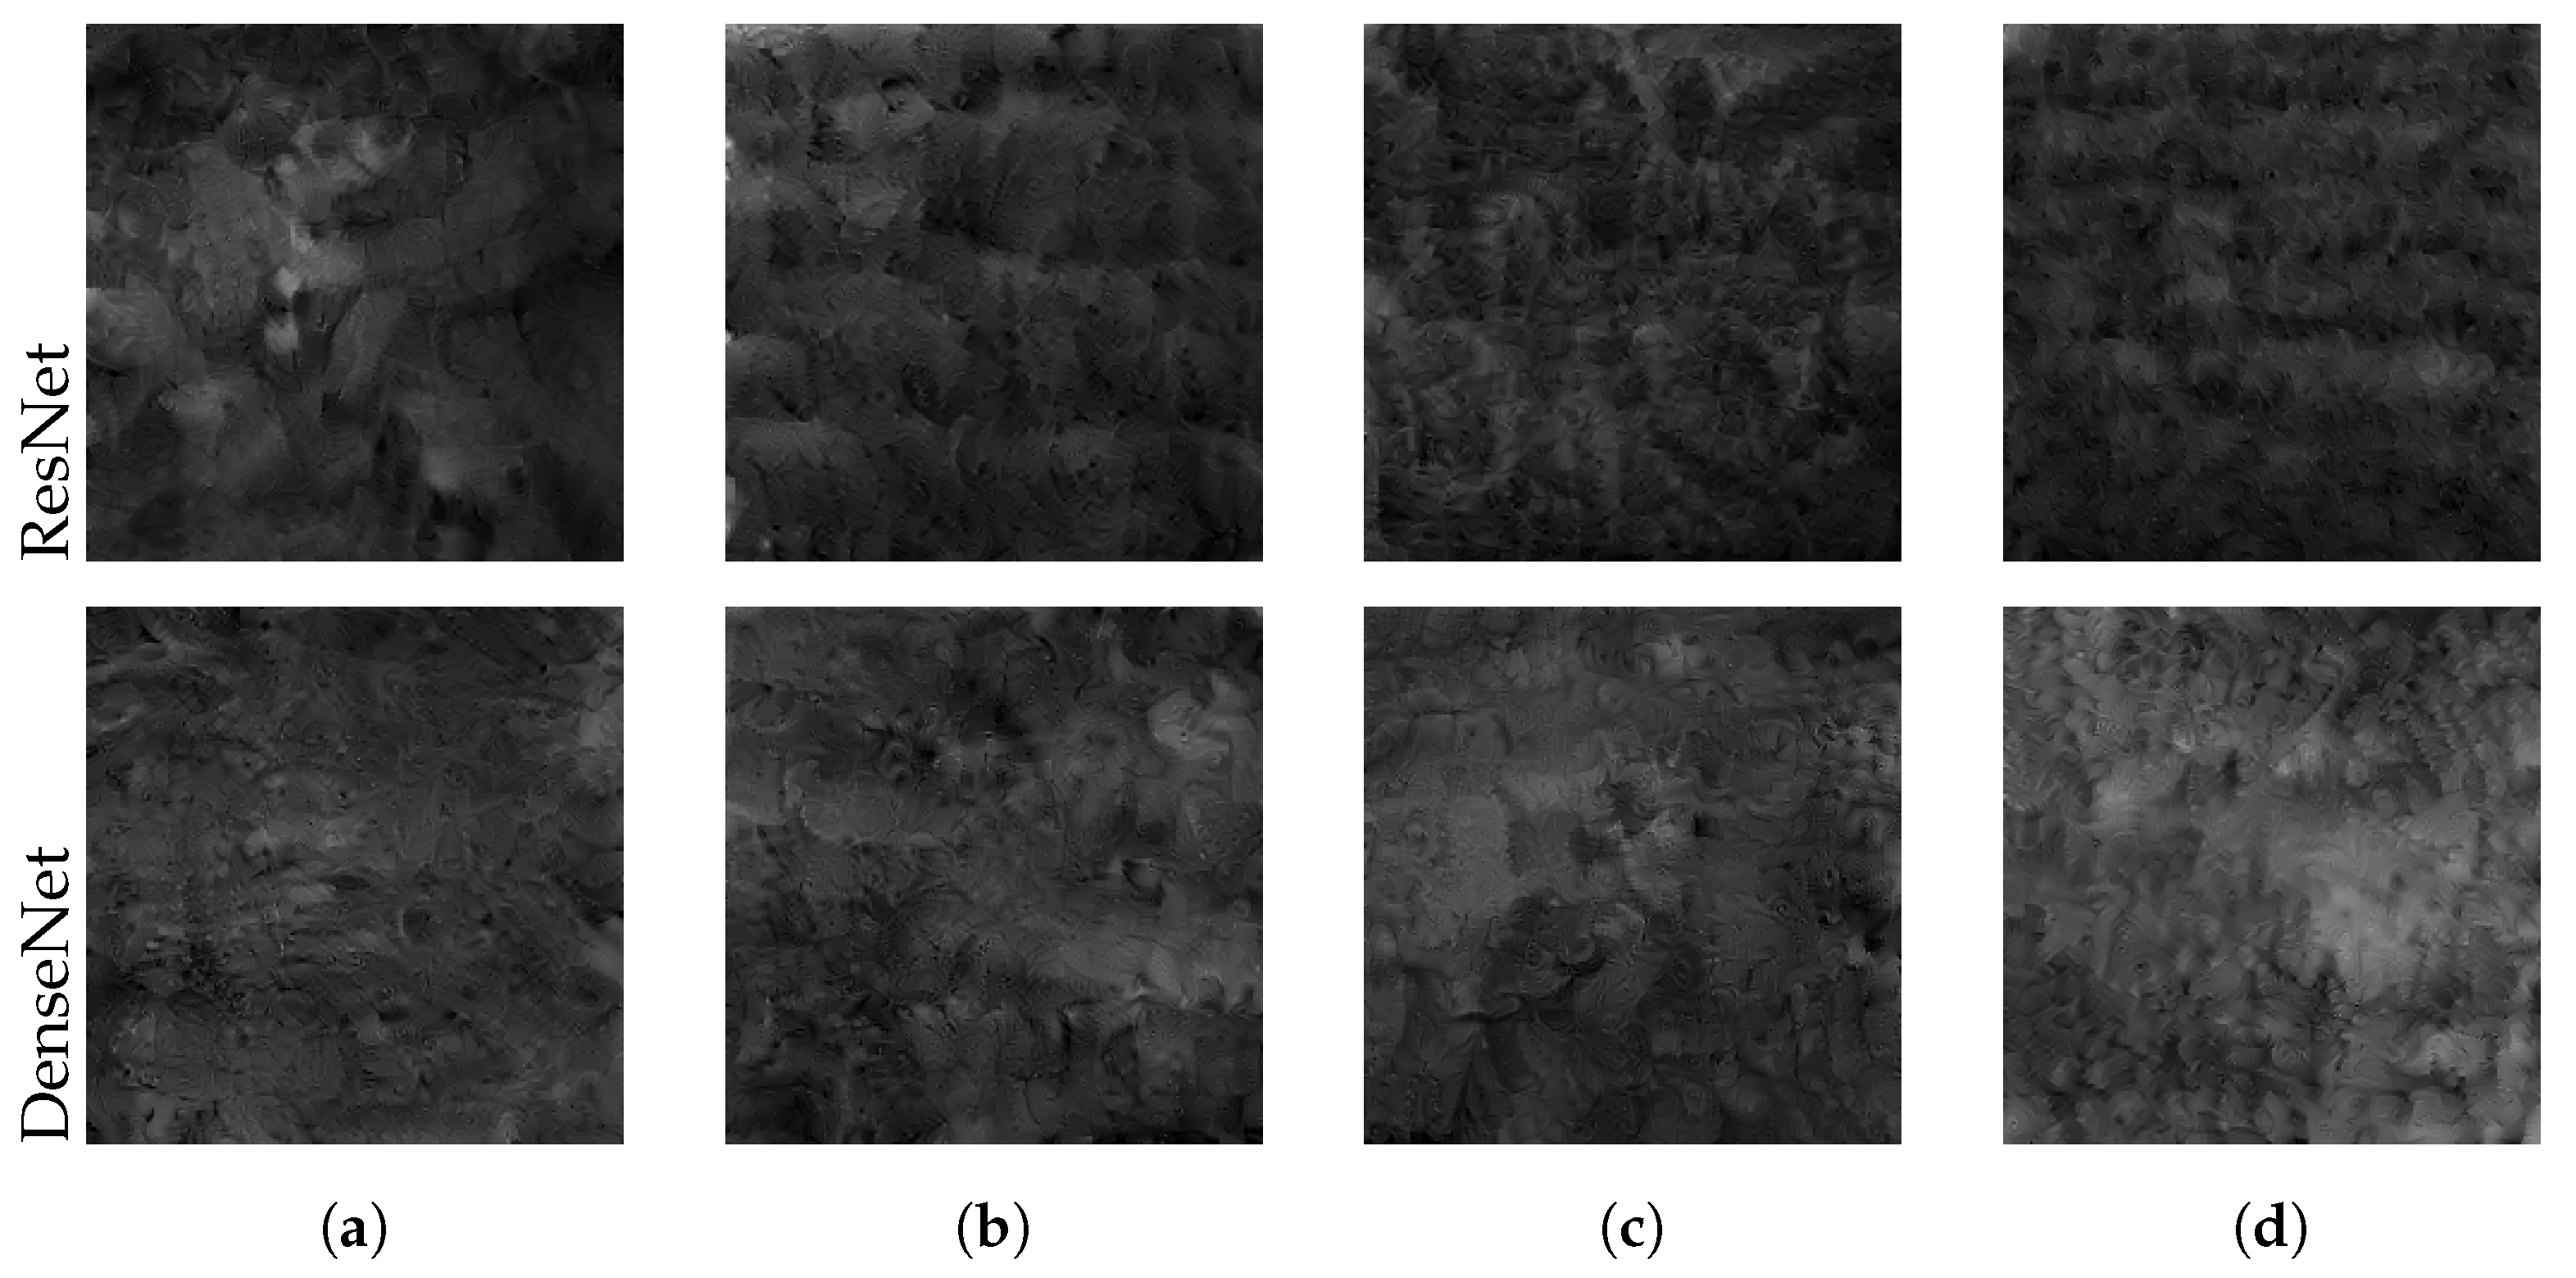
Figure 8.
Best reconstructed images under different privacy constraints with (a) , (b) , (c) , (d) . Private training successfully prevents the leakage of any visible features.
Figure 8.
Best reconstructed images under different privacy constraints with (a) , (b) , (c) , (d) . Private training successfully prevents the leakage of any visible features.
Table 1.
Overview of related works evaluating deep neural networks on the CheXpert or Mendeley datasets using DenseNet or ResNet architectures. The mentioned models are not necessarily exhaustive; some papers evaluate additional ResNet and DenseNet architectures. We also include our paper at the bottom for comparison with related work. Note: (non-)IID corresponds to a (not) independent and identical data distribution. DP corresponds to the use of differential privacy ().
| Data | Reference | Model | Federated Learning | AUC |
|---|
| CheXpert | Irvin et al. [24] | DenseNet121 | no | |
| Bressem et al. [29] | DenseNet121 | no | |
| | ResNet50 | | |
| Ke et al. [30] | DenseNet121 | no | |
| | ResNet50 | | |
| Chakravarty et al. [26] | ResNet18 | 5 sites, non-IID | |
| Nath et al. [27] | DenseNet121 | 5 sites, IID | |
| Mendeley | Banerjee et al. [28] | ResNet50 | 3 sites, non-IID (The data distribution between | (no AUC given |
| | | the three hospitals is , | the value corresponds |
| | | with slightly varying class distributions.) | to the binary accuracy) |
| Kaissis et al. [8] | ResNet18 | no | |
| | | 3 sites (data distribution unknown) | |
| | | 3 sites (data distribution unknown), DP | |
| Both | This paper | DenseNet121 | 36 sites, non-IID | |
| | 36 sites, non-IID, DP | |
| ResNet50 | 36 sites, non-IID | |
| | 36 sites, non-IID, DP | |
Table 2.
Number of images from the Mendeley training dataset (a) and Chexpert validation dataset (b), distributed among 14 and 17 clients, respectively. We specify how many clients are included that hold the respective amount of data. The last row shows the total of previous rows, taking into account the number of clients.
| (a) Mendeley Clients. |
|---|
| No. Clients | Train | Val. | Test | Total |
| 2 | 350 | 75 | 75 | 500 |
| 2 | 140 | 30 | 30 | 200 |
| 2 | 70 | 15 | 15 | 100 |
| 2 | 10 | 10 | 10 | 30 |
| 2 | 4 | 3 | 3 | 10 |
| 2 | 2 | 0 | 0 | 2 |
| 2 | 1 | 0 | 0 | 1 |
| 14 | 1686 | 1154 | 266 | 266 |
| (b) CheXpert Clients. |
| No. Clients | Train | Val. | Test | Total |
| 2 | 10 | 10 | 10 | 30 |
| 5 | 4 | 3 | 3 | 10 |
| 5 | 2 | 0 | 0 | 2 |
| 5 | 1 | 0 | 0 | 1 |
| 17 | 125 | 55 | 35 | 35 |
Table 3.
Mean AUCs of the best global DenseNet121 and ResNet50 models, evaluated on the clients’ test sets. Batch norm. refers to freezing of batch normalization layers, All but last to freezing all parameters except for the final classification layer. Training with frozen batch normalization layers delivered similar results to full model training.
| Model | AUC |
|---|
| No Freezing | Batch Norm. | All but Last |
|---|
| DenseNet121 | | | |
| ResNet50 | | | |
Table 4.
Impact of layer freezing on the attack success during early training. We report the mean PSNR and sample standard deviation (STD) over all images obtained from three attack trials per setting. The batch size is kept constant at one. The attack was only successful on models with frozen batch normalization layers.
| Model | PSNR ± STD |
|---|
| None | Batch Norm. | All but Last |
|---|
| ResNet50 | | | |
| DenseNet121 | | | |
Table 5.
Impact of batch size on attack success during late training. We report the mean PSNR and sample standard deviation (STD) over all images obtained from three attack trials per setting. Models were trained with frozen batch normalization layers (cf.
Figure 2). Attack success deteriorated with a batch size of ten, but not significantly with smaller batch sizes.
| Model | PSNR ± STD |
|---|
| 1 | 2 | 4 | 10 |
|---|
| ResNet50 | | | | |
| DenseNet121 | | | | |
Table 6.
Performance of the auxiliary models for predicting patient sex and age from X-ray images. We compare the classification/regression of original images, and images reconstructed from local ResNet50 and DenseNet121 models. All attacked clients provided 35 images in total. Metrics reported are AUC for sex prediction and the mean absolute error (MAE) in years for age regression.
| Attacked Model | Sex
(AUC) | Age
(MAE) |
|---|
| - | | |
| ResNet50 | | |
| DenseNet121 | | |
Table 7.
Mean AUC of global DenseNet121 and ResNet50 models, evaluated on the clients’ test sets for non-private training and private training with varying values. Stronger privacy guarantees decreased model performance.
Table 7.
Mean AUC of global DenseNet121 and ResNet50 models, evaluated on the clients’ test sets for non-private training and private training with varying values. Stronger privacy guarantees decreased model performance.
| Model | AUC |
|---|
| - | | | | |
|---|
| DenseNet121 | | | | | |
| ResNet50 | | | | | |
Table 8.
Mean PSNR over three attack trials on non-private and private local models from a Mendeley client holding one training image. The attack failed for all considered values.
Table 8.
Mean PSNR over three attack trials on non-private and private local models from a Mendeley client holding one training image. The attack failed for all considered values.
| Model | PSNR ± STD |
|---|
| - | | | | |
|---|
| DenseNet121 | | | | | |
| ResNet50 | | | | | |
Table 9.
Performance of the auxiliary models for predicting patient sex and age from X-ray images. We compare the predictions on original images, and images reconstructed from local ResNet50 and DenseNet121 models in the non-private and private setting with . Images reconstructed from private models leaked no usable information about the selected properties.
| Attacked Model | | Sex
(AUC) | Age
(MAE) |
|---|
| - | - | | |
| ResNet50 | - | | |
| | 10 | | |
| DenseNet121 | - | | |
| | 10 | | |


 ,
, 


