

Vibration Analysis at Castello Ursino Picture Gallery (Sicily, Italy) for the Implementation of Self-Generating AlN-MEMS Sensors
 , , ,
, , ,
Abstract
:1. Introduction
2. Vibration Analysis Methods
2.1. Spectral Analysis (FFT)
2.2. Power Spectral Density Analysis
2.3. Acceleration Peak Analysis
2.4. Root Mean Square Analysis
3. Tests and Surveys
3.1. Laboratory TEST
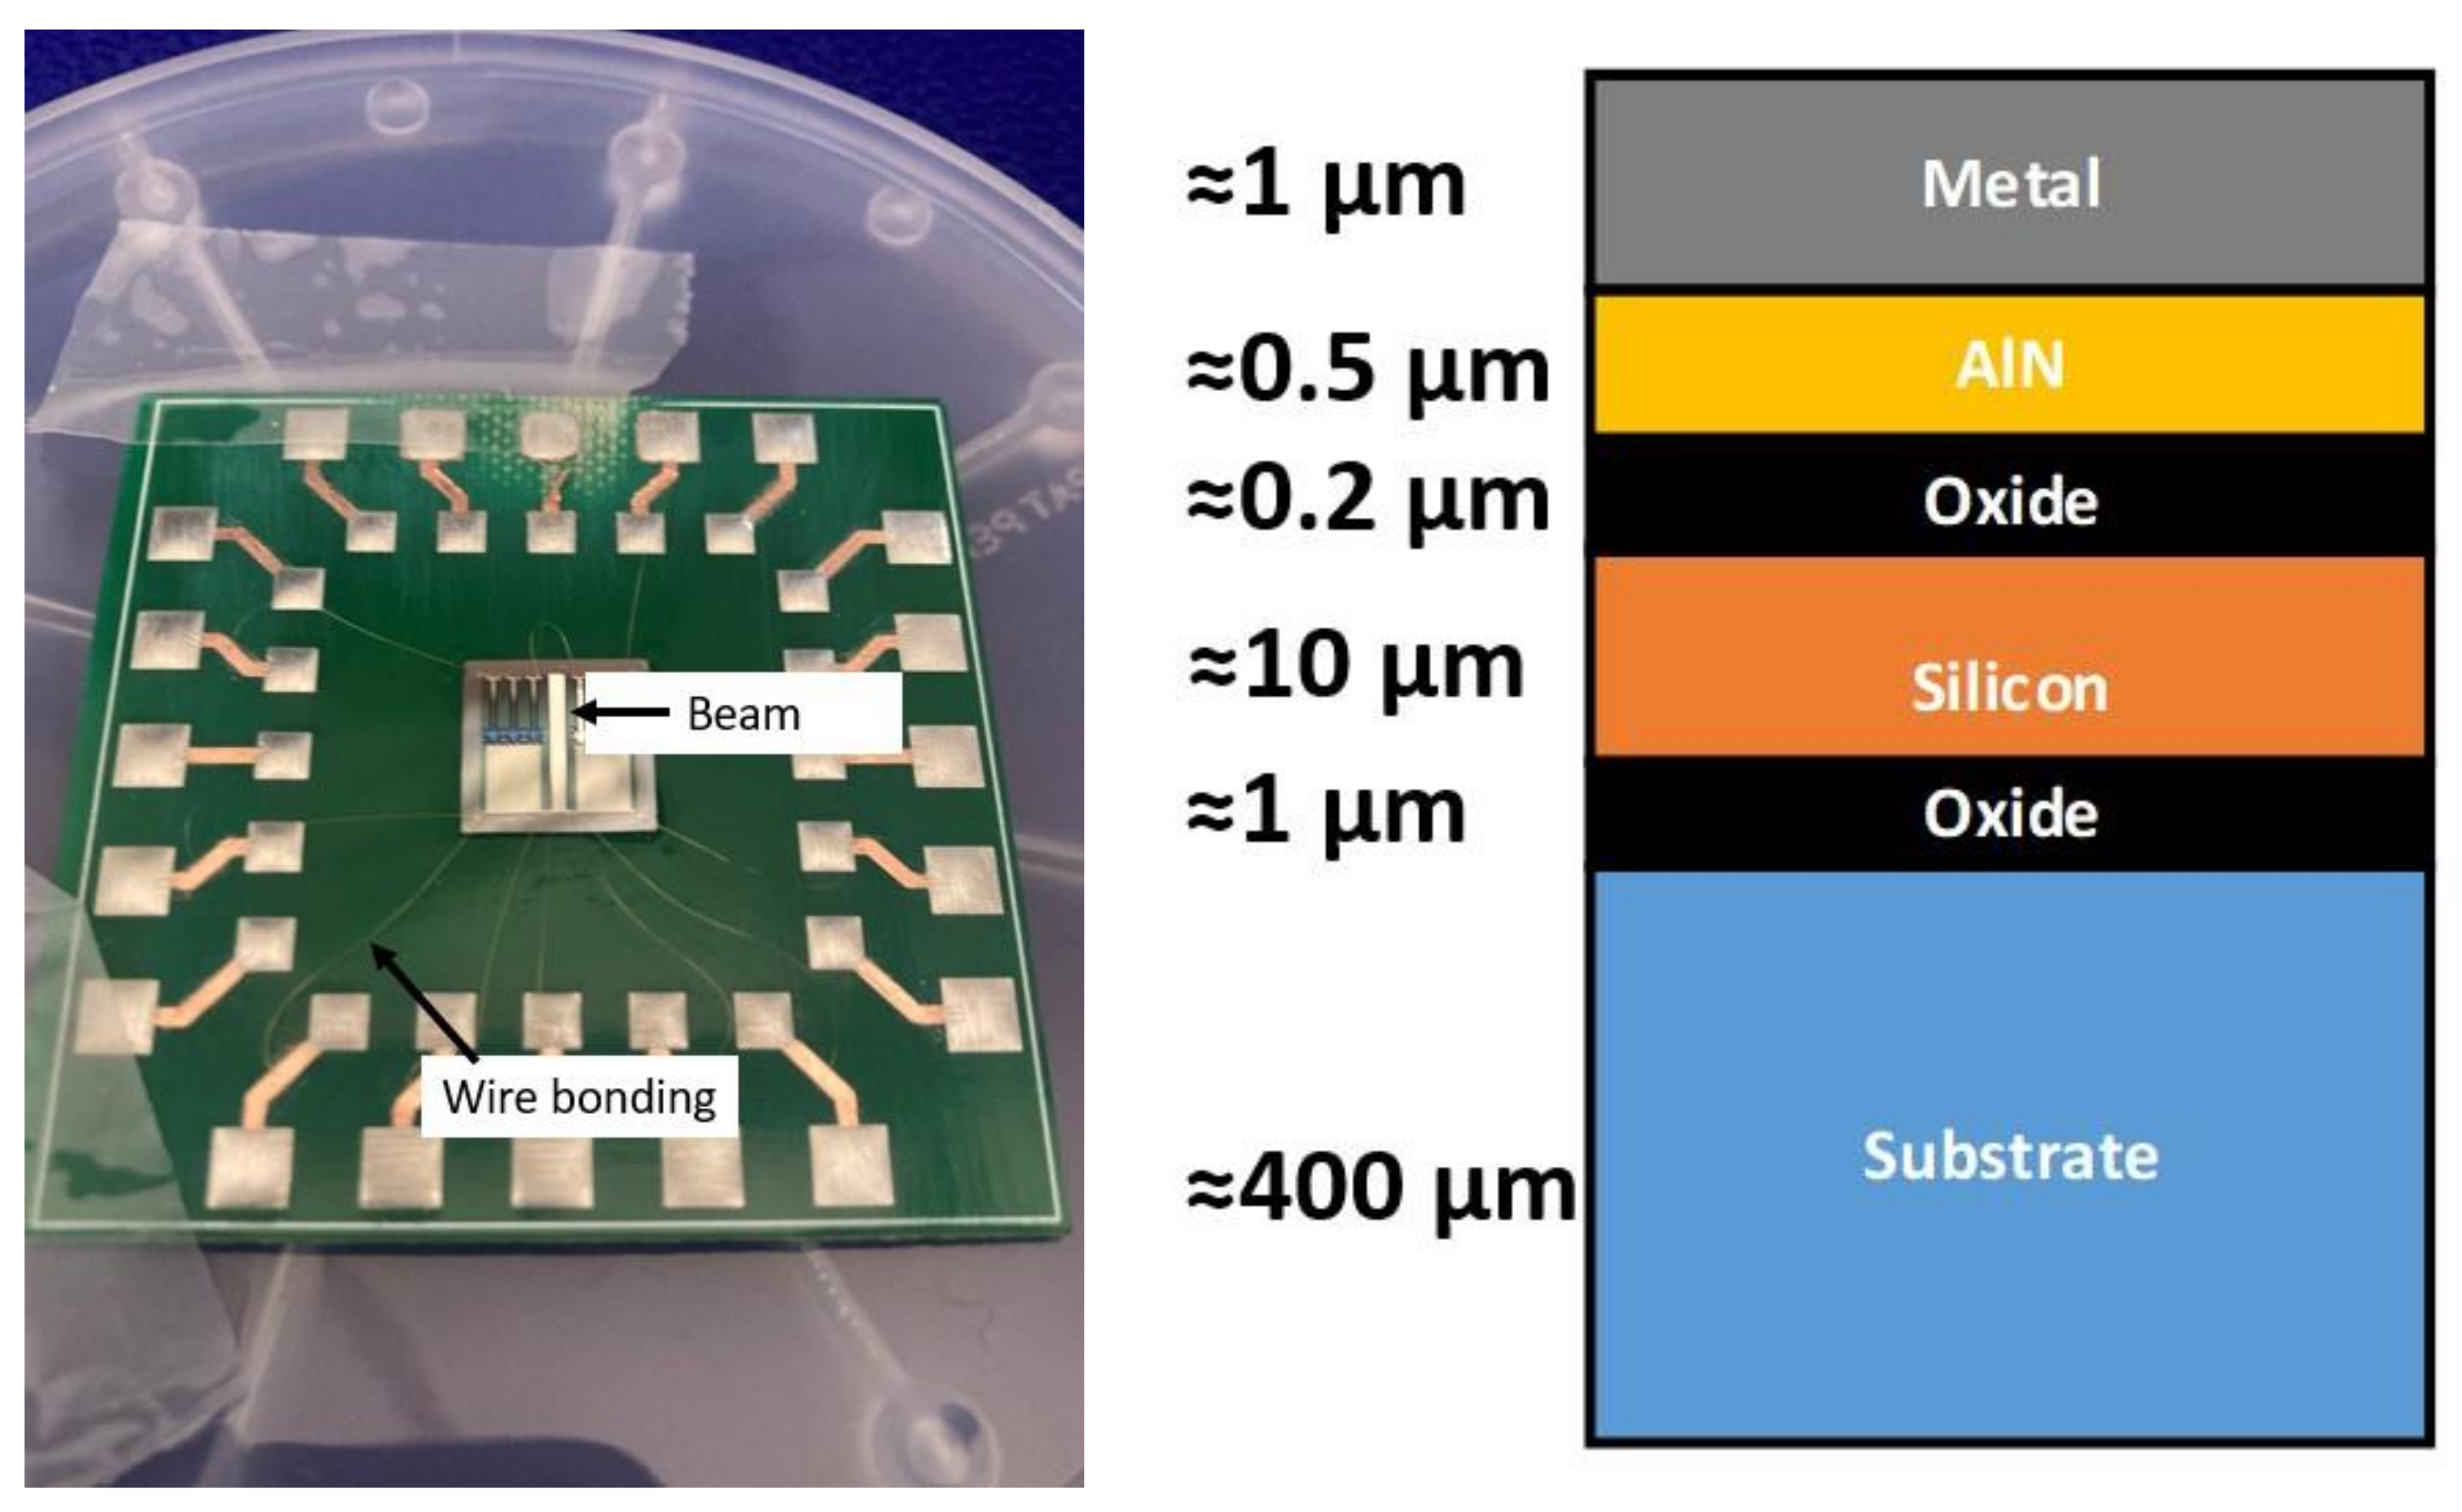
3.1.1. The AlN-MEMS
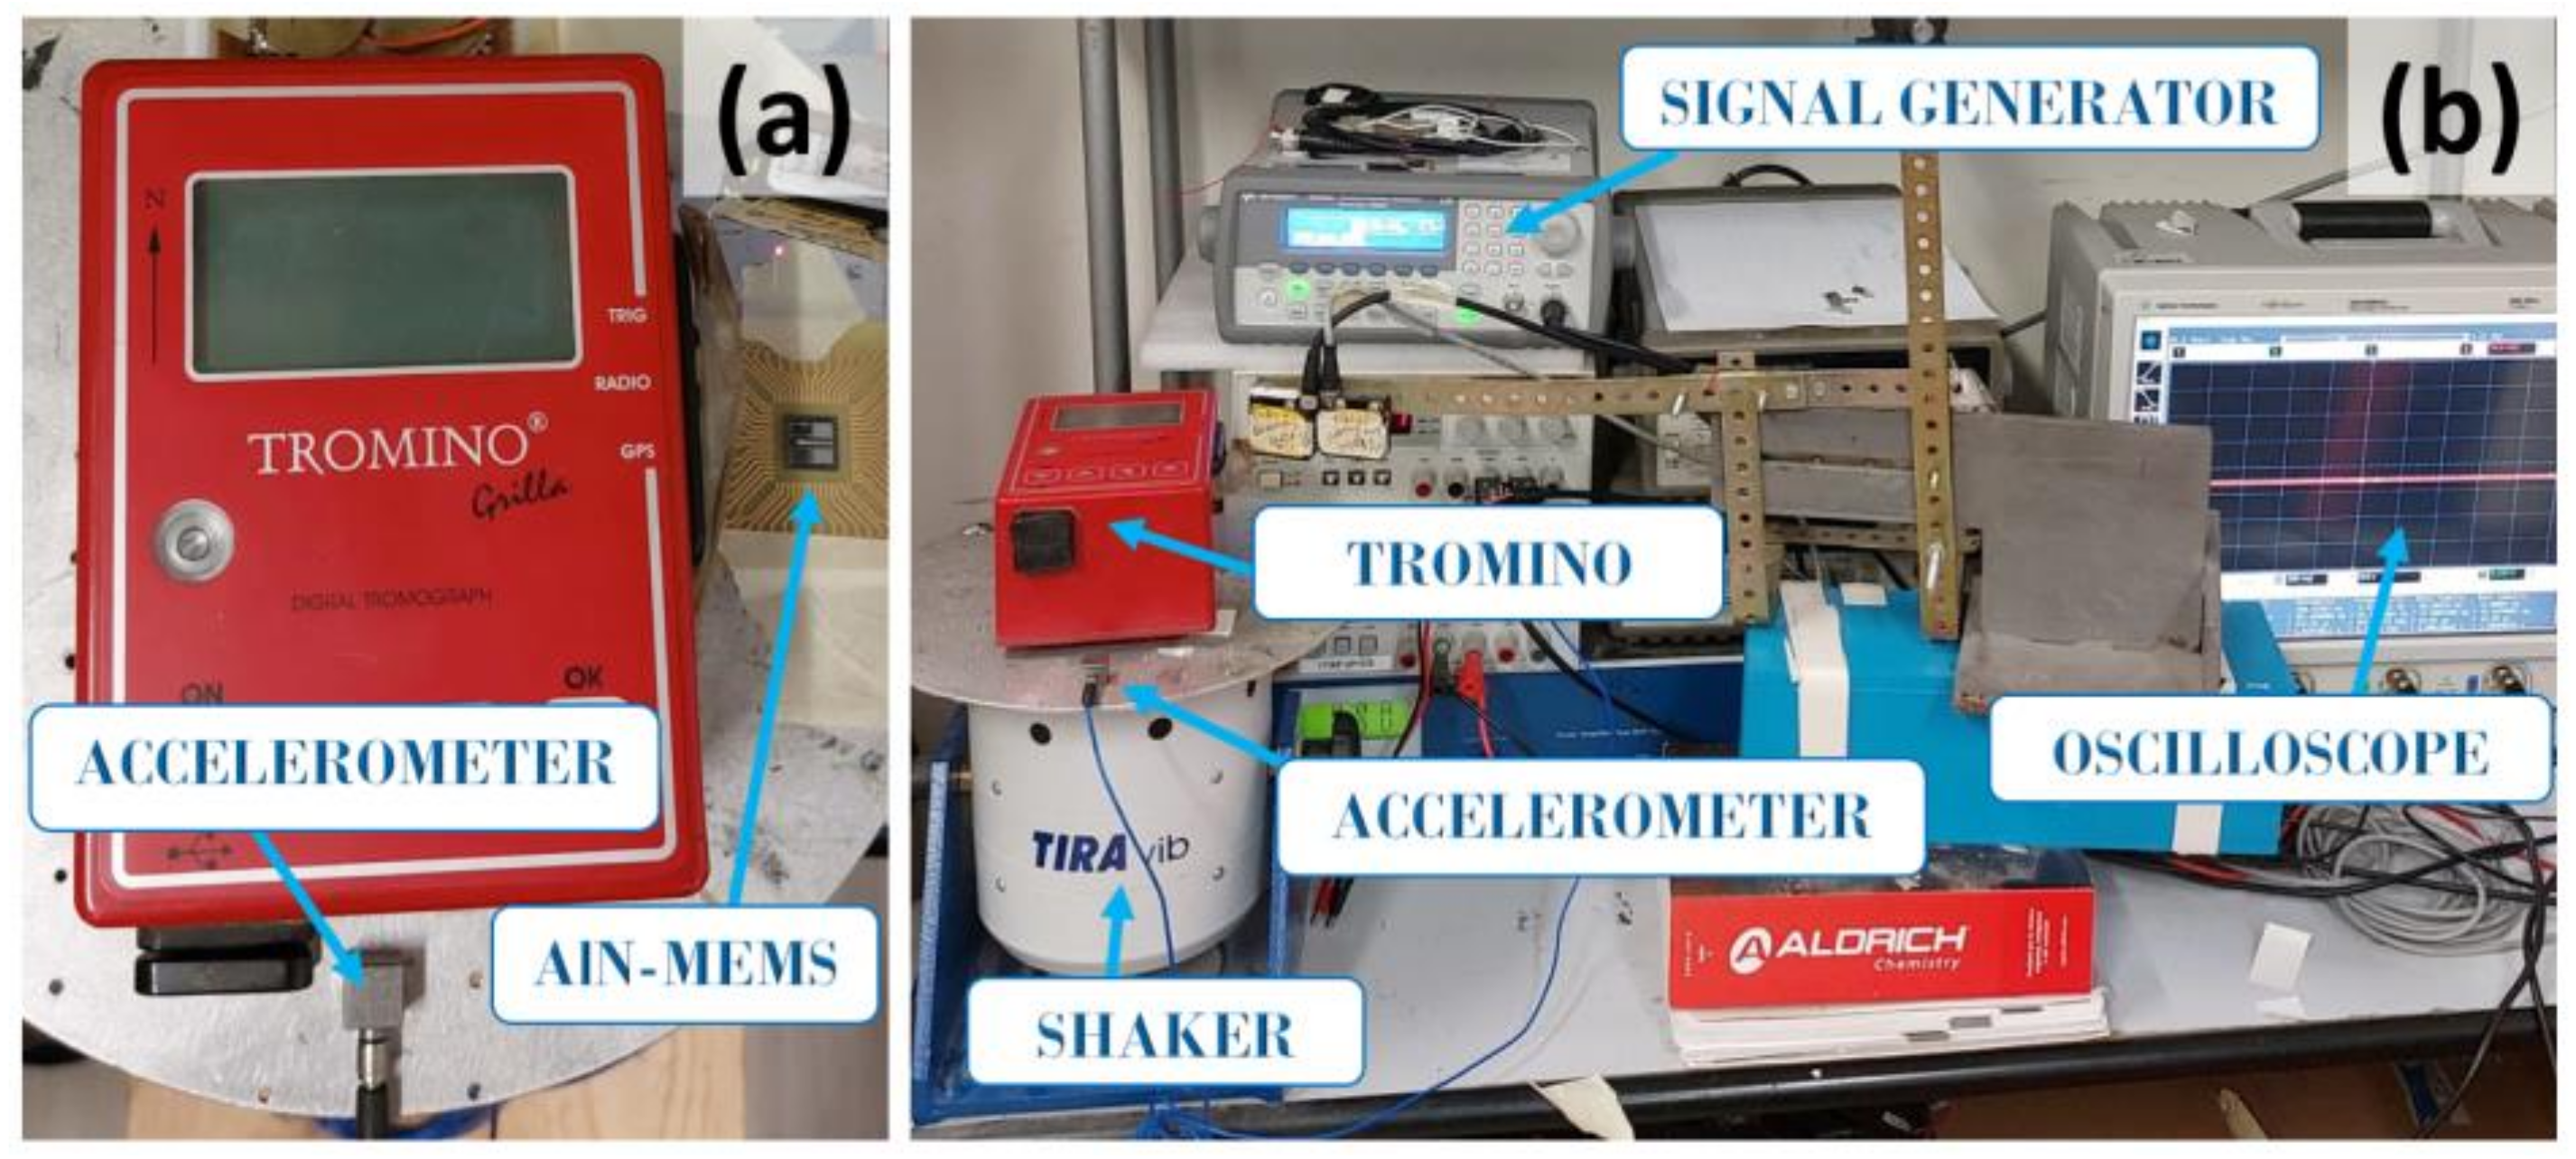
3.1.2. Setup
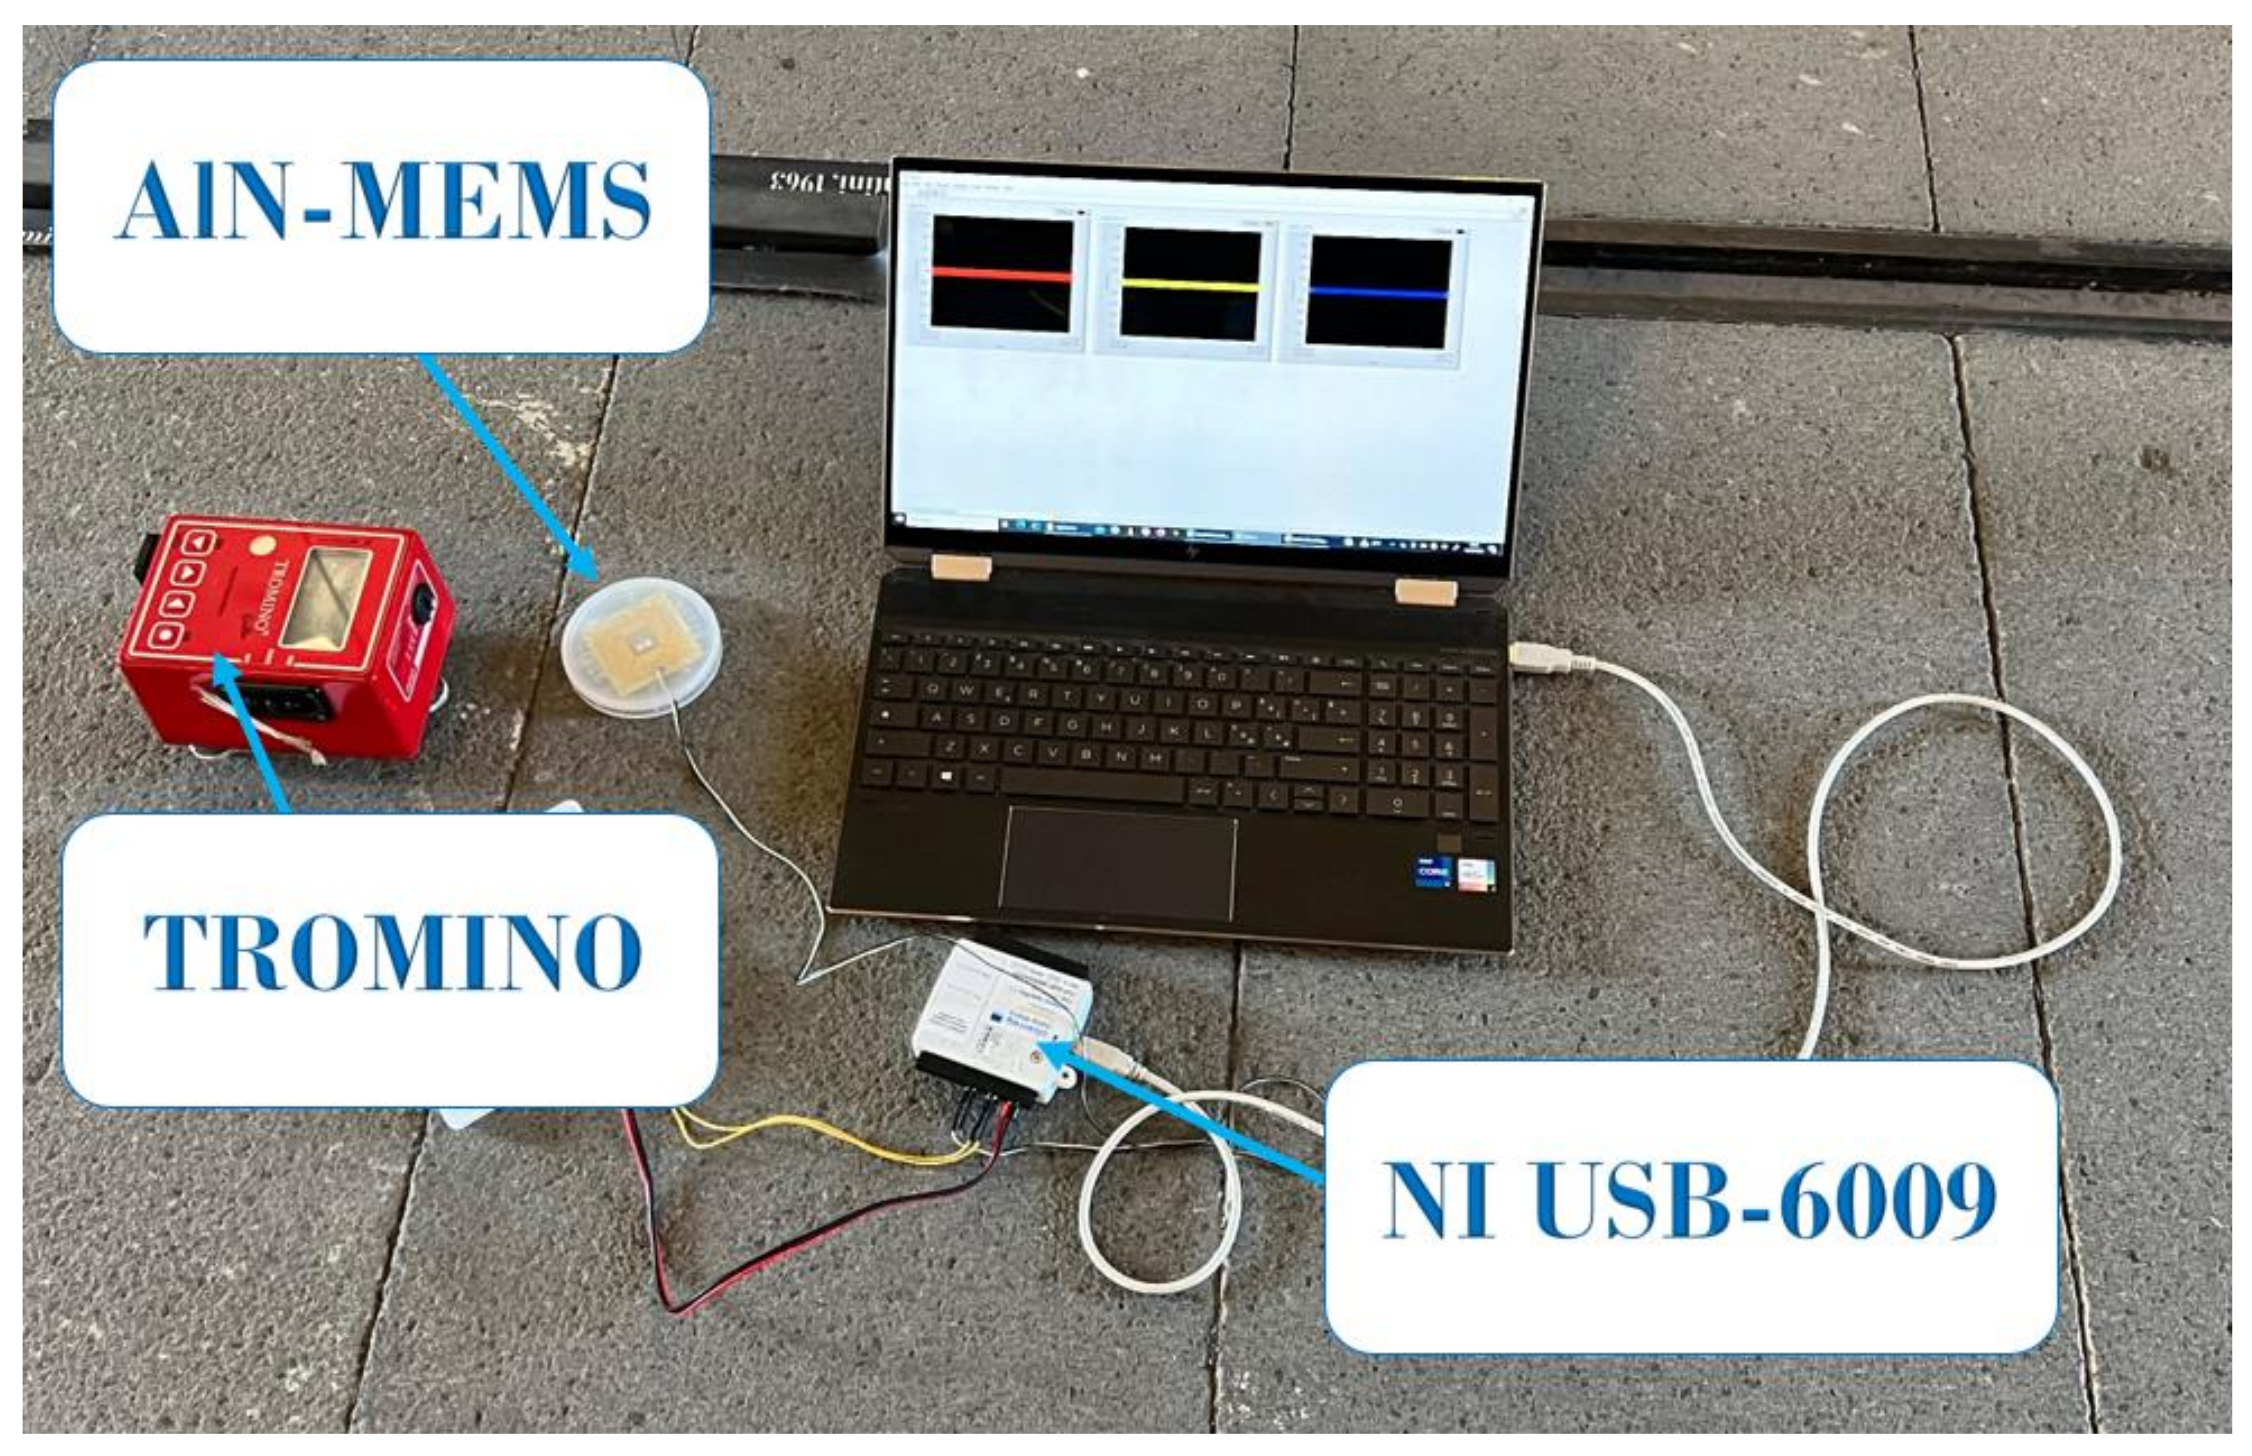
3.2. Vibration Surveys at Castello Ursino
4. Data Analysis
4.1. Tromino® Data Analysis
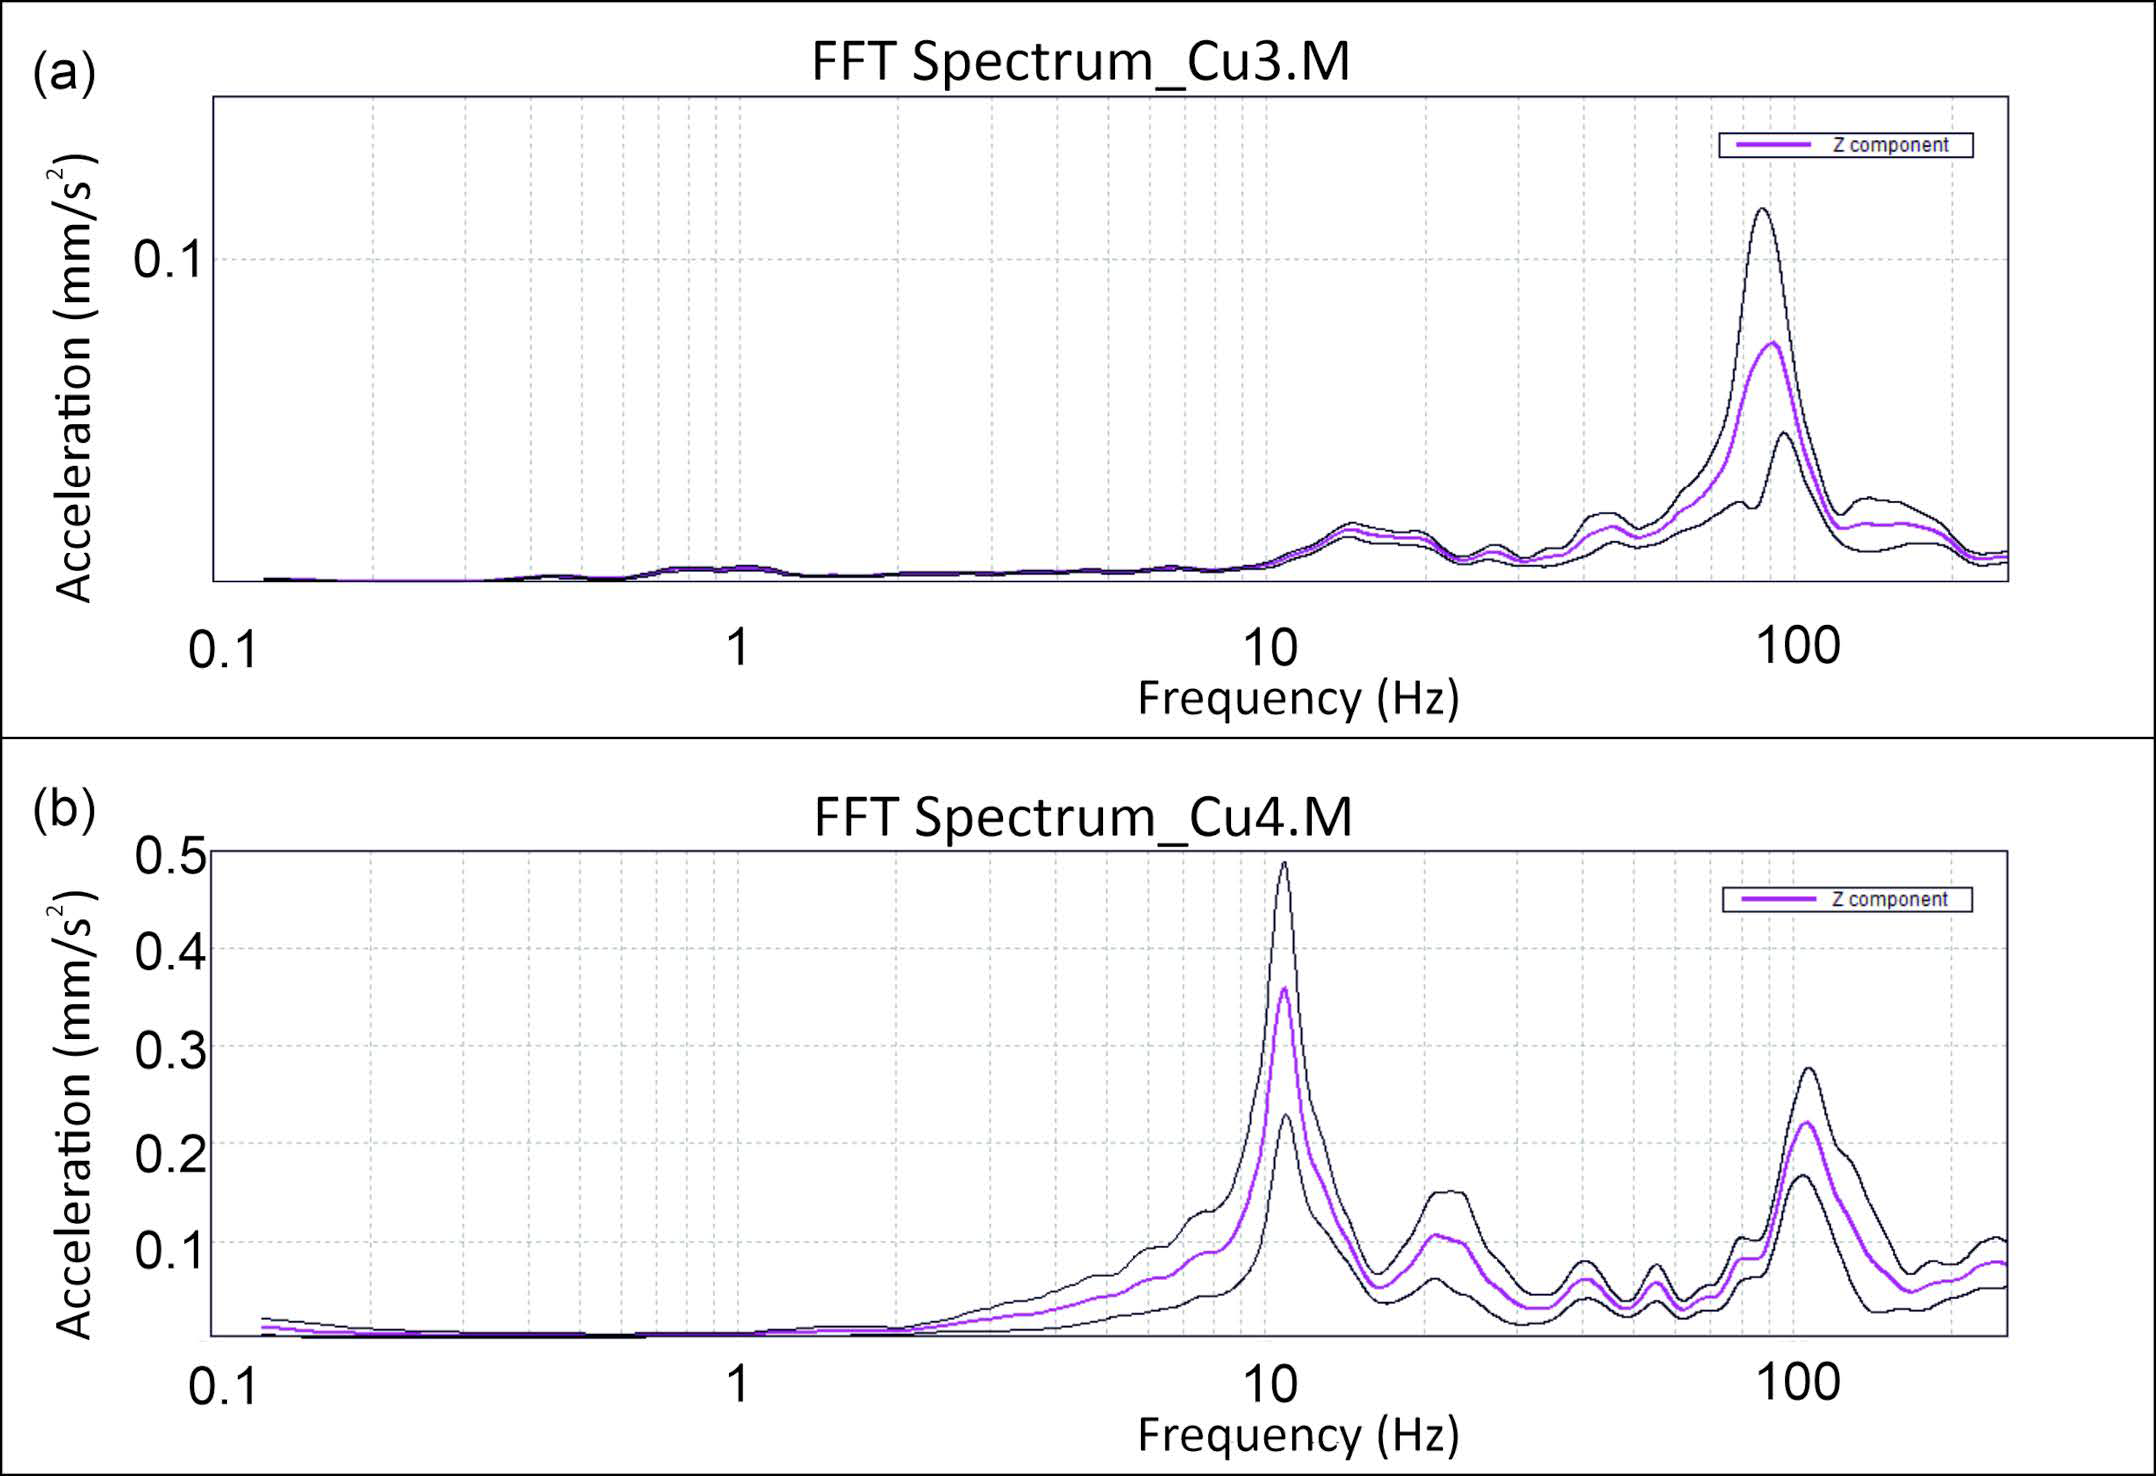
4.1.1. Spectral Analysis Results
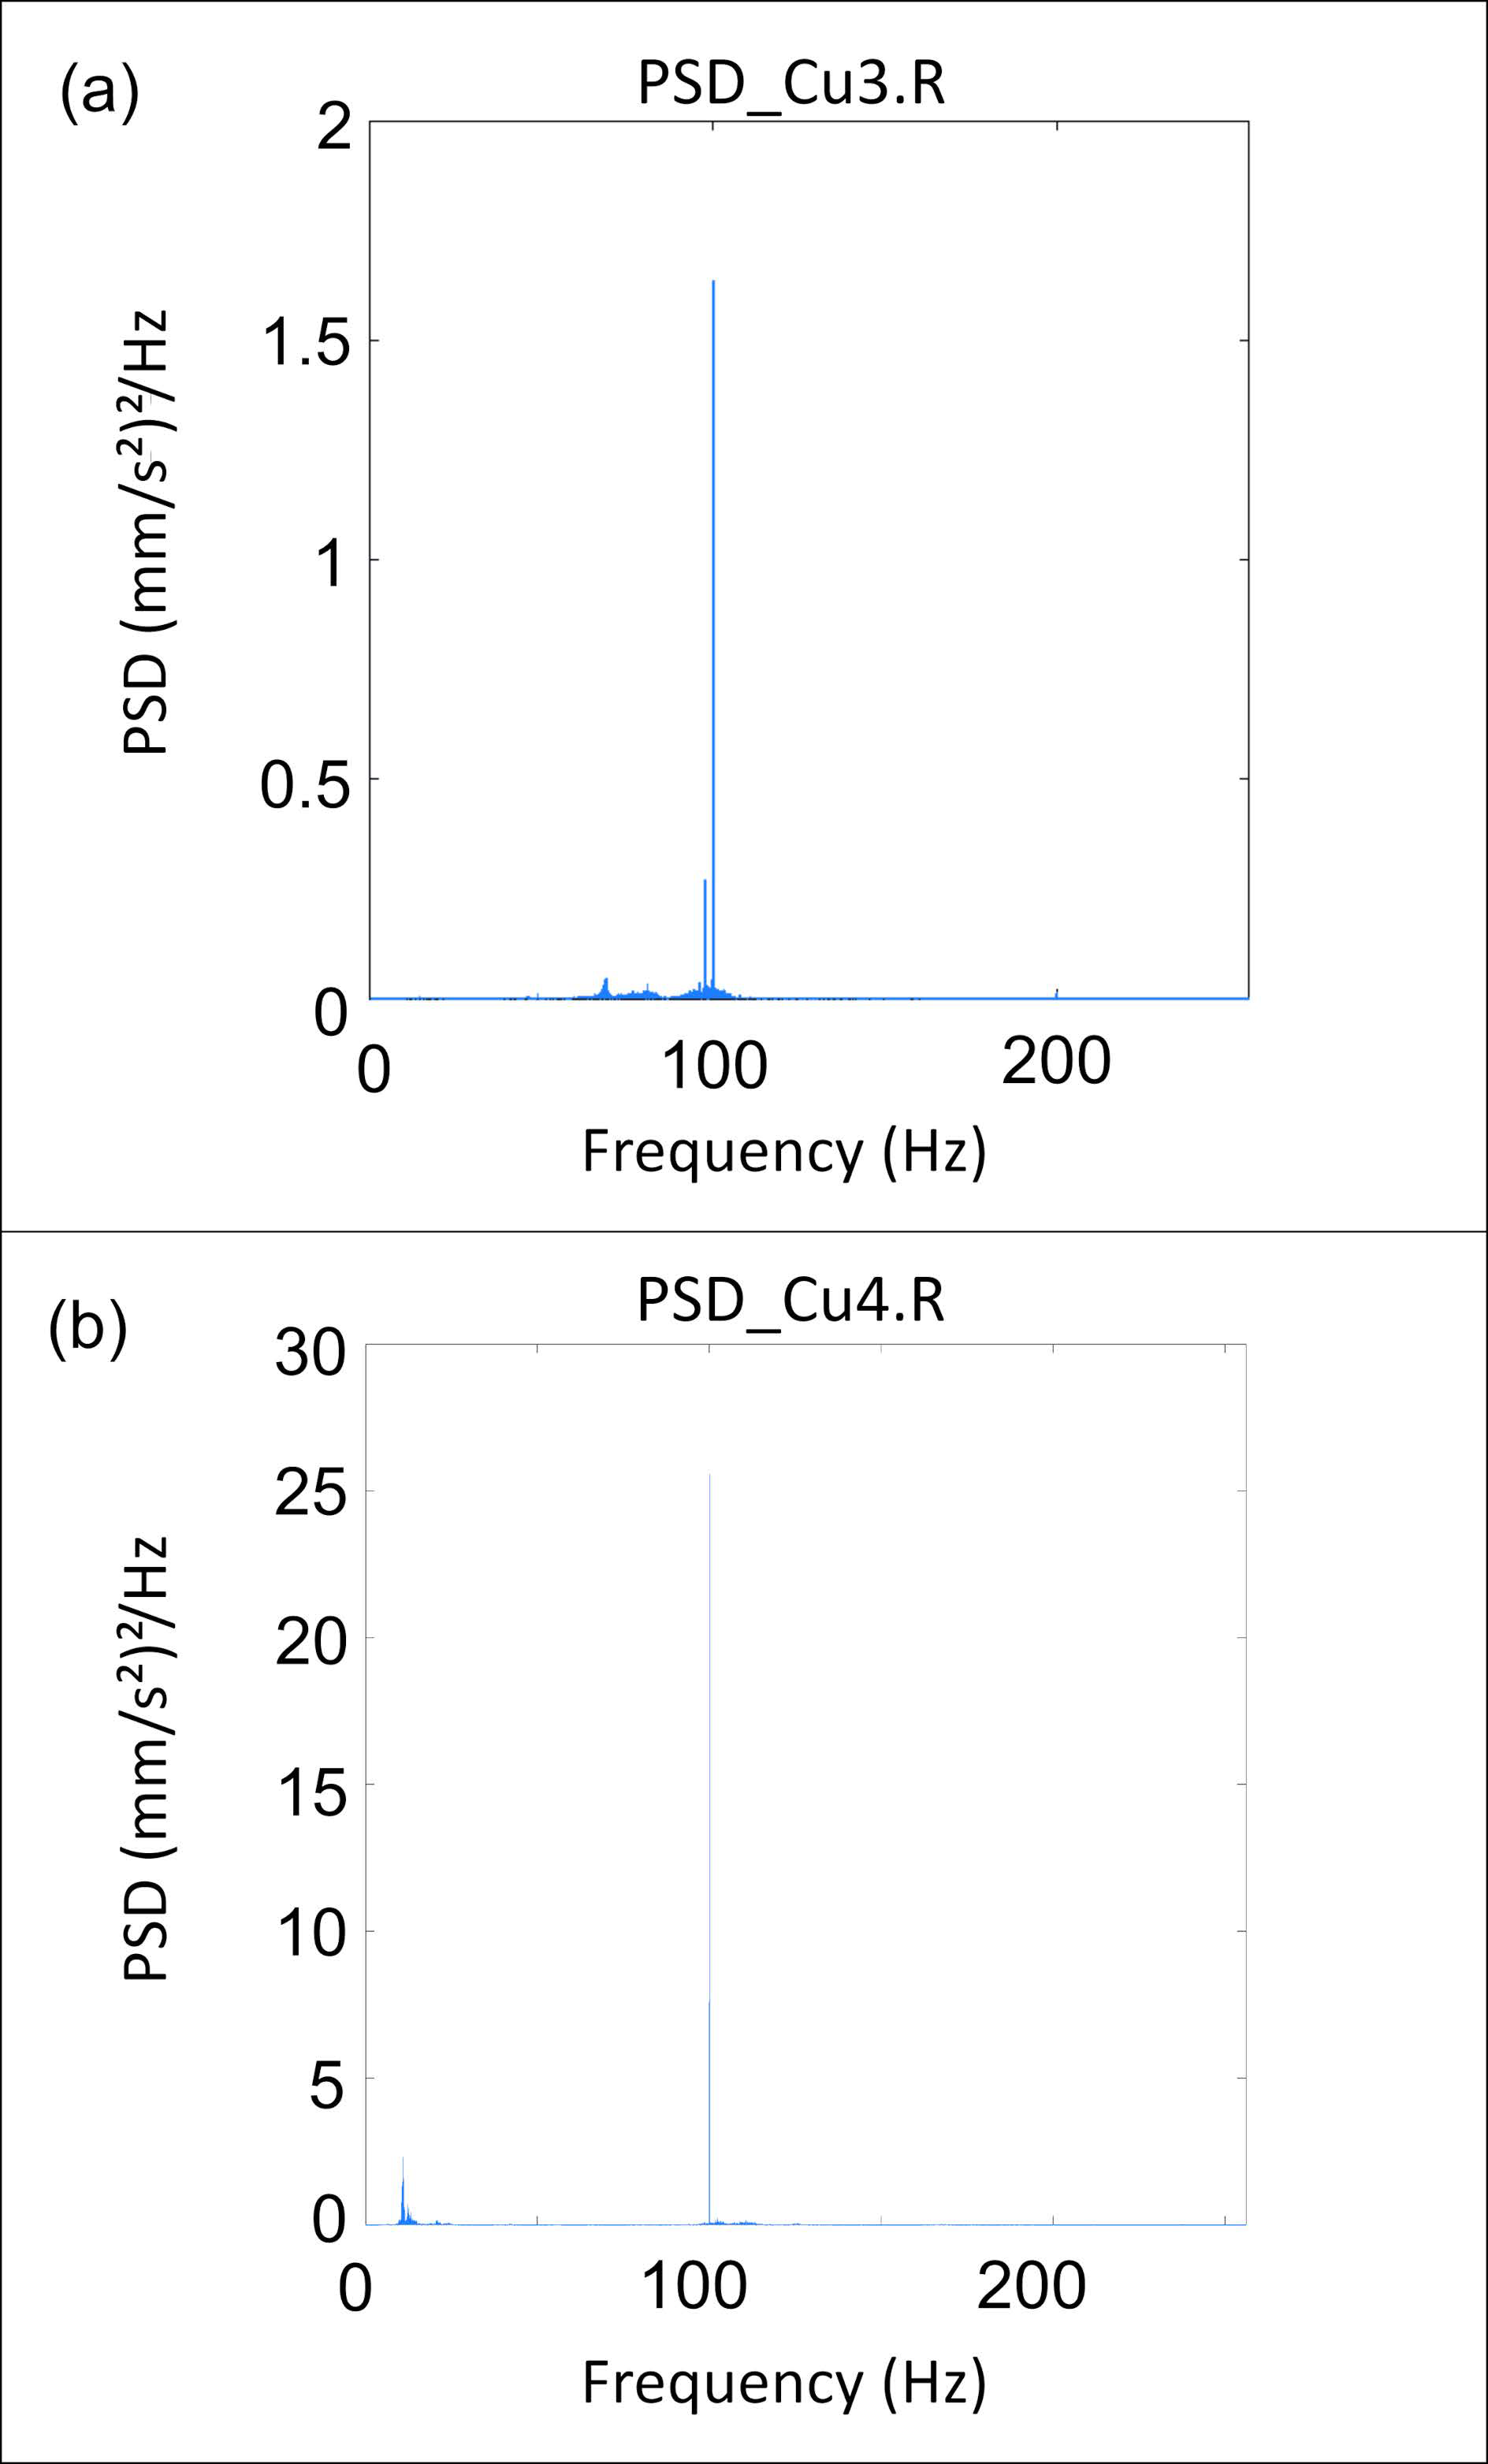
4.1.2. PSD Analysis Results
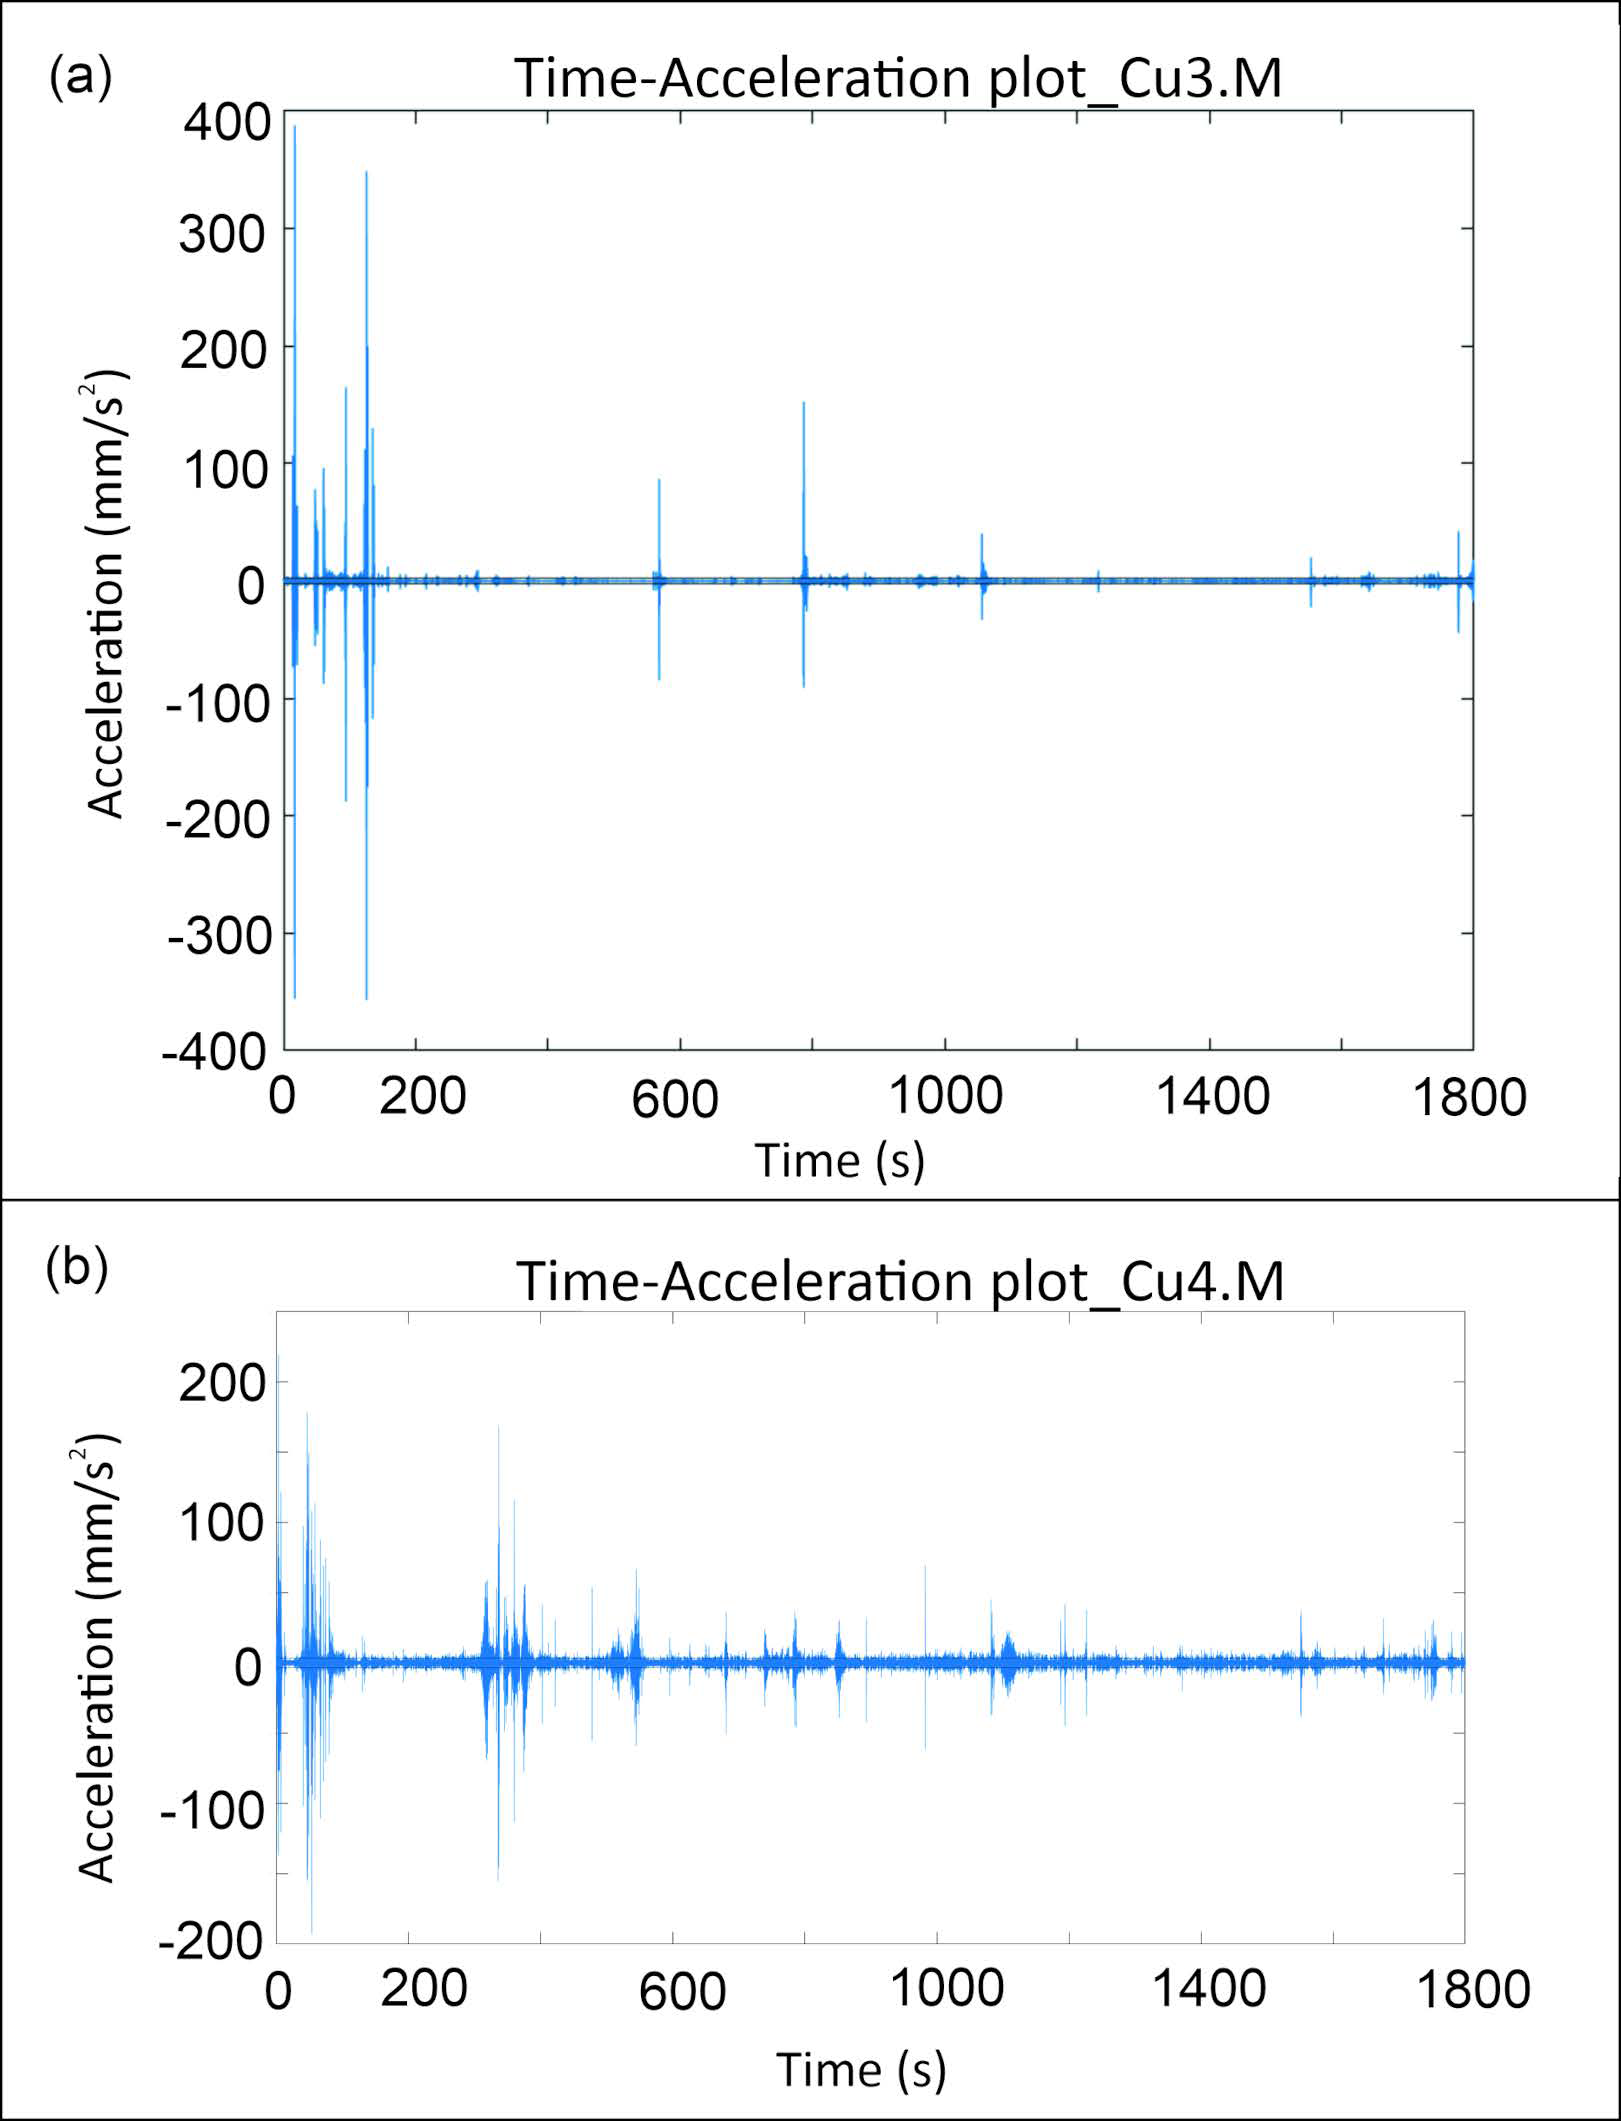
4.1.3. Acceleration Peak Analysis and RMS Analysis Results
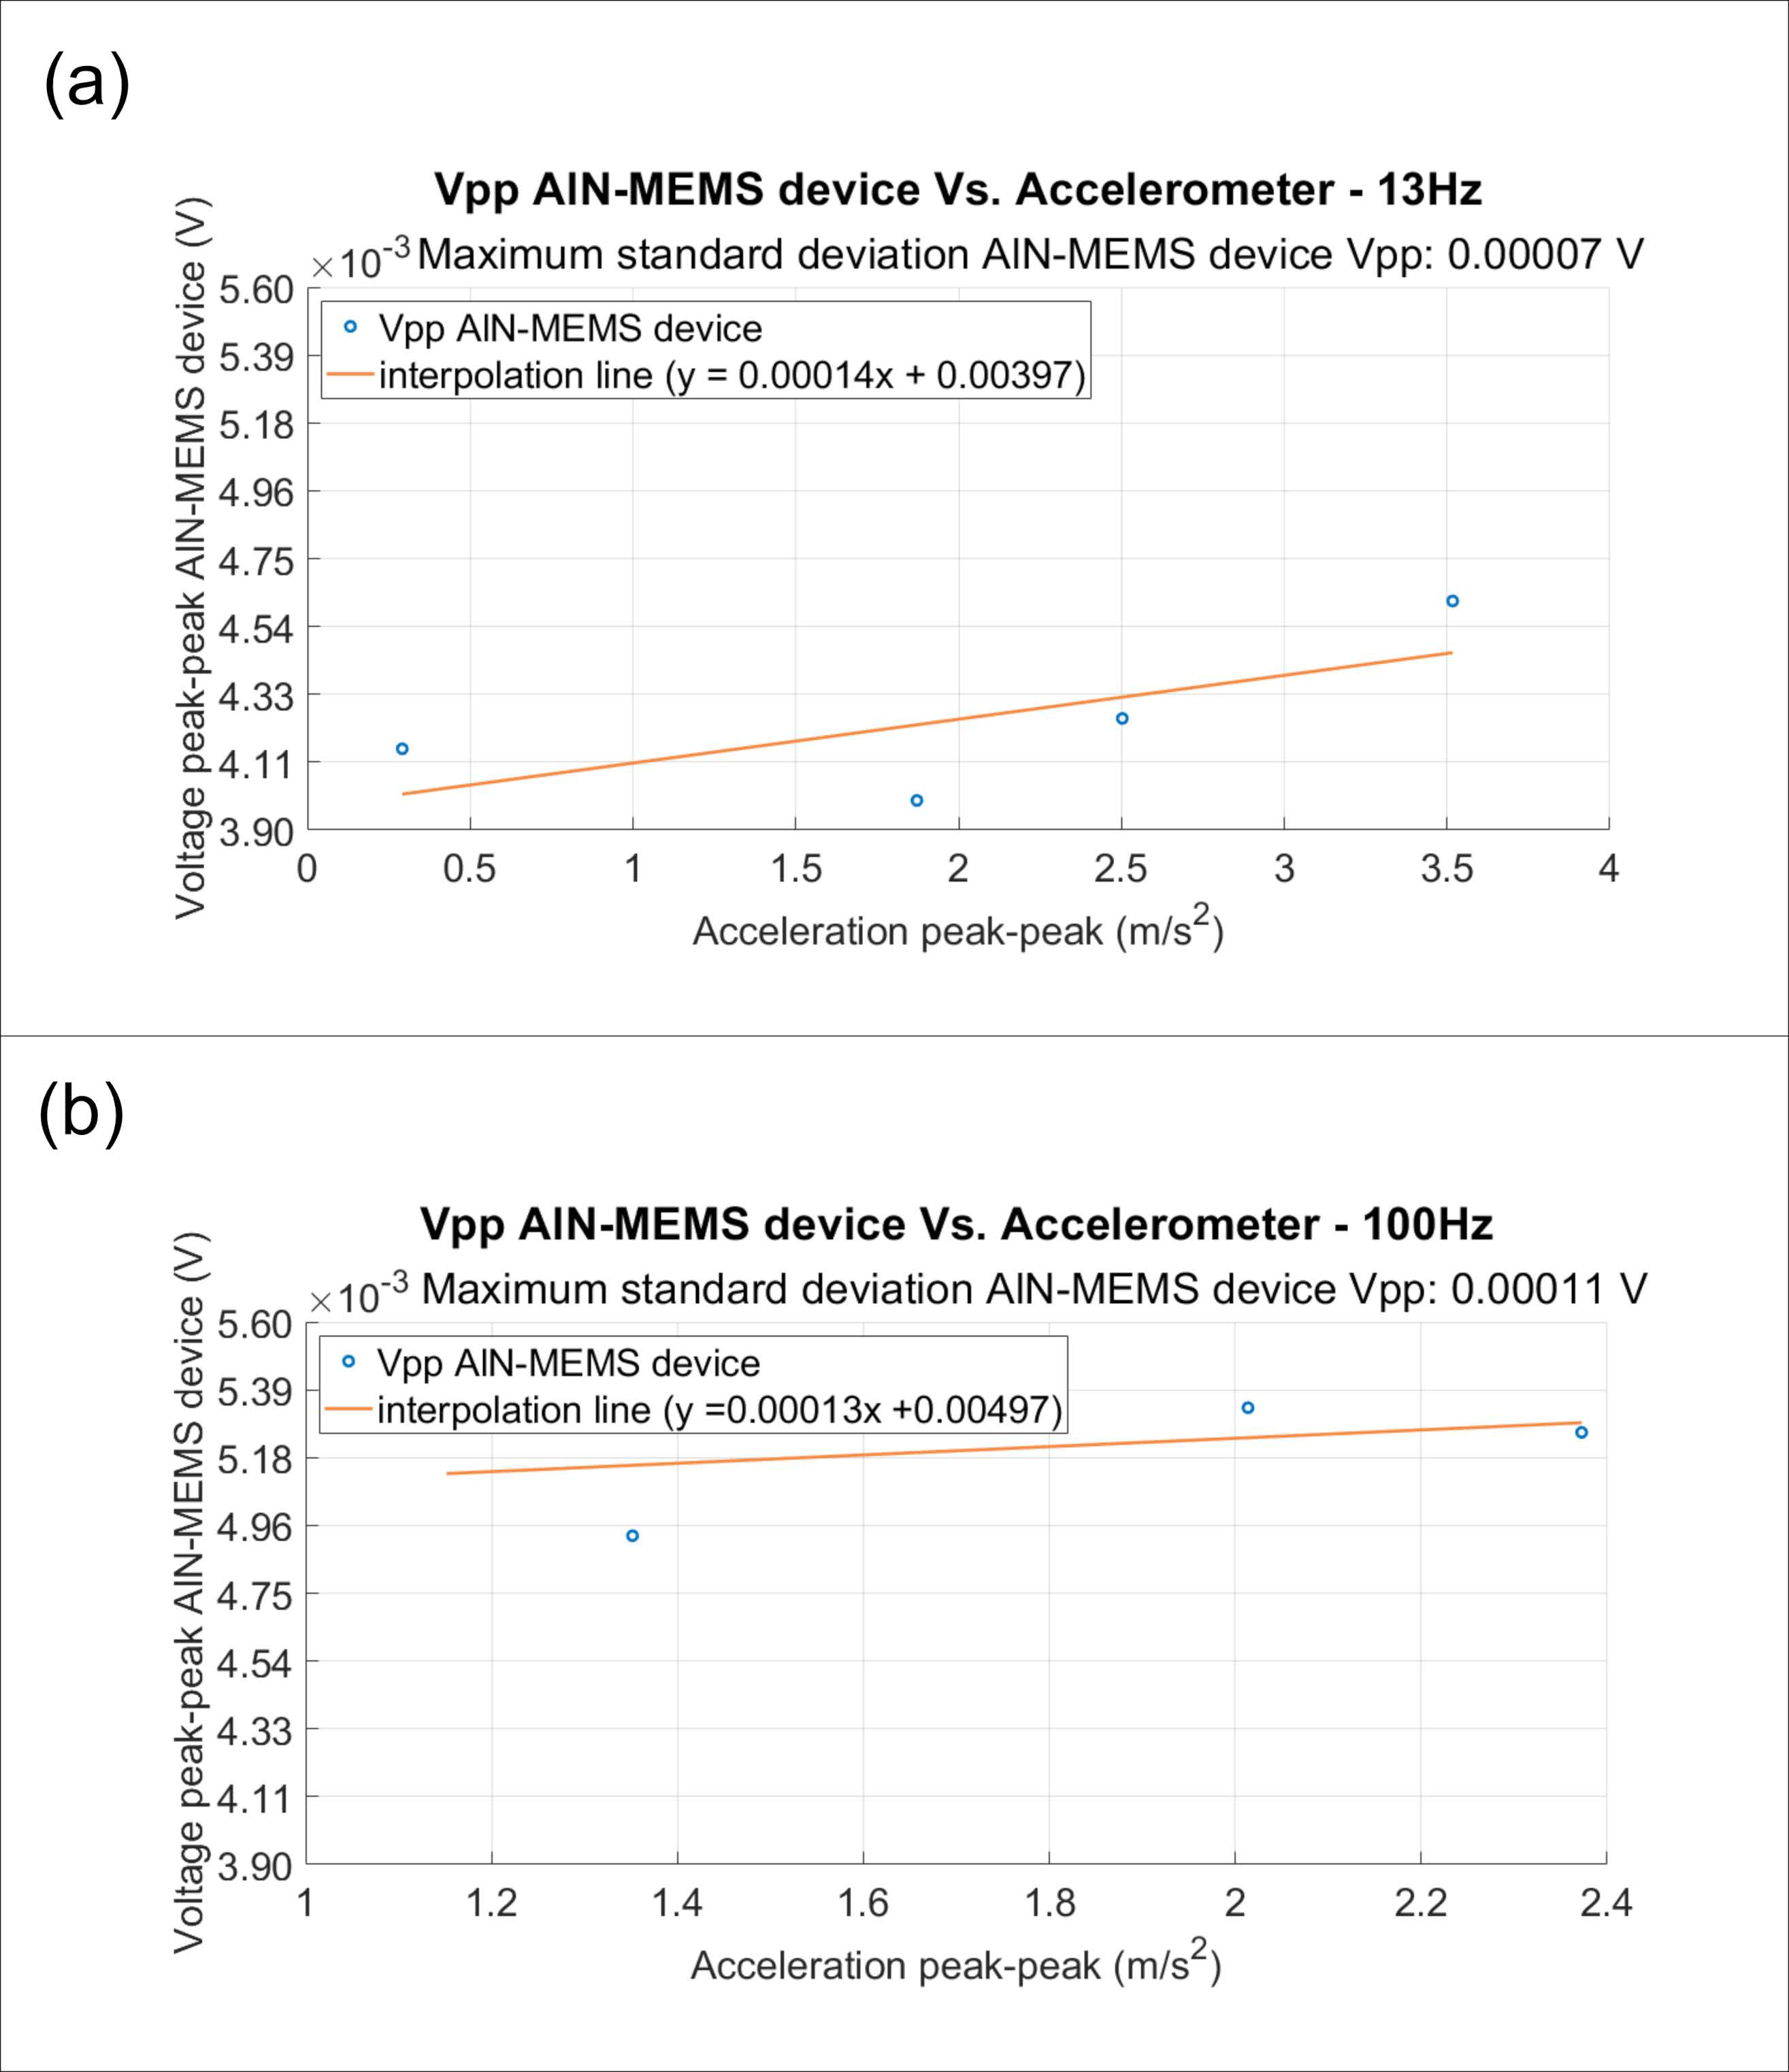
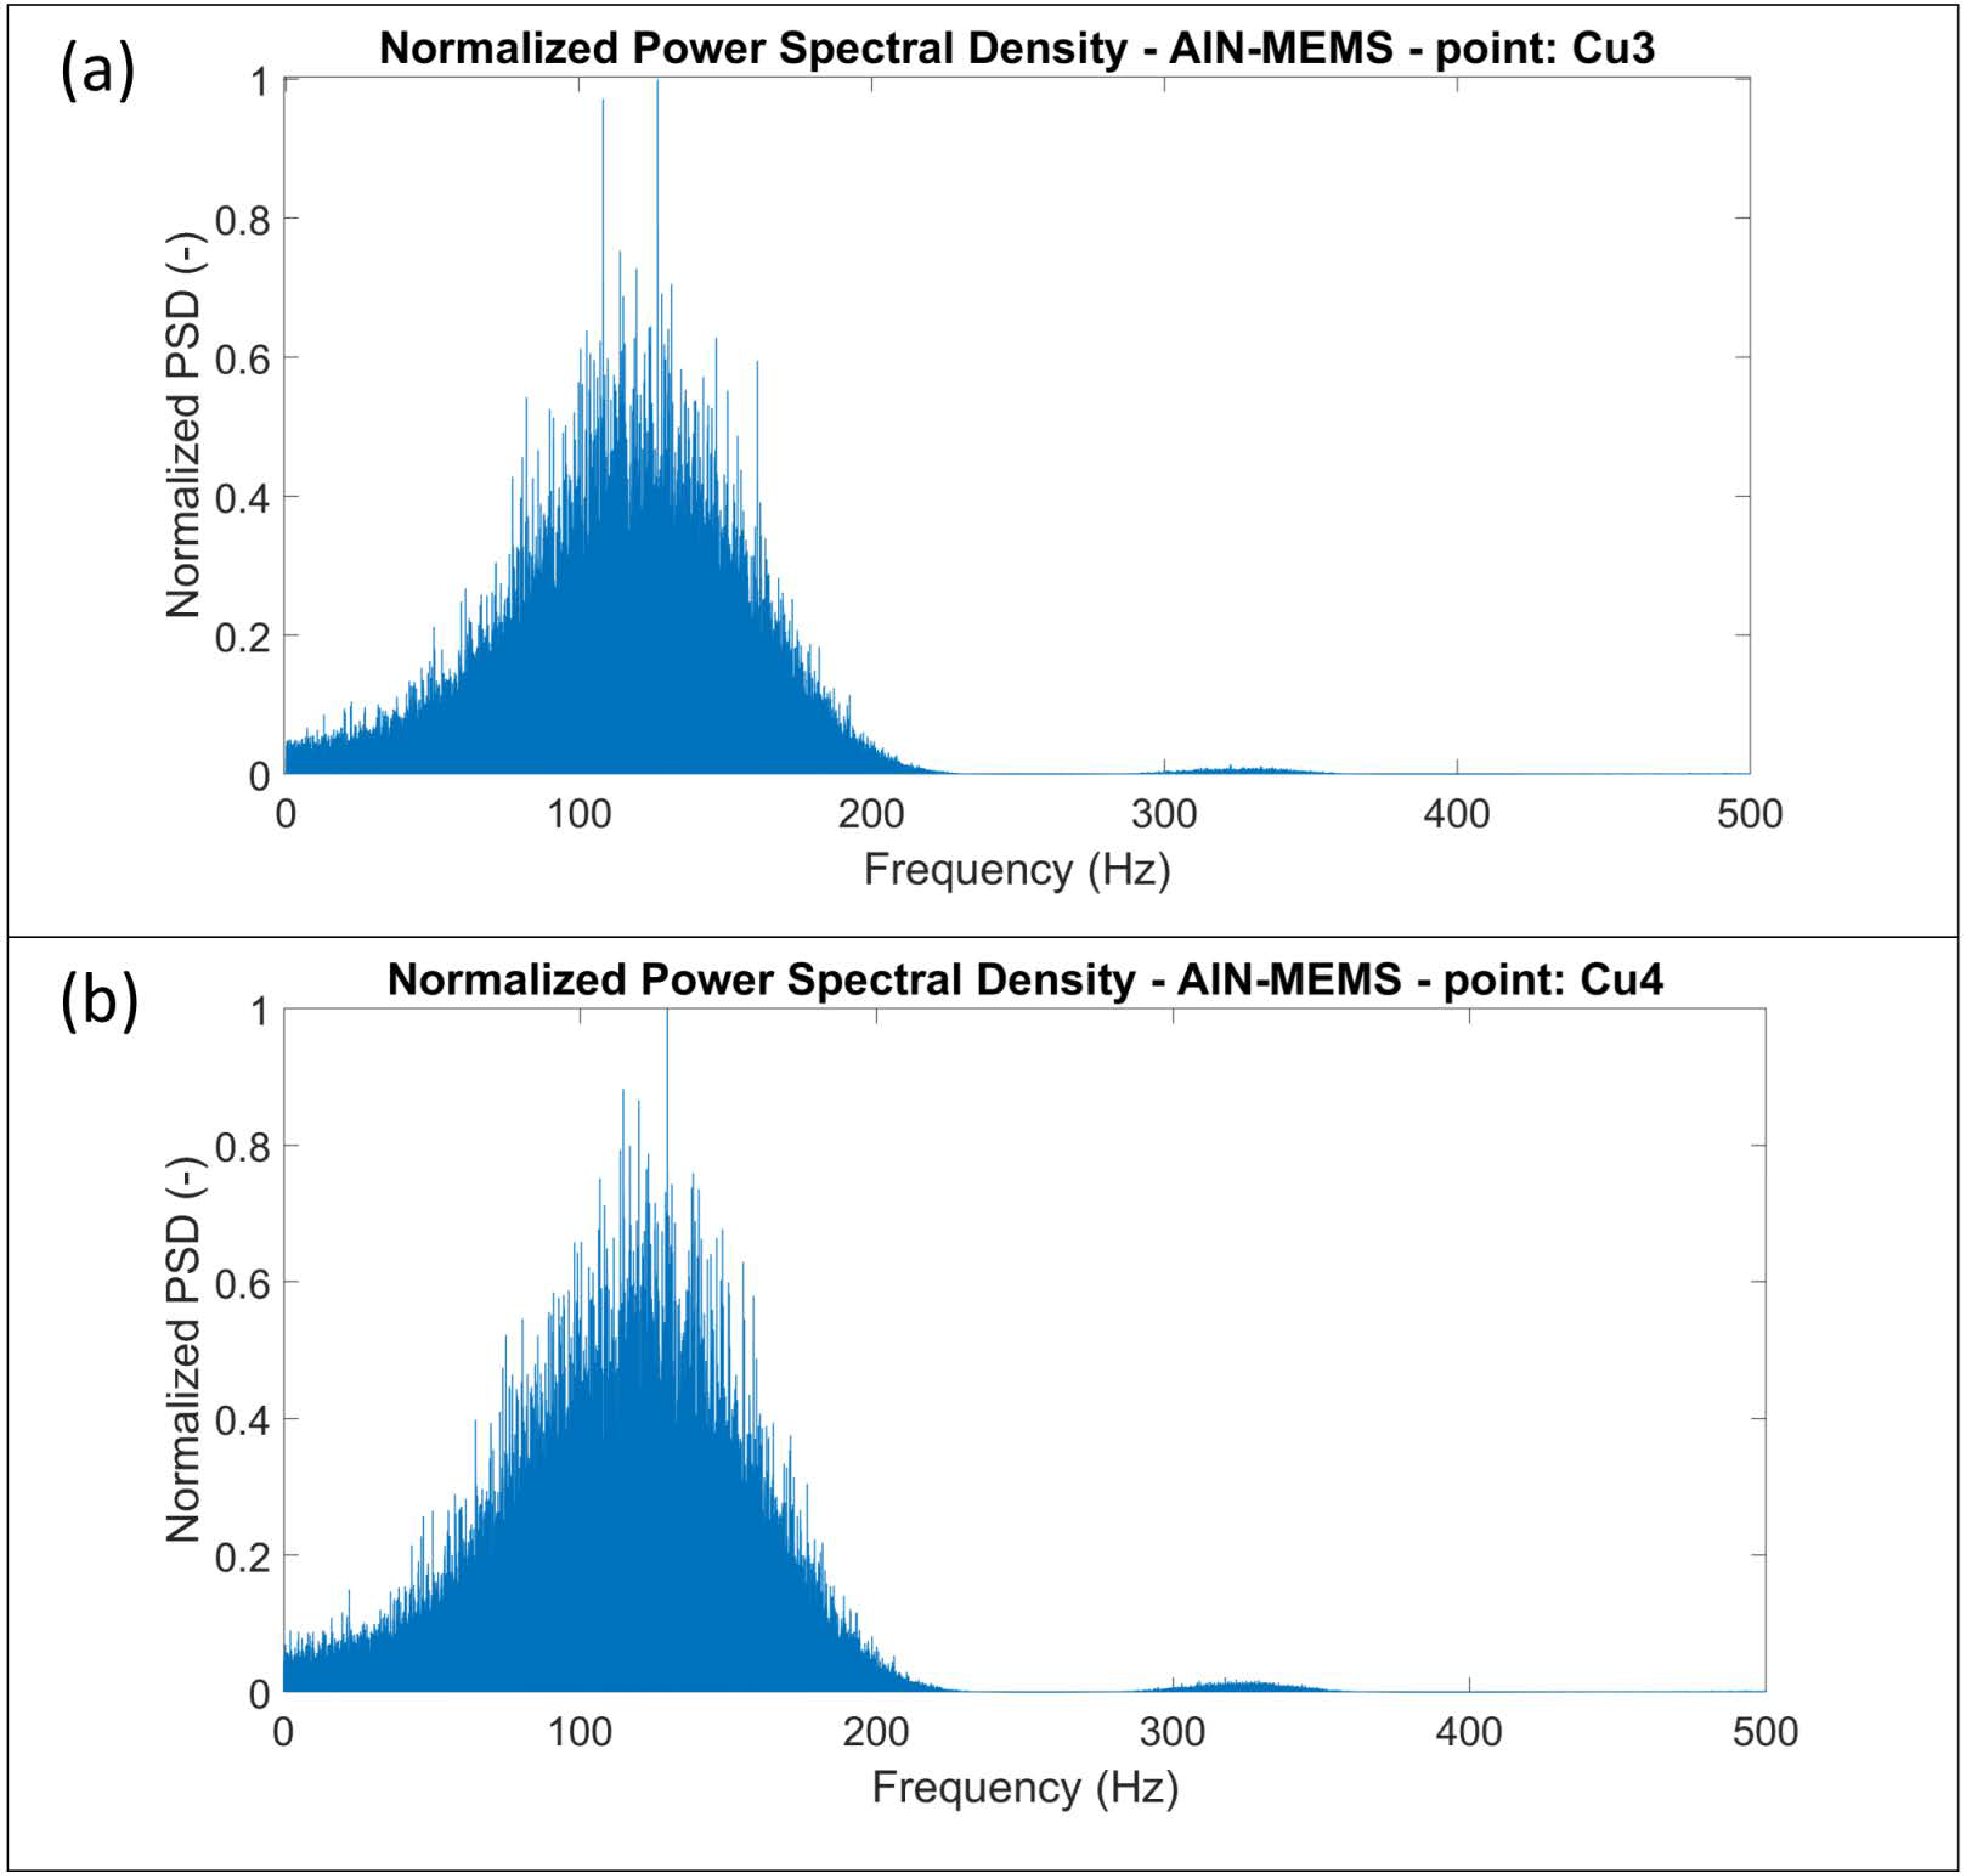
4.2. AlN-MEMS Data Analysis
5. Discussion
6. Conclusions
Author Contributions
Funding
Institutional Review Board Statement
Informed Consent Statement
Data Availability Statement
Acknowledgments
Conflicts of Interest
References
- Boscato, G.; Dal Cin, A.; Russo, S.; Sciarretta, F. SHM of historic damaged churches. Adv. Mat. Res 2014, 838–841, 2071–2078. [Google Scholar] [CrossRef]
- Brownjohn, J.M.W. Structural health monitoring of civil infrastructure. Philos. Trans. R. Soc. A 2006, 365, 589–622. [Google Scholar] [CrossRef]
- UNI 9916:2014; Criteri di Misura e Valutazione Degli Effetti Delle Vibrazioni Sugli Edifici (DIN 4150-3). Ente Nazionale Italiano di Unificazione (UNI): Milan, Italy, 2014.
- UNI 9614: 2017; Misura Delle Vibrazioni Negli Edifici e Criteri di Valutazione del Disturbo. Ente Nazionale Italiano di Unificazione (UNI): Milan, Italy, 2017.
- Smyth, A.W.; Brewick, P.; Greenbaum, R.; Chatzis, M.; Serotta, A.; Stünkel, I. Vibration mitigation and monitoring: A case study of construction in a museum. J. Am. Inst. Conserv. 2016, 55, 32–55. [Google Scholar] [CrossRef]
- Rainer, J.H. Effect of vibrations on historic buildings: An overview. Bull. Assoc. Preserv. Technol. 1982, 14, 2–10. [Google Scholar] [CrossRef]
- Rainieri, C.; Fabbrocino, G. Operational Modal Analysis of Civil Engineering Structures; Springer: New York, NY, USA, 2014; ISBN 978-1-4939-0766-3. [Google Scholar] [CrossRef]
- Pirrotta, A.; Russotto, S. A new OMA method to perform structural dynamic identification: Numerical and experimental investigation. Acta Mech. 2023, 234, 3737–3749. [Google Scholar] [CrossRef]
- Ewins, D.J. Modal Testing: Theory, Practice and Application; Mechanical Engineering Research Studies: Engineering Dynamics Series; Wiley: New York, NY, USA, 2009; ISBN 978-0-863-80218-8. [Google Scholar]
- Au, S.K. Operational Modal Analysis Modeling, Bayesian Inference, Uncertainty Laws, 1st ed.; Springer: Singapore, 2017; ISBN 981-10-4118-0. [Google Scholar]
- Ozbek, M.; Rixen, D.J. Operational modal analysis of a 2.5 mw wind turbine using optical measurement techniques and strain gauges. Wind. Energy 2013, 16, 367–381. [Google Scholar] [CrossRef]
- Jiang, S.F.; Qiao, Z.H.; Li, N.L.; Luo, J.B.; Shen, S.; Wu, M.H.; Zhang, Y. Structural Health Monitoring System Based on FBG Sensing Technique for Chinese Ancient Timber Buildings. Sensors 2020, 20, 110. [Google Scholar] [CrossRef] [PubMed]
- Minardo, A.; Persichetti, G.; Testa, G.; Zeni, L.; Bernini, R. Long term structural health monitoring by Brillouin fibre-optic sensing: A real case. J. Geophys. Eng. 2012, 9, S64. [Google Scholar] [CrossRef]
- Nöther, N.; Wosniok, A.; Krebber, K. A Distributed fiber optic sensor system for dike monitoring using Brillouin frequency domain analysis. In Proceedings Volume 7003, Optical Sensors 2008; SPIE: Bellingham, WA, USA, 2008; p. 700303. [Google Scholar] [CrossRef]
- Peeters, B.; Gajdatsy, P.; Aarnoutse, P.; Janssens, K.; Desmet, W. Vibroacoustic operational modal analysis using engine run-up data. In Proceedings of the IOMAC 2009-3rd International Operational Modal Analysis Conference, Portonovo, Italy, 4–6 May 2009; pp. 447–455. [Google Scholar]
- Rinaldi, C.; Ciambella, J.; Gattulli, V. Image-based operational modal analysis and damage detection validated in an instrumented small-scale steel frame structure. Mech. Syst. Signal Process. 2022, 168, 108640. [Google Scholar] [CrossRef]
- Abdullahi, S.I.; Che Mustapha, N.A.; Habaebi, M.H.; Islam, M.R. Accelerometer Based Structural Health Monitoring System on the Go: Developing Monitoring Systems with NI LabVIEW. Int. J. Online Biomed. Eng. 2019, 15, 32. [Google Scholar] [CrossRef]
- Warsi, Z.H.; Irshad, S.M.; Khan, F.; Shahbaz, M.A.; Junaid, M.; Amin, S.U. Sensors for Structural Health Monitoring: A Review. In Proceedings of the 2019 Second International Conference on Latest Trends in Electrical Engineering and Computing Technologies (INTELLECT), Karachi, Pakistan, 13–14 November 2019; pp. 1–6. [Google Scholar] [CrossRef]
- Ozevin, D. Microelectromechanical systems for assessing and monitoring civil infrastructures. In Sensor Technologies for Civil Infrastructures; Woodhead Publishing: Sawston, UK, 2022; pp. 237–272. ISBN 978-0-081-02696-0. [Google Scholar]
- Kumar, J.; Bajpai, R. Application of Mems in Bridge Structures Health Monitoring. Int. J. Eng. Innov. Technol. (IJEIT) 2012, 2. [Google Scholar]
- Hossain, M.I.; Zahid, M.S.; Chowdhury, M.A.; Hossain, M.M.M.; Hossain, N. MEMS-based energy harvesting devices for low-power applications–a review. Results Eng. 2023, 101264. [Google Scholar] [CrossRef]
- Kang, J.G.; Kim, H.; Shin, S.; Kim, B.S. Fluid flow to electricity: Capturing flow-induced vibrations with micro-electromechanical-system-based piezoelectric energy harvester. Micromachines 2024, 15, 581. [Google Scholar] [CrossRef]
- Ejeian, F.; Azadi, S.; Razmjou, A.; Orooji, Y.; Kottapalli, A.; Ebrahimi Warkiani, M.; Asadnia, M. Design and Applications of MEMS Flow Sensors: A Review. Sens. Actuators A Phys. 2019, 295, 483–502. [Google Scholar] [CrossRef]
- Tuoi, T.T.K.; Van Toan, N.; Ono, T. Thermal energy harvester using ambient temperature fluctuations for self-powered wireless IoT sensing systems: A review. Nano Energy 2023, 121, 109186. [Google Scholar] [CrossRef]
- Hao, D.; Qi, L.; Tairab, A.M.; Ahmed, A.; Azam, A.; Luo, D.; Pan, Y.; Zhang, Z.; Yan, J. Solar energy harvesting technologies for PV self-powered applications: A comprehensive review. Renew. Energ. 2022, 188, 678–697. [Google Scholar] [CrossRef]
- Muscalu, G.; Firtat, B.; Anghelescu, A.; Moldovan, C.; Dinulescu, S.; Brasoveanu, C.; Ekwinska, M.; Szmigiel, D.; Zaborowski, M.; Zajac, J.; et al. Piezoelectric MEMS Energy Harvester for Low-Power Applications. Electronics 2024, 13, 2087. [Google Scholar] [CrossRef]
- Moho. TROMINO Users Manual, p. 144. 2020. Available online: https://moho.world/en/ (accessed on 15 August 2024).
- Grassi, S.; Barbano, M.S.; Pirrotta, C.; Morreale, G.; Imposa, S. Seismic Soil–Structure Interaction of Three Historical Buildings of the University of Catania (Sicily, Italy). Heritage 2022, 5, 3562–3587. [Google Scholar] [CrossRef]
- Grassi, S.; Patti, G.; Tiralongo, P.; Imposa, S.; Aprile, D. Applied geophysics to support the cultural heritage safeguard: A quick and non-invasive method to evaluate the dynamic response of a great historical interest building. J. Appl. Geophys. 2021, 189, 104321. [Google Scholar] [CrossRef]
- Imposa, G.; Grassi, S.; Barontini, A.; Morreale, G.; Russo, S.; Lourenço, P.B.; Imposa, S. Extended Tromograph Surveys for a Full Experimental Characterisation of the San Giorgio Cathedral in Ragusa (Italy). Sensors 2023, 23, 889. [Google Scholar] [CrossRef]
- Imposa, S.; Cuomo, M.; Contrafatto, L.; Mineo, S.; Grassi, S.; Li Rosi, D.; Barbano, M.S.; Morreale, G.; Galasso, M.; Pappalardo, G. Engineering Geological and Geophysical Studies Supporting Finite Element Analysis of Historical Buildings after Dynamic Identification. Geosciences 2023, 13, 84. [Google Scholar] [CrossRef]
- Paolucci, E.; Albarello, D.; D’Amico, S.; Lunedei, E.; Martelli, L.; Mucciarelli, M.; Pileggi, D. A large scale ambient vibration survey in the area damaged by May–June 2012 seismic sequence in Emilia Romagna, Italy. B. Earthq. Eng. 2015, 13, 3187–3206. [Google Scholar] [CrossRef]
- Gueli, A.M.; Imposa, S.; Mancuso, B.; Pinto, V.; Pirrotta, C.; Politi, G.; Salerno, G.A.; Trigona, C. Castello Ursino Museum’s Structural Monitoring Enhanced by Self-Energized Solutions. In Proceedings of the 21st International Multi-Conference on Systems, Signals & Devices (SSD), Erbil, Iraq, 22–25 April 2024; IEEE: Piscataway, NJ, USA, 2024; pp. 292–297. [Google Scholar] [CrossRef]
- Jwo, D.J.; Chang, W.Y.; Wu, I.H. Windowing techniques, the Welch Method for improvement of power spectrum estimation. Comput. Mater. Contin. 2021, 67, 3983–4003. [Google Scholar] [CrossRef]
- Welch, P.D. The use of Fast Fourier Transform for the estimation of power spectra: A method based on time averaging over short, modified periodograms. IEEE Trans. Acoust. Speech 1967, 15, 70–73. [Google Scholar] [CrossRef]
- Nussbaumer, H.J. The Fast Fourier Transform. In Fast Fourier Transform and Convolution Algorithms; Springer Series in Information Sciences; Springer: Berlin/Heidelberg, Germany, 1982; p. 2. [Google Scholar] [CrossRef]
- Monson, H.H. Statistical Digital Signal Processing and Modeling; John Wiley & Sons: New York, NY, USA, 1996; p. 624. ISBN 978-0-471-59431-4. [Google Scholar]
- Stoica, P.; Randolph, M. Spectral Analysis of Signals; Prentice Hall: Upper Saddle River, NJ, USA, 2005; p. 474. ISBN 0-13-113956-8. [Google Scholar]
- Trigona, C.; Sinatra, V.; Crea, G.; Andò, B.; Baglio, S. Characterization of a PiezoMUMPs microsensor for contactless measurements of DC Electrical current. IEEE Trans. Instrum. Meas. 2019, 69, 1387–1396. [Google Scholar] [CrossRef]
- Alrashdan, M.H.; Hamzah, A.A.; Majlis, B.Y. Power density optimization for mems piezoelectric micro power generator below 100 Hz applications. Microsyst. Technol. 2018, 24, 2071–2084. [Google Scholar] [CrossRef]
- Chéour, R.; Jmal, M.W.; Khriji, S.; El Houssaini, D.; Trigona, C.; Abid, M.; Kanoun, O. Towards hybrid energy-efficient power management in wireless sensor networks. Sensors 2021, 22, 301. [Google Scholar] [CrossRef]
- Giusa, F.; Maiorca, F.; Noto, A.; Trigona, C.; Andò, B.; Baglio, S. A diode-less mechanical voltage multiplier: A novel transducer for vibration energy harvesting. Sens. Actuators A Phys. 2014, 212, 34–41. [Google Scholar] [CrossRef]


| Measurement | Frequency (Hz) from Spectral Analysis | Acceleration Peak (mm/s2) for Frequency (Hz) from Spectral Analysis |
|---|---|---|
| Cu1.M | 11.20 | 0.016 |
| 15.22 | 0.015 | |
| 106.38 | 0.016 | |
| 136.72 | 0.019 | |
| Cu2.R | 12.87 | 0.179 |
| 107.87 | 0.051 | |
| Cu2.M | 12.52 | 0.280 |
| 16.78 | 0.130 | |
| 104.90 | 0.110 | |
| Cu3.R | 14.29 | 0.016 |
| 68.56 | 0.037 | |
| 98.53 | 0.048 | |
| Cu3.M | 14.19 | 0.020 |
| 90.62 | 0.070 | |
| Cu4.R | 10.97 | 0.190 |
| 102.74 | 0.068 | |
| Cu4.M | 10.89 | 0.360 |
| 104.91 | 0.220 |
| Measurement | Frequency (Hz) | PSD Peak (mm/s2)2/Hz |
|---|---|---|
| Cu1.M | 100.04 | 0.39 |
| Cu2.R | 13.13 | 3.40 |
| 100.04 | 5.35 | |
| Cu2.M | 13.03 | 5.57 |
| 100.06 | 2.97 | |
| Cu3.R | 100.04 | 1.64 |
| Cu3.M | 93.21 | 0.25 |
| 100.00 | 0.24 | |
| Cu4.R | 100.05 | 25.57 |
| Cu4.M | 100.04 | 9.98 |
| 120.13 | 30.47 |
| Measurement | Maximum Acceleration Peak (mm/s2) | RMS (mm/s2) |
|---|---|---|
| Cu1.M | 125.40 | 0.55 |
| Cu2.R | 115.51 | 1.93 |
| Cu2.M | 365.56 | 2.62 |
| Cu3.R | 20.40 | 0.53 |
| Cu3.M | 388.07 | 2.28 |
| Cu4.R | 40.66 | 1.42 |
| Cu4.M | 219.41 | 3.59 |
Disclaimer/Publisher’s Note: The statements, opinions and data contained in all publications are solely those of the individual author(s) and contributor(s) and not of MDPI and/or the editor(s). MDPI and/or the editor(s) disclaim responsibility for any injury to people or property resulting from any ideas, methods, instructions or products referred to in the content. |
© 2024 by the authors. Licensee MDPI, Basel, Switzerland. This article is an open access article distributed under the terms and conditions of the Creative Commons Attribution (CC BY) license (https://creativecommons.org/licenses/by/4.0/).
Share and Cite
Pirrotta, C.; Gueli, A.M.; Imposa, S.; Salerno, G.A.; Trigona, C. Vibration Analysis at Castello Ursino Picture Gallery (Sicily, Italy) for the Implementation of Self-Generating AlN-MEMS Sensors. Sensors 2024, 24, 5617. https://doi.org/10.3390/s24175617
Pirrotta C, Gueli AM, Imposa S, Salerno GA, Trigona C. Vibration Analysis at Castello Ursino Picture Gallery (Sicily, Italy) for the Implementation of Self-Generating AlN-MEMS Sensors. Sensors. 2024; 24(17):5617. https://doi.org/10.3390/s24175617
Chicago/Turabian StylePirrotta, Claudia, Anna M. Gueli, Sebastiano Imposa, Giuliano A. Salerno, and Carlo Trigona. 2024. "Vibration Analysis at Castello Ursino Picture Gallery (Sicily, Italy) for the Implementation of Self-Generating AlN-MEMS Sensors" Sensors 24, no. 17: 5617. https://doi.org/10.3390/s24175617