

A New Measure for Quantifying Four-Limb Coordination of Human Gait Based on Mobility Sensors

Abstract
:1. Introduction
- Providing an approach for assessing temporal coordination between all possible limb pairings (e.g., leg–arm) during walking.
- Developing a novel metric for quantifying quadruple coordination based on the accuracy and consistency of the interlimb phasing relation of the left–right stepping rhythmicity.
- Assessing the relationship between arm swing amplitude and inter limb coordination.
2. Materials and Methods
2.1. Participants
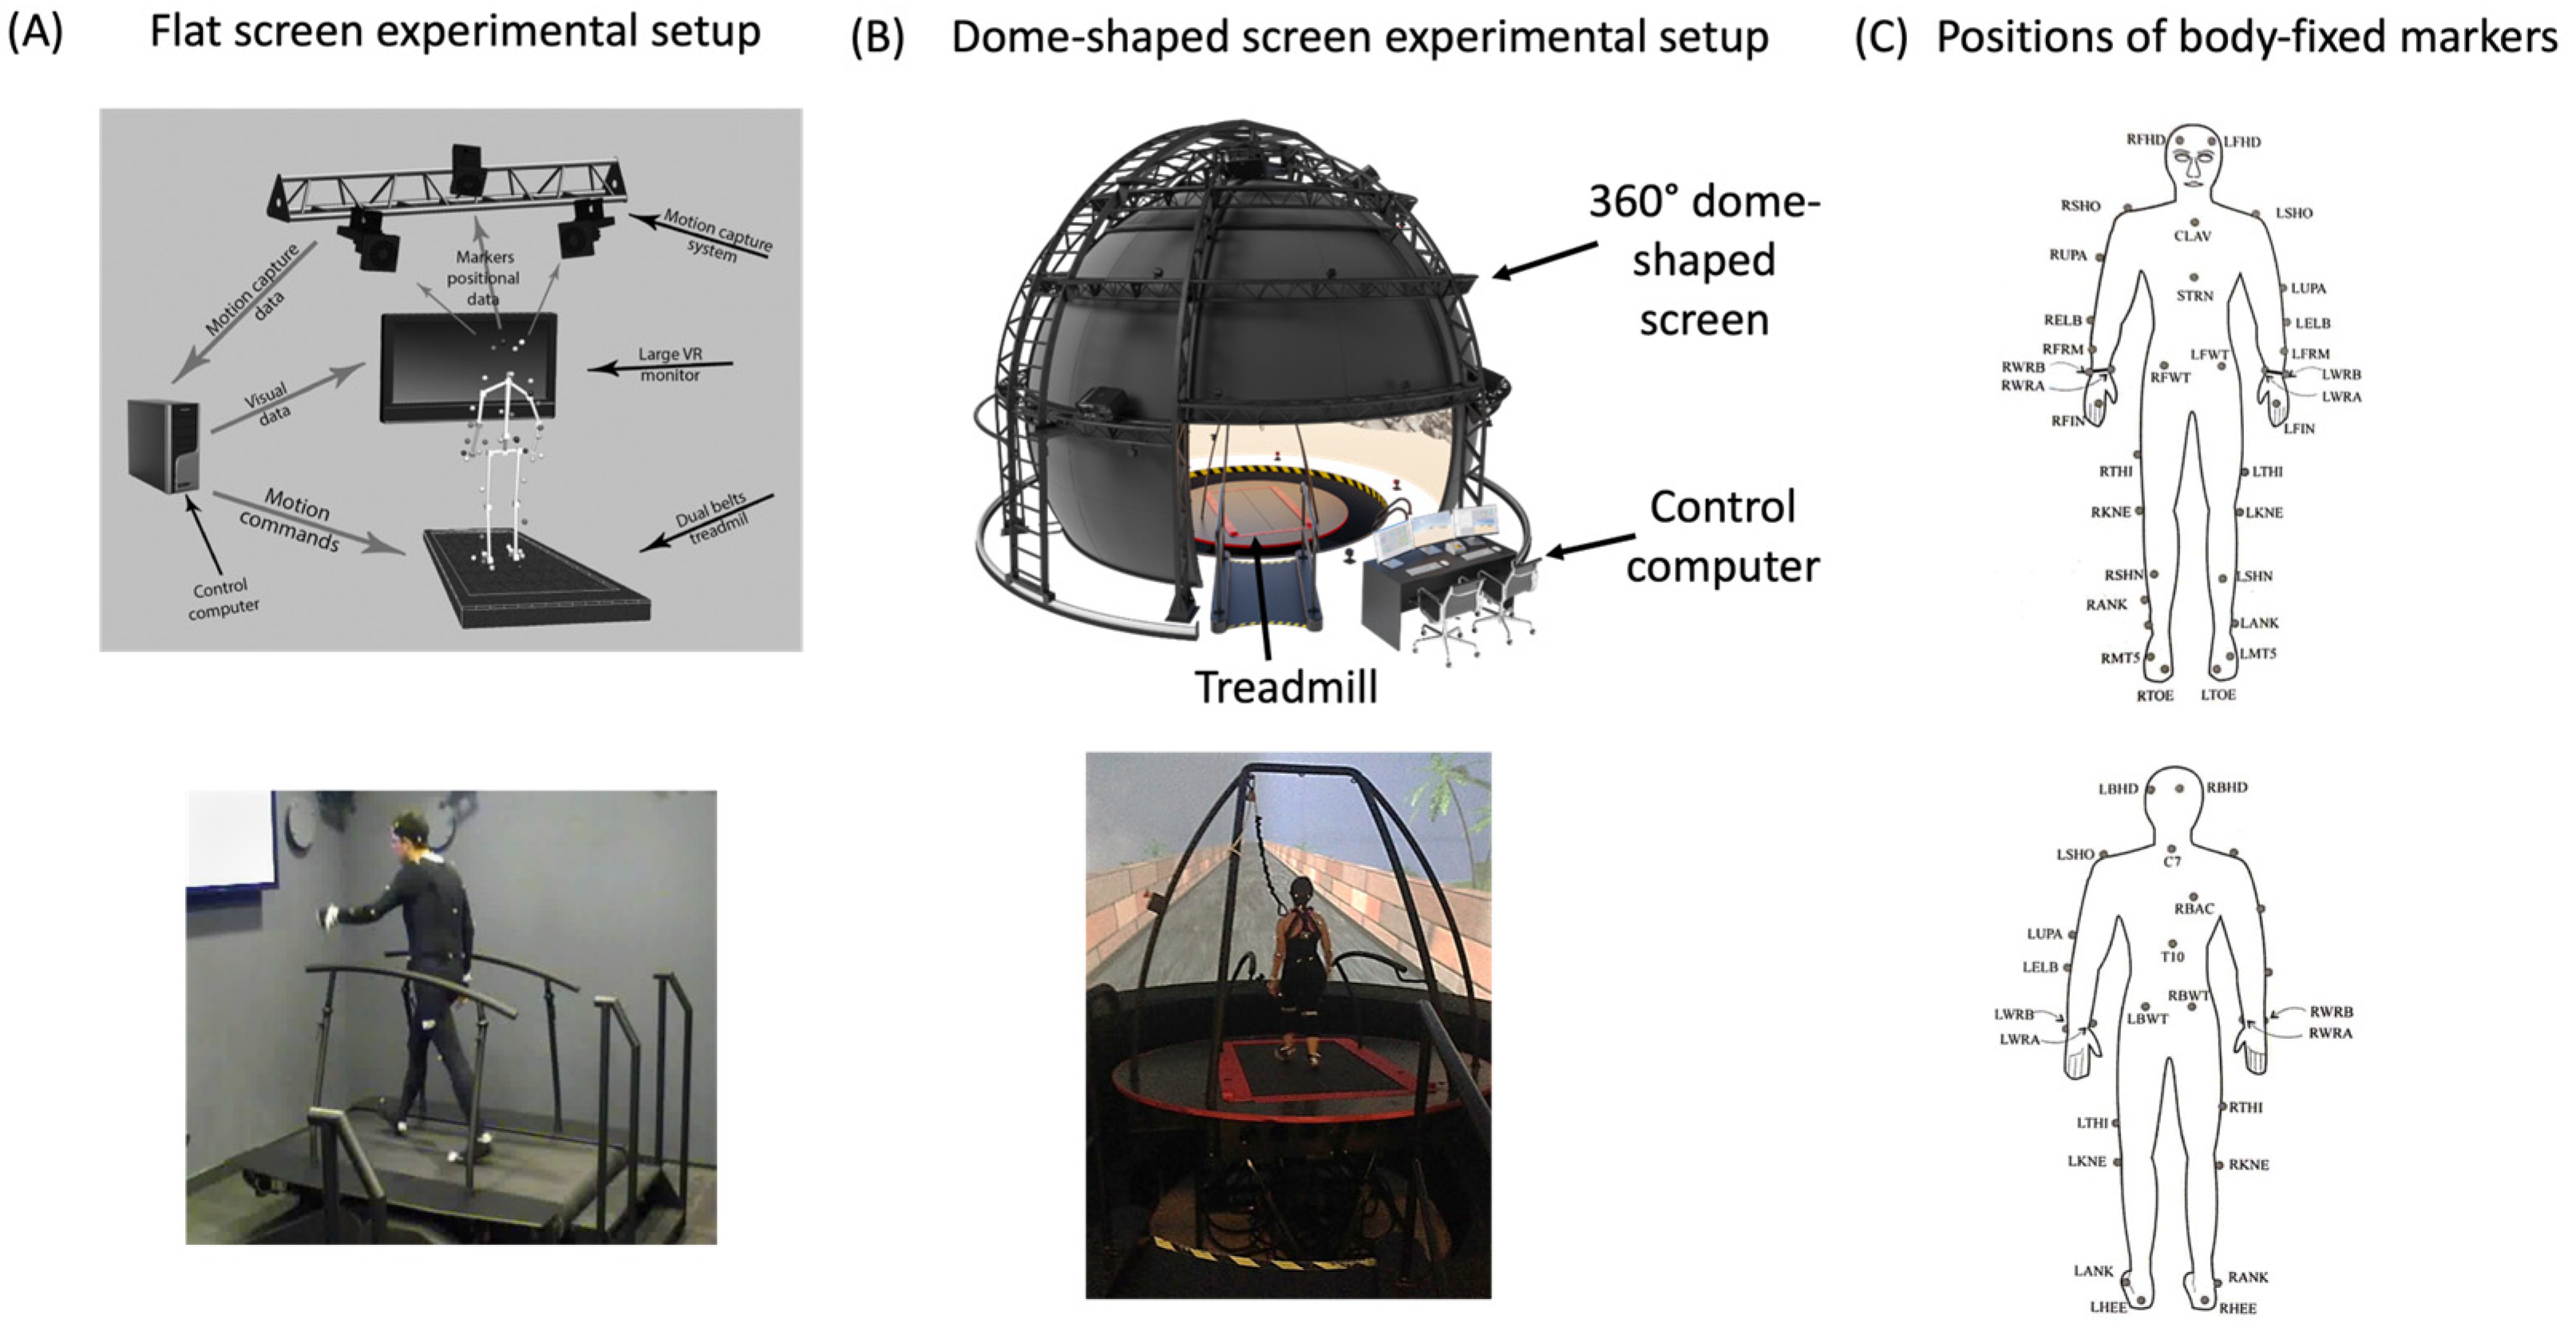
2.2. Apparatus
2.3. Procedure
2.4. Data Analysis
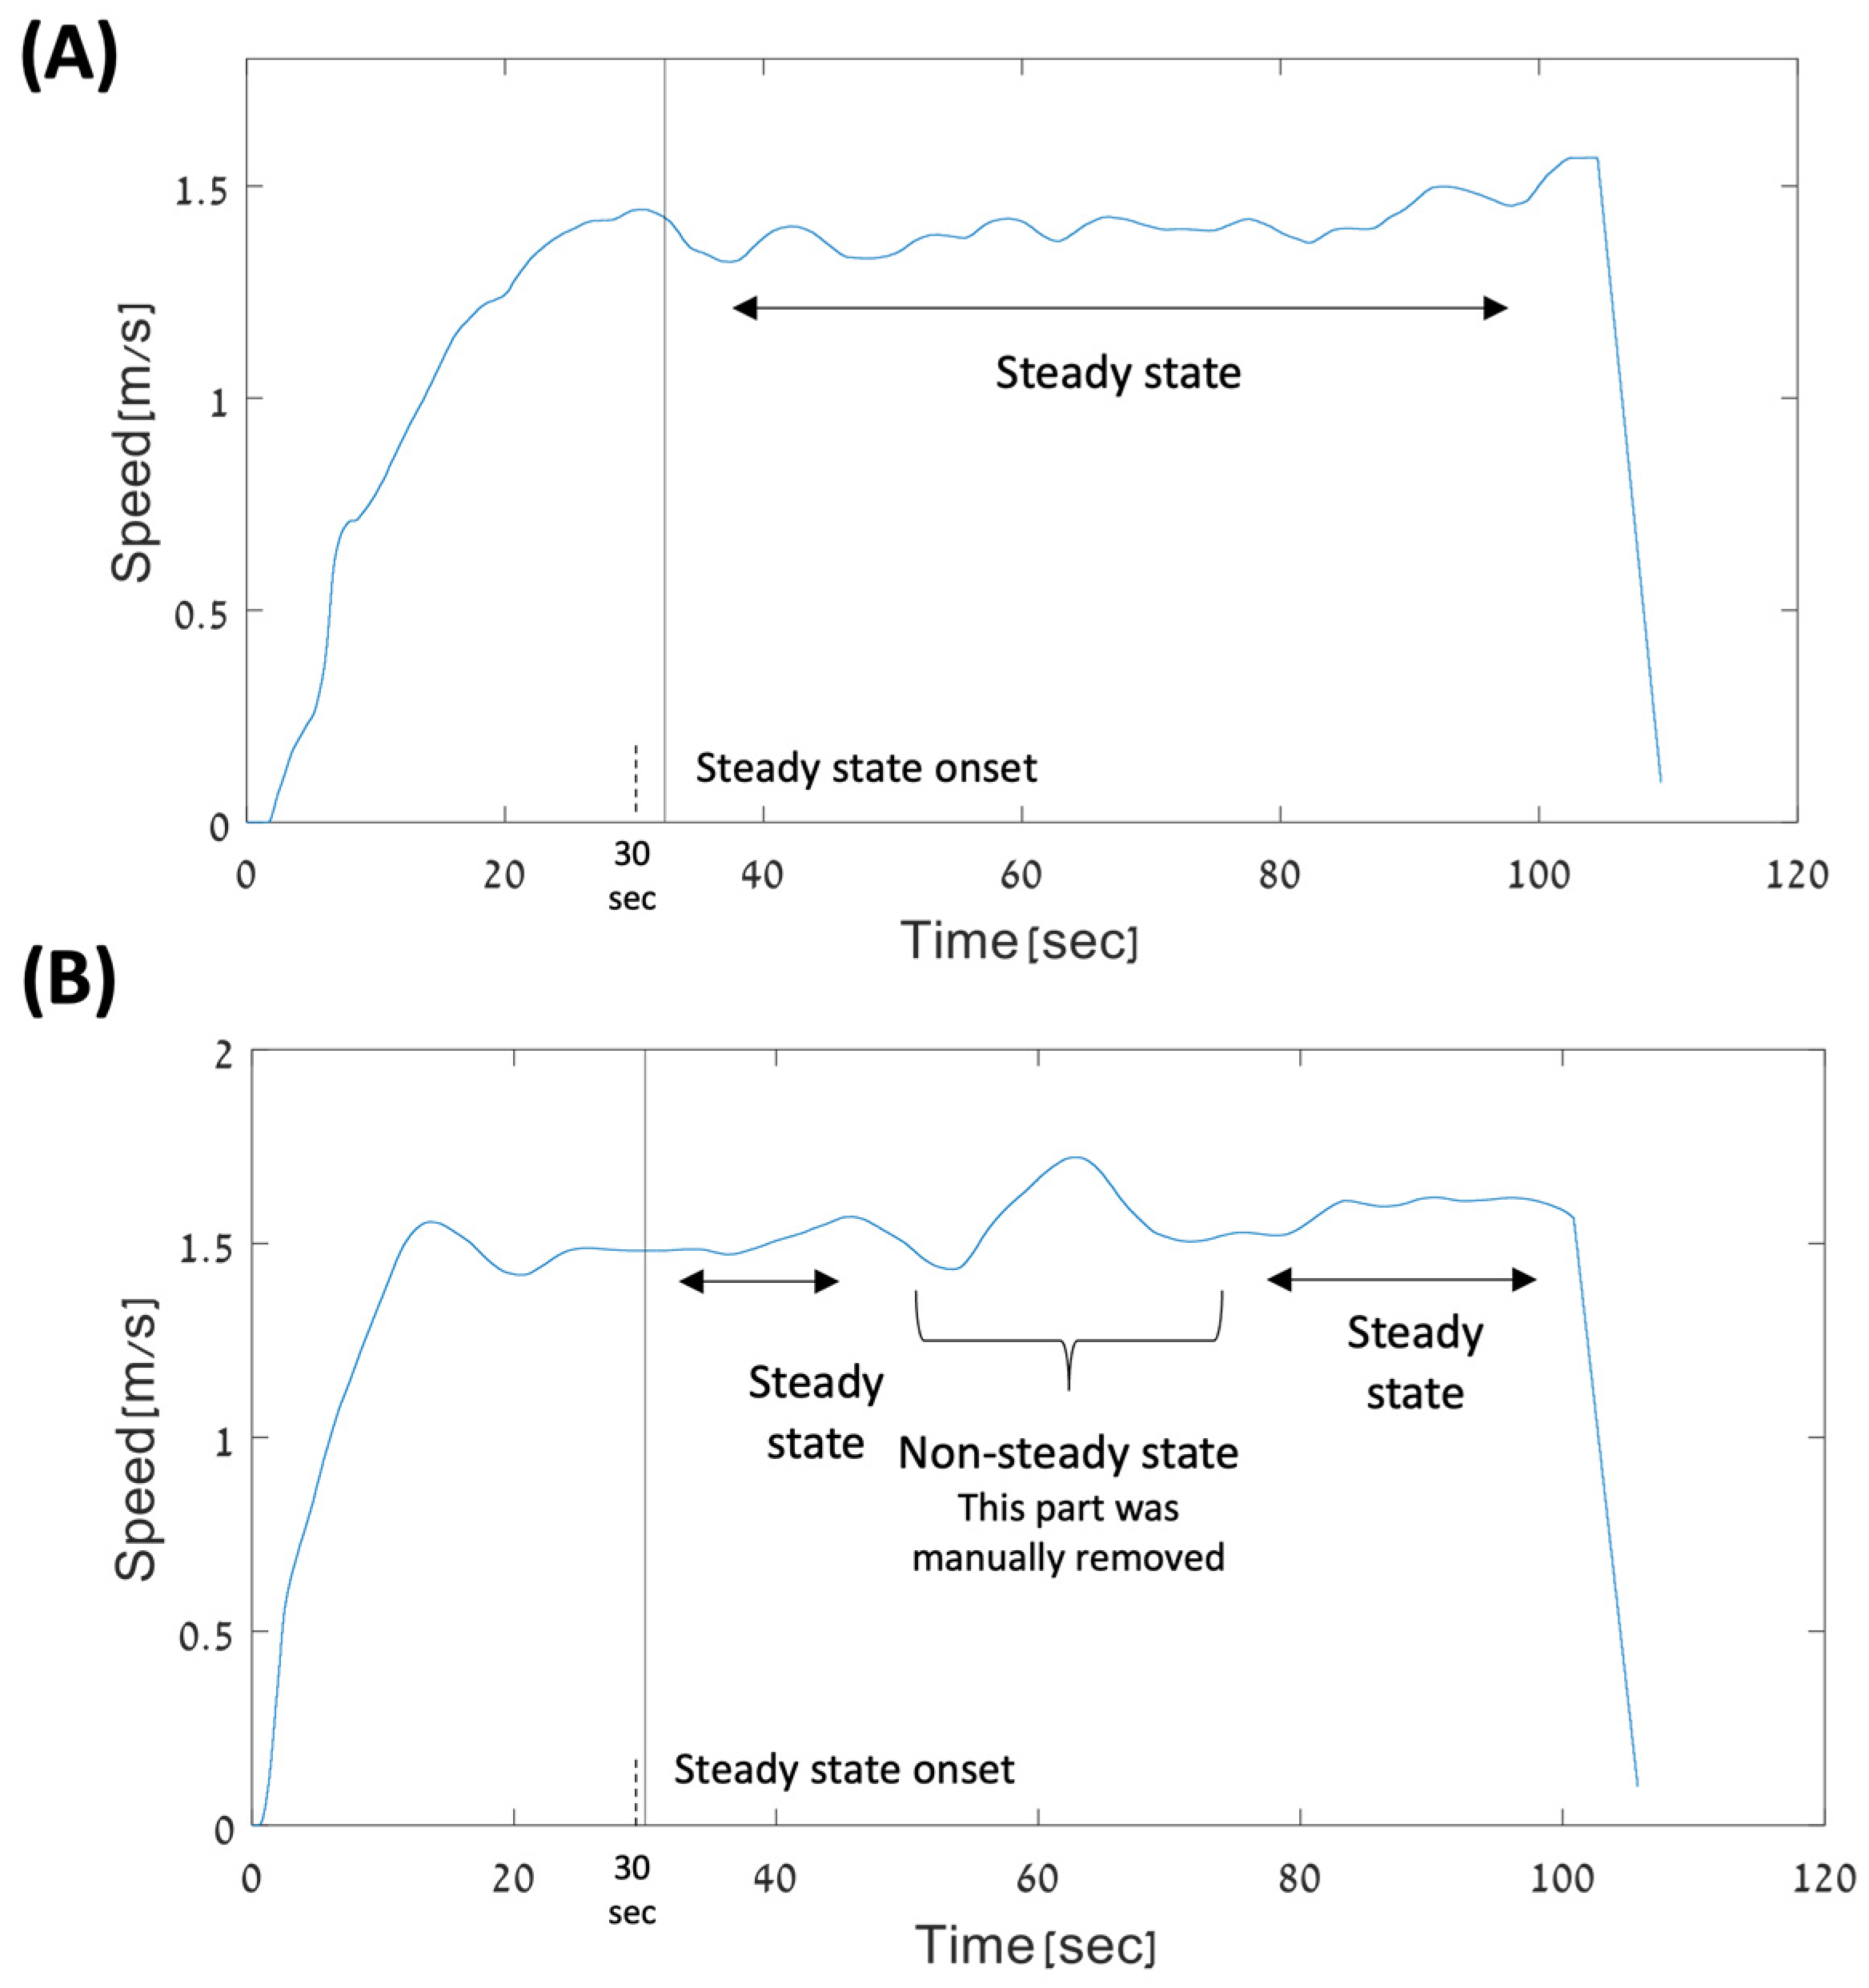
2.4.1. Selecting Walking Periods
2.4.2. PCI Definition and Calculation
2.5. Four-Limb PCI: Q-PCI
2.5.1. Generating Unified φ Vector for Calculating Q-PCI
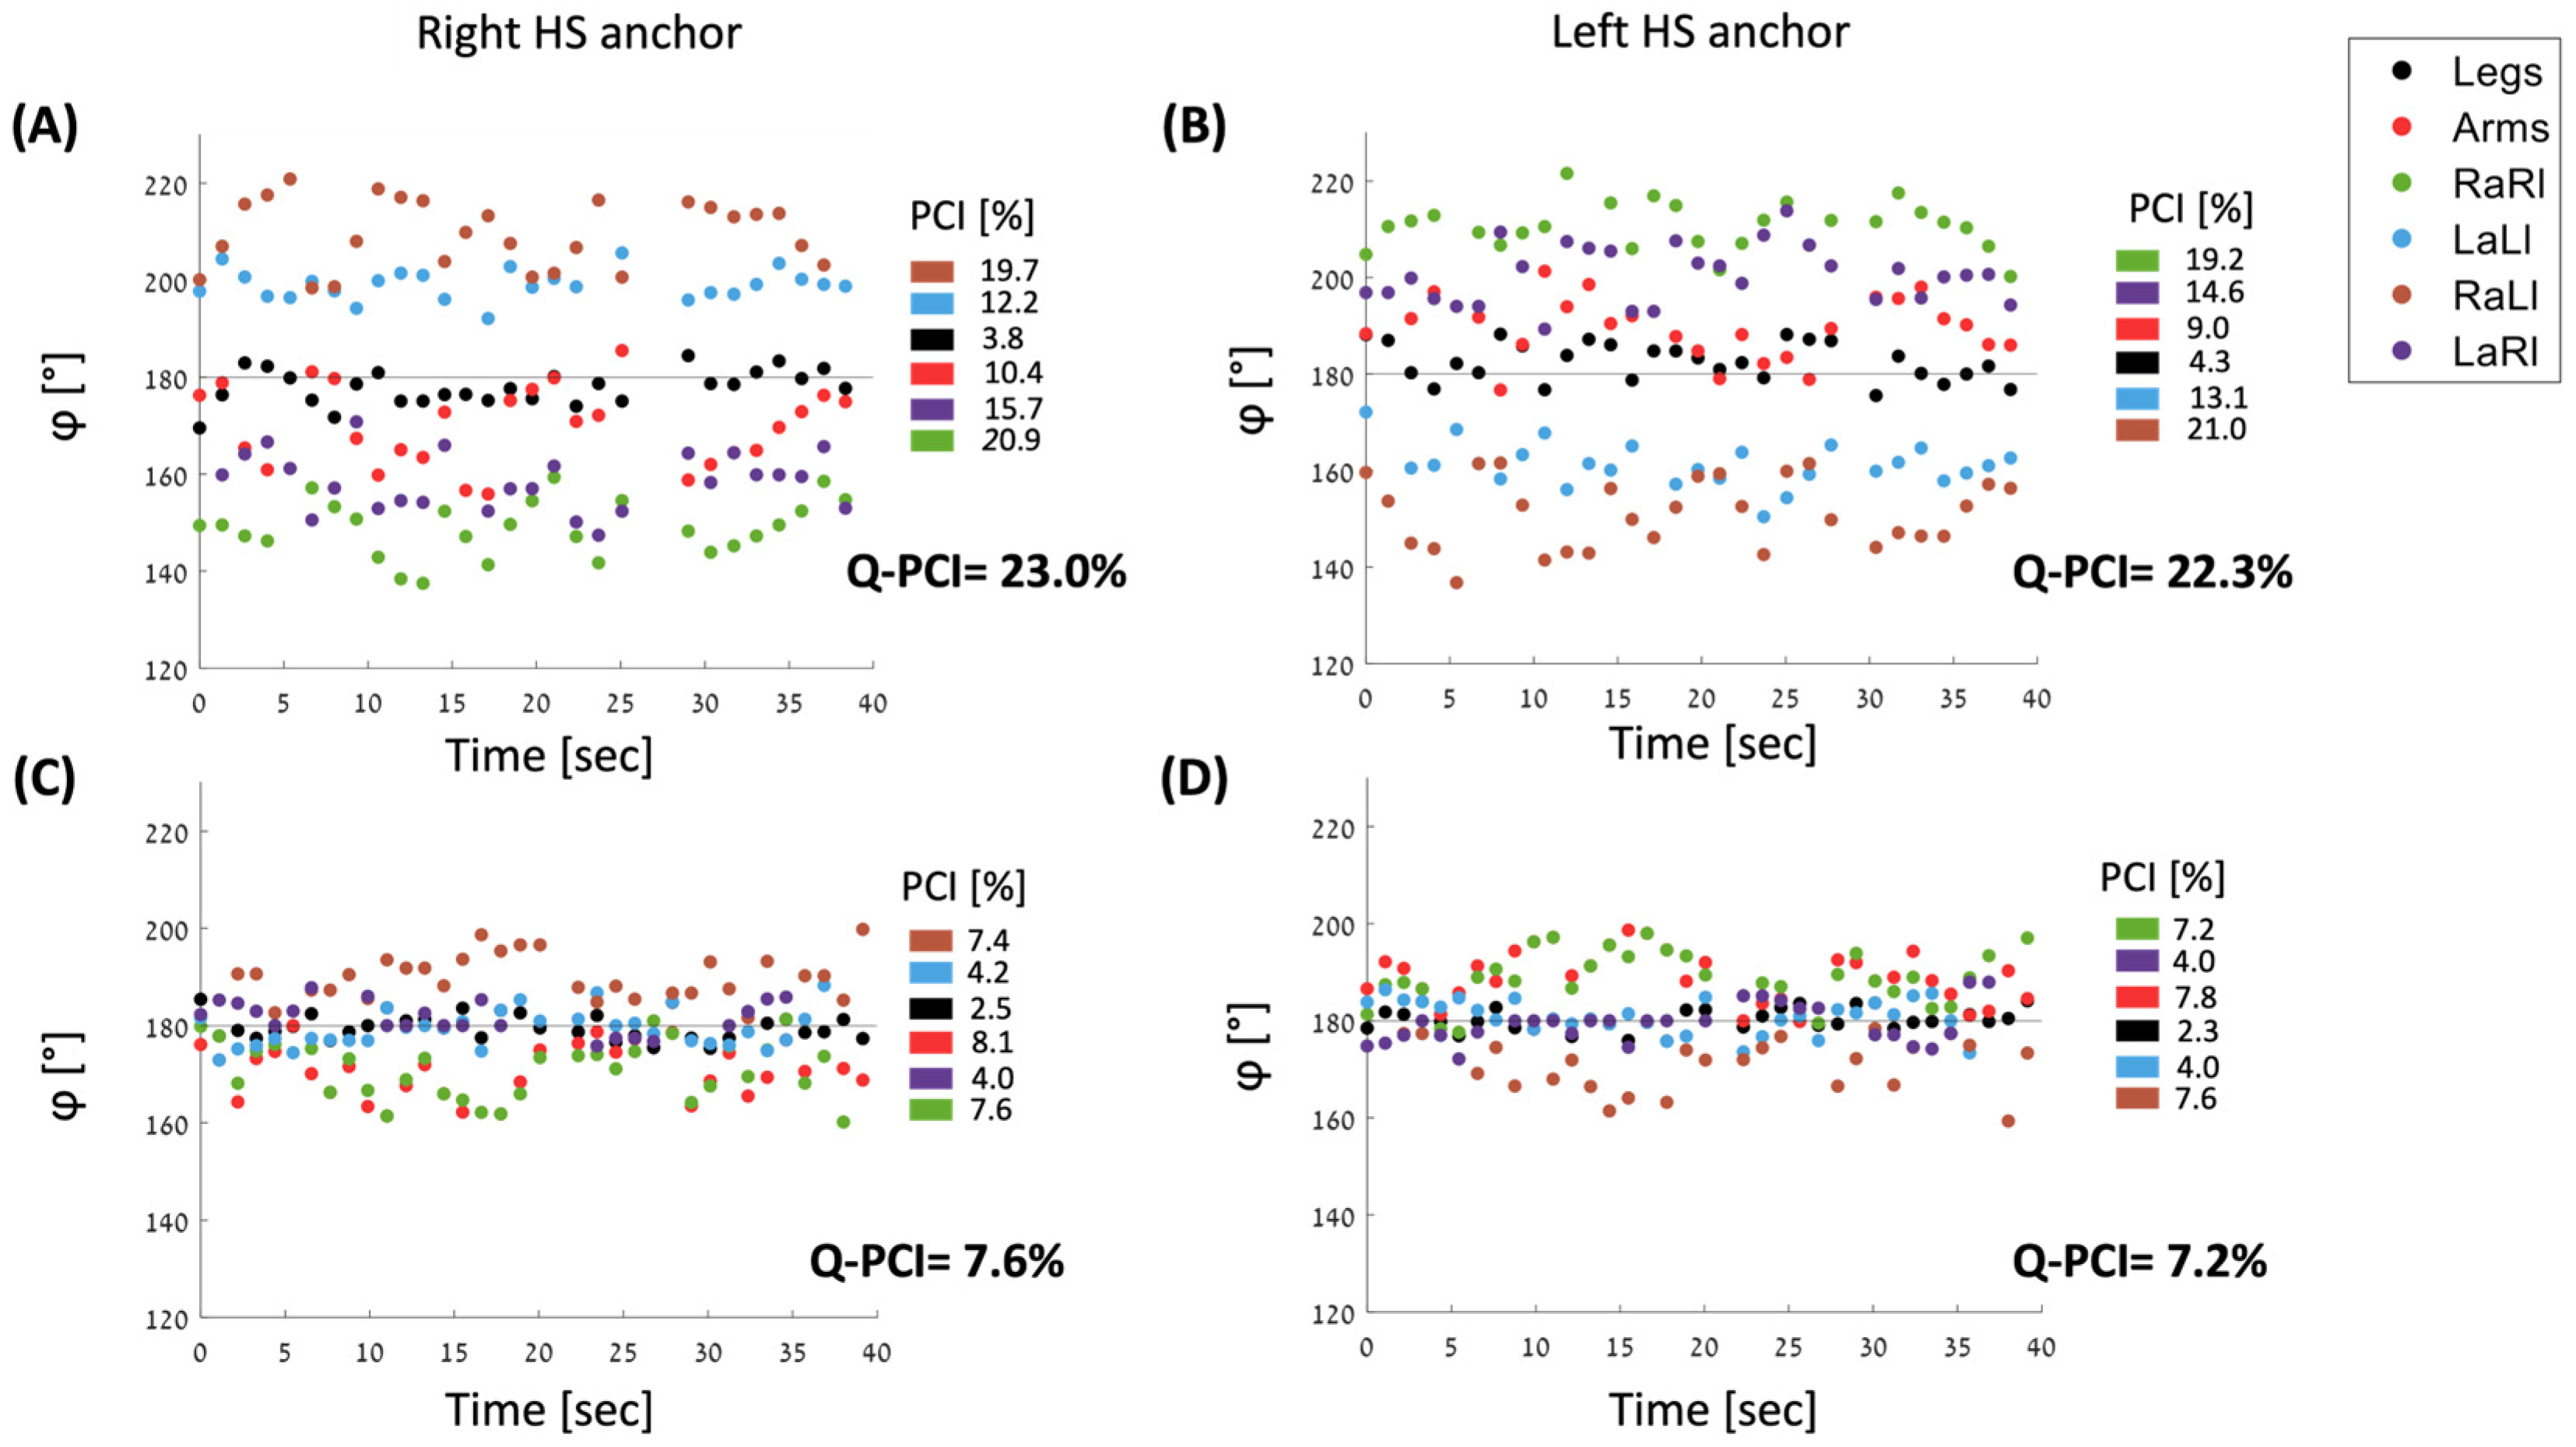
2.5.2. Calculating Q-PCI
2.5.3. φ Values for Six Pairs of Limbs
2.6. Statistical Analysis
2.6.1. Descriptive Statistics
2.6.2. Statistical Comparisons
3. Results
3.1. Comparisons between PCI Values
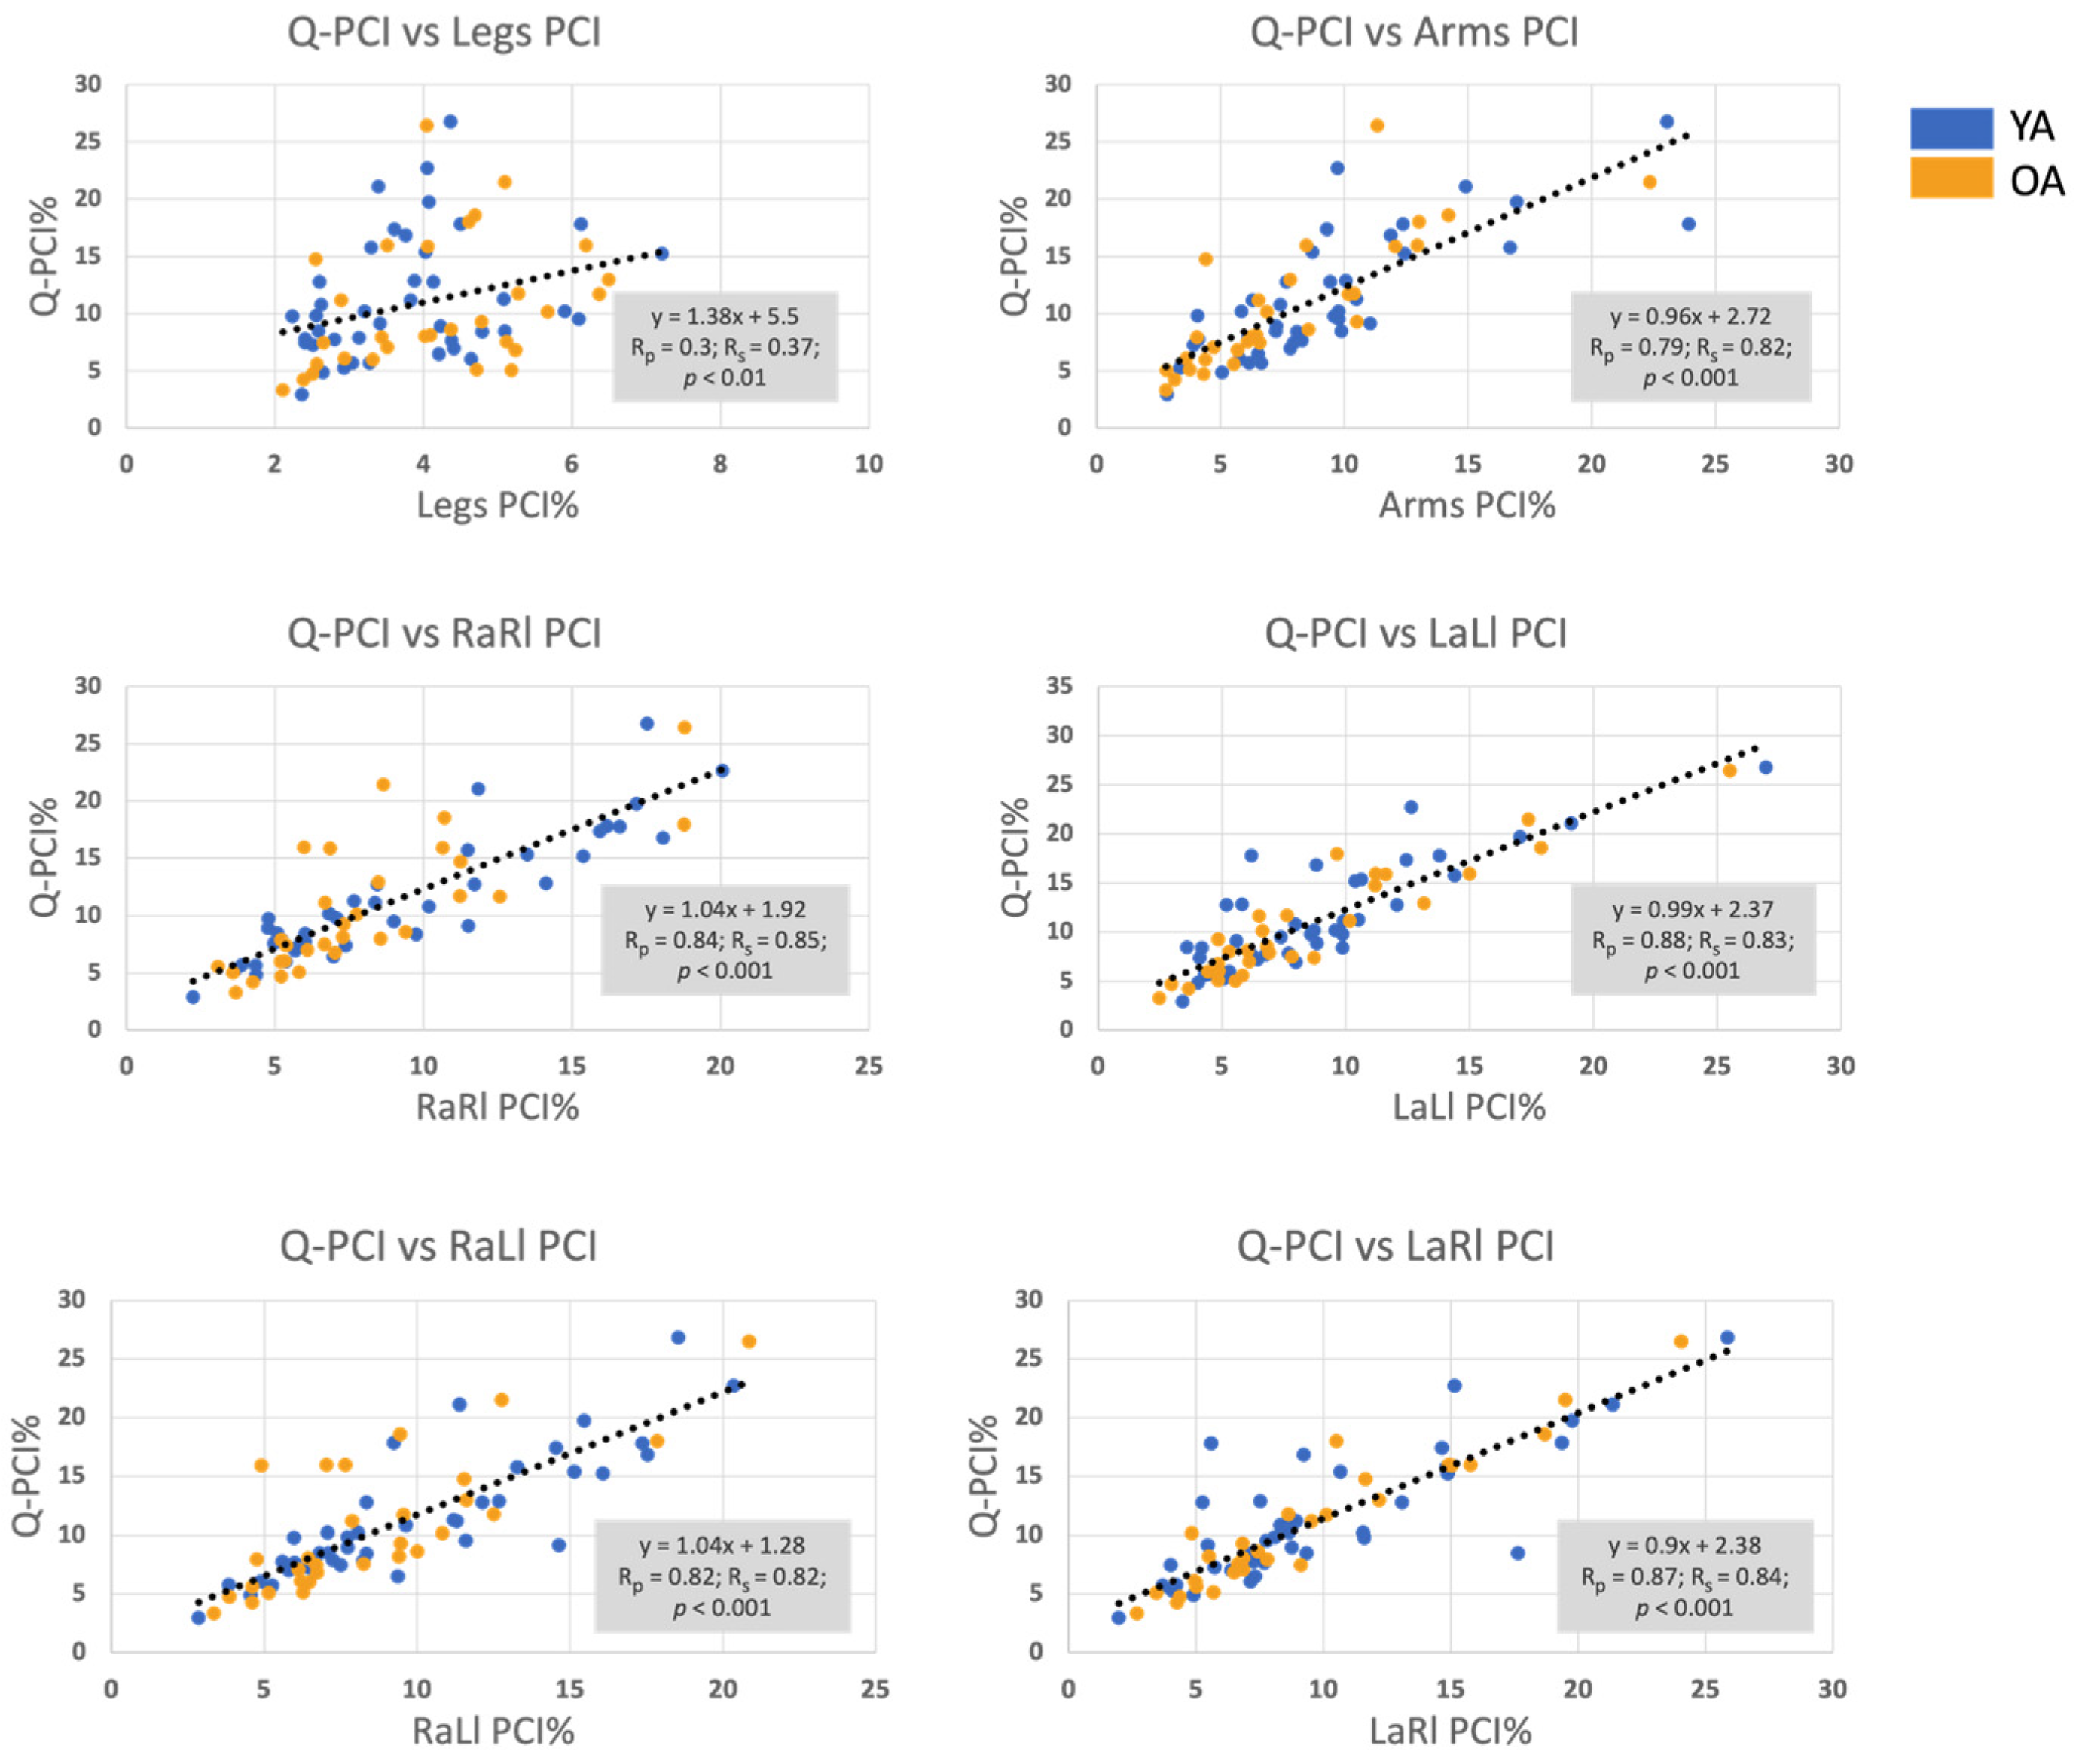
3.2. Correlation between the Q-PCI and the PCI of all Limbs’ Pairings
3.3. Correlation Matrix
3.4. Stepwise Regression
3.5. How Arm-Related PCI Affects Leg–Leg PCI
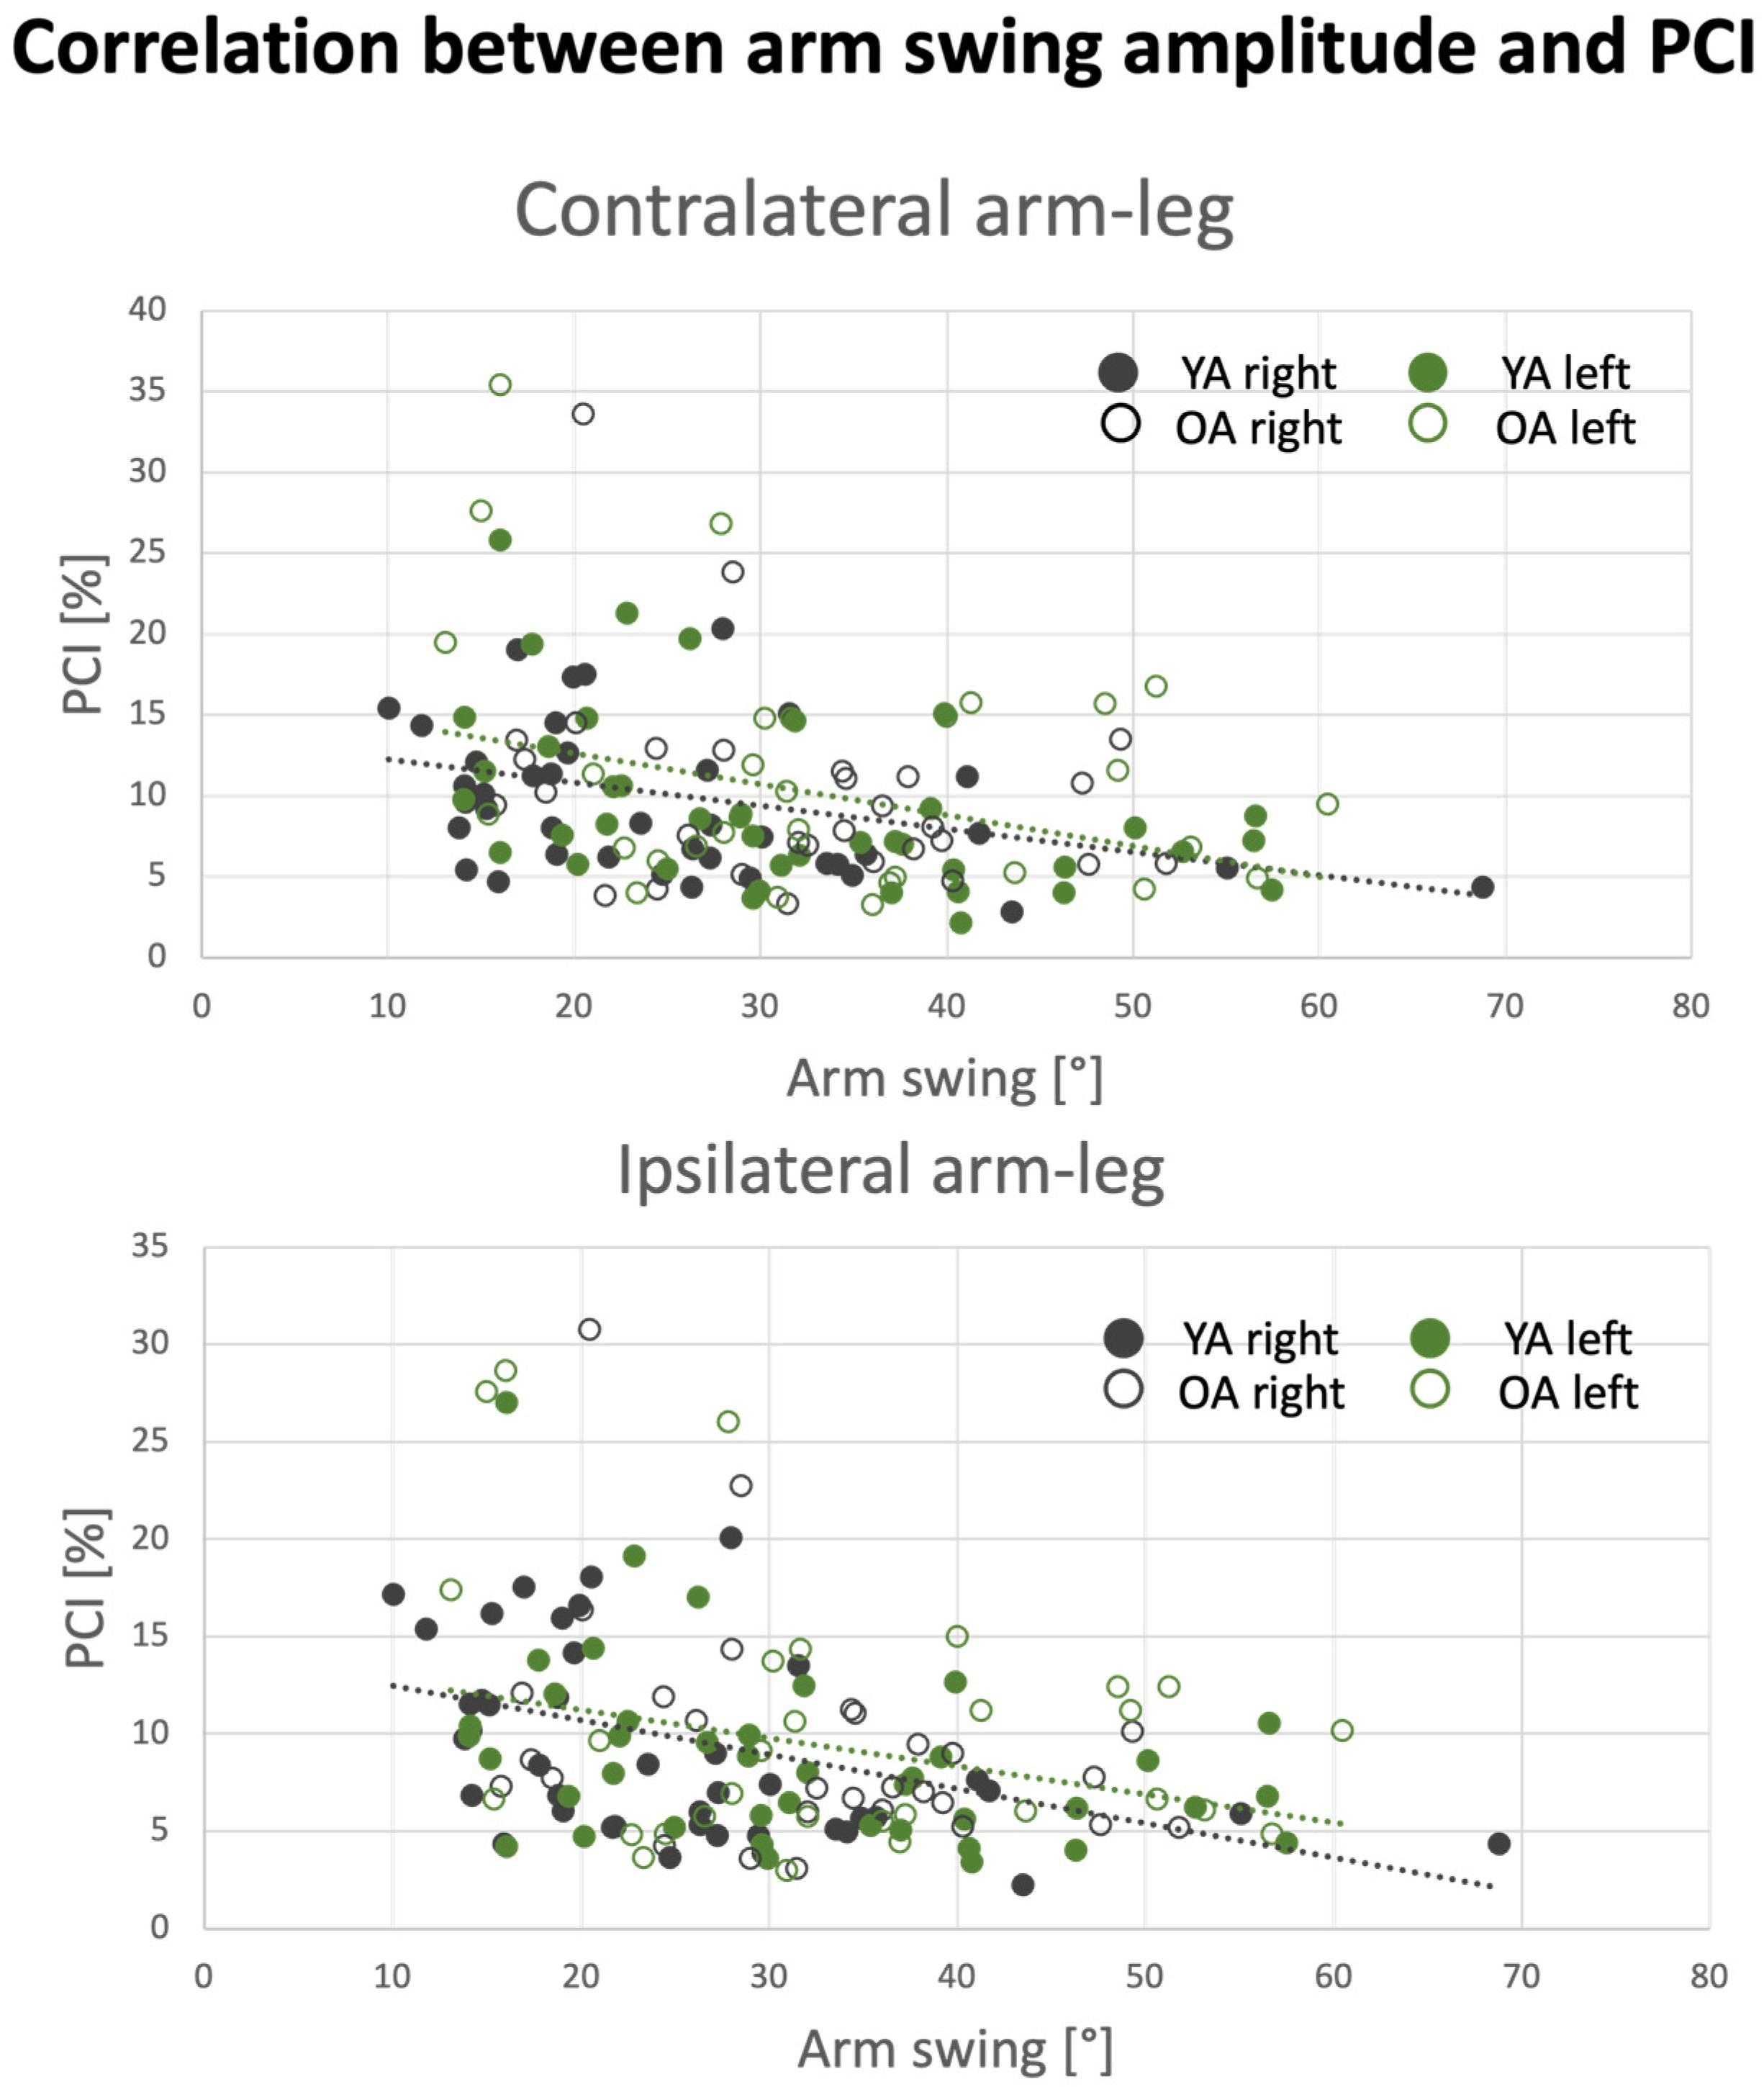
3.6. Effect of Arm Swing Amplitude on PCI Values
4. Discussion
4.1. Summary of Findings
4.2. Arm Swinging Related PCI Values
4.3. Q-PCI
4.4. Relationship between Arm Swinging Coordination and Leg Stepping Coordination
4.5. Effect of Aging
4.6. Limitations and Future Directions
5. Conclusions
Supplementary Materials
Author Contributions
Funding
Institutional Review Board Statement
Informed Consent Statement
Data Availability Statement
Acknowledgments
Conflicts of Interest
References
- Arellano, C.J.; Kram, R. The Metabolic Cost of Human Running: Is Swinging the Arms Worth It? J. Exp. Biol. 2014, 217, 2456–2461. [Google Scholar] [CrossRef]
- Ortega, J.D.; Fehlman, L.A.; Farley, C.T. Effects of Aging and Arm Swing on the Metabolic Cost of Stability in Human Walking. J. Biomech. 2008, 41, 3303–3308. [Google Scholar] [CrossRef]
- Umberger, B.R. Effects of Suppressing Arm Swing on Kinematics, Kinetics, and Energetics of Human Walking. J. Biomech. 2008, 41, 2575–2580. [Google Scholar] [CrossRef]
- Yizhar, Z.; Boulos, S.; Inbar, O.; Carmeli, E. The Effect of Restricted Arm Swing on Energy Expenditure in Healthy Men. Int. J. Rehabil. Res. 2009, 32, 115–123. [Google Scholar] [CrossRef]
- Thomas, S.A.; Vega, D.; Arellano, C.J. Do Humans Exploit the Metabolic and Mechanical Benefits of Arm Swing across Slow to Fast Walking Speeds? J. Biomech. 2021, 115, 110181. [Google Scholar] [CrossRef]
- Ledebt, A. Changes in Arm Posture during the Early Acquisition of Walking. Infant. Behav. Dev. 2000, 23, 79–89. [Google Scholar] [CrossRef]
- Hof, A.L. The Equations of Motion for a Standing Human Reveal Three Mechanisms for Balance. J. Biomech. 2007, 40, 451–457. [Google Scholar] [CrossRef]
- Collins, S.H.; Adamczyk, P.G.; Kuo, A.D. Dynamic Arm Swinging in Human Walking. Proc. R. Soc. B Biol. Sci. 2009, 276, 3679–3688. [Google Scholar] [CrossRef]
- Bloom, J.; Hejrati, B. The Effects of Forearm Movements on Human Gait during Walking with Various Self-Selected Speeds. Hum. Mov. Sci. 2021, 79, 102835. [Google Scholar] [CrossRef]
- Bruijn, S.M.; Meijer, O.G.; van Dieën, J.H.; Kingma, I.; Lamoth, C.J.C. Coordination of Leg Swing, Thorax Rotations, and Pelvis Rotations during Gait: The Organisation of Total Body Angular Momentum. Gait Posture 2008, 27, 455–462. [Google Scholar] [CrossRef]
- Ivanenko, Y.P.; Cappellini, G.; Dominici, N.; Poppele, R.E.; Lacquaniti, F. Coordination of Locomotion with Voluntary Movements in Humans. J. Neurosci. 2005, 25, 7238–7253. [Google Scholar] [CrossRef]
- Liu, S.; Zhang, J.; Zhang, Y.; Zhu, R. A Wearable Motion Capture Device Able to Detect Dynamic Motion of Human Limbs. Nat. Commun. 2020, 11, 5615. [Google Scholar] [CrossRef]
- Navarro-López, V.; Fernández-Vázquez, D.; Molina-Rueda, F.; Cuesta-Gómez, A.; García-Prados, P.; del-Valle-Gratacós, M.; Carratalá-Tejada, M. Arm-Swing Kinematics in Parkinson’s Disease: A Systematic Review and Meta-Analysis. Gait Posture 2022, 98, 85–95. [Google Scholar] [CrossRef]
- Meyns, P.; Bruijn, S.M.; Duysens, J. The How and Why of Arm Swing during Human Walking. Gait Posture 2013, 38, 555–562. [Google Scholar] [CrossRef]
- Elsworth-Edelsten, C.; Bonnefoy-Mazure, A.; Laidet, M.; Armand, S.; Assal, F.; Lalive, P.; Allali, G. Upper Limb Movement Analysis during Gait in Multiple Sclerosis Patients. Hum. Mov. Sci. 2017, 54, 248–252. [Google Scholar] [CrossRef]
- Ivanenko, Y.P.; Poppele, R.E.; Lacquaniti, F. Five Basic Muscle Activation Patterns Account for Muscle Activity during Human Locomotion. J. Physiol. 2004, 556, 267–282. [Google Scholar] [CrossRef]
- Safavynia, S.; Torres-Oviedo, G.; Ting, L. Muscle Synergies: Implications for Clinical Evaluation and Rehabilitation of Movement. Top. Spinal Cord Inj. Rehabil. 2011, 17, 16–24. [Google Scholar] [CrossRef]
- Chvatal, S.A.; Ting, L.H. Common Muscle Synergies for Balance and Walking. Front. Comput. Neurosci. 2013, 7. [Google Scholar] [CrossRef]
- Bailey, C.A.; Graham, R.B.; Nantel, J. Joint Behaviour during Arm Swing Changes with Gait Speed and Predicts Spatiotemporal Variability and Dynamic Stability in Healthy Young Adults. Gait Posture 2023, 103, 50–56. [Google Scholar] [CrossRef]
- Marder, E.; Bucher, D. Central Pattern Generators and the Control of Rhythmic Movements. Curr. Biol. 2001, 11, R986–R996. [Google Scholar] [CrossRef]
- Zehr, E.P.; Barss, T.S.; Dragert, K.; Frigon, A.; Vasudevan, E.V.; Haridas, C.; Hundza, S.; Kaupp, C.; Klarner, T.; Klimstra, M.; et al. Neuromechanical Interactions between the Limbs during Human Locomotion: An Evolutionary Perspective with Translation to Rehabilitation. Exp. Brain Res. 2016, 234, 3059–3081. [Google Scholar] [CrossRef]
- Juvin, L.; Simmers, J.; Morin, D. Propriospinal Circuitry Underlying Interlimb Coordination in Mammalian Quadrupedal Locomotion. J. Neurosci. 2005, 25, 6025–6035. [Google Scholar] [CrossRef]
- Parhizi, B.; Barss, T.S.; Mushahwar, V.K. Simultaneous Cervical and Lumbar Spinal Cord Stimulation Induces Facilitation of Both Spinal and Corticospinal Circuitry in Humans. Front. Neurosci. 2021, 15, 615103. [Google Scholar] [CrossRef]
- Thibaudier, Y.; Frigon, A. Spatiotemporal Control of Interlimb Coordination during Transverse Split-Belt Locomotion with 1:1 or 2:1 Coupling Patterns in Intact Adult Cats. J. Neurophysiol. 2014, 112, 2006–2018. [Google Scholar] [CrossRef]
- Thibaudier, Y.; Hurteau, M.-F.; Telonio, A.; Frigon, A. Coordination between the Fore- and Hindlimbs Is Bidirectional, Asymmetrically Organized, and Flexible during Quadrupedal Locomotion in the Intact Adult Cat. Neuroscience 2013, 240, 13–26. [Google Scholar] [CrossRef]
- Wagenaar, R.C.; van Emmerik, R.E.A. Resonant Frequencies of Arms and Legs Identify Different Walking Patterns. J. Biomech. 2000, 33, 853–861. [Google Scholar] [CrossRef]
- Klarner, T.; Pearcey, G.E.P.; Sun, Y.; Barss, T.S.; Zehr, E.P. Changing Coupling between the Arms and Legs with Slow Walking Speeds Alters Regulation of Somatosensory Feedback. Exp. Brain Res. 2020, 238, 1335–1349. [Google Scholar] [CrossRef]
- Weersink, J.B.; De Jong, B.M.; Halliday, D.M.; Maurits, N.M. Intermuscular Coherence Analysis in Older Adults Reveals That Gait-related Arm Swing Drives Lower Limb Muscles via Subcortical and Cortical Pathways. J. Physiol. 2021, 599, 2283–2298. [Google Scholar] [CrossRef]
- Weersink, J.B.; Maurits, N.M.; Halliday, D.M.; De Jong, B.M. Time-Dependent Directional Intermuscular Coherence Analysis Reveals That Forward and Backward Arm Swing Equally Drive the Upper Leg Muscles during Gait Initiation. Gait Posture 2022, 92, 290–293. [Google Scholar] [CrossRef]
- Donker, S.F.; Beek, P.J.; Wagenaar, R.C.; Mulder, T. Coordination Between Arm and Leg Movements During Locomotion. J. Mot. Behav. 2001, 33, 86–102. [Google Scholar] [CrossRef]
- Plotnik, M.; Giladi, N.; Hausdorff, J.M. A New Measure for Quantifying the Bilateral Coordination of Human Gait: Effects of Aging and Parkinson’s Disease. Exp. Brain Res. 2007, 181, 561–570. [Google Scholar] [CrossRef]
- Zadik, S.; Benady, A.; Gutwillig, S.; Florentine, M.M.; Solymani, R.E.; Plotnik, M. Age Related Changes in Gait Variability, Asymmetry, and Bilateral Coordination—When Does Deterioration Starts? Gait Posture 2022, 96, 87–92. [Google Scholar] [CrossRef]
- Patel, P.; Enzastiga, D.; Casamento-Moran, A.; Christou, E.A.; Lodha, N. Increased Temporal Stride Variability Contributes to Impaired Gait Coordination after Stroke. Sci. Rep. 2022, 12, 12679. [Google Scholar] [CrossRef]
- Meijer, R.; Plotnik, M.; Zwaaftink, E.G.; van Lummel, R.C.; Ainsworth, E.; Martina, J.D.; Hausdorff, J.M. Markedly Impaired Bilateral Coordination of Gait in Post-Stroke Patients: Is This Deficit Distinct from Asymmetry? A Cohort Study. J. Neuroeng. Rehabil. 2011, 8, 23. [Google Scholar] [CrossRef]
- Plotnik, M.; Wagner, J.M.; Adusumilli, G.; Gottlieb, A.; Naismith, R.T. Gait Asymmetry, and Bilateral Coordination of Gait during a Six-Minute Walk Test in Persons with Multiple Sclerosis. Sci. Rep. 2020, 10, 12382. [Google Scholar] [CrossRef]
- Richmond, S.B.; Swanson, C.W.; Peterson, D.S.; Fling, B.W. A Temporal Analysis of Bilateral Gait Coordination in People with Multiple Sclerosis. Mult. Scler. Relat. Disord. 2020, 45, 102445. [Google Scholar] [CrossRef]
- Weiss, A.; Herman, T.; Giladi, N.; Hausdorff, J.M. Objective Assessment of Fall Risk in Parkinson’s Disease Using a Body-Fixed Sensor Worn for 3 Days. PLoS ONE 2014, 9, e96675. [Google Scholar] [CrossRef]
- Plotnik, M.; Giladi, N.; Hausdorff, J.M. Bilateral Coordination of Walking and Freezing of Gait in Parkinson’s Disease. Eur. J. Neurosci. 2008, 27, 1999–2006. [Google Scholar] [CrossRef]
- Plotnik, M.; Azrad, T.; Bondi, M.; Bahat, Y.; Gimmon, Y.; Zeilig, G.; Inzelberg, R.; Siev-Ner, I. Self-Selected Gait Speed—Over Ground versus Self-Paced Treadmill Walking, a Solution for a Paradox. J. NeuroEngineering Rehabil. 2015, 12, 20. [Google Scholar] [CrossRef]
- Son, M.; Han, S.H.; Lyoo, C.H.; Lim, J.A.; Jeon, J.; Hong, K.-B.; Park, H. The Effect of Levodopa on Bilateral Coordination and Gait Asymmetry in Parkinson’s Disease Using Inertial Sensor. NPJ Park. Dis. 2021, 7, 42. [Google Scholar] [CrossRef]
- James, E.G.; Conatser, P.; Karabulut, M.; Leveille, S.G.; Hausdorff, J.M.; Travison, T.; Bean, J.F. Walking Speed Affects Gait Coordination and Variability Among Older Adults With and Without Mobility Limitations. Arch. Phys. Med. Rehabil. 2020, 101, 1377–1382. [Google Scholar] [CrossRef] [PubMed]
- Boonstra, T.W.; Breakspear, M. Neural Mechanisms of Intermuscular Coherence: Implications for the Rectification of Surface Electromyography. J. Neurophysiol. 2012, 107, 796–807. [Google Scholar] [CrossRef] [PubMed]
- Mirelman, A.; Bernad-Elazari, H.; Nobel, T.; Thaler, A.; Peruzzi, A.; Plotnik, M.; Giladi, N.; Hausdorff, J.M. Effects of Aging on Arm Swing during Gait: The Role of Gait Speed and Dual Tasking. PLoS ONE 2015, 10, e0136043. [Google Scholar] [CrossRef] [PubMed]
- Hill, A.; Nantela, J. Interlimb Coordination in Parkinson’s Disease Is Minimally Affected by a Visuospatial Dual Task. Peer Community J. 2024, 4, e31. [Google Scholar] [CrossRef]
- Han, S.; Paul, R. Smartwatch Gait Coordination Index: New Measure for Human Gait Utilizing Smartwatch Sensor. Medicine 2023, 102, e33267. [Google Scholar] [CrossRef]
- Ballesteros, M.L.F.; Buchthal, F.; Rosenfalck, P. The Pattern of Muscular Activity During the Arm Swing of Natural Walking. Acta Physiol. Scand. 1965, 63, 296–310. [Google Scholar] [CrossRef]
- Kuhtz-Buschbeck, J.P.; Jing, B. Activity of Upper Limb Muscles during Human Walking. J. Electromyogr. Kinesiol. 2012, 22, 199–206. [Google Scholar] [CrossRef]
- Etlin, A.; Finkel, E.; Mor, Y.; O’Donovan, M.J.; Anglister, L.; Lev-Tov, A. Characterization of Sacral Interneurons That Mediate Activation of Locomotor Pattern Generators by Sacrocaudal Afferent Input. J. Neurosci. 2013, 33, 734–747. [Google Scholar] [CrossRef]
- Ijspeert, A.J.; Crespi, A.; Ryczko, D.; Cabelguen, J.-M. From Swimming to Walking with a Salamander Robot Driven by a Spinal Cord Model. Science 2007, 315, 1416–1420. [Google Scholar] [CrossRef]
- Gimmon, Y.; Rashad, H.; Kurz, I.; Plotnik, M.; Riemer, R.; Debi, R.; Shapiro, A.; Melzer, I. Gait Coordination Deteriorates in Independent Old-Old Adults. J. Aging Phys. Act. 2018, 26, 382–389. [Google Scholar] [CrossRef]
- Mileti, I.; Serra, A.; Wolf, N.; Munoz-Martel, V.; Ekizos, A.; Palermo, E.; Arampatzis, A.; Santuz, A. Muscle Activation Patterns Are More Constrained and Regular in Treadmill Than in Overground Human Locomotion. Front. Bioeng. Biotechnol. 2020, 8, 581619. [Google Scholar] [CrossRef] [PubMed]
- Malatesta, D.; Canepa, M.; Menendez Fernandez, A. The Effect of Treadmill and Overground Walking on Preferred Walking Speed and Gait Kinematics in Healthy, Physically Active Older Adults. Eur. J. Appl. Physiol. 2017, 117, 1833–1843. [Google Scholar] [CrossRef] [PubMed]
- Lewis, M.M.; Waltz, C.; Scelina, L.; Scelina, K.; Owen, K.M.; Hastilow, K.; Zimmerman, E.M.; Rosenfeldt, A.B.; Miller Koop, M.; Alberts, J.L. Gait Patterns during Overground and Virtual Omnidirectional Treadmill Walking. J. NeuroEngineering Rehabil. 2024, 21, 29. [Google Scholar] [CrossRef] [PubMed]
- Benady, A.; Zadik, S.; Ben-Gal, O.; Cano Porras, D.; Wenkert, A.; Gilaie-Dotan, S.; Plotnik, M. Vision Affects Gait Speed but Not Patterns of Muscle Activation During Inclined Walking—A Virtual Reality Study. Front. Bioeng. Biotechnol. 2021, 9, 632594. [Google Scholar] [CrossRef] [PubMed]
- Benady, A.; Zadik, S.; Zeilig, G.; Gilaie-Dotan, S.; Plotnik, M. Gait Speed Modulations Are Proportional to Grades of Virtual Visual Slopes-A Virtual Reality Study. Front. Neurol. 2021, 12, 615242. [Google Scholar] [CrossRef]
- Cano Porras, D.; Zeilig, G.; Doniger, G.M.; Bahat, Y.; Inzelberg, R.; Plotnik, M. Seeing Gravity: Gait Adaptations to Visual and Physical Inclines – A Virtual Reality Study. Front. Neurosci. 2020, 13, 1308. [Google Scholar] [CrossRef]
- Rosenblum, U.; Kribus-Shmiel, L.; Zeilig, G.; Bahat, Y.; Kimel-Naor, S.; Melzer, I.; Plotnik, M. Novel Methodology for Assessing Total Recovery Time in Response to Unexpected Perturbations While Walking. PLoS ONE 2020, 15, e0233510. [Google Scholar] [CrossRef]
- Rosenblum, U.; Melzer, I.; Zeilig, G.; Plotnik, M. Muscle Activation Profile Is Modulated by Unexpected Balance Loss in Walking. Gait Posture 2022, 93, 64–72. [Google Scholar] [CrossRef]
- Plotnik, M.; Arad, E.; Grinberg, A.; Salomon, M.; Bahat, Y.; Hassin-Baer, S.; Zeilig, G. Differential Gait Adaptation Patterns in Parkinson’s Disease—A Split Belt Treadmill Pilot Study. BMC Neurol. 2023, 23, 279. [Google Scholar] [CrossRef]
- Heimler, B.; Koren, O.; Inzelberg, R.; Rosenblum, U.; Hassin-Baer, S.; Zeilig, G.; Bartsch, R.P.; Plotnik, M. Heart-Rate Variability as a New Marker for Freezing Predisposition in Parkinson’s Disease. Parkinsonism Relat. Disord. 2023, 113, 105476. [Google Scholar] [CrossRef]


| N | Age [Years], Mean (Range) * | F/M | |
|---|---|---|---|
| YA | 41 | 27 (21–36) | 20/21 |
| OA | 30 | 70 (61–77) | 10/30 |
| Pair of Limbs | Leg–Leg | Arm–Arm | RaRl | LaLl | RaLl | LaRl |
|---|---|---|---|---|---|---|
| Phase Type | Anti-phase | Anti-phase | Anti-phase | Anti-phase | In-phase | In-phase |
| Coordination type | Contra- lateral | Contra- lateral | Ipsi- lateral | Ipsi- lateral | Contra- lateral | Contra- lateral |
| Pair | For Q-PCI Based on Right HS Anchor | For Q-PCI Based on Left HS Anchor |
|---|---|---|
| Leg–leg | LreR | RreL |
| Arm–arm | RreL | LreR |
| Right arm–right leg | AreL | LreA |
| Left arm–left leg | LreA | AreL |
| Left arm–right leg | AreL | LreA |
| Right arm–left leg | LreA | AreL |
| Legs PCI% | Arms PCI% | RaRl PCI% | LaLl PCI% | RaLl PCI% | LaRl PCI% | Q-PCI% | |
|---|---|---|---|---|---|---|---|
| YA | 3.76 (2.8, 4.4) | 8.22 (6.3, 10) | 7.38 (5.3, 11.8) | 7.95 (5.3, 10.4) | 8.34 (6.4, 12.7) | 8.08 (6.4, 11.6) | 9.75 (7.6, 15.2) |
| OA | 4.08 (3.0, 5.1) | 6.5 (4.4, 10.3) | 6.93 (5.3, 9.2) | 6.73 (4.9, 10.9) | 7.34 (6.1, 9.9) | 7.15 (5.1, 11.4) | 8.35 (6.2, 14.3) |
| Leg | Arms | RaRl | LaLl | RaLl | LaRl | Q-PCI | |
|---|---|---|---|---|---|---|---|
| Legs | - | ||||||
| Arms | 0.47 | - | |||||
| RaRl | 0.43 | 0.73 | - | ||||
| LaLl | 0.28 | 0.63 | 0.57 | - | |||
| RaLl | 0.41 | 0.71 | 0.91 | 0.58 | - | ||
| LaRl | 0.28 | 0.69 | 0.60 | 0.87 | 0.57 | - | |
| Q-PCI | 0.37 | 0.82 | 0.85 | 0.83 | 0.82 | 0.84 | - |
| Arm Swing Amplitude | Pair of Limbs | Correlation (Spearman’s’ Rho) |
|---|---|---|
| Right hand | Arm–arm | −0.50 ** |
| RaRl | −0.43 ** | |
| RaLl | −0.36 * | |
| Left hand | Arm–arm | −0.38 * |
| LaLl | −0.25 * | |
| LaRl | −0.37 * |
Disclaimer/Publisher’s Note: The statements, opinions and data contained in all publications are solely those of the individual author(s) and contributor(s) and not of MDPI and/or the editor(s). MDPI and/or the editor(s) disclaim responsibility for any injury to people or property resulting from any ideas, methods, instructions or products referred to in the content. |
© 2024 by the authors. Licensee MDPI, Basel, Switzerland. This article is an open access article distributed under the terms and conditions of the Creative Commons Attribution (CC BY) license (https://creativecommons.org/licenses/by/4.0/).
Share and Cite
Galor, N.; Zeilig, G.; Plotnik, M. A New Measure for Quantifying Four-Limb Coordination of Human Gait Based on Mobility Sensors. Sensors 2024, 24, 6105. https://doi.org/10.3390/s24186105
Galor N, Zeilig G, Plotnik M. A New Measure for Quantifying Four-Limb Coordination of Human Gait Based on Mobility Sensors. Sensors. 2024; 24(18):6105. https://doi.org/10.3390/s24186105
Chicago/Turabian StyleGalor, Noam, Gabi Zeilig, and Meir Plotnik. 2024. "A New Measure for Quantifying Four-Limb Coordination of Human Gait Based on Mobility Sensors" Sensors 24, no. 18: 6105. https://doi.org/10.3390/s24186105