
Comparative Study of Lightweight Target Detection Methods for Unmanned Aerial Vehicle-Based Road Distress Survey


Abstract
:1. Introduction
2. Data and Methods
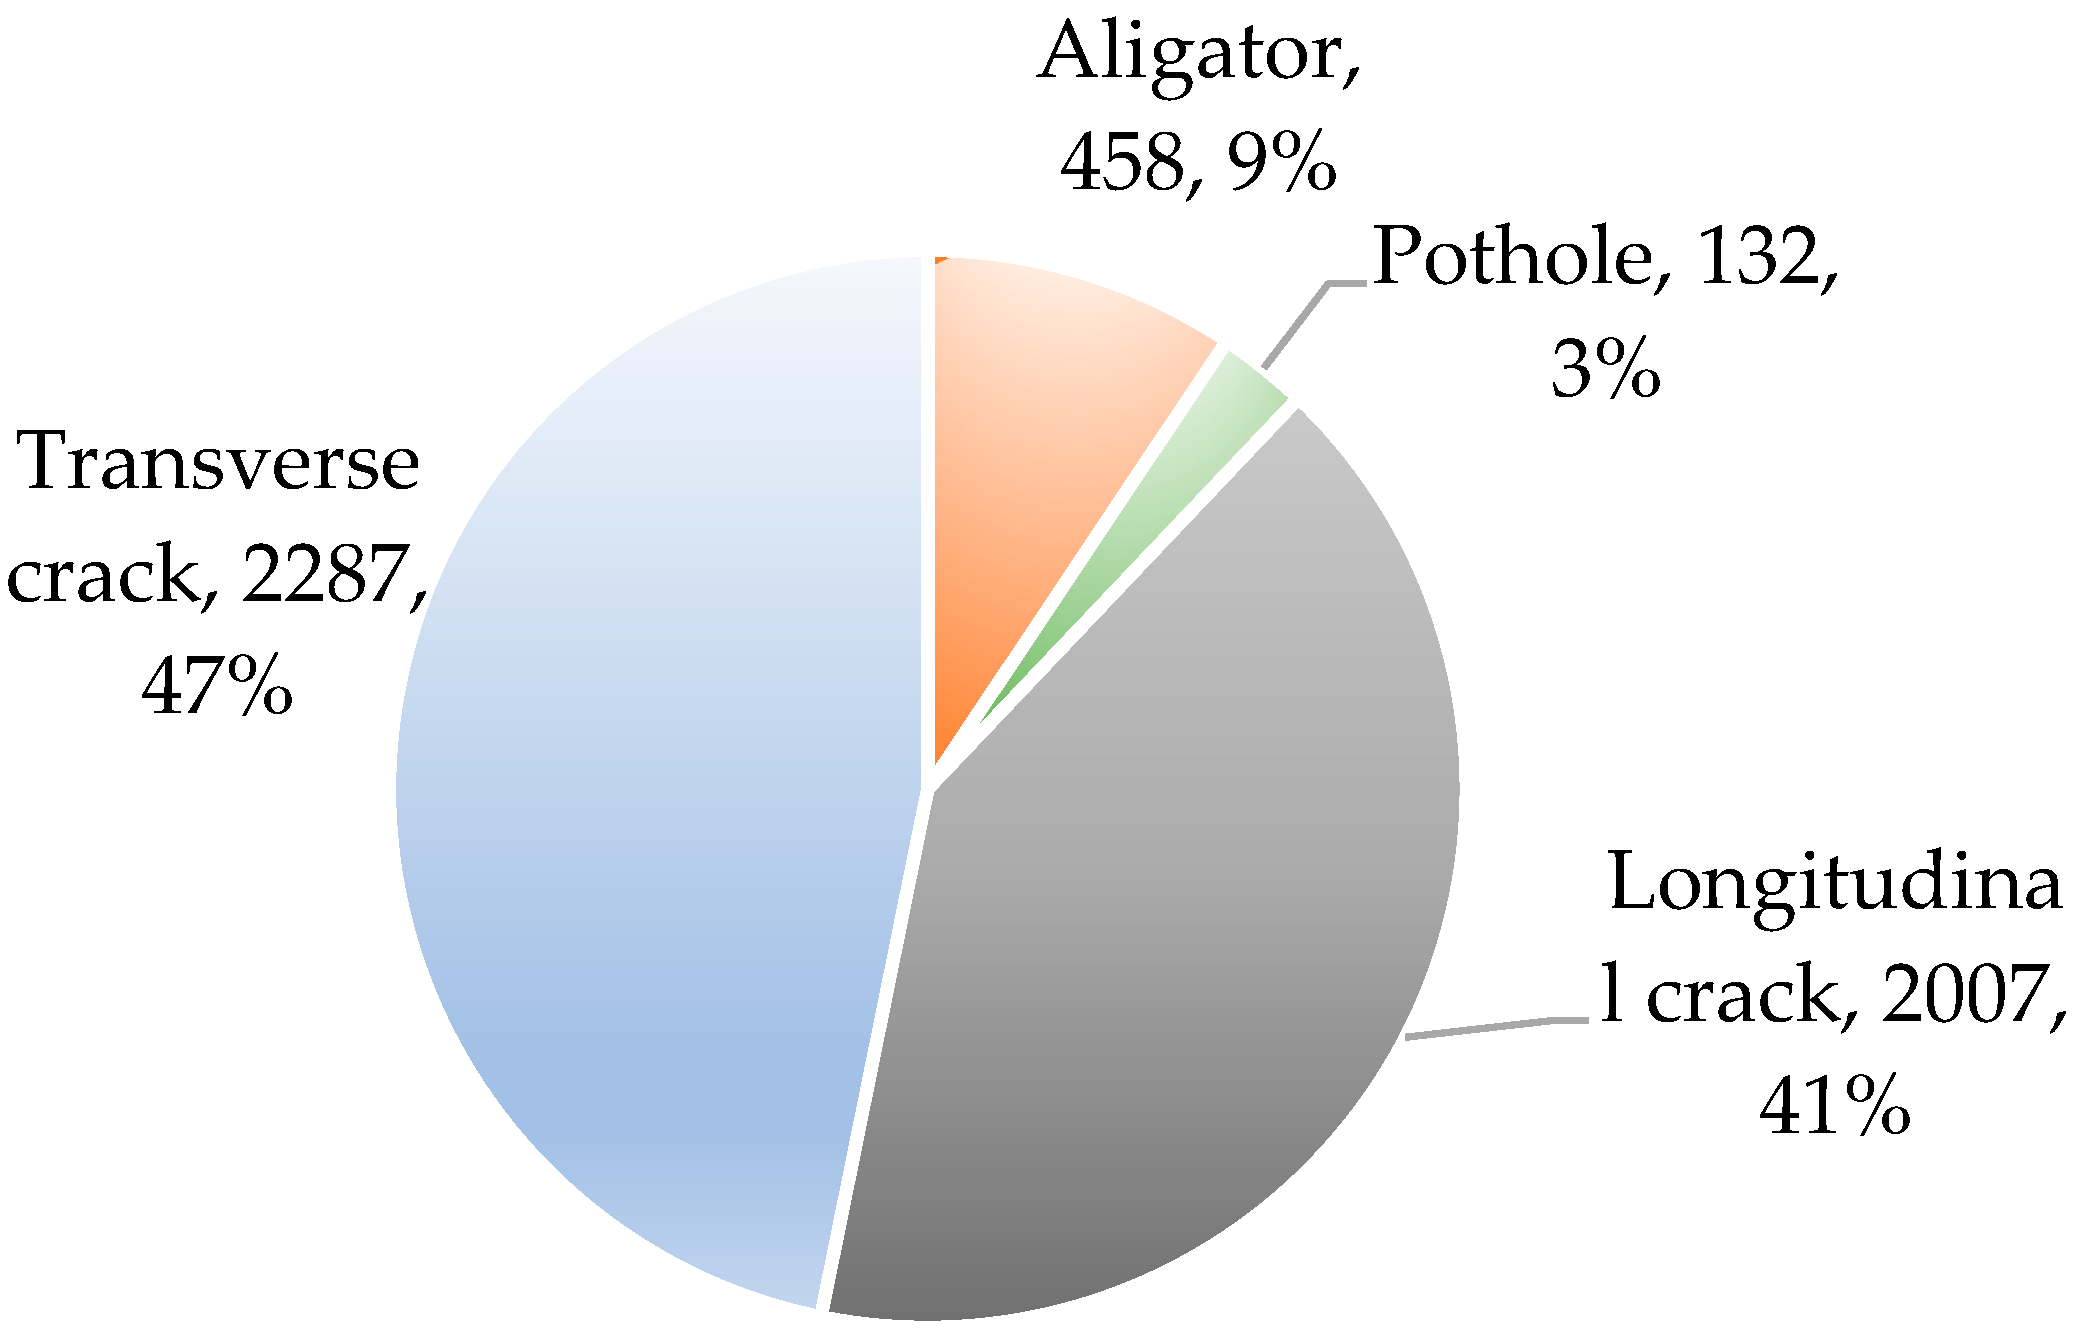
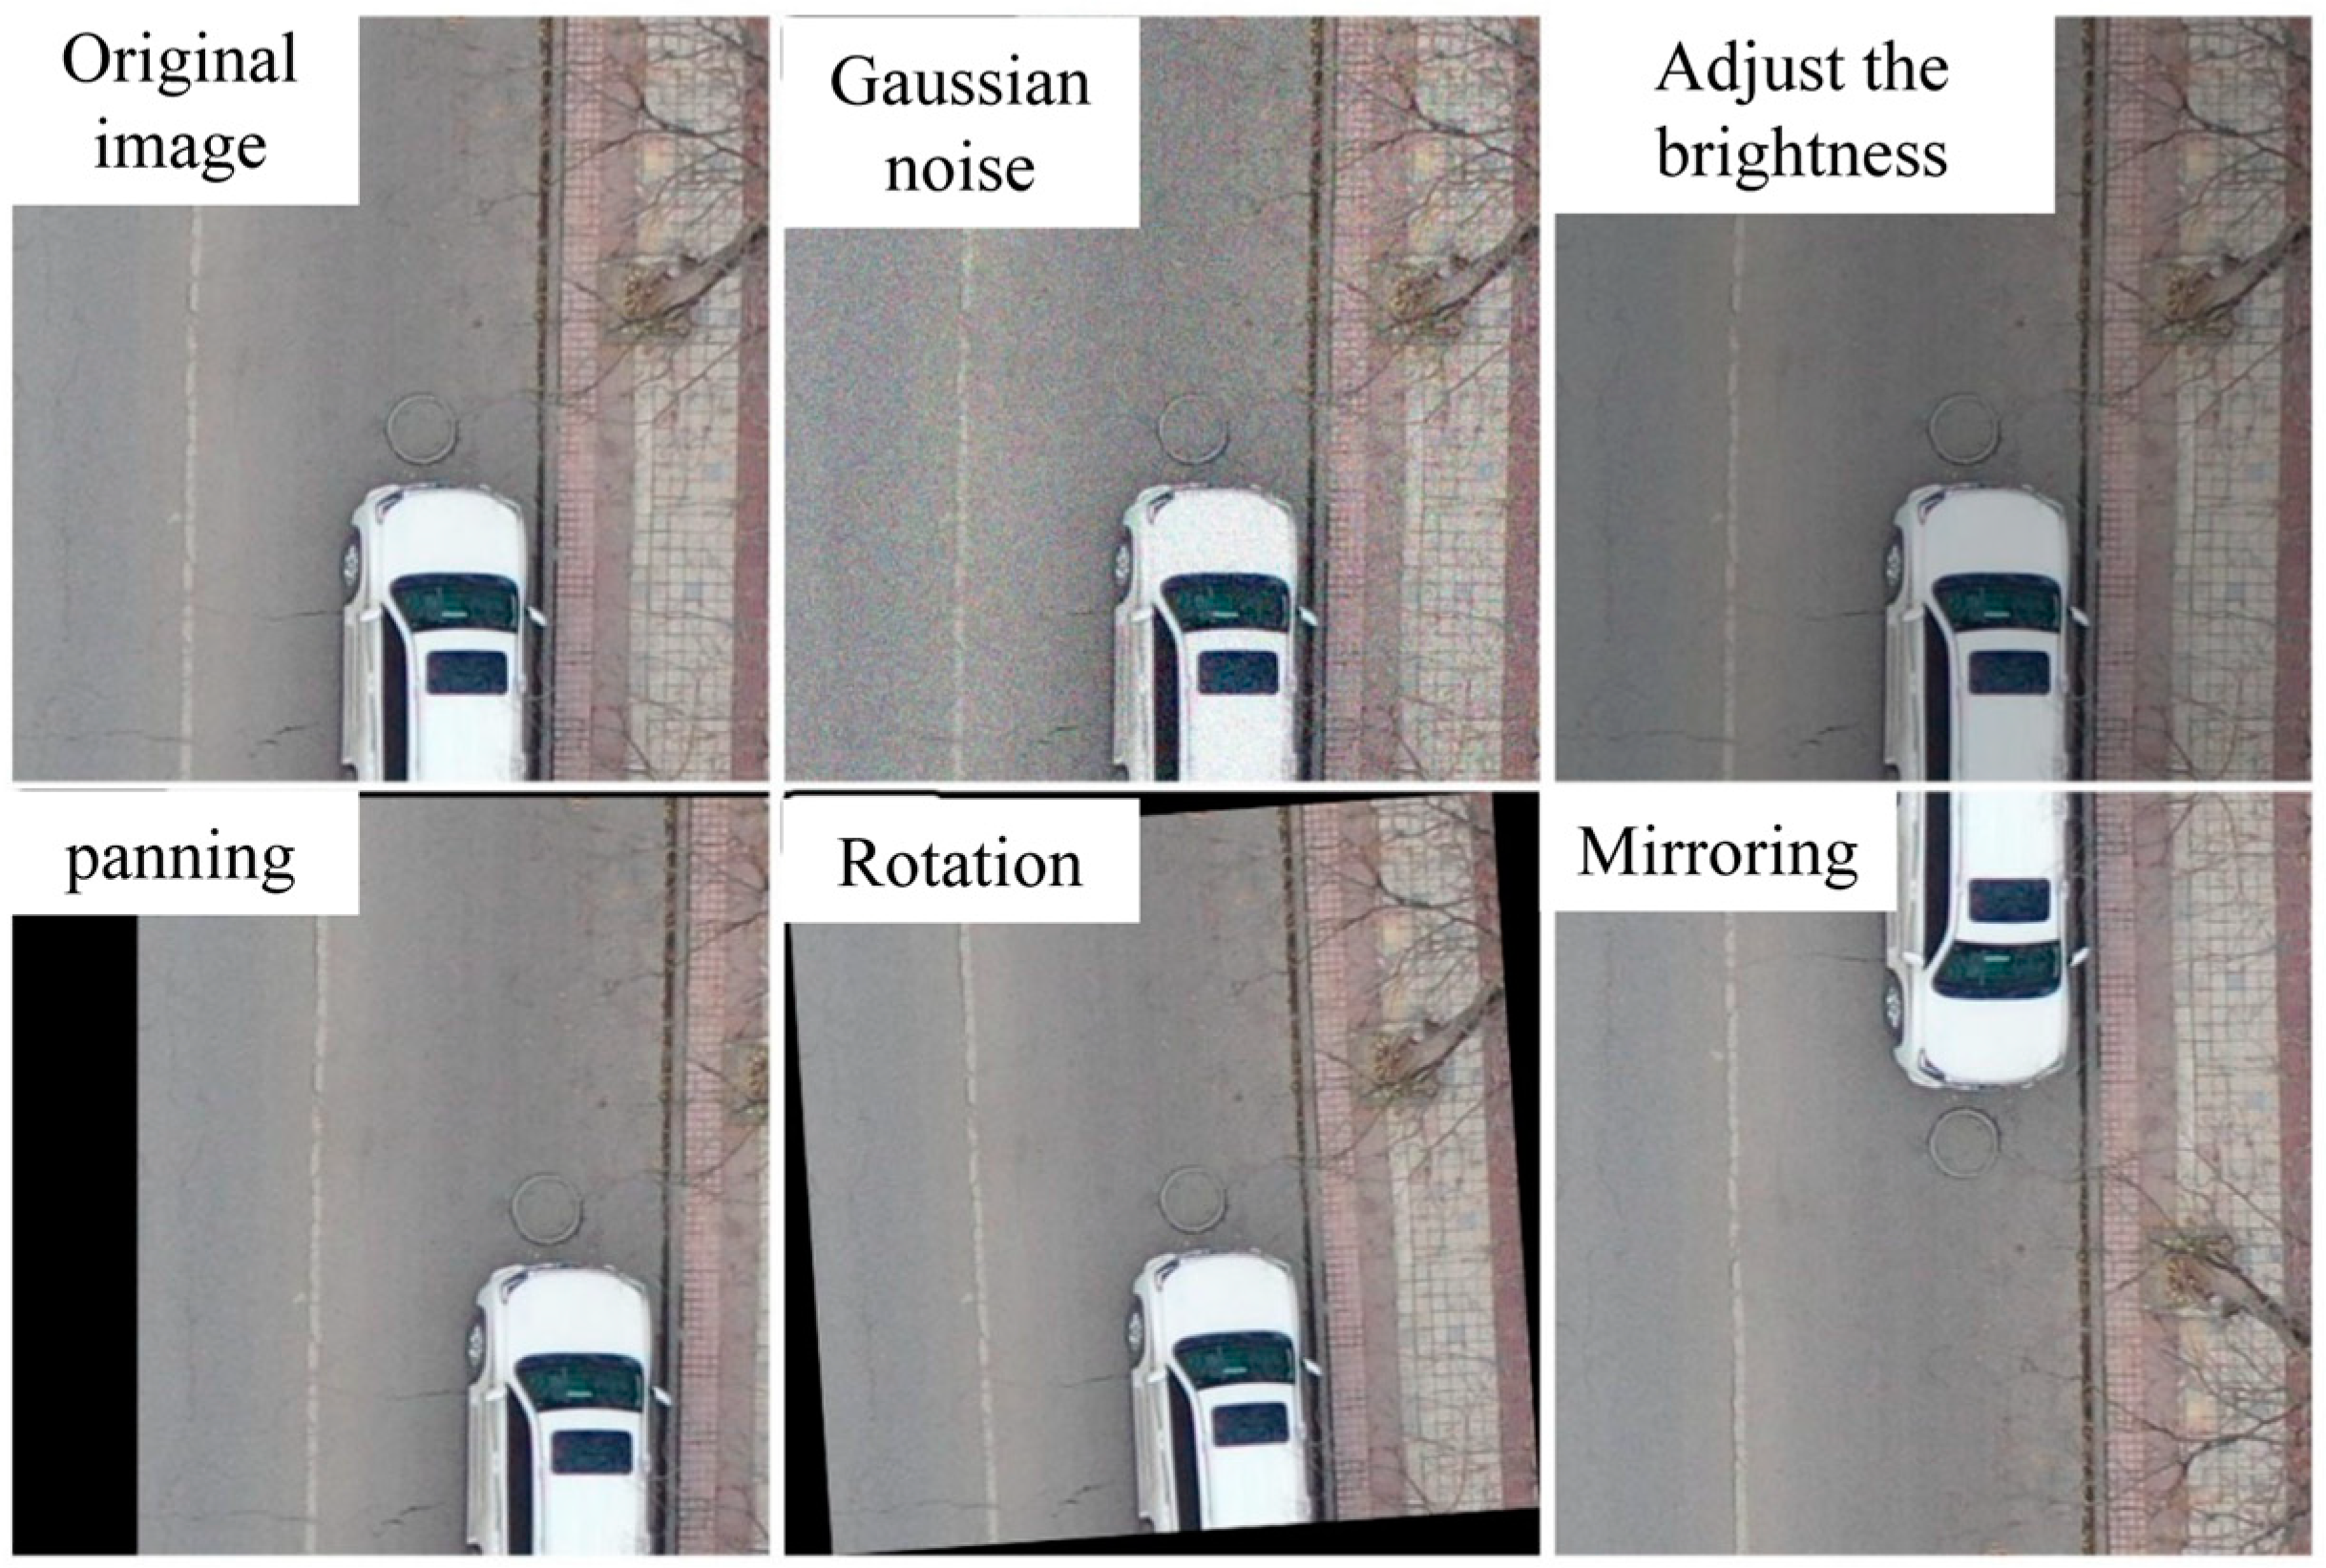
2.1. Dataset
2.2. Methodology
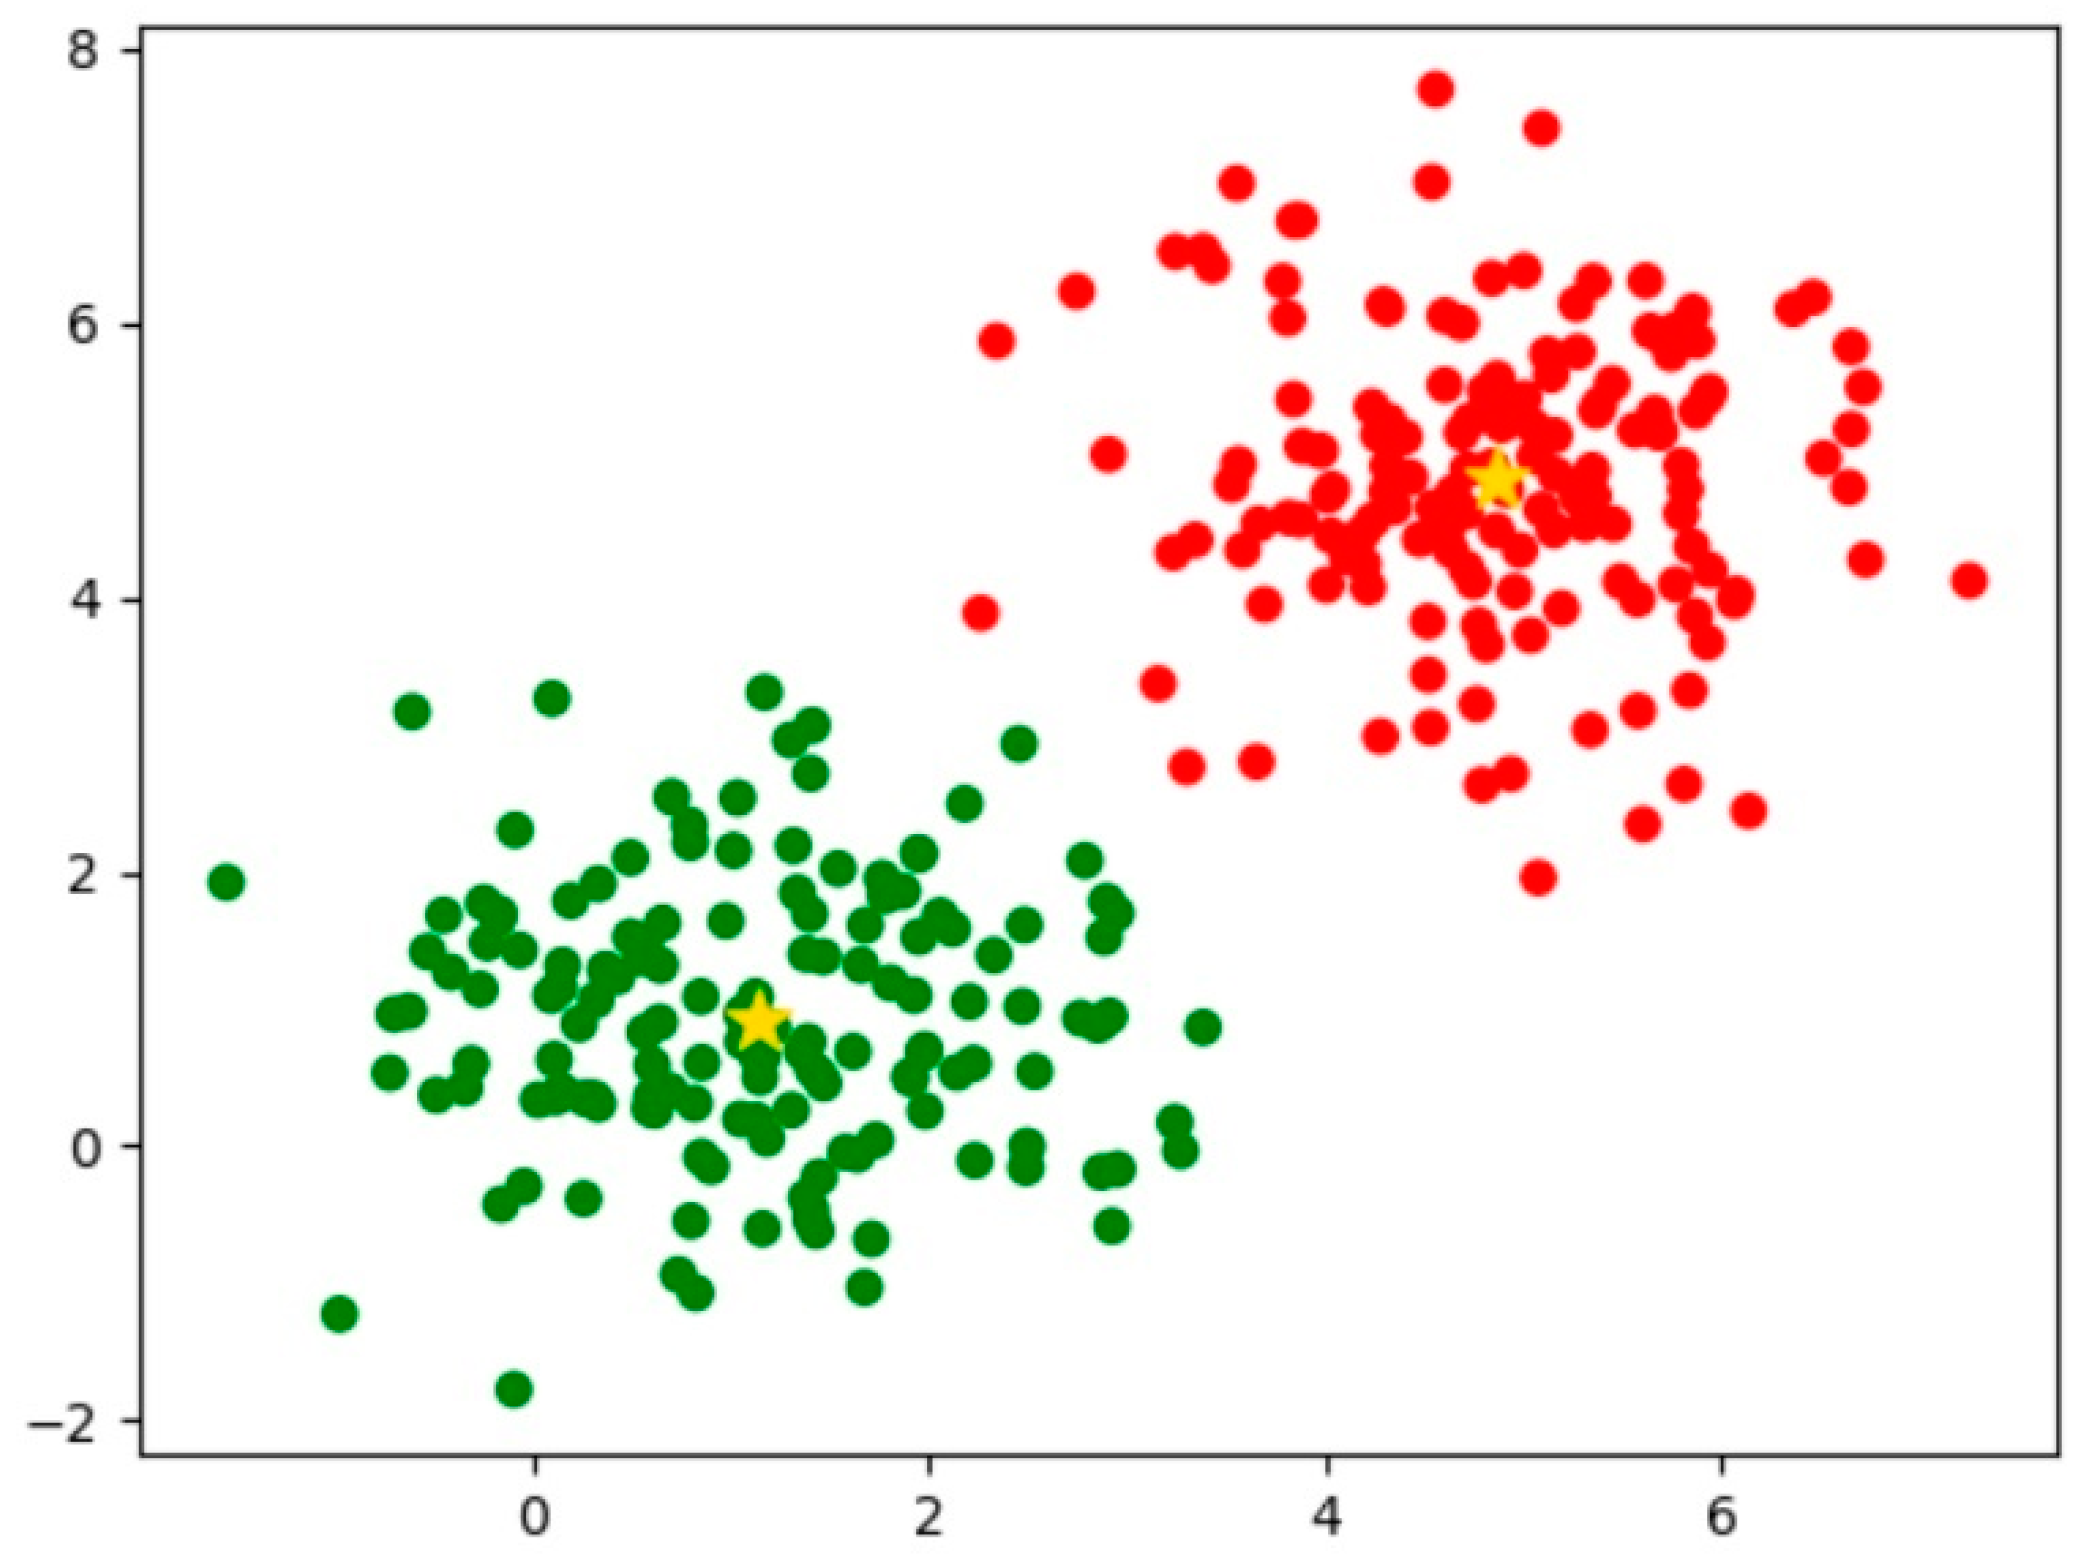
2.2.1. Priori Box Clustering
2.2.2. Backbone Improvement with MobileNetV3
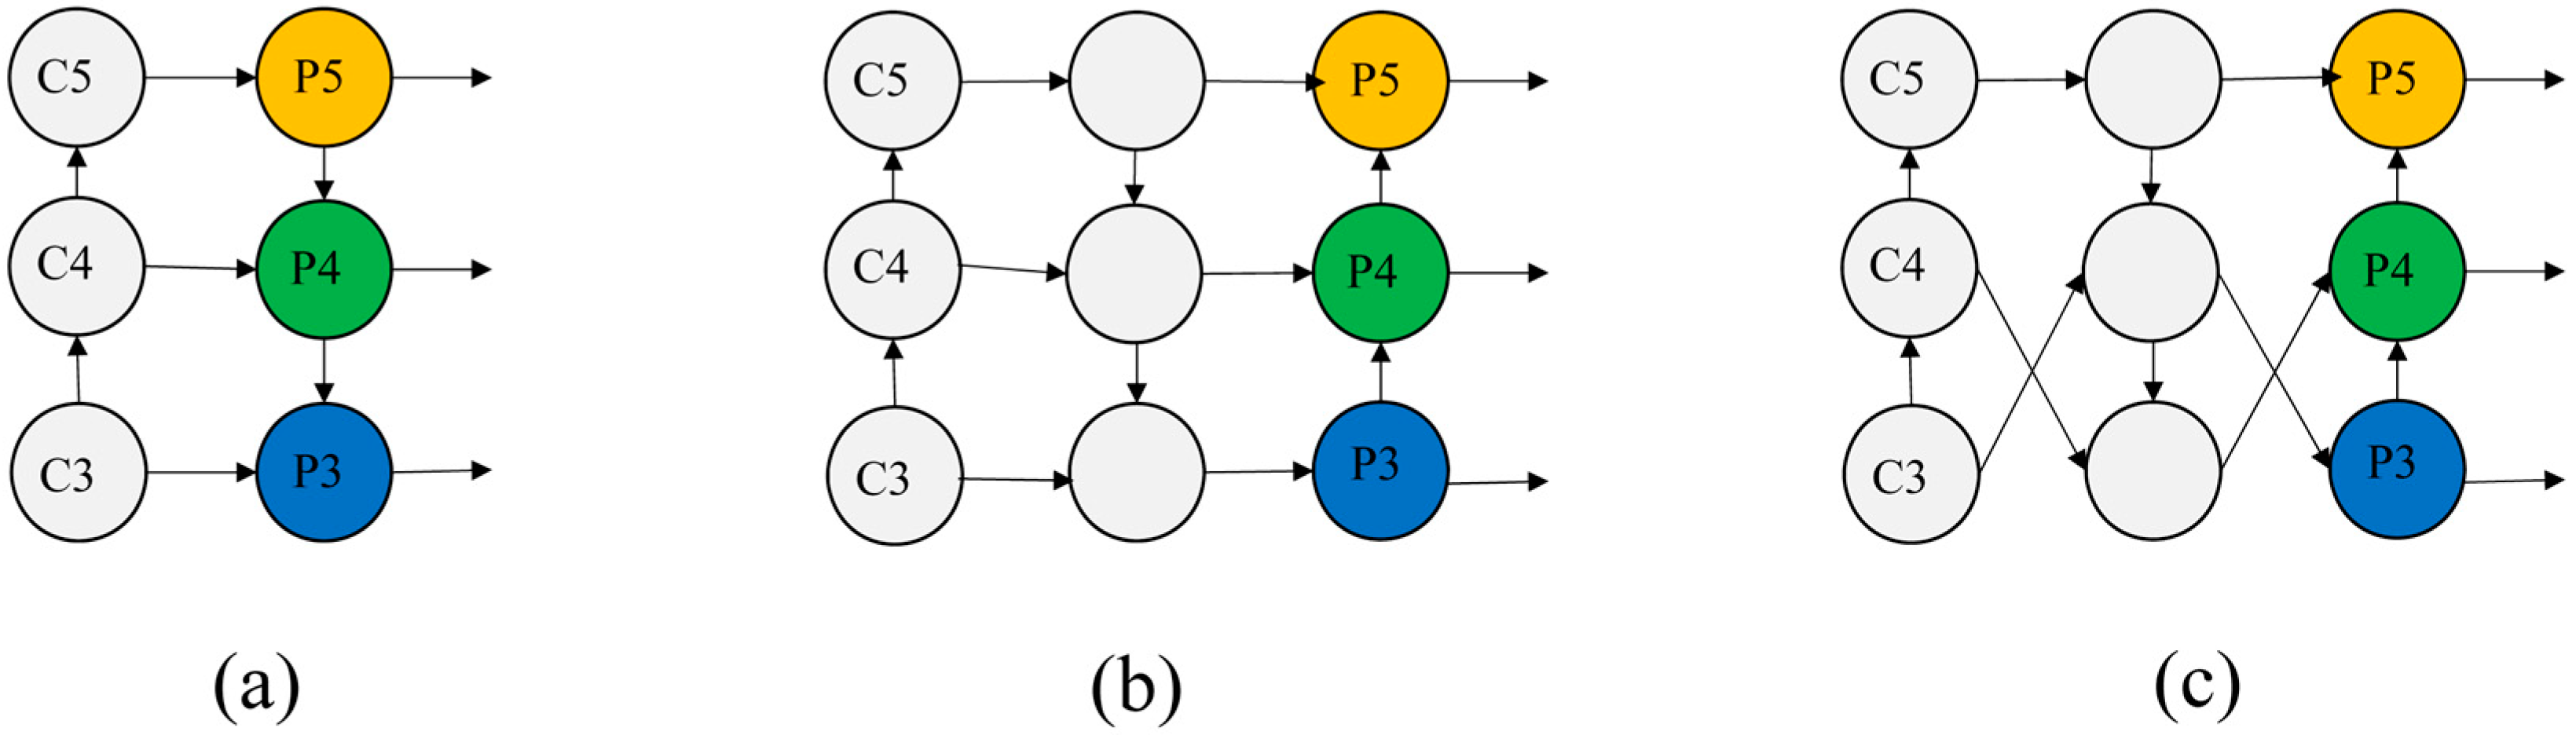
2.2.3. Multi-Scale Feature Fusion Optimization
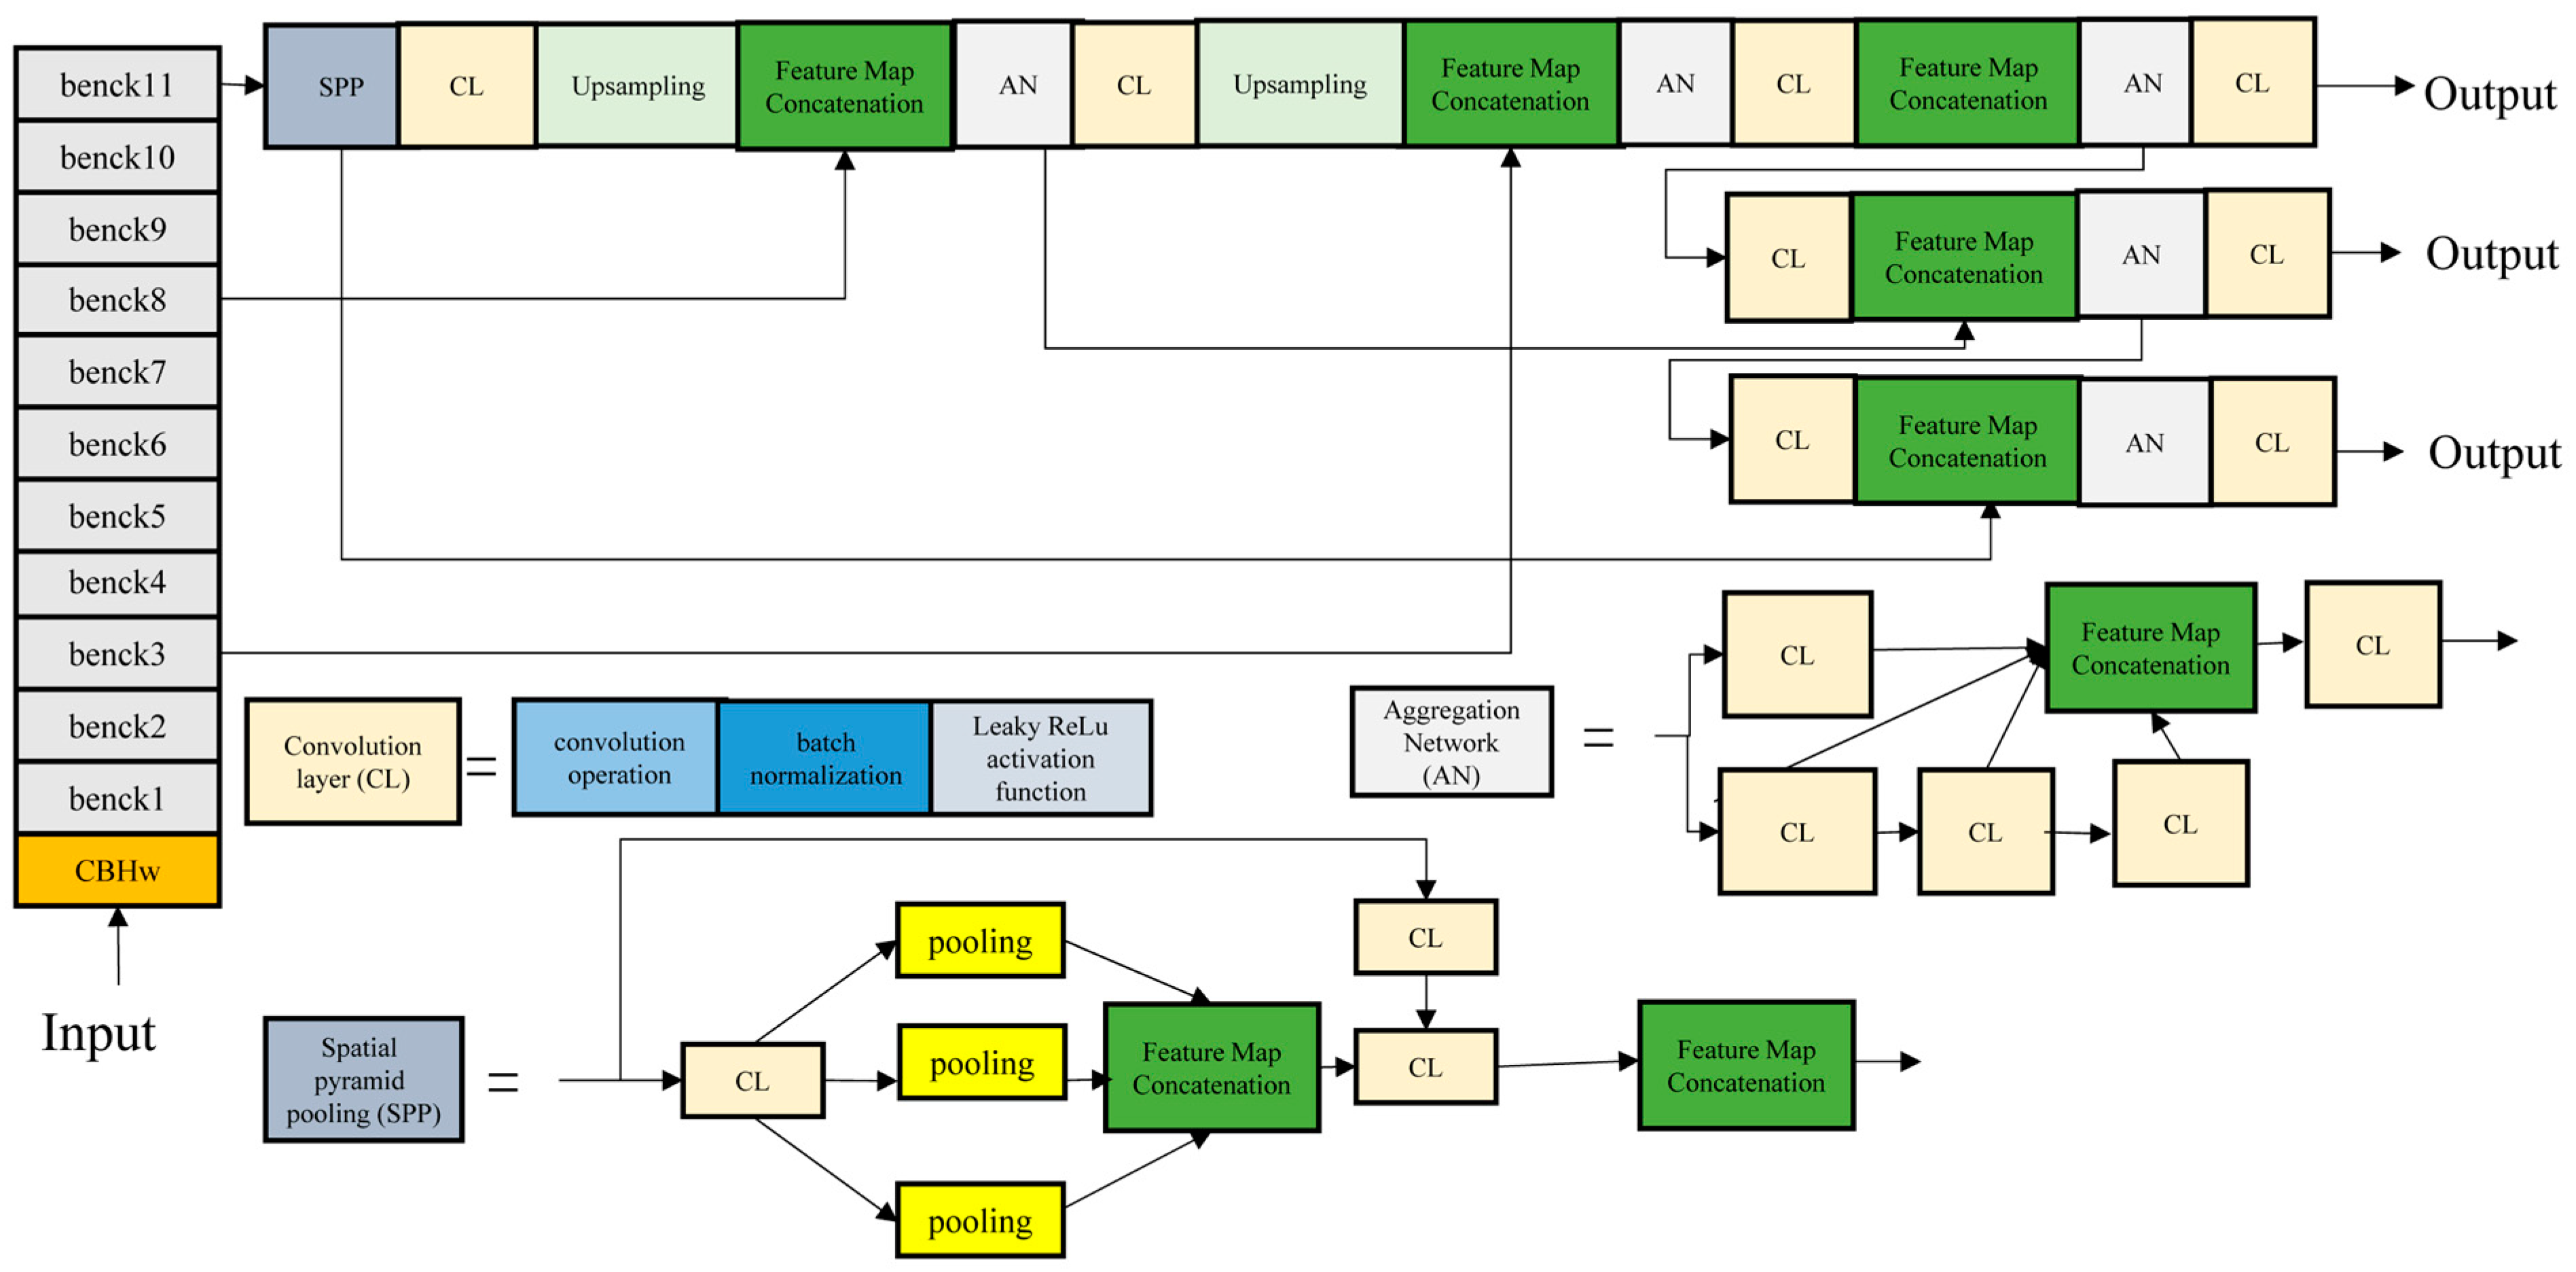
2.2.4. YOLO-MobileNet
2.2.5. YOLO-RDD
3. Experiment
3.1. Experimental Environment
3.2. Evaluation Metrics
4. Results and Discussion
4.1. K-Means Clustering Results
4.2. Comparison of Improved Models
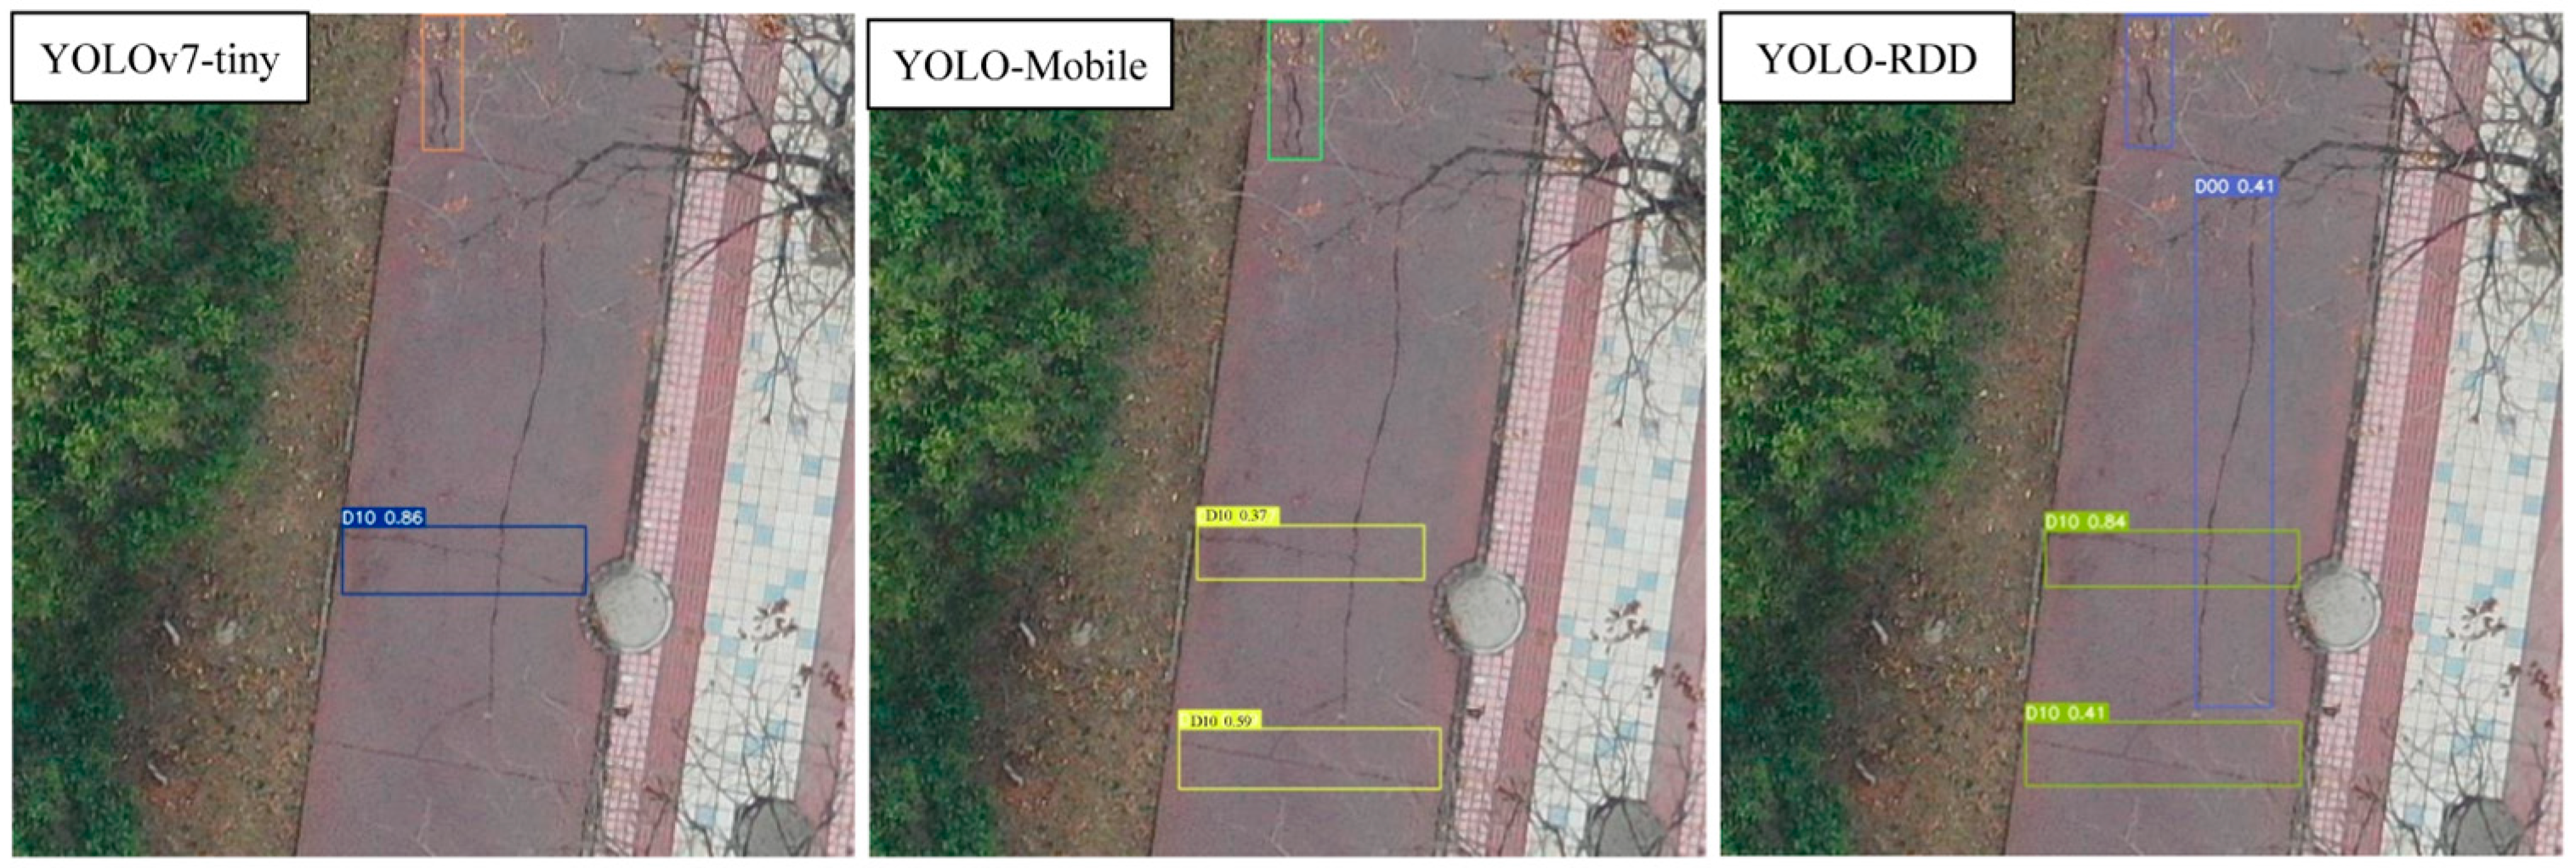
4.3. Case Studies of Experimental Results
5. Conclusions
- YOLO-MobileNet and YOLO-RDD models based on UAV detection image data were constructed;
- The performances of the six models including Faster R-CNN, YOLOX-s, YOLOv5s, YOLOv7-tiny, YOLO-MobileNet, and YOLO-RDD were compared, and YOLO-RDD has the best overall performance;
- Separate convolution has the strongest lightweight ability, but the accuracy needs to be improved.
Author Contributions
Funding
Institutional Review Board Statement
Informed Consent Statement
Data Availability Statement
Conflicts of Interest
References
- Entezari, M.S.; Golroo, A. A review on the impacts of connected vehicles on pavement management systems. Int. J. Pavement Eng. 2023, 24, 2246093. [Google Scholar] [CrossRef]
- Samie, M.; Golroo, A.; Tavakoli, D.; Fahmani, M. Potential applications of connected vehicles in pavement condition evaluation: A brief review. Road Mater. Pavement Des. 2023, 25, 889–913. [Google Scholar] [CrossRef]
- Zhang, Y.; Zuo, Z.; Xu, X.; Wu, J.; Zhu, J.; Zhang, H.; Wang, J.; Tian, Y. Road damage detection using UAV images based on multi-level attention mechanism. Autom. Constr. 2022, 144, 104613. [Google Scholar] [CrossRef]
- Ning, Z.; Wang, H.; Li, S.; Xu, Z. YOLOv7-RDD: A Lightweight Efficient Pavement Distress Detection Model. IEEE Trans. Intell. Transp. Syst. 2024, 25, 6994–7003. [Google Scholar] [CrossRef]
- Lin, Z.; Wang, H.; Li, S. Pavement anomaly detection based on transformer and self-supervised learning. Autom. Constr. 2022, 143, 104544. [Google Scholar] [CrossRef]
- Rosso, M.M.; Marasco, G.; Aiello, S.; Aloisio, A.; Chiaia, B.; Marano, G.C. Convolutional networks and transformers for intelligent road tunnel investigations. Comput. Struct. 2023, 275, 106918. [Google Scholar] [CrossRef]
- Xue, Y.; Li, Y. A fast detection method via region-based fully convolutional neural networks for shield tunnel lining defects. Comput. Civ. Infrastruct. Eng. 2018, 33, 638–654. [Google Scholar] [CrossRef]
- Abdollahi, C.; Mollajafari, M.; Golroo, A.; Moridpour, S.; Wang, H. A review on pavement data acquisition and analytics tools using autonomous vehicles. Road Mater. Pavement Des. 2023, 25, 914–940. [Google Scholar] [CrossRef]
- Chu, C.; Wang, L.; Xiong, H. A review on pavement distress and structural defects detection and quantification technologies using imaging approaches. J. Traffic Transp. Eng. 2022, 9, 135–150. [Google Scholar] [CrossRef]
- Hou, Y.; Li, Q.; Zhang, C.; Lu, G.; Ye, Z.; Chen, Y.; Wang, L.; Cao, D. The State-of-the-Art Review on Applications of Intrusive Sensing, Image Processing Techniques, and Machine Learning Methods in Pavement Monitoring and Analysis. Engineering 2020, 7, 845–856. [Google Scholar] [CrossRef]
- Al-Huda, Z.; Peng, B.; Algburi, R.N.A.; Al-Antari, M.A.; Al-Jarazi, R.; Al-Maqtari, O.; Zhai, D. Asymmetric dual-decoder-U-Net for pavement crack semantic segmentation. Autom. Constr. 2023, 156, 105138. [Google Scholar] [CrossRef]
- Yang, Y.; Wang, H.; Kang, J.; Xu, Z. A method for surveying road pavement distress based on front-view image data using a lightweight segmentation approach. J. Comput. Civ. Eng. 2024, 38, 04024026. [Google Scholar] [CrossRef]
- Hu, W.; Wang, W.; Ai, C.; Wang, J.; Wang, W.; Meng, X.; Liu, J.; Tao, H.; Qiu, S. Machine vision-based surface crack analysis for transportation infrastructure. Autom. Constr. 2021, 132, 103973. [Google Scholar] [CrossRef]
- Chen, J.; Yuan, Y.; Lang, H.; Ding, S.; Lu, J.J. The Improvement of Automated Crack Segmentation on Concrete Pavement with Graph Network. J. Adv. Transp. 2022, 7, 2238095. [Google Scholar] [CrossRef]
- Fei, Y.; Wang, K.C.P.; Zhang, A.; Chen, C.; Li, J.Q.; Liu, Y.; Yang, G.; Li, B. Pixel-Level Cracking Detection on 3D Asphalt Pavement Images Through Deep-Learning- Based CrackNet-V. IEEE Trans. Intell. Transp. Syst. 2019, 21, 273–284. [Google Scholar] [CrossRef]
- Huyan, J.; Li, W.; Tighe, S.; Xu, Z.; Zhai, J. CrackU-net: A novel deep convolutional neural network for pixelwise pavement crack detection. Struct. Control Health Monit. 2020, 27, e2551. [Google Scholar] [CrossRef]
- Apeagyei, A.; Ademolake, T.E.; Adom-Asamoah, M. Evaluation of deep learning models for classification of asphalt pavement distresses. Int. J. Pavement Eng. 2023, 24, 2180641. [Google Scholar] [CrossRef]
- Hoang, N.-D.; Huynh, T.-C.; Tran, V.-D. Computer Vision-Based Patched and Unpatched Pothole Classification Using Machine Learning Approach Optimized by Forensic-Based Investigation Metaheuristic. Complexity 2021, 2021, 3511375. [Google Scholar] [CrossRef]
- Hoang, N.-D.; Huynh, T.-C.; Tran, X.-L.; Tran, V.-D. A Novel Approach for Detection of Pavement Crack and Sealed Crack Using Image Processing and Salp Swarm Algorithm Optimized Machine Learning. Adv. Civ. Eng. 2022, 9193511. [Google Scholar] [CrossRef]
- Hoang, N.-D.; Tran, V.-D. Computer vision based asphalt pavement segregation detection using image texture analysis integrated with extreme gradient boosting machine and deep convolutional neural networks. Measurement 2022, 196, 111207. [Google Scholar] [CrossRef]
- Hoang, N.-D.; Tran, V.-D.; Tran, X.-L. Image processing-based classification of pavement fatigue severity using extremely randomized trees, deep neural network, and convolutional neural network. Int. J. Pavement Eng. 2023, 24, 2201902. [Google Scholar] [CrossRef]
- Nhat-Duc, H.; Van-Duc, T. Comparison of histogram-based gradient boosting classification machine, random Forest, and deep convolutional neural network for pavement raveling severity classification. Autom. Constr. 2023, 148, 104767. [Google Scholar] [CrossRef]
- Lang, H.; Lu, J.J.; Lou, Y.; Chen, S. Pavement Cracking Detection and Classification Based on 3D Image Using Multiscale Clustering Model. J. Comput. Civ. Eng. 2020, 34, 04020034. [Google Scholar] [CrossRef]
- Li, W.; Huyan, J.; Gao, R.; Hao, X.; Hu, Y.; Zhang, Y. Unsupervised Deep Learning for Road Crack Classification by Fusing Convolutional Neural Network and K_Means Clustering. J. Transp. Eng. Part B Pavements 2021, 147, 04021066. [Google Scholar] [CrossRef]
- Hou, Y.; Li, Q.; Han, Q.; Peng, B.; Wang, L.; Gu, X.; Wang, D. MobileCrack: Object Classification in Asphalt Pavements Using an Adaptive Lightweight Deep Learning. J. Transp. Eng. Part B Pavements 2021, 147, 04020092. [Google Scholar] [CrossRef]
- Zhong, J.; Zhu, J.; Huyan, J.; Ma, T.; Zhang, W. Multi-scale feature fusion network for pixel-level pavement distress detection. Autom. Constr. 2022, 141, 104436. [Google Scholar] [CrossRef]
- Lei, X.; Liu, C.; Li, L.; Wang, G. Automated Pavement Distress Detection and Deterioration Analysis Using Street View Map. IEEE Access 2020, 8, 76163–76172. [Google Scholar] [CrossRef]
- Valipour, P.S.; Golroo, A.; Kheirati, A.; Fahmani, M.; Amani, M.J. Automatic pavement distress severity detection using deep learning. Road Mater. Pavement Des. 2023, 25, 1830–1846. [Google Scholar] [CrossRef]
- Wang, A.; Lang, H.; Chen, Z.; Peng, Y.; Ding, S.; Lu, J.J. The Two-Step Method of Pavement Pothole and Raveling Detection and Segmentation Based on Deep Learning. IEEE Trans. Intell. Transp. Syst. 2024, 25, 5402–5417. [Google Scholar] [CrossRef]
- Wu, Y.; Hong, M.; Li, A.; Huang, S.; Liu, H.; Ge, Y. Self-Supervised Adversarial Learning for Domain Adaptation of Pavement Distress Classification. IEEE Trans. Intell. Transp. Syst. 2023, 25, 1966–1977. [Google Scholar] [CrossRef]
- Chen, N.; Shi, H.; Liu, R.; Li, Y.; Li, J.; Xu, Z.; Wang, D.; Lu, G.; Jing, B.; Hou, Y. A 5G Cloud Platform and Machine Learning-Based Mobile Automatic Recognition of Transportation Infrastructure Objects. IEEE Wirel. Commun. 2023, 30, 76–81. [Google Scholar] [CrossRef]
- Pan, Z.; Guan, J.; Yang, X.; Fan, K.; Ong, J.C.; Guo, N.; Wang, X. One-stage 3D profile-based pavement crack detection and quantification. Autom. Constr. 2023, 153, 104946. [Google Scholar] [CrossRef]
- Pan, Z.; Guan, J.; Yang, X.; Guo, A.; Wang, X. 3D profile-based pothole segmentation and quantification. Int. J. Hydromechatron. 2024, 7, 16–30. [Google Scholar] [CrossRef]
- Zhu, J.; Zhong, J.; Ma, T.; Huang, X.; Zhang, W.; Zhou, Y. Pavement distress detection using convolutional neural networks with images captured via UAV. Autom. Constr. 2022, 133, 103391. [Google Scholar] [CrossRef]
- Zhang, X.; Zhou, X.; Lin, M.; Sun, J. Shufflenet: An extremely efficient convolutional neural network for mobile devices. In Proceedings of the IEEE Conference on Computer Vision and Pattern Recognition, Salt Lake City, UT, USA, 18–23 June 2018. [Google Scholar]
- Ma, D.; Fang, H.; Wang, N.; Zhang, C.; Dong, J.; Hu, H. Automatic Detection and Counting System for Pavement Cracks Based on PCGAN and YOLO-MF. IEEE Trans. Intell. Transp. Syst. 2022, 23, 22166–22178. [Google Scholar] [CrossRef]
- Terven, J.; Córdova-Esparza, D.-M.; Romero-González, J.-A. A Comprehensive Review of YOLO Architectures in Computer Vision: From YOLOv1 to YOLOv8 and YOLO-NAS. Mach. Learn. Knowl. Extr. 2023, 5, 1680–1716. [Google Scholar] [CrossRef]
- Li, Y.; Liu, C.; Shen, Y.; Cao, J.; Yu, S.; Du, Y. RoadID: A Dedicated Deep Convolutional Neural Network for Multipavement Distress Detection. Int. J. Transp. Eng. Part B Pavements 2021, 147, 04021057. [Google Scholar] [CrossRef]
- Ibragimov, E.; Lee, H.J.; Lee, J.J.; Kim, N. Automated pavement distress detection using region based convolutional neural networks. Int. J. Pavement Eng. 2022, 23, 1981–1992. [Google Scholar] [CrossRef]
- Li, Y.; Liu, C.; Du, Y.; Jiang, S. A novel evaluation method for pavement distress based on impact of ride comfort. Int. J. Pavement Eng. 2022, 23, 638–650. [Google Scholar] [CrossRef]
- Wang, W.; Xu, X.; Peng, J.; Hu, W.; Wu, D. Fine-Grained Detection of Pavement Distress Based on Integrated Data Using Digital Twin. Appl. Sci. 2023, 13, 4549. [Google Scholar] [CrossRef]
- Wan, F.; Sun, C.; He, H.; Lei, G.; Xu, L.; Xiao, T. YOLO-LRDD: A lightweight method for road damage detection based on improved YOLOv5s. EURASIP J. Adv. Signal Process. 2022, 2022, 98. [Google Scholar] [CrossRef]
- Deeksha, A.; Maeda, H.; Ghosh, S.K.; Toshniwal, D.; Sekimoto, Y. RDD2022: A multi-national image dataset for automatic road damage detection. Geosci. Data J. 2022, 1–17. [Google Scholar] [CrossRef]
- Howard, A.; Sandler, M.; Chen, B.; Wang, W.; Chen, L.-C.; Tan, M.; Chu, G.; Vasudevan, V.; Zhu, Y.; Pang, R.; et al. Searching for MobileNetV. In Proceedings of the 2019 IEEE/CVF International Conference on Computer Vision (ICCV), Seoul, Republic of Korea, 27 October–2 November 2019; pp. 1314–1324. [Google Scholar] [CrossRef]
- Hu, J.; Shen, L.; Albanie, S.; Sun, G.; Wu, E. Squeeze-and-excitation networks. In Proceedings of the 2018 IEEE/CVF Conference on Computer Vision and Pattern Recognition, Salt Lake City, UT, USA, 18–23 June 2018; pp. 7132–7141. [Google Scholar]
- Yang, J.; Wu, C.; Du, B.; Zhang, L. Enhanced Multiscale Feature Fusion Network for HSI Classification. IEEE Trans. Geosci. Remote Sens. 2021, 59, 10328–10347. [Google Scholar] [CrossRef]
- Nascimento, M.G.; Fawcett, R.; Prisacariu, V.A. Dsconv: Efficient convolution operator. In Proceedings of the IEEE/CVF Inter-national Conference on Computer Vision, Seoul, Republic of Korea, 27 October–2 November 2019; pp. 5148–5157. [Google Scholar]


| Source | Number of Distress Types | Algorithm Type | Data Type/Collection Method | mAP | Param (M) |
|---|---|---|---|---|---|
| Lei et al., 2020 [27] | 8 | YOLOv3 based detection | 1024 pixels × 512 pixels, front view color images/BaiduMap API | 0.8837 | / |
| Li et al., 2021 [38] | 5 | CNN based | 1628 pixels × 1236 pixels, front view (more tend to top-view) grey images/HD industry camera | 0.8594 (IoU ≥ 0.5) | / |
| Ibragimovet al., 2022 [39] | 3 | CNN based | 1965 × 2000 pixels, top view grey images/HD industry camera | 0.666 (IoU ≥ 0.7) | / |
| Li et al., 2022 [40] | 8 | YOLOv3 based | 2592 × 2048 pixels, front view (more tend to top-view) grey images | 0.7869 (IoU ≥ 0.5) | / |
| Wang et al., 2023 [41] | 5 (including 4 types of cracks) | YOLOv5 based | 640 × 640 pixels, top view color images/UAV | 0.7653 (IoU ≥ 0.5) | / |
| Zhang et al., 2022 [3] | 4 | YOLOv3 based | 500 pixels × 500 pixels, top view color images/UAV | 0.6875 | / |
| Wan et al., 2022 [42] | 4 | YOLOv5 based | 640 × 640 pixels, front view color images/low-cost camera | 0.576 (IoU ≥ 0.5) | 19.8 |
| Faster R-CNN | 0.602 | 28.3 | |||
| Zhu et al., 2022 [34] | 6 | YOLOv3 based | 7952 × 5304 pixels divided into 512 × 512 pixels blocks, top view color images/UAV | 0.566 (IoU ≥ 0.5) | / |
| No. | SE | Residual Structure | Activation Function |
|---|---|---|---|
| benck1 | √ | × | Relu |
| benck2 | × | × | Relu |
| benck3 | × | √ | Relu |
| benck4 | √ | × | Hard Wish |
| benck5 | √ | √ | Hard Wish |
| benck6 | √ | √ | Hard Wish |
| benck7 | √ | × | Hard Wish |
| benck8 | √ | √ | Hard Wish |
| benck9 | √ | √ | Hard Wish |
| benck10 | √ | √ | Hard Wish |
| benck11 | √ | √ | Hard Wish |
| Parameters | Settings |
|---|---|
| Learning rate | 0.01 |
| Weight Decay | 0.1 |
| Learning Momentum | 0.937 |
| Batch size | 8 |
| Training rounds | 200 |
| Model | Param (M) | FLOPs (G) | [email protected] | BA | F1 |
|---|---|---|---|---|---|
| Faster R-CNN | 41.3 | 251.4 | 0.63 | 0.588 | 0.61 |
| YOLOX-s | 9.0 | 26.8 | 0.67 | 0.528 | 0.66 |
| YOLOv5s | 7.03 | 16.0 | 0.659 | 0.536 | 0.65 |
| YOLOv7-tiny | 6.03 | 13.1 | 0.686 | 0.534 | 0.68 |
| YOLO-MobileNet | 4.48 | 6.7 | 0.460 | 0.481 | 0.48 |
| YOLO-RDD | 6.02 | 1.9 | 0.701 | 0.553 | 0.69 |
Disclaimer/Publisher’s Note: The statements, opinions and data contained in all publications are solely those of the individual author(s) and contributor(s) and not of MDPI and/or the editor(s). MDPI and/or the editor(s) disclaim responsibility for any injury to people or property resulting from any ideas, methods, instructions or products referred to in the content. |
© 2024 by the authors. Licensee MDPI, Basel, Switzerland. This article is an open access article distributed under the terms and conditions of the Creative Commons Attribution (CC BY) license (https://creativecommons.org/licenses/by/4.0/).
Share and Cite
Xu, F.; Wan, Y.; Ning, Z.; Wang, H. Comparative Study of Lightweight Target Detection Methods for Unmanned Aerial Vehicle-Based Road Distress Survey. Sensors 2024, 24, 6159. https://doi.org/10.3390/s24186159
Xu F, Wan Y, Ning Z, Wang H. Comparative Study of Lightweight Target Detection Methods for Unmanned Aerial Vehicle-Based Road Distress Survey. Sensors. 2024; 24(18):6159. https://doi.org/10.3390/s24186159
Chicago/Turabian StyleXu, Feifei, Yan Wan, Zhipeng Ning, and Hui Wang. 2024. "Comparative Study of Lightweight Target Detection Methods for Unmanned Aerial Vehicle-Based Road Distress Survey" Sensors 24, no. 18: 6159. https://doi.org/10.3390/s24186159