
Design, Calibration and Morphological Characterization of a Flexible Sensor with Adjustable Chemical Sensitivity and Possible Applications to Sports Medicine

 ,
,  ,
,  ,
,  , , ,
, , ,  ,
, 
Abstract
:1. Introduction
2. Materials and Methods
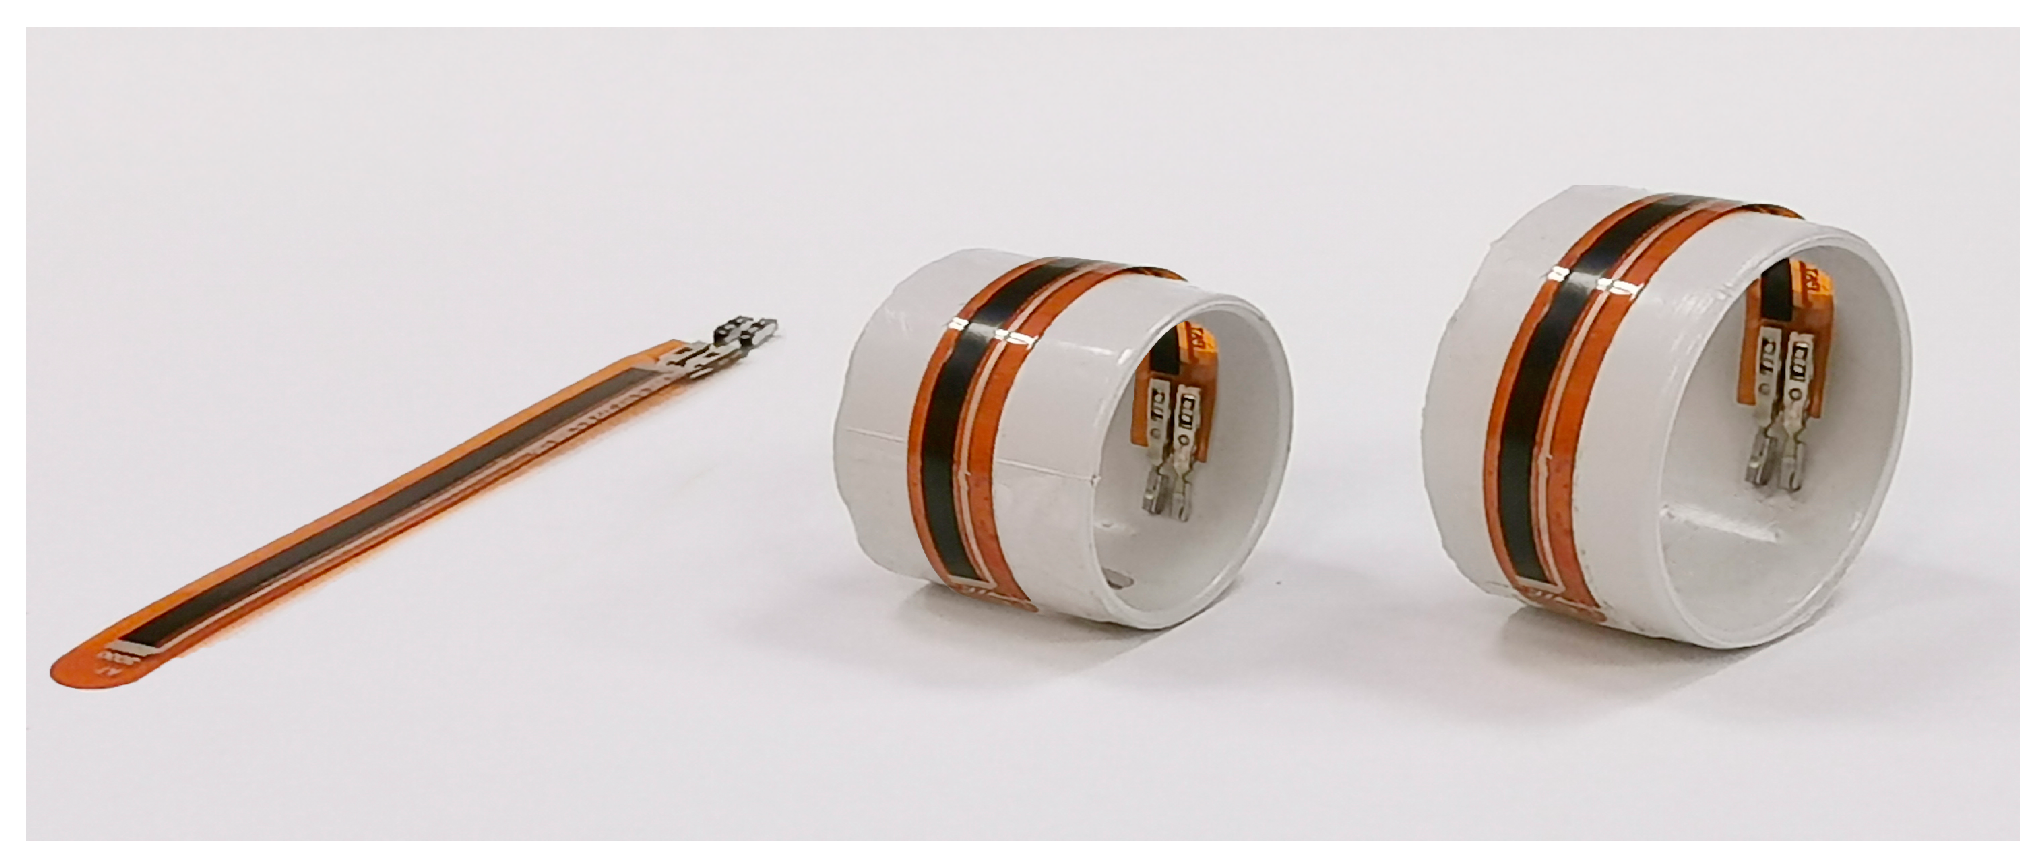
2.1. Sensing Material
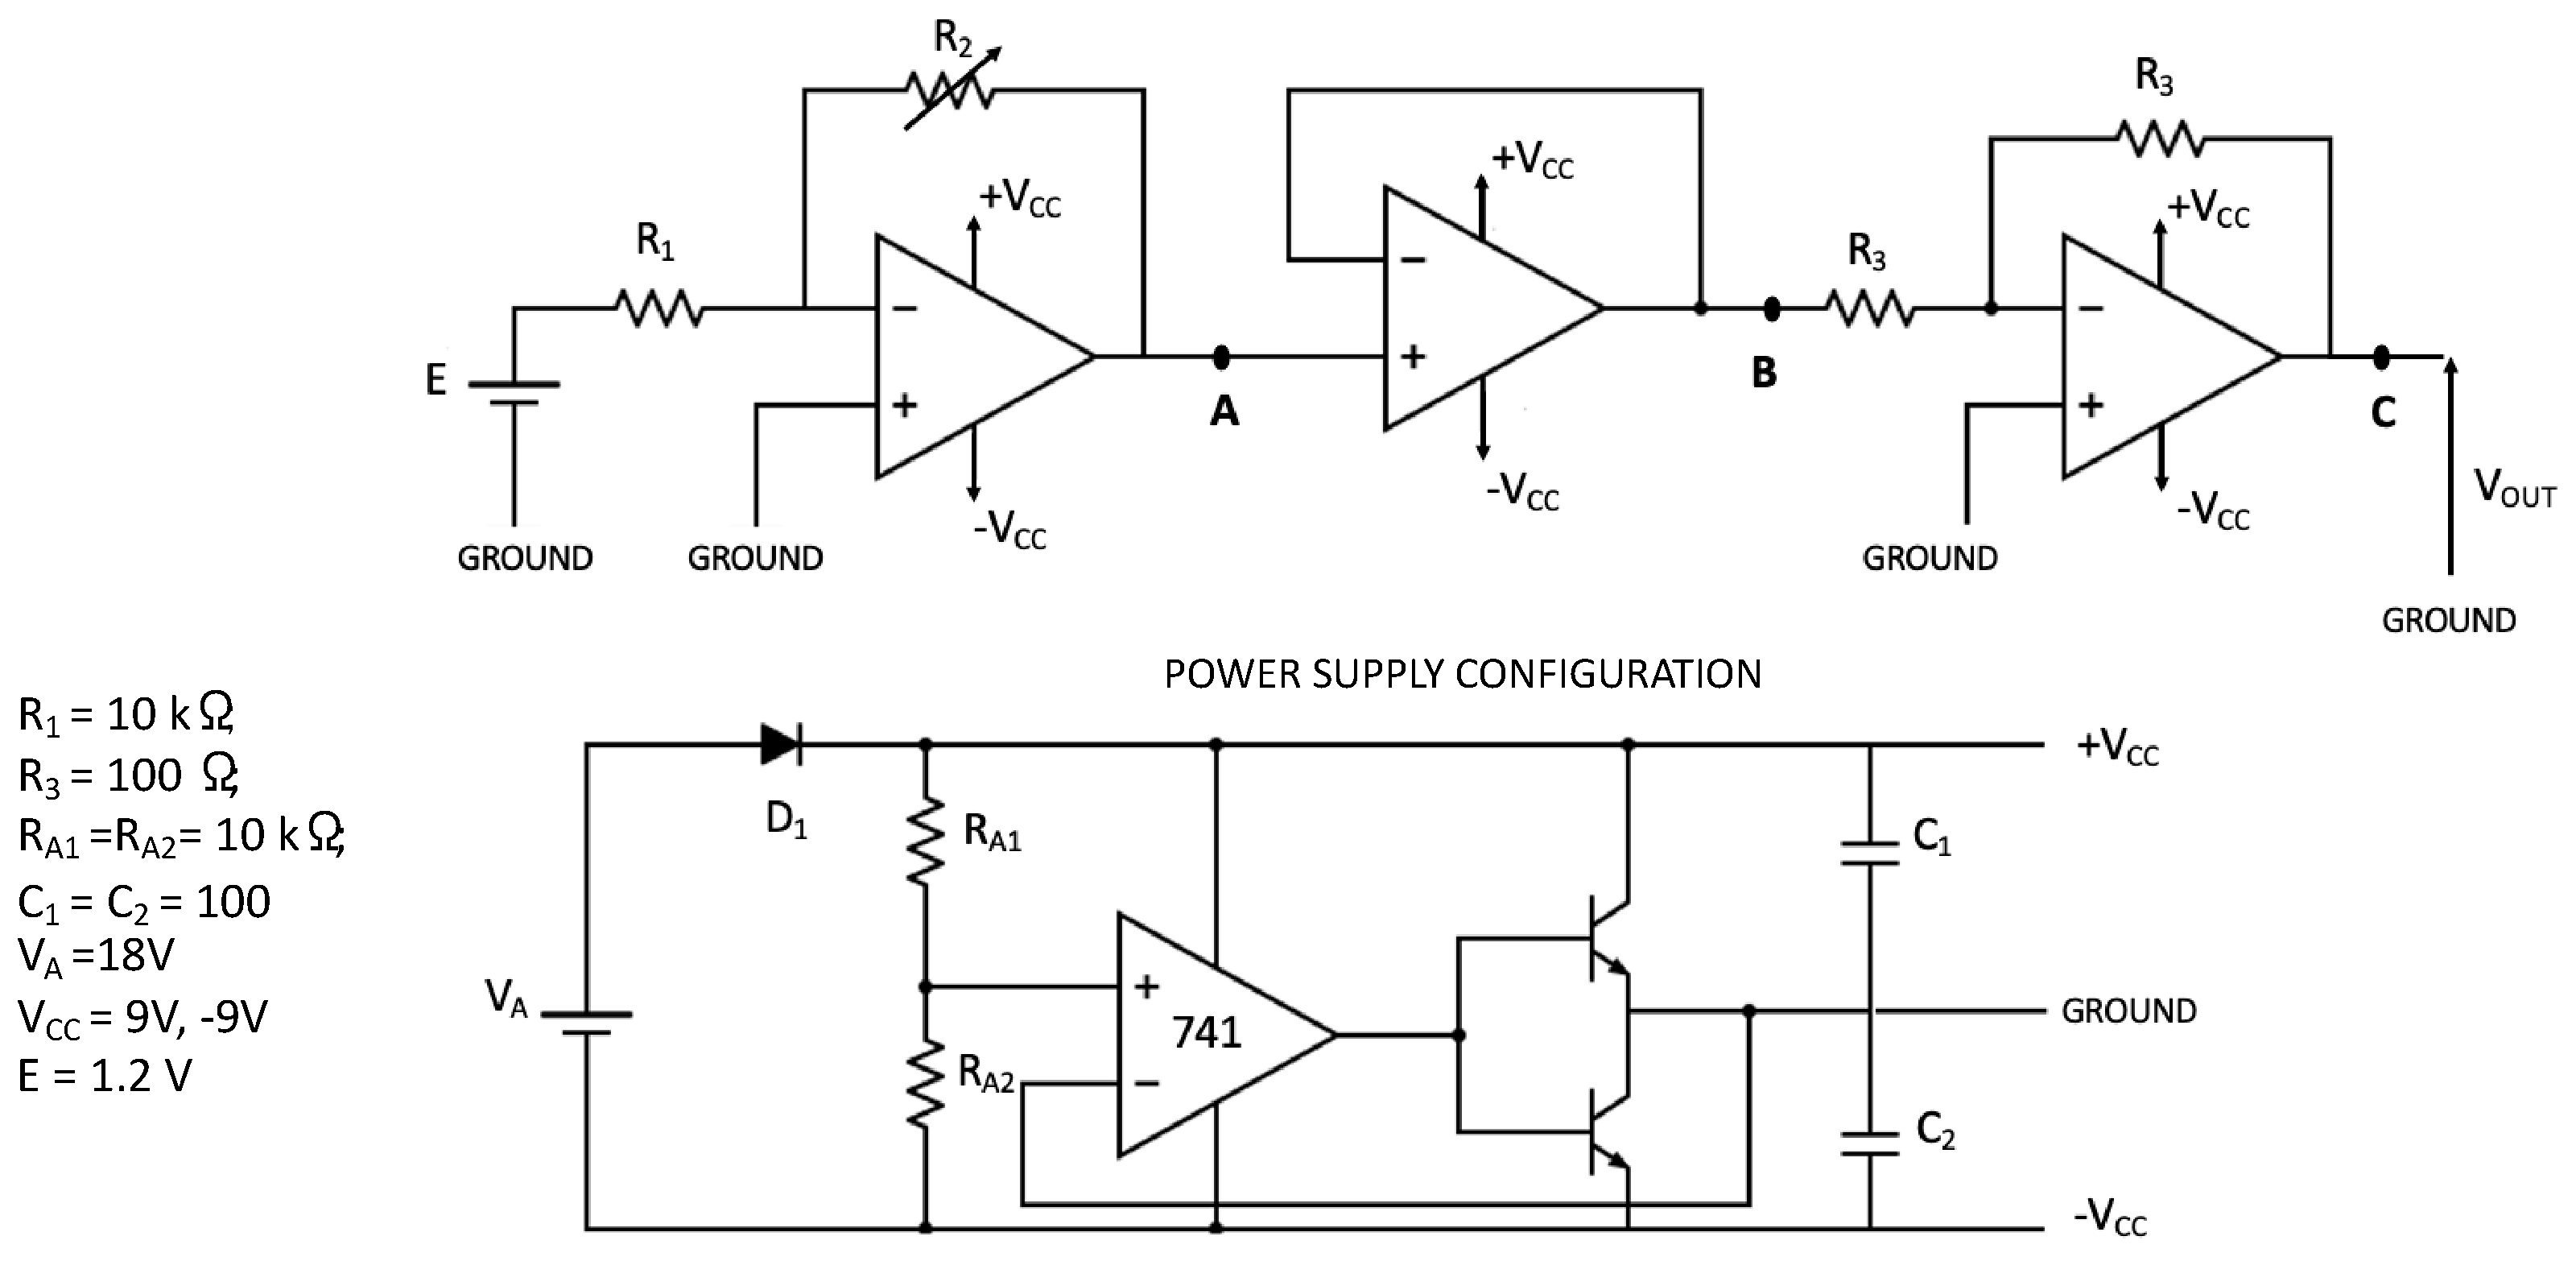
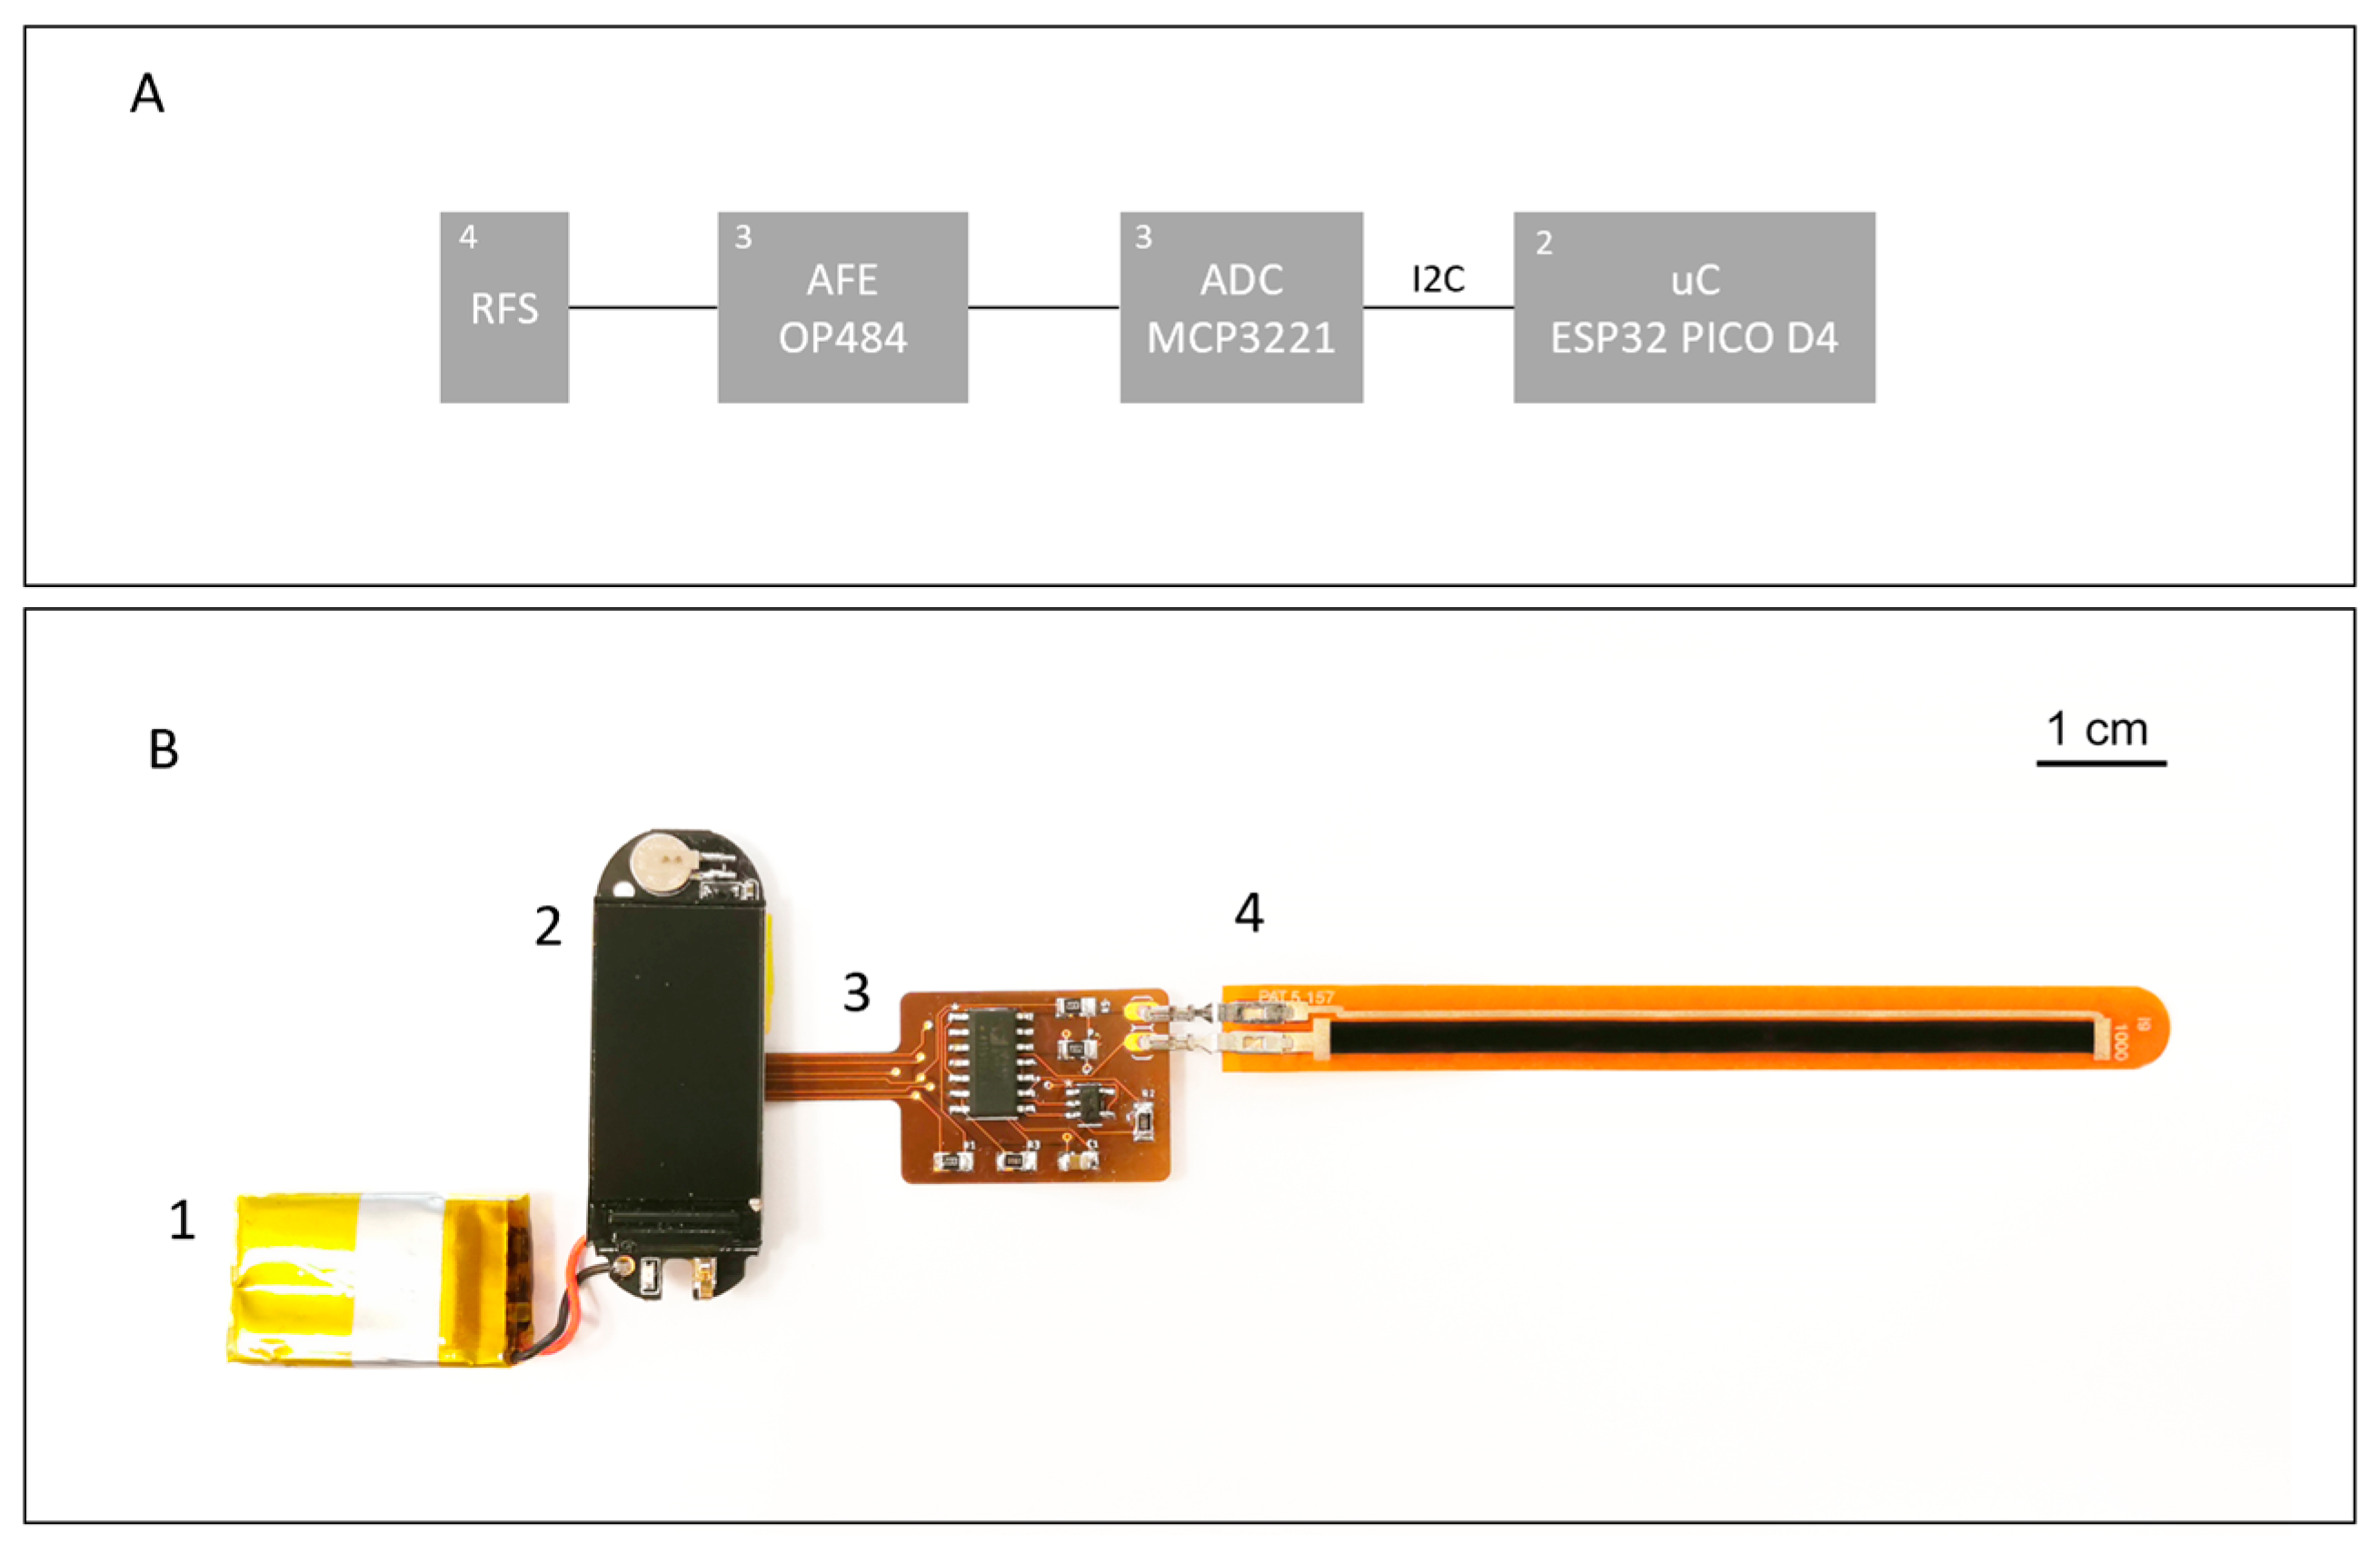
2.2. Read-Out Electronics
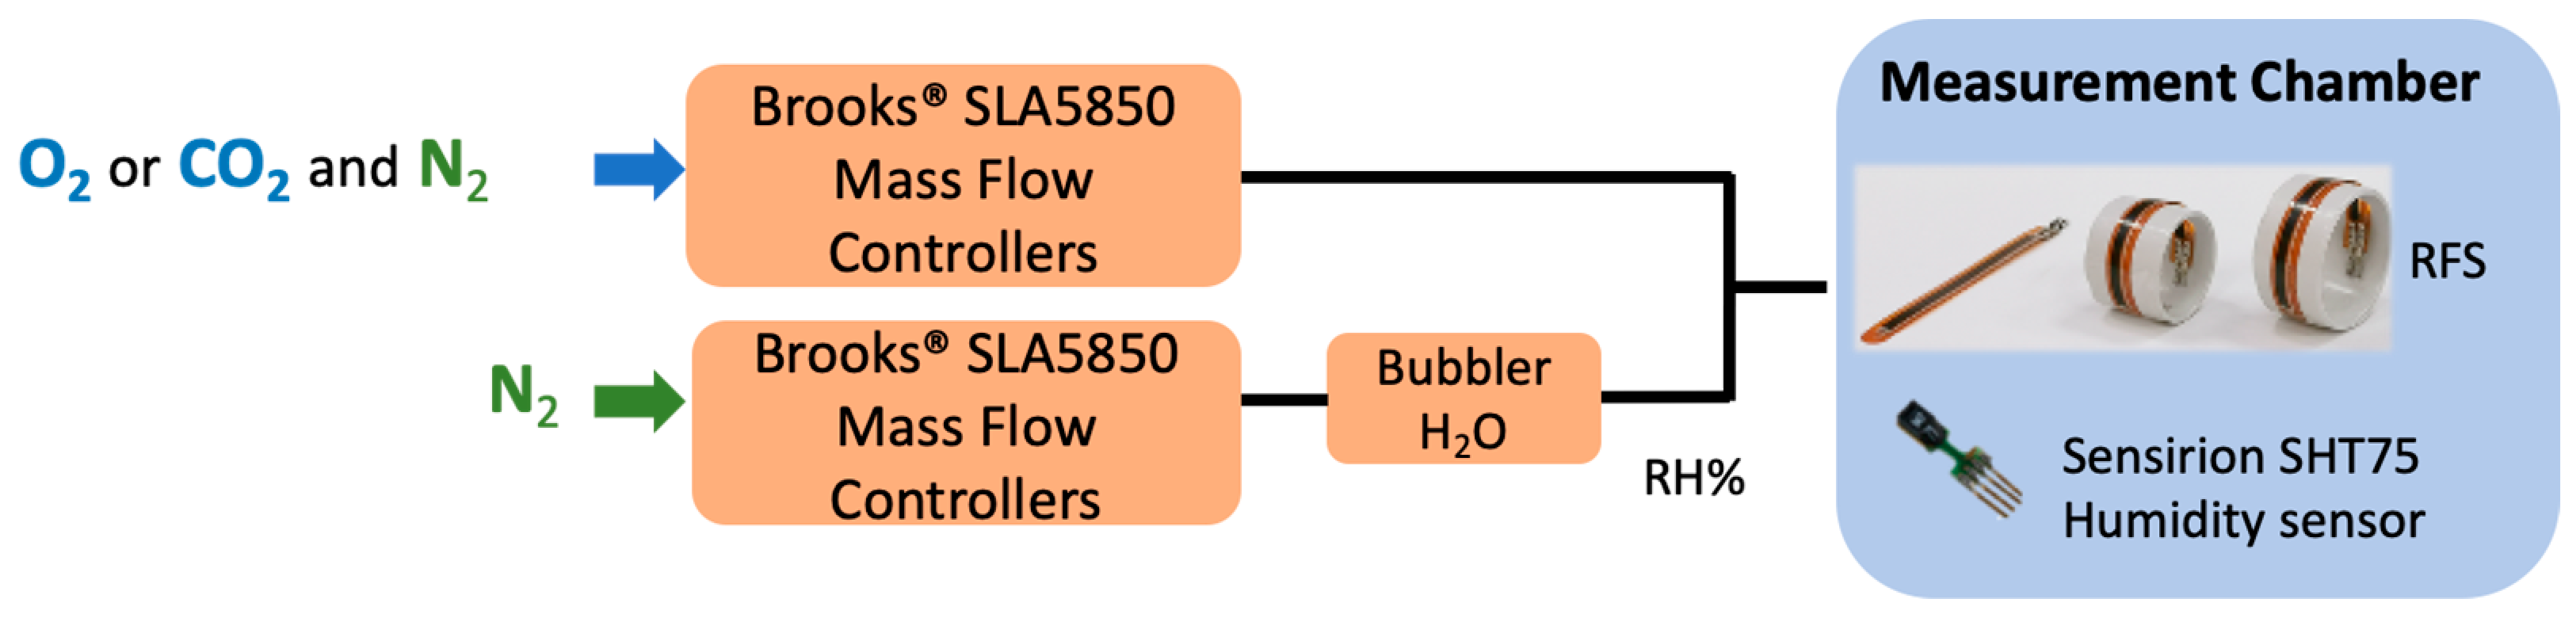
2.3. Calibration Set-Up
2.4. Prototype Fabrication
3. Results
3.1. Calibration
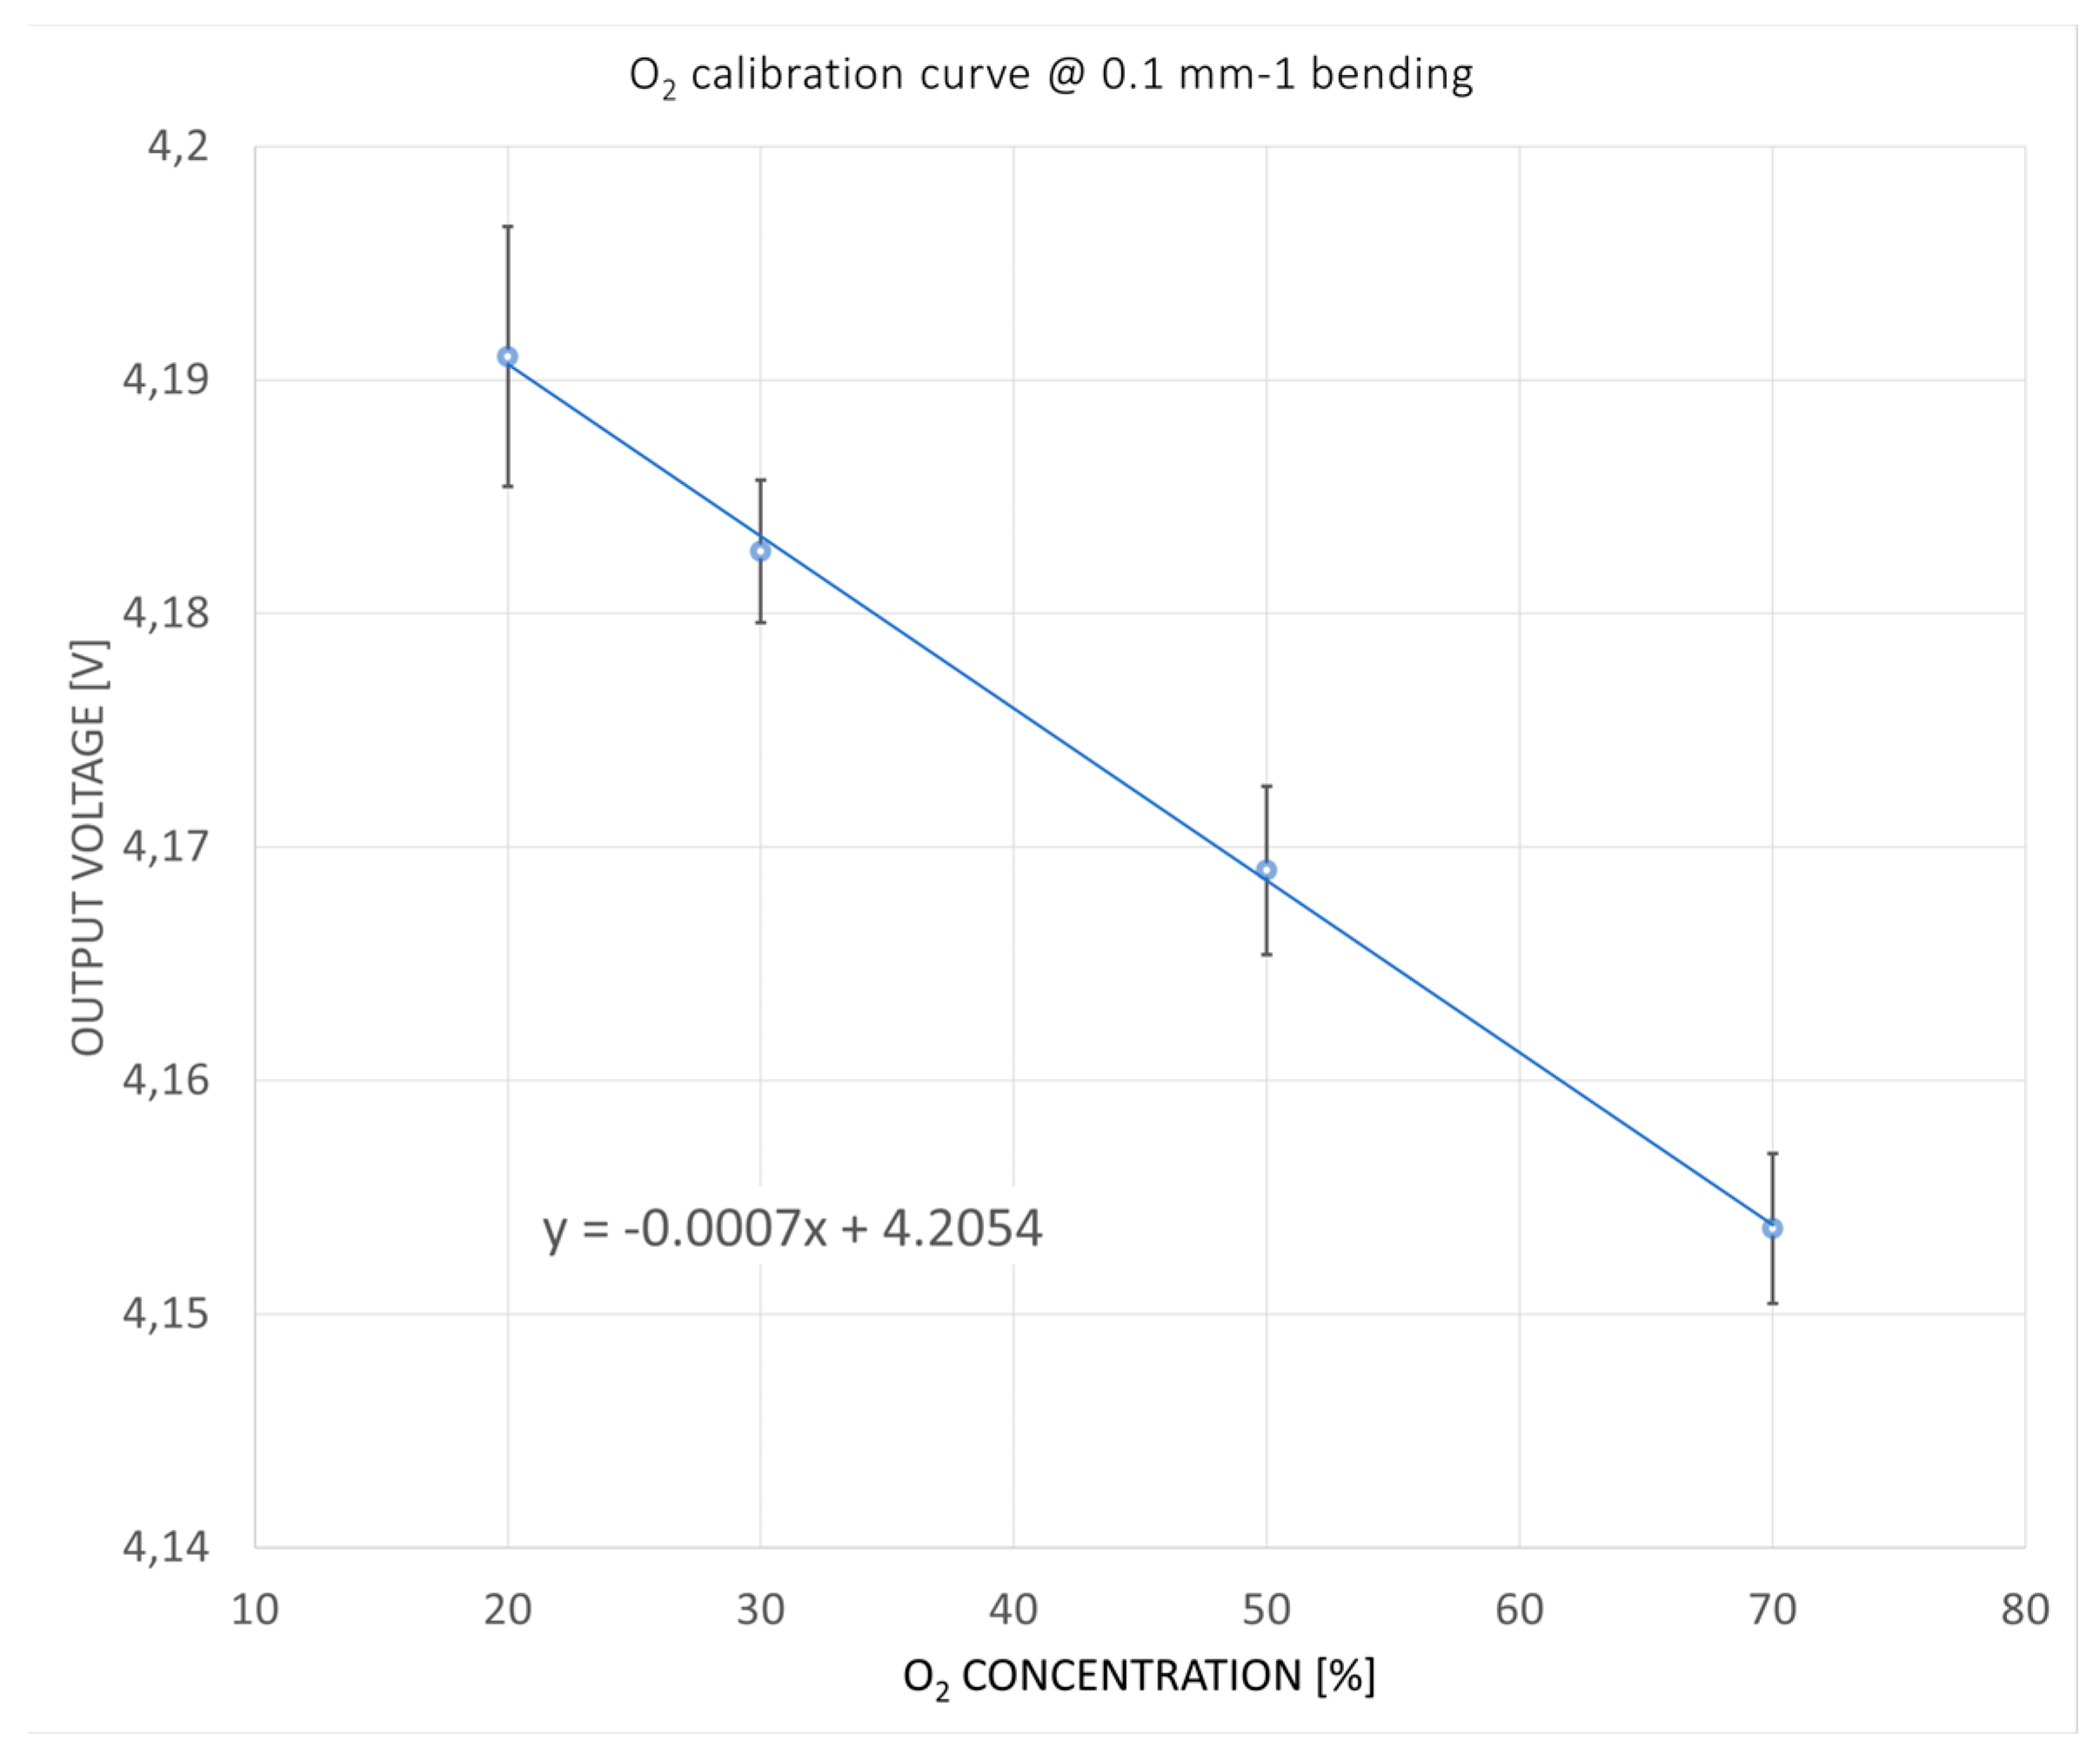
3.1.1. Oxygen
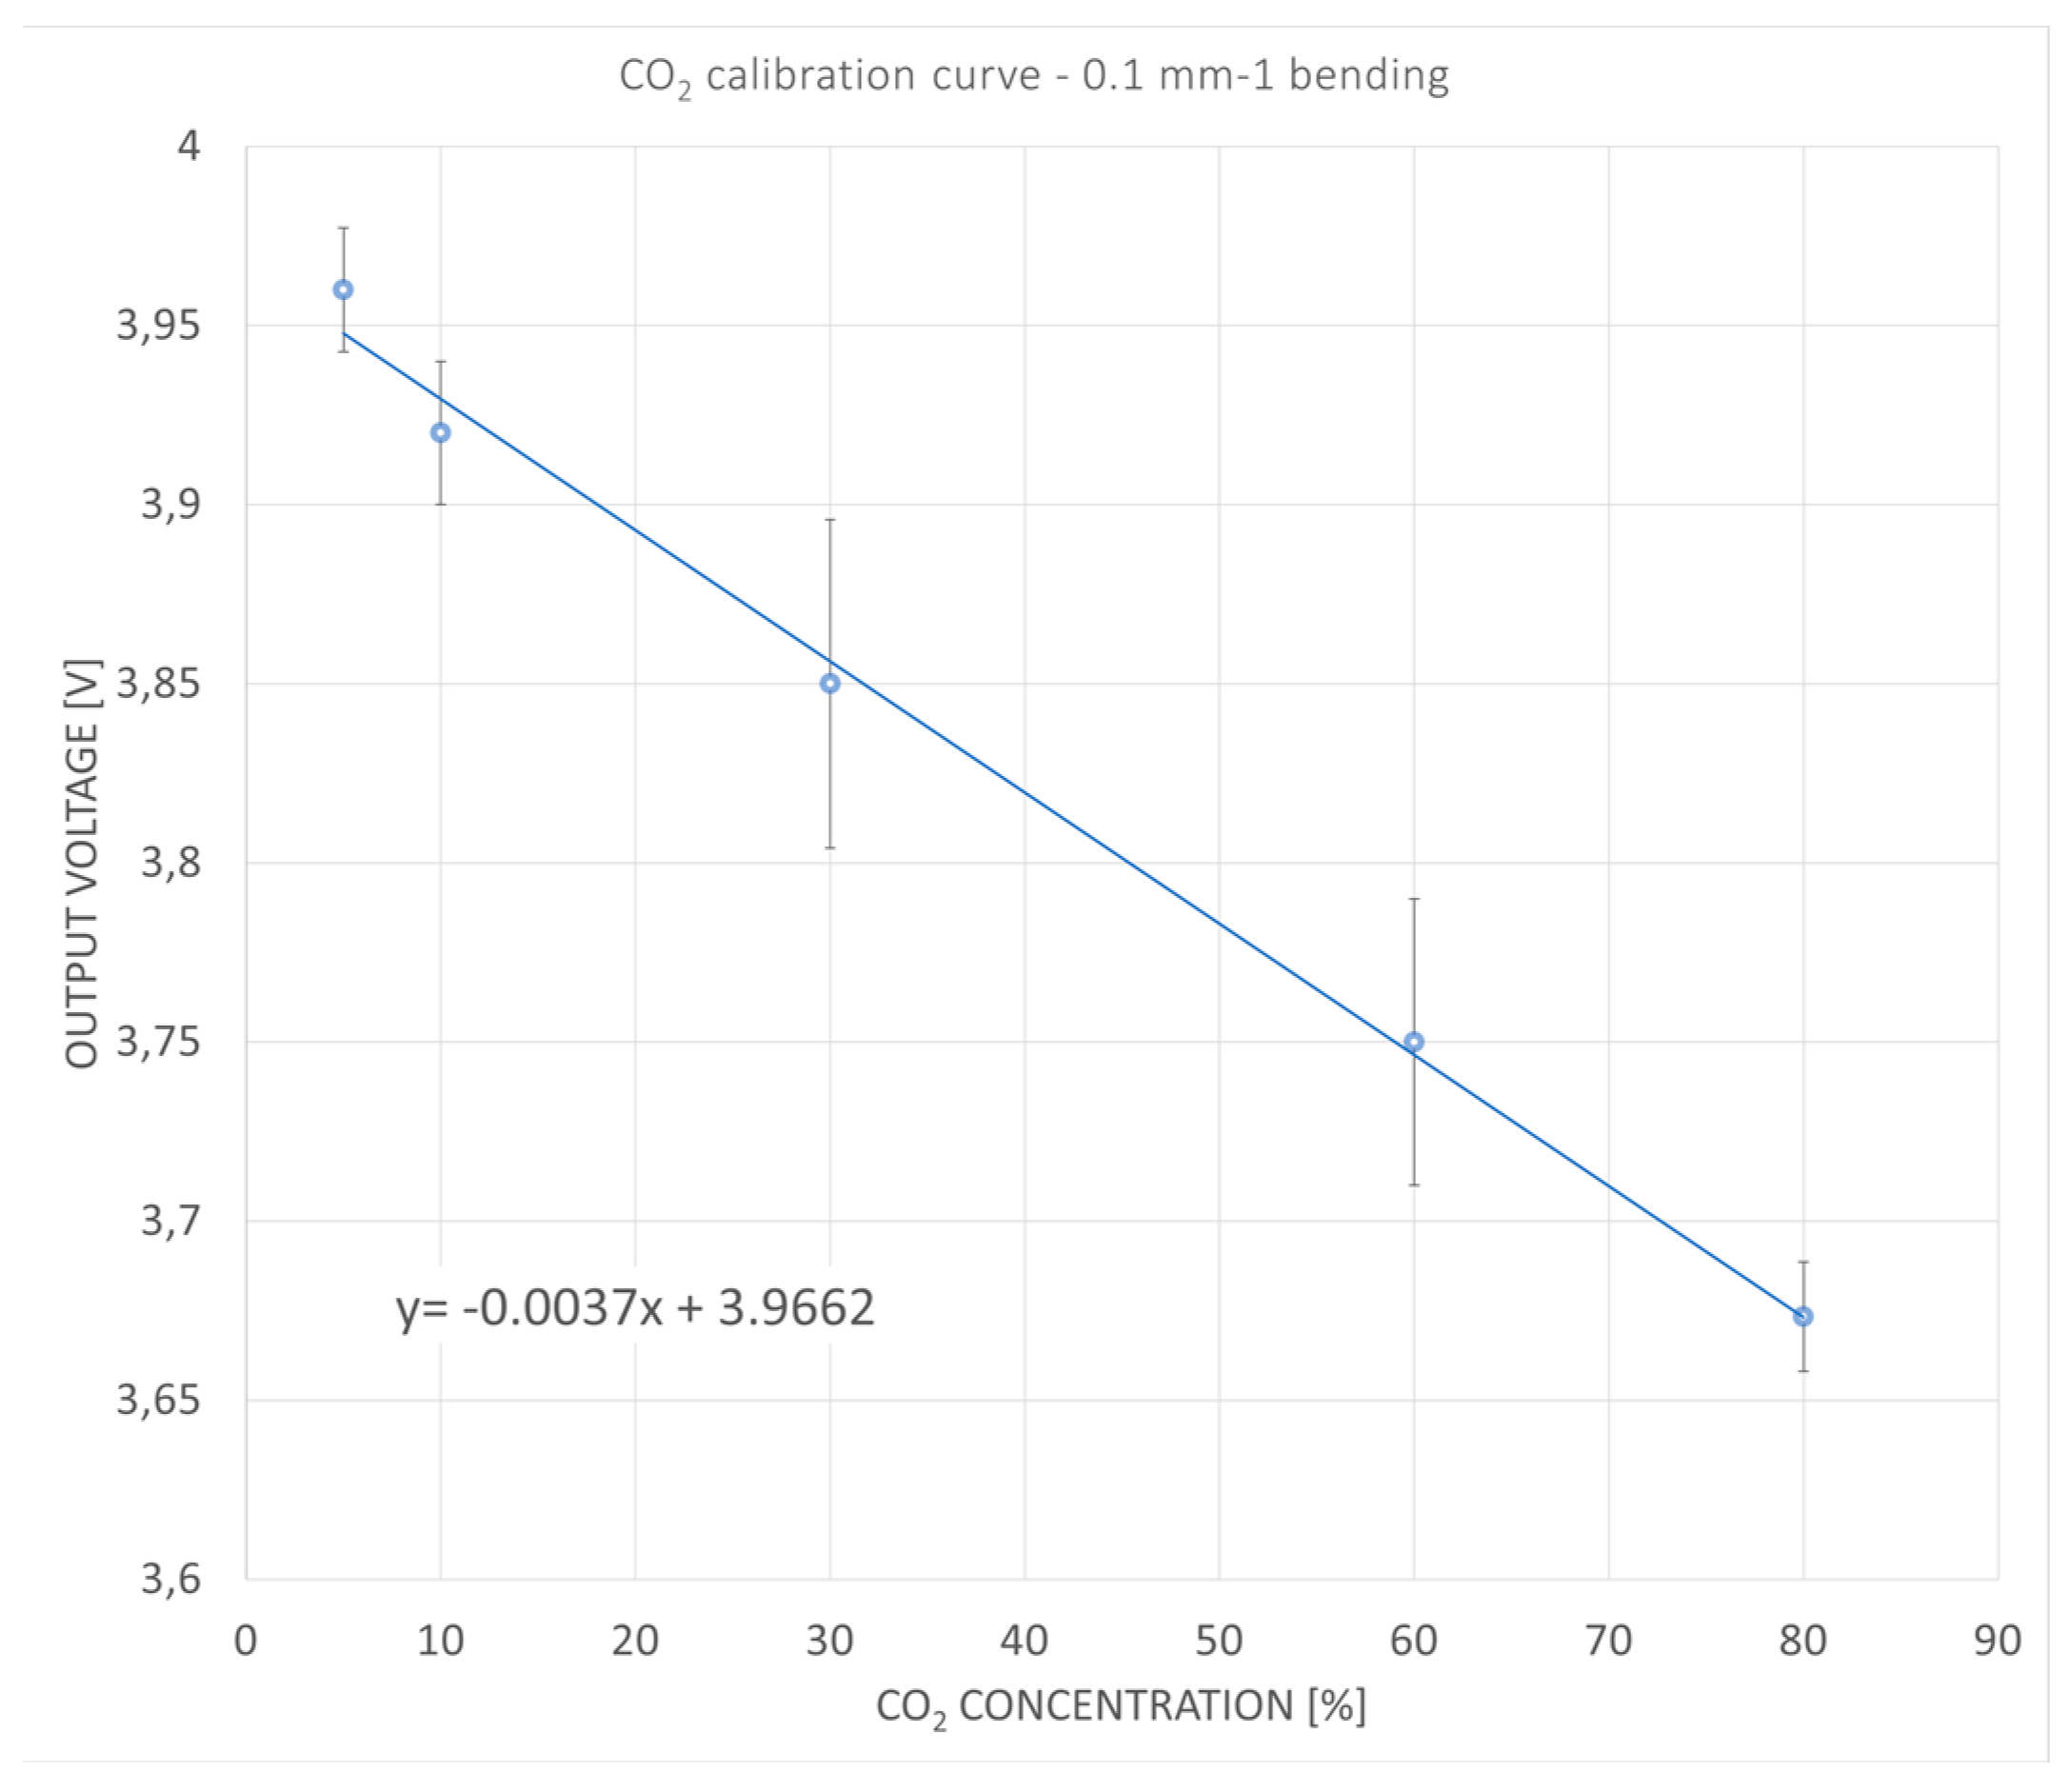
3.1.2. Carbon Dioxide
3.1.3. Carbon Dioxide and Oxygen
3.1.4. Relative Humidity
3.2. Considerations on the Electronic Noise of the Sensor Chain
- R2 = 15 W; ; R2 = 310 K W;
- and the R1 resistor has a voltage thermal noise:
- ResCO2 = 72 uV/3.7 mV/% = 0.019% for R2
- The sensitivity to O2 is 0.7 mV/% with a resolution of:
- ResO2 = 72 uV/0.7 mV/% = 0.10%
3.3. Sensor Performance
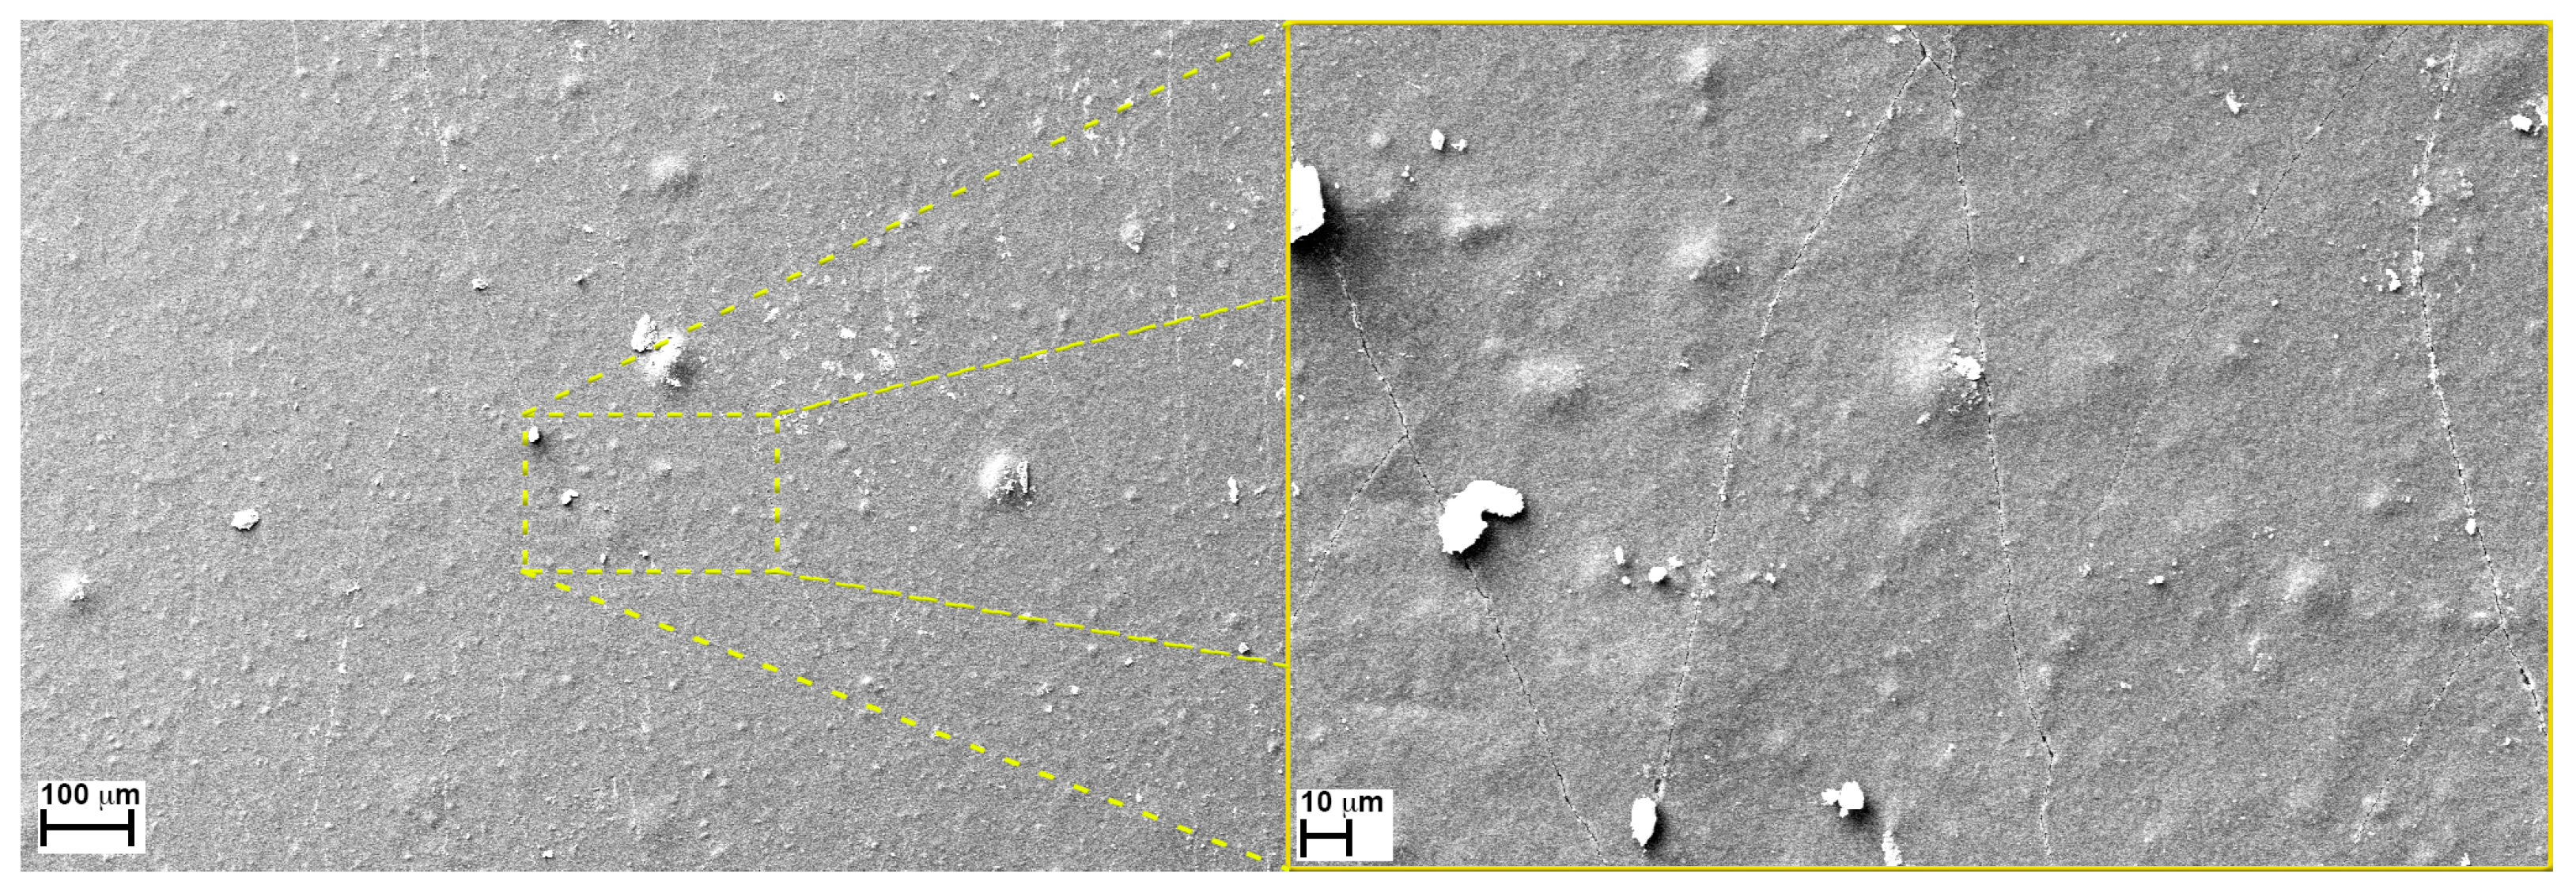
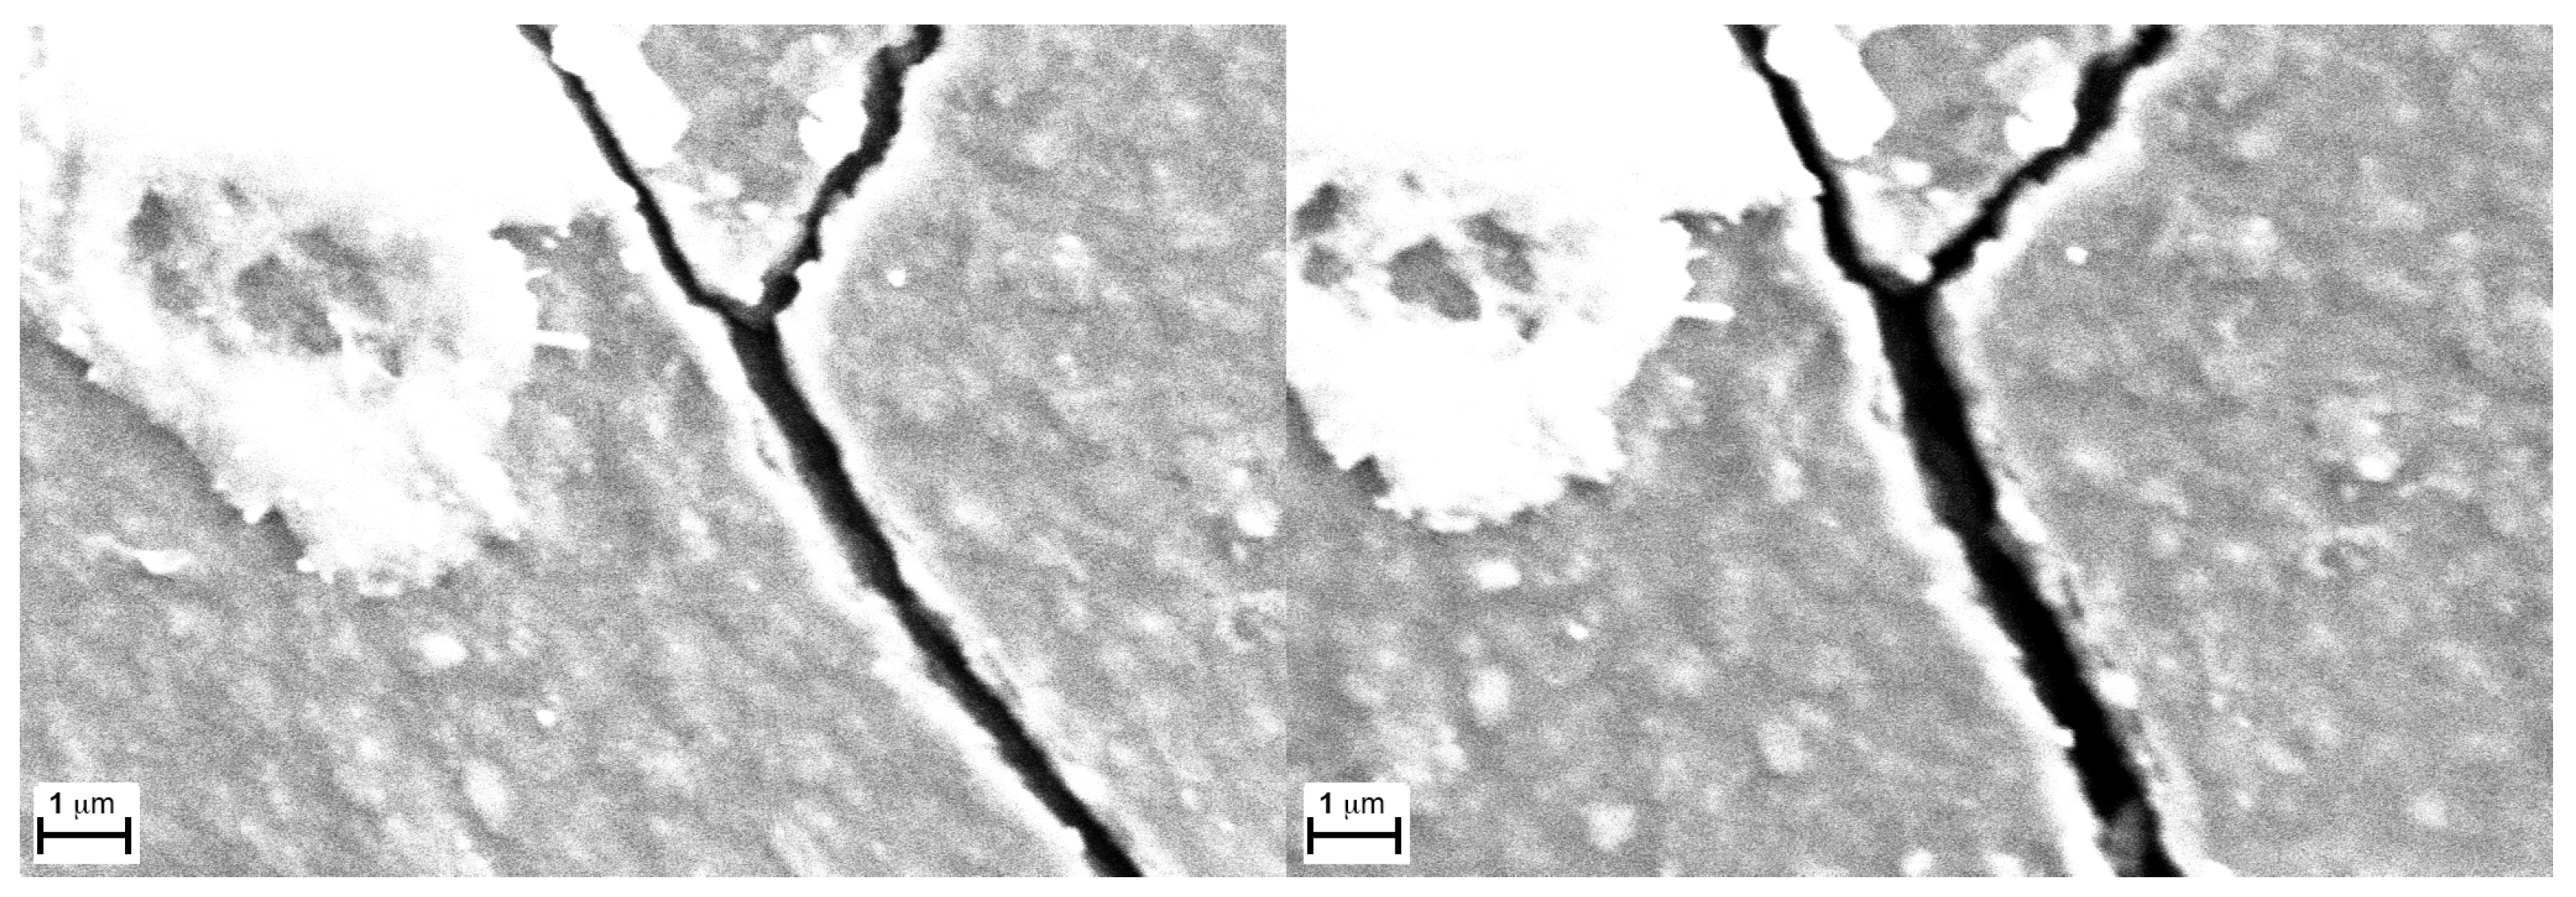
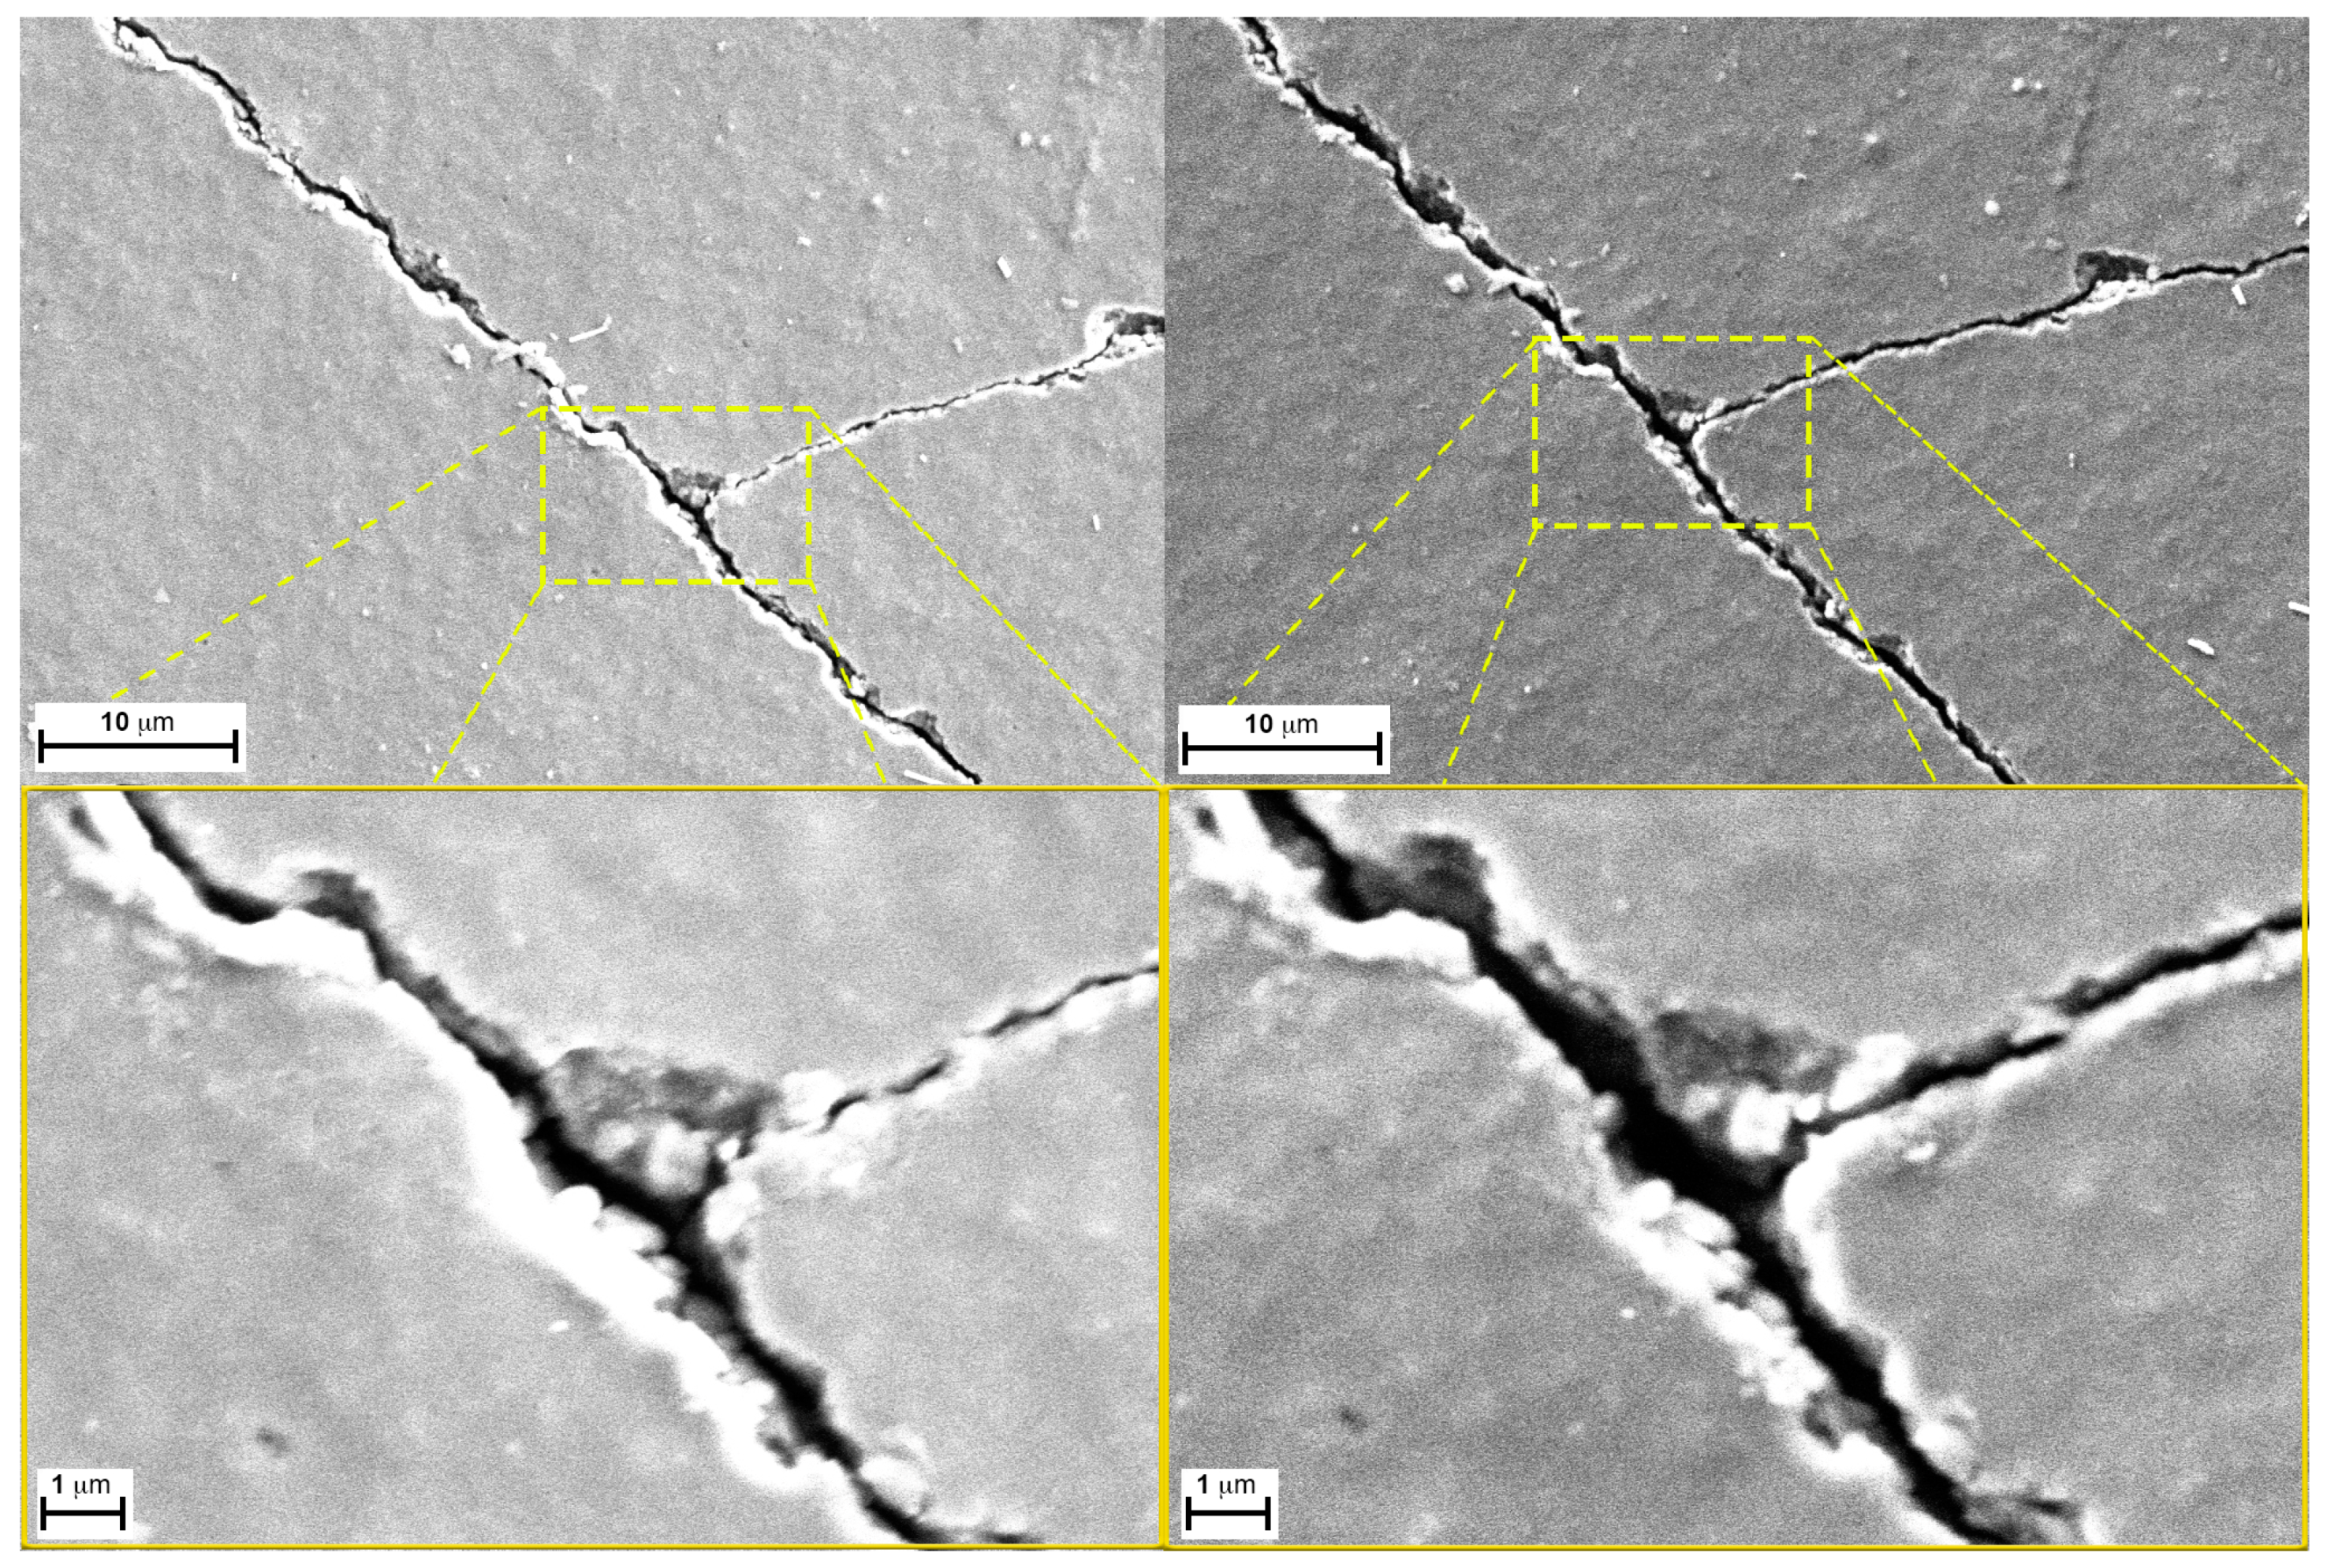
3.4. Morphological Characterization
4. Discussion
5. Conclusions
Author Contributions
Funding
Institutional Review Board Statement
Informed Consent Statement
Data Availability Statement
Conflicts of Interest
References
- Heikenfeld, J.; Jajack, A.; Rogers, J.; Gutruf, P.; Tian, L.; Pan, T.; Li, R.; Khine, M.; Kim, J.; Wang, J. Wearable sensors: Modalities, challenges, and prospects. Lab. Chip 2018, 18, 217–248. [Google Scholar] [CrossRef] [PubMed]
- Ray, T.R.; Choi, J.; Bandodkar, A.J.; Krishnan, S.; Gutruf, P.; Tian, L.; Ghaffari, R.; Rogers, J.A. Bio-Integrated Wearable Systems: A Comprehensive Review. Chem. Rev. 2019, 119, 5461–5533. [Google Scholar] [CrossRef] [PubMed]
- John Dian, F.; Vahidnia, R.; Rahmati, A. Wearables and the Internet of Things (IoT), Applications, Opportunities, and Challenges: A Survey. IEEE Access 2020, 8, 69200–69211. [Google Scholar] [CrossRef]
- Wang, B.; Facchetti, A. Mechanically Flexible Conductors for Stretchable and Wearable E-Skin and E-Textile Devices. Adv. Mater. 2019, 31, e1901408. [Google Scholar] [CrossRef]
- Kim, J.; Campbell, A.S.; de Ávila, B.E.; Wang, J. Wearable biosensors for healthcare monitoring. Nat. Biotechnol. 2019, 37, 389–406. [Google Scholar] [CrossRef]
- Stornelli, V.; Leoni, A.; Ferri, G.; Errico, V.; Ricci, M.; Pallotti, A.; Saggio, G. A Multi-Source Energy Harvesting Sensory Glove Electronic Architecture. In Proceedings of the 2018 3rd International Conference on Smart and Sustainable Technologies (SpliTech), Split, Croatia, 26–29 June 2018. [Google Scholar]
- Li, G.; Wen, D. Wearable biochemical sensors for human health monitoring: Sensing materials and manufacturing technologies. J. Mater. Chem. B 2020, 8, 3423–3436. [Google Scholar] [CrossRef]
- Wang, F.; Liu, S.; Shu, L.; Tao, X.M. Low-dimensional Carbon Based Sensors and Sensing Network for Wearable Health and Environmental Monitoring. Carbon 2017, 121, 353–367. [Google Scholar] [CrossRef]
- Liu, J.; Liu, M.; Bai, Y.; Zhang, J.; Liu, H.; Zhu, W. Recent Progress in Flexible Wearable Sensors for Vital Sign Monitoring. Sensors 2020, 20, 4009. [Google Scholar] [CrossRef]
- Zhang, Q.; Jiang, D.; Xu, C.; Ge, Y.; Liu, X.; Wei, Q.; Huang, L.; Ren, X.; Wang, C.; Wang, Y. Wearable electrochemical biosensor based on molecularly imprinted Ag nanowires for noninvasive monitoring lactate in human sweat. Sens. Actuators B Chem. 2020, 320, 128325. [Google Scholar] [CrossRef]
- Wu, F.; Wu, T.; Yuce, M.R. Design and Implementation of a Wearable Sensor Network System for IoT-Connected Safety and Health Applications. In Proceedings of the 2019 IEEE 5th World Forum on Internet of Things (WF-IoT), Limerick, Ireland, 15–18 April 2019; pp. 87–90. [Google Scholar]
- Ahad, A.; Tahir, M.; Aman Sheikh, M.; Ahmed, K.I.; Mughees, A.; Numani, A. Technologies Trend towards 5G Network for Smart Health-Care Using IoT: A Review. Sensors 2020, 20, 4047. [Google Scholar] [CrossRef]
- Kassal, P.; Steinberg, M.D.; Steinberg, I.M. Wireless chemical sensors and biosensors: A review. Sens. Actuators B Chem. 2018, 266, 228–245. [Google Scholar] [CrossRef]
- Massaroni, C.; Saccomandi, P.; Schena, E. Medical smart textiles based on fiber optic technology: An overview. J. Funct. Biomater. 2015, 6, 204–221. [Google Scholar] [CrossRef] [PubMed]
- Shin, G.; Jarrahi, M.H.; Fei, Y.; Karami, A.; Gafinowitz, N.; Byun, A.; Lu, X. Wearable activity trackers, accuracy, adoption, acceptance and health impact: A systematic literature review. J. Biomed. Inf. 2019, 93, 103153. [Google Scholar] [CrossRef] [PubMed]
- Carnevale, A.; Schena, E.; Formica, D.; Massaroni, C.; Longo, U.G.; Denaro, V. Skin Strain Analysis of the Scapular Region and Wearables Design. Sensors 2021, 21, 5761. [Google Scholar] [CrossRef]
- Pigini, L.; Bovi, G.; Panzarino, C.; Gower, V.; Ferratini, M.; Andreoni, G.; Sassi, R.; Rivolta, M.W.; Ferrarin, M. Pilot Test of a New Personal Health System Integrating Environmental and Wearable Sensors for Telemonitoring and Care of Elderly People at Home (SMARTA Project). Gerontology 2017, 63, 281–286. [Google Scholar] [CrossRef]
- Lapadula, V.; Sabatini, A.; Zompanti, A.; Buscaglione, S.; Lanaro, D.; Merone, M. A Body Hydration Analysis System to improve running performance. In Proceedings of the 2020 IEEE International Workshop on Metrology for Industry 4.0 & IoT, Roma, Italy, 3–5 June 2020; pp. 507–510. [Google Scholar]
- Zompanti, A.; Sabatini, A.; Santonico, M.; Grasso, S.; Gianfelici, A.; Donatucci, B.; Di Castro, A.; Pennazza, G. A Sensor Platform for Athletes’ Training Supervision: A Proof of Concept Study. Sensors 2019, 19, 3948. [Google Scholar] [CrossRef]
- Ahamed, N.U.; Kobsar, D.; Benson, L.; Clermont, C.; Kohrs, R.; Osis, S.T.; Ferber, R. Using wearable sensors to classify subject-specific running biomechanical gait patterns based on changes in environmental weather conditions. PLoS ONE 2018, 13, e0203839. [Google Scholar] [CrossRef]
- L’Hommedieu, M.; L’Hommedieu, J.; Begay, C.; Schenone, A.; Dimitropoulou, L.; Margolin, G.; Falk, T.; Ferrara, E.; Lerman, K.; Narayanan, S. Lessons Learned: Recommendations For Implementing a Longitudinal Study Using Wearable and Environmental Sensors in a Health Care Organization. JMIR Mhealth Uhealth 2019, 7, e13305. [Google Scholar] [CrossRef]
- Cao, Y.; Li, W.; Sepúlveda, N. Performance of Self-Powered, Water-Resistant Bending Sensor Using Transverse Piezoelectric Effect of Polypropylene Ferroelectret Polymer. IEEE Sens. J. 2019, 19, 10327–10335. [Google Scholar] [CrossRef]
- Du, W.; Wang, S.; Chi, H.; Chen, X.; Li, W.; Wan, H.; Hou, D.; Cao, Y. Evaluating head impact intensities and accelerations using flexible wearable sensors for traumatic brain injury assessment. Sens. Actuators A Phys. 2024, 373, 115443. [Google Scholar] [CrossRef]
- Gualandi, I.; Tessarolo, M.; Mariani, F.; Possanzini, L.; Scavetta, E.; Fraboni, B. Textile Chemical Sensors Based on Conductive Polymers for the Analysis of Sweat. Polymers 2021, 13, 894. [Google Scholar] [CrossRef] [PubMed]
- Dube, A.; Gouws, C.; Breukelman, G. Effects of hypohydration and fluid balance in athletes’ cognitive performance: A systematic review. Afr. Health Sci. 2022, 22, 367–376. [Google Scholar] [CrossRef] [PubMed]
- Dolson, C.M.; Harlow, E.R.; Phelan, D.M.; Gabbett, T.J.; Gaal, B.; McMellen, C.; Geletka, B.J.; Calcei, J.G.; Voos, J.E.; Seshadri, D.R. Wearable Sensor Technology to Predict Core Body Temperature: A Systematic Review. Sensors 2022, 22, 7639. [Google Scholar] [CrossRef] [PubMed]
- Güntner, A.T.; Abegg, S.; Königstein, K.; Gerber, P.A.; Schmidt-Trucksäss, A.; Pratsinis, S.E. Breath Sensors for Health Monitoring. ACS Sens. 2019, 4, 268–280. [Google Scholar] [CrossRef] [PubMed]
- Königstein, K.; Abegg, S.; Schorn, A.N.; Weber, I.C.; Derron, N.; Krebs, A.; Gerber, P.A.; Schmidt-Trucksäss, A.; Güntner, A.T. Breath acetone change during aerobic exercise is moderated by cardiorespiratory fitness. J. Breath Res. 2020, 15, 016006. [Google Scholar] [CrossRef]
- Coulby, G.; Clear, A.; Jones, O.; Godfrey, A. A Scoping Review of Technological Approaches to Environmental Monitoring. Int. J. Environ. Res. Public. Health 2020, 17, 3995. [Google Scholar] [CrossRef]
- Saggio, G.; Riillo, F.; Sbernini, L.; Quitadamo, L.R. Resistive flex sensors: A survey. Smart Mater. Struct. 2016, 25, 013001. [Google Scholar] [CrossRef]
- Aygun, L.E.; Kumar, V.; Weaver, C.; Gerber, M.; Wagner, S.; Verma, N.; Glisic, B.; Sturm, J.C. Large-Area Resistive Strain Sensing Sheet for Structural Health Monitoring. Sensors 2020, 20, 1386. [Google Scholar] [CrossRef]
- Iwata, T.; Matsuda, K.; Takahashi, K.; Sawada, K. CO2 Sensing Characteristics of a La2O3/SnO2 Stacked Structure with Micromachined Hotplates. Sensors 2017, 17, 2156. [Google Scholar] [CrossRef]
- Rajesh, N.; Kannan, J.C.; Krishnakumar, T.; Bonavita, A.; Leonardi, S.G.; Neri, G. Microwave irradiated Sn-substituted CdO nanostructures for enhanced CO2 sensing. Ceram. Int. 2015, 41, 14766–14772. [Google Scholar] [CrossRef]
- Herrán, J.; G Mandayo, G.; Castaño, E. Semiconducting BaTiO3-CuO mixed oxide thin films for CO2 detection. Thin Solid Film. 2009, 517, 6192–6197. [Google Scholar] [CrossRef]
- Chapelle, A.; El Younsi, I.; Vitale, S.; Thimont, Y.; Nelis, T.; Presmanes, L.; Barnabé, A.; Tailhades, P. Improved semiconducting CuO/CuFe2O4 nanostructured thin films for CO2 gas sensing. Sens. Actuators B Chem. 2014, 204, 407–413. [Google Scholar] [CrossRef]
- Fleischer, M.; Meixner, H. Oxygen sensing with long-term stable Ga2O3 thin films. Sens. Actuators B Chem. 1991, 5, 115–119. [Google Scholar] [CrossRef]
- Li, Y.; Trinchi, A.; Wlodarski, W.; Galatsis, K.; Kalantar-zadeh, K. Investigation of the oxygen gas sensing performance of Ga2O3 thin films with different dopants. Sens. Actuators B Chem. 2003, 93, 431–434. [Google Scholar] [CrossRef]
- Izu, N.; Shin, W.; Matsubara, I.; Murayama, N. Development of Resistive Oxygen Sensors Based on Cerium Oxide Thick Film. J. Electroceram. 2004, 13, 703–706. [Google Scholar] [CrossRef]

| Bending [mm−1] | 0 | 0.05 | 0.1 |
| Diameter [mm] | 0 | 35 | 20 |
| Resistance [Kohm] | 15 | 90 | 310 |
| Sizes and Material Specifications | |
|---|---|
| Electronics Sizes | |
| Flex PCB | 22 × 16 × 0.1 mm |
| Flex Sensor | 76 × 8 × 0.1 mm |
| uC Module | 38 × 13 × 4 mm |
| Battery | 23 × 14 × 3 mm |
| Flex PCB Materials | |
| Substrate | Polyimide (Panasonic Felios Polyimide) |
| Board Thickness | 4 mil (0.1016 mm) |
| Dielectric | 3.2 at 1 MHz |
| Tensile Modulus | 7.1 GPa |
| Copper Layers | 2 |
| Copper Weight | 1 oz |
| Trace Spacing | 6 mil (0.1524 mm) |
| Trace Width | 6 mil (0.1524 mm) |
| Power Specification | |||
|---|---|---|---|
| uC Power Consumption | |||
| ESP32-PICO-D4 | |||
| Mode | Description | Current Consumption | Power Consumption |
| Active (RF Working) | Transmit BT/BLE | 95–100 mA | 0.33 W |
| Receive BT/BLE | |||
| Modem Sleep | Normal Speed: 80 Mhz | 20–31 mA | 0.1 W |
| (Dual-core chip) | |||
| Sleep Mode | - | 0.8 mA | 2.7 mW |
| OP484FSZ | |||
| Spec | Value | ||
| Supply Voltage | 3.3 V | ||
| Supply Current | 5.4 mA (1.35 × 4) | ||
| Power Consumption | 18 mW | ||
| MCP3221A5T | |||
| Spec | Value | ||
| Supply Voltage | 3.3 V | ||
| Conversion Current | 250 uA | ||
| Standby Current | 1 uA | ||
| Active Bus Current | 120 uA | ||
| Power Consumption (Worst Case) | 0.8 mW | ||
| Bending: | 0 mm−1 | 0.05 mm−1 | 0.1 mm−1 | |
|---|---|---|---|---|
| Target Gas: | ||||
| O2 | Response | Linear | ||
| Sensitivity | 0.7 mV/% | |||
| Range | 20–70% | |||
| RH | Response | Not linear | Linear | Linear |
| Sensitivity | 50 mV/% | 35 mV/% | 33 mV/% | |
| Range | <80% | Full range | Full range | |
| CO2 | Response | Linear | ||
| Sensitivity | 3.7 mV/% | |||
| Range | 4–80% | |||
 | ||||
| Reference | Material | Target | Morphology | CO2 Concentration (ppm) | Operating Temperature (°C) | Resistance Change (%) |
|---|---|---|---|---|---|---|
| This work | Carbon/Polymer based ink | CO2 | Thick Film | 50,000 | 25 | 6 |
| O2 | 200,000 | 12 | ||||
| [32] | La2O3/SnO2 | CO2 | Thick Film | 1000 | 400 | 190 |
| [33] | Sn@CdO | CO2 | Thick Film | 50,000 | 250 | 45 |
| [34] | Ag@CuO/BaTiO3 | CO2 | Thin Film | 5000 | 300 | 32 |
| [35] | CuO/CuFe2O4 | CO2 | Thin Film | 5000 | 250 | 40 |
| [36] | Ga2O3 | O2 | Thin Film | 200,000 | 1000 | 30 |
| [37] | Ce doped Ga2O3 | O2 | Thin Film | 10,000 | 460 | 700 |
| [38] | Cerium Oxide | O2 | Thick Film | 400,000 | 900 | 13 |
Disclaimer/Publisher’s Note: The statements, opinions and data contained in all publications are solely those of the individual author(s) and contributor(s) and not of MDPI and/or the editor(s). MDPI and/or the editor(s) disclaim responsibility for any injury to people or property resulting from any ideas, methods, instructions or products referred to in the content. |
© 2024 by the authors. Licensee MDPI, Basel, Switzerland. This article is an open access article distributed under the terms and conditions of the Creative Commons Attribution (CC BY) license (https://creativecommons.org/licenses/by/4.0/).
Share and Cite
Zompanti, A.; Basoli, F.; Saggio, G.; Mattioli, F.; Sabatini, A.; Grasso, S.; Marino, M.; Longo, U.G.; Trombetta, M.; Santonico, M. Design, Calibration and Morphological Characterization of a Flexible Sensor with Adjustable Chemical Sensitivity and Possible Applications to Sports Medicine. Sensors 2024, 24, 6182. https://doi.org/10.3390/s24196182
Zompanti A, Basoli F, Saggio G, Mattioli F, Sabatini A, Grasso S, Marino M, Longo UG, Trombetta M, Santonico M. Design, Calibration and Morphological Characterization of a Flexible Sensor with Adjustable Chemical Sensitivity and Possible Applications to Sports Medicine. Sensors. 2024; 24(19):6182. https://doi.org/10.3390/s24196182
Chicago/Turabian StyleZompanti, Alessandro, Francesco Basoli, Giovanni Saggio, Francesco Mattioli, Anna Sabatini, Simone Grasso, Martina Marino, Umile Giuseppe Longo, Marcella Trombetta, and Marco Santonico. 2024. "Design, Calibration and Morphological Characterization of a Flexible Sensor with Adjustable Chemical Sensitivity and Possible Applications to Sports Medicine" Sensors 24, no. 19: 6182. https://doi.org/10.3390/s24196182