Anti-Human Rhinoviral Activity of Polybromocatechol Compounds Isolated from the Rhodophyta, Neorhodomela aculeata

Abstract
:1. Introduction
2. Results and Discussion
2.1. Antiviral Activity of N. aculeata Extracts and Fractions

| Test material | HRV2 (Type B) | HRV3 (Type A) | |||
| CC50a | IC50b | TI c | IC50b | TI c | |
| Methanolic extract | >20 | 17.58 ± 0.59 | 1.14 | 18.27 ± 2.22 | 1.09 |
| HSF | >20 | ND d | - | ND d | - |
| ESF | >20 | 15.50 ± 4.17 | 1.29 | 16.50 ± 4.17 | 1.21 |
| BSF | >20 | ND d | - | ND d | - |
| WSF | >20 | 16.50 ± 2.76 | 1.21 | ND d | - |

| Test material | HRV2 | HRV3 | ||||
| CC50a | IC50b | TI c | CC50a | IC50b | TI c | |
| F1 | >20 | 11.38 ± 3.01 | 1.76 | >20 | ND d | - |
| F2 | >20 | 8.36 ± 2.42 | 2.39 | >20 | ND d | - |
| F3 | 22.93 | ND d | - | 25.80 | 7.69 ± 0.45 | 2.60 |
| F4 | >20 | 18.55 ± 0.51 | 1.08 | >20 | 18.52 ± 0.49 | 1.08 |
| F5 | 24.29 | ND d | - | 18.98 | ND d | - |
| F6 | >20 | ND d | - | >20 | ND d | - |
| F7 | >20 | 10.69 ± 1.34 | 1.87 | >20 | ND d | - |
| Ribavirin | >20 | 17.14 ± 1.48 | 1.17 | >20 | 14.25 ± 2.20 | 1.40 |

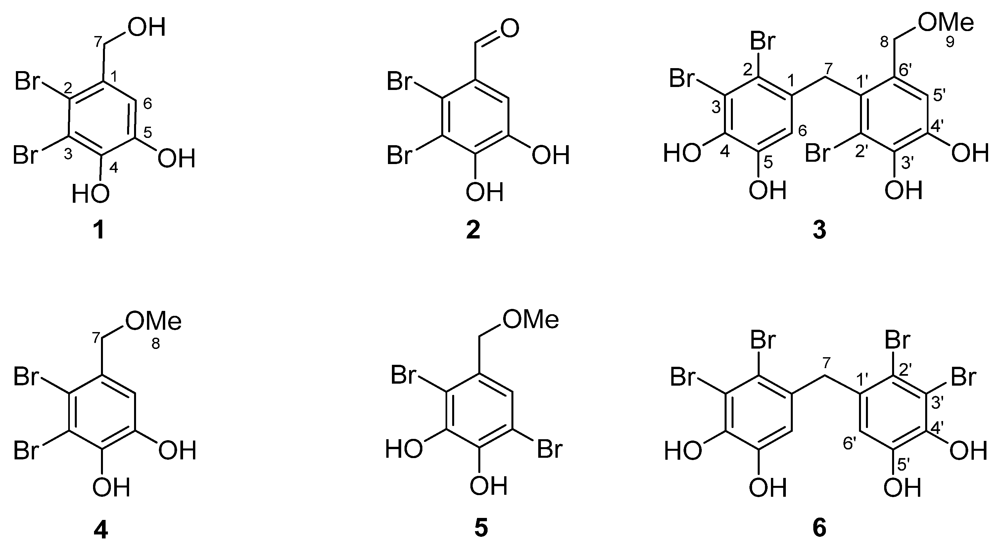
| No. | 1 | 2 | 3 | 4 | 5 | 6 | ||||||||||||
|---|---|---|---|---|---|---|---|---|---|---|---|---|---|---|---|---|---|---|
| δH | δC | δH | δC | δH | δC | δH | δC | δH | δC | δH | δC | |||||||
| 1 | 134.1 | 144.4 | 131.5 | 131.6 | 129.1 | 132.0 | ||||||||||||
| 2 | 112.6 | 127.4 | 115.4 | 114.8 | 112.0 | 116.4 | ||||||||||||
| 3 | 112.4 | 120.7 | 112.8 | 114.4 | 144.9 | 113.6 | ||||||||||||
| 4 | 143.1 | 157.0 | 8.73 (s, 1H, OH) | 142.6 | 143.7 | 152.2 | 143.8 | |||||||||||
| 5 | 144.8 | 150.3 | 8.08 (s, 1H, OH) | 144.0 | 144.9 | 109.3 | 145.4 | |||||||||||
| 6 | 7.20 (s, 1H) | 113.7 | 7.41 (s, 1H) | 113.1 | 6.08 (s, 1H) | 114.0 | 7.07 (s, 1H) | 114.8 | 6.71 (s, 1H) | 111.9 | 6.58 (s, 1H) | 116.5 | ||||||
| 7 | 4.62 (s, 2H) | 64.2 | 10.22 (s, 1H) | 190.4 | 4.12 (s, 2H) | 38.4 | 4.41 (s, 2H) | 75.0 | 4.43 (s, 2H) | 75.2 | 4.04 (s, 2H) | 44.5 | ||||||
| 8 | 4.21 (s, 2H) | 72.3 | 3.39 (s, 3H) | 58.4 | 3.34 (s, 3H) | 57.9 | ||||||||||||
| 9 | 3.24 (s, 3H) | 57.9 | ||||||||||||||||
| 1′ | 128.6 | 132.0 | ||||||||||||||||
| 2′ | 114.0 | 116.4 | ||||||||||||||||
| 3′ | 8.71 (s, 1H, OH) | 142.6 | 113.6 | |||||||||||||||
| 4′ | 8.17 (s, 1H, OH) | 144.5 | 143.8 | |||||||||||||||
| 5′ | 7.00 (s, 1H) | 115.4 | 145.4 | |||||||||||||||
| 6′ | 129.8 | 6.58 (s, 1H) | 116.5 |
| Test material | HRV2 | HRV3 | |||
| CC50a | IC50b | TI c | IC50b | TI c | |
| Compound 1 | >20 | 2.50 ± 0.66 | 8.00 | ND d | - |
| Compound 3 | >20 | 7.11 ± 0.64 | 2.81 | 4.69 ± 0.44 | 4.26 |
| Ribavirin | >20 | 2.15 ± 0.51 | 9.30 | 5.09 ± 0.60 | 3.93 |
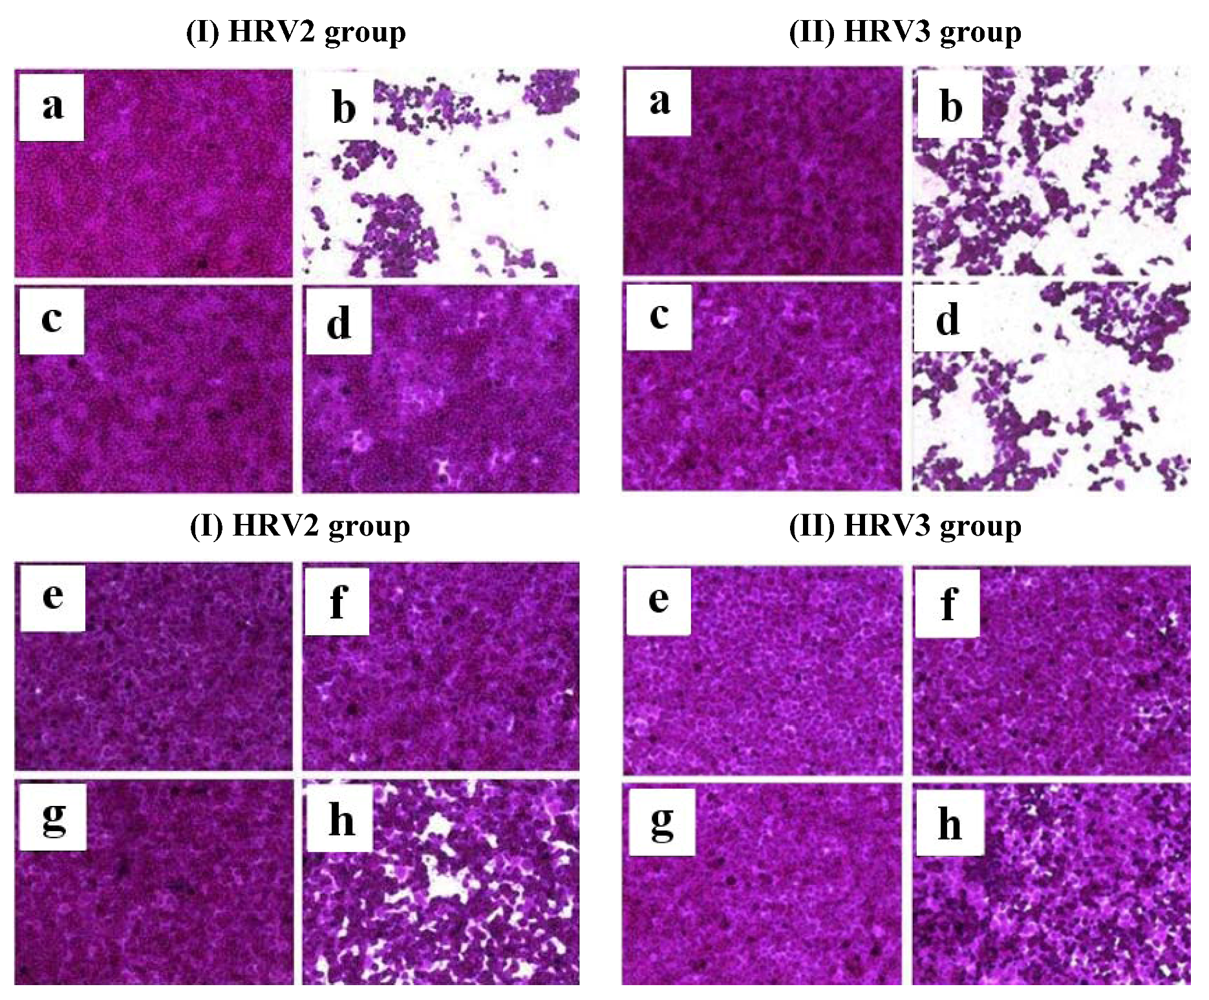
2.2. Antiviral Activity and Cytotoxicity of Compound 1 and Compound 3 against HRV2 and HRV3

3. Experimental Section
3.1. General Experimental Procedures; Instruments and Reagents
3.2. Alga Material
3.3. Extraction and Isolation
3.4. Viruses, Cells and Reagents
3.5. Assays of Antiviral Activity and Cytotoxicity

4. Conclusions
Acknowledgments
References
- Lee, Y.; Kang, S. A Catalogue of the Seaweeds in Korea, 1st ed; Jeju National University: Jeju, Korea, 2002; p. 662. [Google Scholar]
- Wijesekara, I.; Pangestuti, R.; Kim, S.K. Biological activities and potential health benefits sulfated polysaccharides derived from marine algae. Carbohydr. Polym. 2011, 84, 14–21. [Google Scholar] [CrossRef]
- Guven, K.C.; Percot, A.; Sezik, E. Alkaloids in marine algae. Mar. Drugs 2010, 8, 269–284. [Google Scholar] [CrossRef]
- El Gamal, A.A. Biological importance of marine algae. Saudi Pharm. J. 2010, 18, 1–25. [Google Scholar] [CrossRef]
- Lee, J.W.; Oh, B.G.; Lee, H.B. Marine benthic algal community at Padori, west coast of Korea. Algae 2000, 15, 111–117. [Google Scholar]
- Liu, M.; Hansen, P.E.; Lin, X. Bromophenols in marine algae and their bioactivities. Mar. Drugs 2011, 9, 1273–1292. [Google Scholar] [CrossRef]
- Han, L.J.; Xu, N.J.; Shi, J.G.; Yan, X.J.; Zeng, C.K. Isolation and pharmacological activities of bromophenols from Rhodomela confervoides. Chin. J. Oceanol. Limnol. 2005, 23, 226–229. [Google Scholar] [CrossRef]
- Lee, H.S.; Lee, T.H.; Lee, J.H.; Chae, C.S.; Chung, S.C.; Shin, D.S.; Shin, J.; Oh, K.B. Inhibition of the pathogenicity of magnaporthegrisea by bromophenols, isocitratelyase inhibitors, from the red alga Odonthalia corymbifer. J. Agric. Food Chem. 2007, 55, 6923–6928. [Google Scholar] [CrossRef]
- Shoeib, N.A.; Bibby, M.C.; Blunden, G.; Linley, P.A.; Swaine, D.J.; Wheelhouse, R.T.; Wright, C.W. In-vitro cytotoxic activities of the major bromophenols of the red alga Polysiphonia Lanosa and some novel synthetic isomers. J. Nat. Prod. 2004, 67, 1445–1449. [Google Scholar] [CrossRef]
- Lim, C.S.; Jin, D.Q.; Sung, J.Y.; Lee, J.H.; Choi, H.G.; Ha, I.; Han, J.S. Antioxidant and anti-inflammatory activities of the methanolic extract of Neorhodomela aculeate in hippocampal and microglial cells. Biol. Pharm. Bull. 2006, 29, 1212–1216. [Google Scholar] [CrossRef]
- Makela, M.J.; Puhakka, T.; Ruuskanen, O.; Leinonen, M.; Saikku, P.; Kimpimaki, M.; Blomqvist, S.; Hyypia, T.; Arstila, P. Viruses and bacteria in the etiology of the common cold. J. Clin. Microbiol. 1998, 36, 539–542. [Google Scholar]
- Elkhatieb, A.; Hipskind, G.; Woerner, D.; Hayden, F.G. Middle ear abnormalities during natural rhinovirus colds in adults. J. Infect. Dis. 1993, 168, 618–621. [Google Scholar] [CrossRef]
- Pitkaranta, A.; Arruda, E.; Malmberg, H.; Hayden, F.G. Detection of rhinovirus in sinus brushings of patients with acute community-acquired sinusitis by reverse transcription-PCR. J. Clin. Microbiol. 1997, 35, 1791–1793. [Google Scholar]
- Ledford, R.M.; Collett, M.S.; Pevear, D.C. Insights into the genetic basis for natural phenotypic resistance of human rhinoviruses to pleconaril. Antivir. Res. 2005, 68, 135–138. [Google Scholar]
- Al-Nakib, W.; Tyrrell, D.A.J. Drugs against rhinoviruses. J. Antimicrob. Chemother. 1992, 30, 115–117. [Google Scholar] [CrossRef]
- Andries, K.; Dewindt, B.; Snoeks, J.; Wouters, L.; Moereels, H.; Lewi, P.J.; Janssen, P.A.J. Two groups of rhinoviruses revealed by a panel of antiviral compounds present sequence divergence and differential pathogenicity. J. Virol. 1990, 64, 1117–1123. [Google Scholar]
- Choi, H.J.; Kim, J.H.; Lee, C.H.; Ahn, Y.J.; Song, J.H.; Baek, S.H.; Kwon, D.H. Antiviral activity of quercetin 7-rhamnoside against porcine epidemic diarrhea virus. Antivir. Res. 2009, 81, 77–81. [Google Scholar]
- Weinstein, B.; Rold, T.L.; Harrell, C.E., Jr.; Burns, M.W., III; Waaland, J.R. Reexamination of the bromophenols in the red alga Rhodomela Larix. Phytochem. 1975, 14, 2667–2670. [Google Scholar]
- Kurata, K.; Amiya, T. Tow new bromophenols from the red alga, Rhodomela larix. Chem. Lett. 1977, 12, 1435–1438. [Google Scholar] [CrossRef]
- Katsui, N.; Suzuki, Y.; Kitamura, S.; Irie, T. 5,6-Dibromoprotocatechualdehyde and 2,3-dibromo-4,5-dihydroxybenzyl methyl ether: New dibromophenols from Rhodomela larix. Tetrahedron 1967, 23, 1185–1188. [Google Scholar] [CrossRef]
- Samples Availability: Available from the authors.
© 2012 by the authors; licensee MDPI, Basel, Switzerland. This article is an open-access article distributed under the terms and conditions of the Creative Commons Attribution license (http://creativecommons.org/licenses/by/3.0/).
Share and Cite
Park, S.-H.; Song, J.-H.; Kim, T.; Shin, W.-S.; Park, G.M.; Lee, S.; Kim, Y.-J.; Choi, P.; Kim, H.; Kim, H.-S.; et al. Anti-Human Rhinoviral Activity of Polybromocatechol Compounds Isolated from the Rhodophyta, Neorhodomela aculeata. Mar. Drugs 2012, 10, 2222-2233. https://doi.org/10.3390/md10102222
Park S-H, Song J-H, Kim T, Shin W-S, Park GM, Lee S, Kim Y-J, Choi P, Kim H, Kim H-S, et al. Anti-Human Rhinoviral Activity of Polybromocatechol Compounds Isolated from the Rhodophyta, Neorhodomela aculeata. Marine Drugs. 2012; 10(10):2222-2233. https://doi.org/10.3390/md10102222
Chicago/Turabian StylePark, Soon-Hye, Jae-Hyoung Song, Taejung Kim, Woon-Seob Shin, Gab Man Park, Seokjoon Lee, Young-Joo Kim, Pilju Choi, Heejin Kim, Hui-Seong Kim, and et al. 2012. "Anti-Human Rhinoviral Activity of Polybromocatechol Compounds Isolated from the Rhodophyta, Neorhodomela aculeata" Marine Drugs 10, no. 10: 2222-2233. https://doi.org/10.3390/md10102222