Association between γ-Glutamyl Transferase and Metabolic Syndrome: A Cross-Sectional Study of an Adult Population in Beijing


Abstract
:1. Introduction
2. Methods
2.1.Study Population
2.2. Measurements
2.3. Definition of MetS
- Obesity: BMI ≥ 28 kg/m²;
- Elevated TG (drug treatment for elevated TG is an alternate indicator) ≥ 150 mg/dL (1.7 mmol/L);
- Reduced HDL-C (drug treatment for reduced HDL-C is an alternate indicator) < 40 mg/dL (1.0 mmol/L) in males, <50 mg/dL (1.3 mmol/L) in females;
- Elevated BP (anti-hypertensive drug treatment in a patient with a history of hypertension is an alternate indicator) systolic ≥ 130 mm Hg and/or diastolic ≥ 85 mm Hg; and,
- Elevated FPG (drug treatment of elevated glucose is an alternate indicator) ≥ 100 mg/dL.
2.4. Data Analysis
3. Results
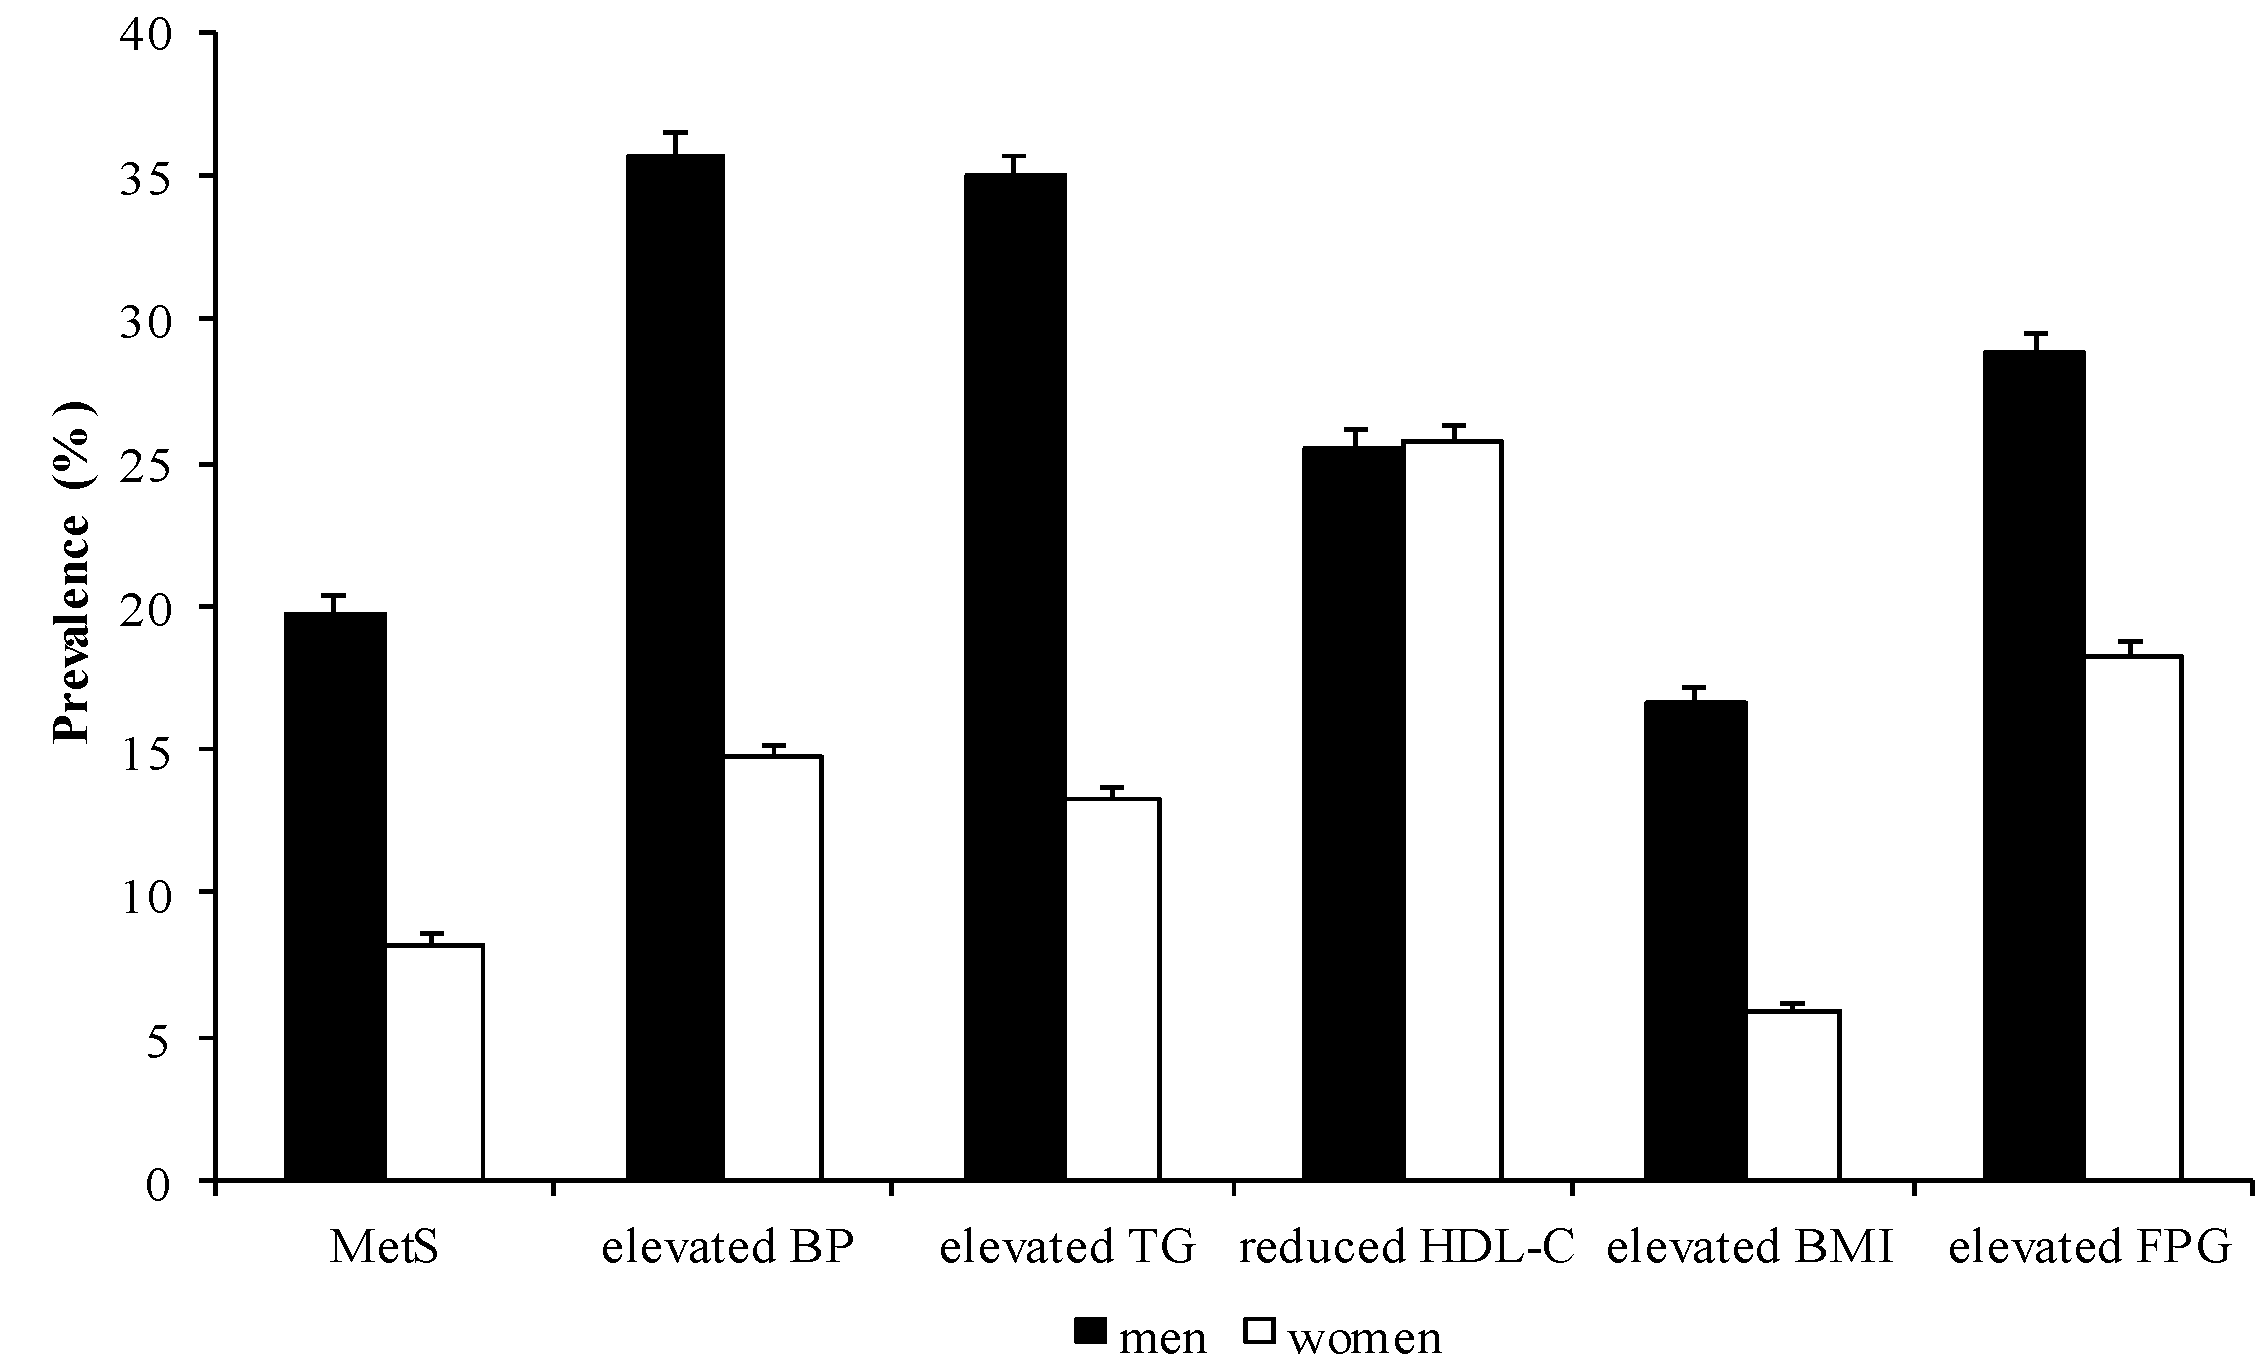
3.1. Prevalence of MetS and its Components
3.2. Basic Characteristics and Hematological Parameters

| Sex | Total | MetS | Elevated BP | Elevated TG | Reduced HDL-C | Elevated BMI | Elevated FPG | ||||||
|---|---|---|---|---|---|---|---|---|---|---|---|---|---|
| n | % | n | % | n | % | n | % | n | % | n | % | ||
| Men | 4,764 | 941 | 19.75 | 1,702 | 35.73 | 1,666 | 34.97 | 1,214 | 25.48 | 794 | 16.67 | 1,371 | 28.78 |
| Women | 5,789 | 476 | 8.22 | 849 | 14.67 | 769 | 13.28 | 1,488 | 25.70 | 342 | 5.91 | 1,059 | 18.29 |
| Total | 10,553 | 1,417 | 13.43 | 2,551 | 24.17 | 2,435 | 23.07 | 2,702 | 25.60 | 1,136 | 10.76 | 2,430 | 23.03 |

| Variables | Men | p Value | Women | p Value | ||
|---|---|---|---|---|---|---|
| MetS | non-MetS | MetS | non-MetS | |||
| N | 941 | 3,823 | - | 476 | 5,313 | - |
| Age (year) | 44 (35–53) | 38 (31–49) | <0.0001 a | 50 (43–57) | 40 (30–49) | <0.0001 a |
| SBP (mmHg) | 130 ± 15 | 118 ± 14 | <0.0001 b | 128 ± 17 | 111 ± 13 | <0.0001 b |
| DBP (mmHg) | 84 ± 10 | 75 ± 10 | <0.0001 b | 81 ± 10 | 70 ± 9 | <0.0001 b |
| HDL-C (mmol/L) | 0.97 ± 0.22 | 1.26 ± 0.29 | <0.0001 b | 1.13 ± 0.21 | 1.58 ± 0.34 | <0.0001 b |
| TG (mmol/L) | 2.97 ± 2.21 | 1.46 ± 1.18 | <0.0001 b | 2.34 ± 1.26 | 0.96 ± 0.60 | <0.0001 b |
| FPG (mmol/L) | 6.34 ± 1.79 | 5.36 ± 1.04 | <0.0001 b | 6.40 ± 1.81 | 5.17 ± 0.74 | <0.0001 b |
| BMI (kg/m2) | 28.21 ± 3.25 | 24.39 ± 4.02 | <0.0001 b | 27.41 ± 3.71 | 22.05 ± 2.93 | <0.0001 b |
| GGT (U/L) | 52.09 ± 31.74 | 34.01 ± 22.97 | <0.0001 b | 33.53 ± 23.17 | 19.92 ± 13.51 | <0.0001 b |
| ALT (U/L) | 45.58 ± 32.17 | 30.95 ± 30.22 | <0.0001 b | 31.84 ± 19.28 | 20.38 ± 19.59 | <0.0001 b |
| AST (U/L) | 37.50 ± 14.52 | 31.05 ± 19.26 | <0.0001 b | 34.64 ± 13.25 | 27.54 ± 11.98 | <0.0001 b |
| ALP (U/L) | 65.68 ± 15.87 | 62.35 ± 15.10 | <0.0001 b | 65.18 ± 18.31 | 53.43 ± 16.19 | <0.0001 b |
| History of alcoholic fatty liver, n (%) | 27 (2.87) | 41 (1.07) | <0.0001 c | 8 (1.68) | 11 (0.21) | <0.0001 c |
| Anti-hypertensive drugs, n (%) | 256 (27.21) | 346 (9.05) | <0.0001 c | 174 (36.55) | 337 (6.34) | <0.0001 c |
| Anti-dyslipidemic drugs, n (%) | 205 (21.79) | 206 (5.39) | <0.0001 c | 90 (18.91) | 272 (5.12) | <0.0001 c |
| Anti-diabetic drugs, n (%) | 80 (8.50) | 93 (2.56) | <0.0001 c | 49 (10.29) | 92 (1.73) | <0.0001 c |
3.3. Association between Liver Enzymes and MetS, as well as its Components
| Q1 | Q2 | Q3 | Q4 | |
|---|---|---|---|---|
| Men | ||||
| GGT (U/L) | ≤20 | 21–29 | 30–43 | ≥44 |
| Cases/subjects at risk | 64/1,178 | 151/1,213 | 261/1,167 | 465/1,206 |
| OR (95% CI: lower–upper) | 1.00 | 1.40 (1.09–1.96) | 2.09 (1.50–2.91) | 3.50 (2.50–4.91) |
| ALT (U/L) | ≤19 | 20–27 | 28–38 | ≥39 |
| Cases/subjects at risk | 98/1,191 | 176/1,201 | 242/1,188 | 425/1,184 |
| OR (95% CI: lower–upper) | 1.00 | 1.23 (0.90–1.66) | 1.43 (1.05–1.95) | 1.81 (1.28–2.55) |
| AST (U/L) | ≤24 | 25–30 | 31–36 | ≥37 |
| Cases/subjects at risk | 129/1,214 | 188/1,294 | 222/1,145 | 402/1,111 |
| OR (95% CI: lower–upper) | 1.00 | 1.09 (0.82–1.45) | 1.07 (0.80–1.43) | 1.62 (1.19–2.20) |
| ALP (U/L) | ≤52 | 53–61 | 62–71 | ≥72 |
| Cases/subjects at risk | 198/1,288 | 217/1,106 | 244/1,202 | 282/1,168 |
| OR (95% CI: lower–upper) | 1.00 | 1.24 (0.96–1.61) | 1.29 (0.99–1.66) | 1.48 (1.16–1.90) |
| Women | ||||
| GGT (U/L) | ≤13 | 14–17 | 18–22 | ≥23 |
| Cases/subjects at risk | 22/1,843 | 44/1,386 | 100/1,151 | 310/1,409 |
| OR (95% CI: lower–upper) | 1.00 | 1.80 (1.04–3.10) | 3.49 (2.11–5.78) | 5.61 (3.41–9.23) |
| ALT (U/L) | ≤13 | 14–18 | 19–23 | ≥24 |
| Cases/subjects at risk | 27/1,480 | 64/1,624 | 98/1,248 | 287/1,437 |
| OR (95% CI: lower–upper) | 1.00 | 1.30 (0.79–2.13) | 1.44 (0.88–2.35) | 1.95 (1.19–3.21) |
| AST (U/L) | ≤22 | 23–26 | 27–31 | ≥32 |
| Cases/subjects at risk | 36/1,451 | 80/1,494 | 110/1,434 | 250/1,410 |
| OR (95% CI: lower–upper) | 1.00 | 1.62 (1.04–2.54) | 1.33 (0.85–2.07) | 2.01 (1.29–3.15) |
| ALP (U/L) | ≤42 | 43–51 | 52–63 | ≥64 |
| Cases/subjects at risk | 43/1,556 | 66/1,352 | 141/1,519 | 226/1,362 |
| Q1 | Q2 | Q3 | Q4 | |
|---|---|---|---|---|
| Men | ||||
| GGT (U/L) | ≤20 | 21–29 | 30–43 | ≥44 |
| n (%) | 272/1,178 | 374/1,213 | 453/1,167 | 603/1,206 |
| OR (95% CI: lower–upper) | 1.00 | 1.24 (1.02–1.51) | 1.48 (1.21–1.81) | 2.18 (1.76–2.70) |
| ALT (U/L) | ≤19 | 20–27 | 28–38 | ≥39 |
| n (%) | 304/1,191 | 410/1,201 | 464/1,188 | 524/1,184 |
| OR (95% CI: lower–upper) | 1.00 | 1.26 (1.05–1.53) | 1.41 (1.16–1.72) | 1.45 (1.16–1.80) |
| AST (U/L) | ≤24 | 25–30 | 31–36 | ≥37 |
| n (%) | 340/1,214 | 463/1,294 | 408/1,145 | 491/1,111 |
| OR (95% CI: lower–upper) | 1.00 | 1.20 (0.99–1.44) | 0.97 (0.80–1.18) | 1.04 (0.83–1.30) |
| ALP (U/L) | ≤52 | 53–61 | 62–71 | ≥72 |
| n (%) | 437/1,288 | 381/1,106 | 402/1,202 | 482/1,168 |
| OR (95% CI: lower–upper) | 1.00 | 0.94 (0.78–1.12) | 0.86 (0.72–1.03) | 1.16 (0.97–1.38) |
| Women | ||||
| GGT (U/L) | ≤13 | 14–17 | 18–22 | ≥23 |
| Cases/subjects at risk | 142/1,843 | 155/1,386 | 210/1,151 | 342/1,409 |
| OR (95% CI: lower–upper) | 1.00 | 1.15 (0.89–1.48) | 1.46 (1.13–1.88) | 1.28 (0.98–1.66) |
| ALT (U/L) | ≤13 | 14–18 | 19–23 | ≥24 |
| Cases/subjects at risk | 111/1,480 | 187/1,624 | 202/1,248 | 349/1,437 |
| OR (95% CI: lower–upper) | 1.00 | 1.26 (0.97–1.63) | 1.40 (1.07–1.83) | 1.68 (1.27–2.21) |
| AST (U/L) | ≤22 | 23–26 | 27–31 | ≥32 |
| Cases/subjects at risk | 134/1,451 | 172/1,494 | 233/1,434 | 310/1,410 |
| OR (95% CI: lower–upper) | 1.00 | 0.95 (0.73–1.23) | 1.12 (0.86–1.44) | 1.15 (0.87–1.52) |
| ALP (U/L) | ≤42 | 43–51 | 52–63 | ≥64 |
| Cases/subjects at risk | 109/1,556 | 136/1,352 | 254/1,519 | 350/1,362 |
| OR (95% CI: lower–upper) | 1.00 | 1.26 (0.95–1.65) | 1.79 (1.39–2.31) | 1.87 (1.43–2.45) |
| Q1 | Q2 | Q3 | Q4 | |
|---|---|---|---|---|
| Men | ||||
| GGT (U/L) | ≤20 | 21–29 | 30–43 | ≥44 |
| Cases/subjects at risk | 212/1,178 | 272/1,213 | 328/1,167 | 402/1,206 |
| OR (95% CI: lower–upper) | 1.00 | 2.03 (1.63–2.55) | 3.10 (2.47–3.89) | 4.79 (3.78–6.08) |
| ALT (U/L) | ≤19 | 20–27 | 28–38 | ≥39 |
| Cases/subjects at risk | 160/1,191 | 283/1,201 | 297/1,188 | 444/1,184 |
| OR (95% CI: lower–upper) | 1.00 | 1.38 (1.12–1.71) | 1.56 (1.26–1.94) | 1.74 (1.36–2.23) |
| AST (U/L) | ≤24 | 25–30 | 31–36 | ≥37 |
| Cases/subjects at risk | 272/1,214 | 264/1,294 | 298/1,145 | 380/1,111 |
| OR (95% CI: lower–upper) | 1.00 | 1.21 (0.99–1.47) | 1.44 (1.17–1.77) | 1.75 (1.39–2.20) |
| ALP (U/L) | ≤52 | 53–61 | 62–71 | ≥72 |
| Cases/subjects at risk | 241/1,288 | 289/1,106 | 322/1,202 | 362/1,168 |
| OR (95% CI: lower–upper) | 1.00 | 1.29 (1.06–1.56) | 1.31 (1.09–1.52) | 1.40 (1.16–1.69) |
| Women | ||||
| GGT (U/L) | ≤13 | 14–17 | 18–22 | ≥23 |
| Cases/subjects at risk | 302/1,843 | 299/1,386 | 334/1,151 | 553/1,409 |
| OR (95% CI: lower–upper) | 1.00 | 1.73 (1.22–2.47) | 3.68 (2.65–5.11) | 5.15 (3.70–7.16) |
| ALT (U/L) | ≤13 | 14–18 | 19–23 | ≥24 |
| Cases/subjects at risk | 280/1,480 | 358/1,624 | 334/1,248 | 516/1,437 |
| OR (95% CI: lower–upper) | 1.00 | 1.39 (0.99–1.94) | 1.62 (1.15–2.27) | 1.81 (1.27–2.57) |
| AST (U/L) | ≤22 | 23–26 | 27–31 | ≥32 |
| Cases/subjects at risk | 307/1,451 | 350/1,494 | 361/1,434 | 470/1,410 |
| OR (95% CI: lower–upper) | 1.00 | 1.24 (0.91–1.69) | 1.22 (0.90–1.65) | 1.68 (1.24–2.30) |
| ALP (U/L) | ≤42 | 43–51 | 52–63 | ≥64 |
| Cases/subjects at risk | 271/1,556 | 331/1,352 | 428/1,519 | 458/1,362 |
| OR (95% CI: lower–upper) | 1.00 | 1.45 (1.06–1.99) | 1.72 (1.29–2.31) | 2.06 (1.53–2.78) |
| Q1 | Q2 | Q3 | Q4 | |
|---|---|---|---|---|
| Men | ||||
| GGT (U/L) | ≤20 | 21–29 | 30–43 | ≥44 |
| Cases/subjects at risk | 212/1,178 | 272/1,213 | 328/1,167 | 402/1,206 |
| OR (95% CI: lower–upper) | 1.00 | 1.04 (0.84–1.28) | 1.14 (0.92–1.43) | 1.20 (0.95–1.51) |
| ALT (U/L) | ≤19 | 20–27 | 28–38 | ≥39 |
| Cases/subjects at risk | 191/1,191 | 283/1,201 | 297/1,188 | 444/1,184 |
| OR (95% CI: lower–upper) | 1.00 | 1.54 (1.25–1.91) | 1.61 (1.29–2.00) | 2.45 (1.92–3.11) |
| AST (U/L) | ≤24 | 25–30 | 31–36 | ≥37 |
| Cases/subjects at risk | 272/1,214 | 264/1,294 | 298/1,145 | 380/1,111 |
| OR (95% CI: lower–upper) | 1.00 | 0.73 (0.60–0.89) | 0.81 (0.66–1.00) | 0.84 (0.66–1.06) |
| ALP (U/L) | ≤52 | 53–61 | 62–71 | ≥72 |
| Cases/subjects at risk | 241/1,288 | 289/1,106 | 322/1,202 | 362/1,168 |
| OR (95% CI: lower–upper) | 1.00 | 1.50 (1.23–1.84) | 1.53 (1.26–1.86) | 1.78 (1.46–2.16) |
| Women | ||||
| GGT (U/L) | ≤13 | 14–17 | 18–22 | ≥23 |
| Cases/subjects at risk | 302/1,843 | 299/1,386 | 334/1,151 | 553/1,409 |
| OR (95% CI: lower–upper) | 1.00 | 1.30 (1.08–1.55) | 1.78 (1.48–2.14) | 2.38 (1.98–2.85) |
| ALT (U/L) | ≤13 | 14–18 | 19–23 | ≥24 |
| Cases/subjects at risk | 280/1,480 | 358/1,624 | 334/1,248 | 516/1,437 |
| OR (95% CI: lower–upper) | 1.00 | 1.05 (0.87–1.26) | 1.13 (0.92–1.38) | 1.22 (0.98–1.53) |
| AST (U/L) | ≤22 | 23–26 | 27–31 | ≥32 |
| Cases/subjects at risk | 307/1,451 | 350/1,494 | 361/1,434 | 470/1,410 |
| OR (95% CI: lower–upper) | 1.00 | 0.99 (0.83–1.20) | 0.90 (0.74–1.09) | 1.01 (0.82–1.24) |
| ALP (U/L) | ≤42 | 43–51 | 52–63 | ≥64 |
| Cases/subjects at risk | 271/1,556 | 331/1,352 | 428/1,519 | 458/1,362 |
| OR (95% CI: lower–upper) | 1.00 | 1.39 (1.15–1.67) | 1.53 (1.28–1.83) | 1.68 (1.38–2.05) |
| Q1 | Q2 | Q3 | Q4 | |
|---|---|---|---|---|
| Men | ||||
| GGT (U/L) | ≤20 | 21–29 | 30–43 | ≥44 |
| Cases/subjects at risk | 210/1,178 | 280/1,213 | 393/1,167 | 488/1,206 |
| OR (95% CI: lower–upper) | 1.00 | 1.15 (0.92–1.44) | 1.75 (1.41–2.19) | 2.23 (1.77–2.80) |
| ALT (U/L) | ≤19 | 20–27 | 28–38 | ≥39 |
| Cases/subjects at risk | 275/1,191 | 346/1,201 | 345/1,188 | 405/1,184 |
| OR (95% CI: lower–upper) | 1.00 | 1.04 (0.84–1.29) | 0.95 (0.75–1.19) | 1.10 (0.84–1.44) |
| AST (U/L) | ≤24 | 25–30 | 31–36 | ≥37 |
| Cases/subjects at risk | 277/1,214 | 329/1,294 | 330/1,145 | 435/1,111 |
| OR (95% CI: lower–upper) | 1.00 | 1.08 (0.88–1.33) | 1.13 (0.91–1.40) | 1.56 (1.25–1.95) |
| ALP (U/L) | ≤52 | 53–61 | 62–71 | ≥72 |
| Cases/subjects at risk | 356/1,288 | 314/1,106 | 332/1,202 | 369/1,168 |
| OR (95% CI: lower–upper) | 1.00 | 0.95 (0.77–1.16) | 0.92 (0.75–1.12) | 0.95 (0.78–1.15) |
| Women | ||||
| GGT (U/L) | ≤13 | 14–17 | 18–22 | ≥23 |
| Cases/subjects at risk | 160/1,843 | 193/1,386 | 243/1,151 | 463/1,409 |
| OR (95% CI: lower–upper) | 1.00 | 1.46 (1.16–1.84) | 1.90 (1.51–2.39) | 2.38 (1.90–2.99) |
| ALT (U/L) | ≤13 | 14–18 | 19–23 | ≥24 |
| Cases/subjects at risk | 147/1,480 | 210/1,624 | 251/1,248 | 451/1,437 |
| OR (95% CI: lower–upper) | 1.00 | 1.24 (0.95–1.62) | 1.35 (1.02–1.79) | 1.55 (1.15–2.09) |
| AST (U/L) | ≤22 | 23–26 | 27–31 | ≥32 |
| Cases/subjects at risk | 154/1,451 | 231/1,494 | 250/1,434 | 424/1,410 |
| OR (95% CI: lower–upper) | 1.00 | 1.32 (1.05–1.68) | 1.17 (0.93–1.49) | 1.86 (1.48–2.35) |
| ALP (U/L) | ≤42 | 43–51 | 52–63 | ≥64 |
| Cases/subjects at risk | 159/1,556 | 181/1,352 | 316/1,519 | 403/1,362 |
| OR (95% CI: lower–upper) | 1.00 | 1.25 (0.95–1.65) | 1.78 (1.38–2.30) | 1.85 (1.41–2.42) |
| Q1 | Q2 | Q3 | Q4 | |
|---|---|---|---|---|
| Men | ||||
| GGT (U/L) | ≤20 | 21–29 | 30–43 | ≥44 |
| Cases/subjects at risk | 45/1,178 | 151/1,213 | 228/1,167 | 370/1,206 |
| OR (95% CI: lower–upper) | 1.00 | 2.65 (1.86–3.78) | 3.28 (2.30–4.68) | 4.97 (3.47–7.11) |
| ALT (U/L) | ≤19 | 20–27 | 28–38 | ≥39 |
| Cases/subjects at risk | 72/1,191 | 141/1,201 | 191/1,188 | 390/1,184 |
| OR (95% CI: lower–upper) | 1.00 | 1.49 (1.09–2.03) | 1.68 (1.23–2.29) | 3.17 (2.33–4.32) |
| AST (U/L) | ≤24 | 25–30 | 31–36 | ≥37 |
| Cases/subjects at risk | 116/1,214 | 157/1,294 | 203/1,145 | 318/1,111 |
| OR (95% CI: lower–upper) | 1.00 | 0.86 (0.65–1.13) | 0.96 (0.73–1.28) | 1.00 (0.74–1.35) |
| ALP (U/L) | ≤52 | 53–61 | 62–71 | ≥72 |
| Cases/subjects at risk | 188/1,288 | 194/1,106 | 215/1,202 | 197/1,168 |
| OR (95% CI: lower–upper) | 1.00 | 1.20 (0.94–1.52) | 1.11 (0.88–1.41) | 0.85 (0.67–1.09) |
| Women | ||||
| GGT (U/L) | ≤13 | 14–17 | 18–22 | ≥23 |
| Cases/subjects at risk | 21/1,843 | 42/1,386 | 71/1,151 | 208/1,409 |
| OR (95% CI: lower–upper) | 1.00 | 2.15 (1.26–3.67) | 3.32 (1.99–5.55) | 5.88 (3.56–9.70) |
| ALT (U/L) | ≤13 | 14–18 | 19–23 | ≥24 |
| Cases/subjects at risk | 22/1,480 | 50/1,624 | 80/1,248 | 190/1,437 |
| OR (95% CI: lower–upper) | 1.00 | 1.54 (0.92–2.58) | 2.26 (1.36–3.75) | 2.87 (1.74–4.72) |
| AST (U/L) | ≤22 | 23–26 | 27–31 | ≥32 |
| Cases/subjects at risk | 36/1,451 | 52/1,494 | 97/1,434 | 157/1,410 |
| OR (95% CI: lower–upper) | 1.00 | 0.94 (0.60–1.48) | 1.28 (0.83–1.96) | 1.26 (0.81–1.96) |
| ALP (U/L) | ≤42 | 43–51 | 52–63 | ≥64 |
| Cases/subjects at risk | 36/1,556 | 58/1,352 | 96/1,519 | 152/1,362 |
| OR (95% CI: lower–upper) | 1.00 | 1.38 (0.89–2.15) | 1.56 (0.83–2.37) | 1.75 (0.95–2.68) |
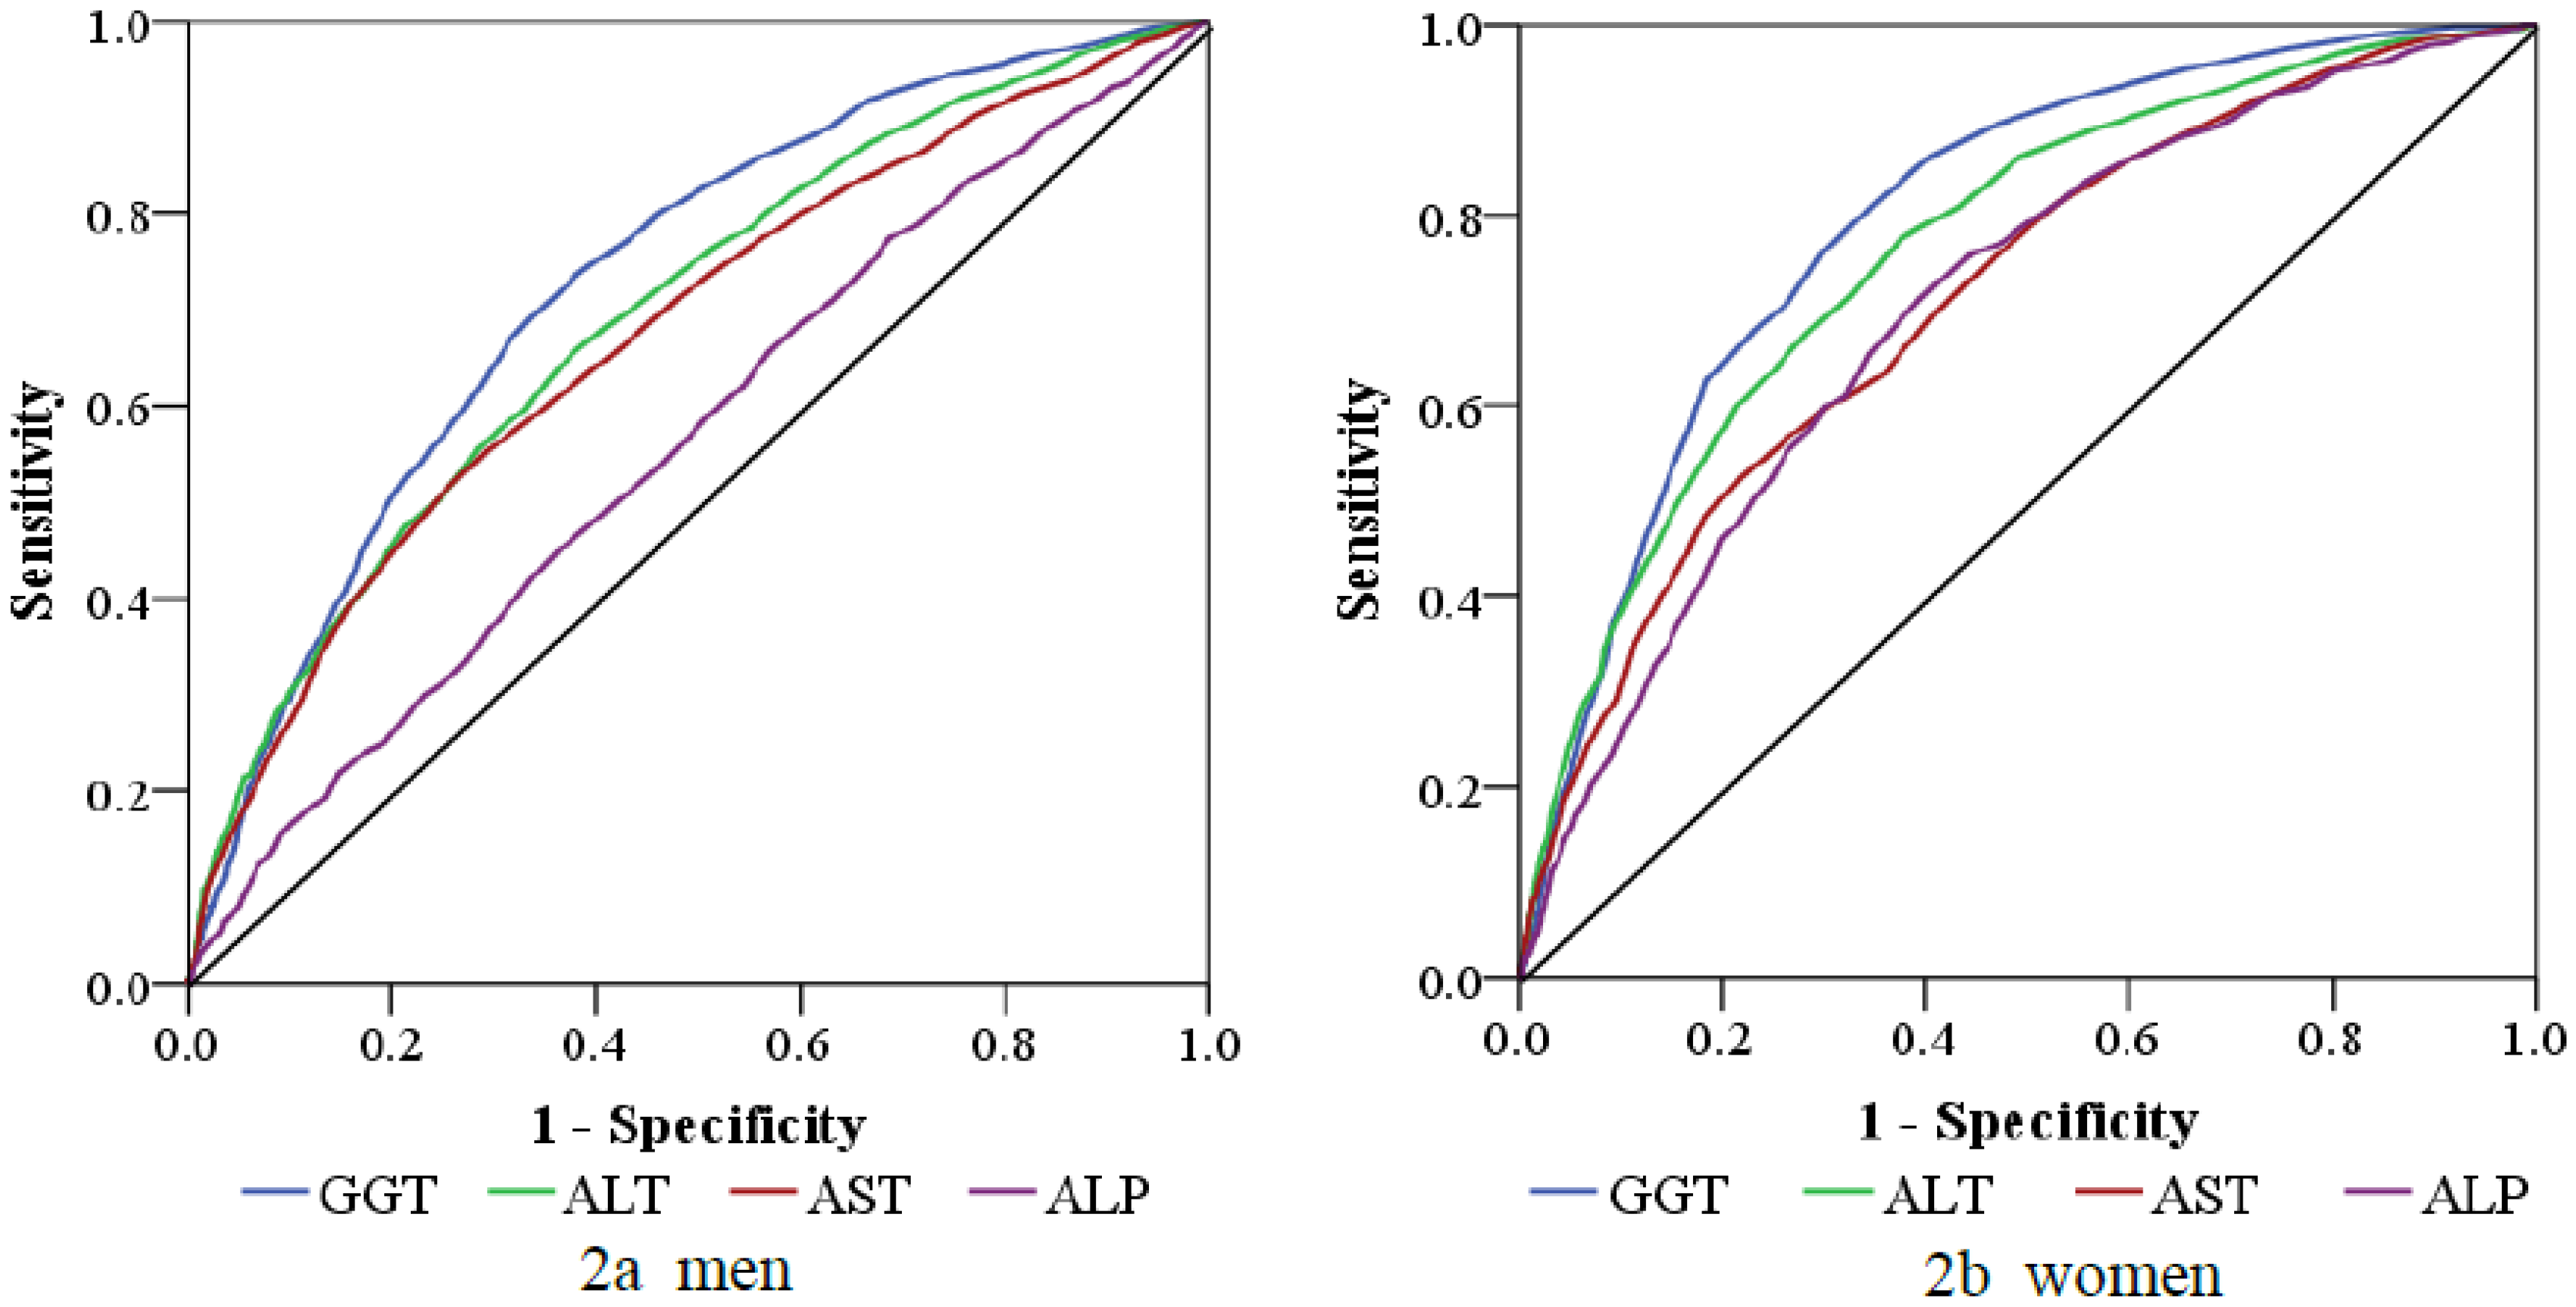
3.4. ROC Analysis of Various Liver Enzymes for the Diagnosis of MetS
| Variables | Area | 95% CI | ||
|---|---|---|---|---|
| Lower | Upper | |||
| Men | ||||
| GGT (U/L) | 0.73 | 0.71 | 0.75 | |
| ALT (U/L) | 0.69 | 0.67 | 0.71 | |
| AST (U/L) | 0.67 | 0.65 | 0.69 | |
| ALP (U/L) | 0.56 | 0.54 | 0.58 | |
| Women | ||||
| GGT (U/L) | 0.80 | 0.78 | 0.82 | |
| ALT (U/L) | 0.76 | 0.74 | 0.79 | |
| AST (U/L) | 0.71 | 0.69 | 0.74 | |
| ALP (U/L) | 0.70 | 0.68 | 0.73 | |

| GGT (U/L) | Sensitivity | Specificity | |
|---|---|---|---|
| Men | |||
| 29.50 | 0.77 | 0.57 | |
| 30.50 | 0.76 | 0.60 | |
| 31.50 | 0.74 | 0.62 | |
| 32.50 | 0.71 | 0.64 | |
| Women | |||
| 17.50 | 0.86 | 0.60 | |
| 18.50 | 0.81 | 0.65 | |
| 19.50 | 0.76 | 0.70 | |
| 20.50 | 0.71 | 0.74 | |
| 21.50 | 0.68 | 0.77 |
4. Discussion
5. Conclusions
Acknowledgments
Conflicts of Interest
References
- Kim, K.M.; Kim, B.T.; Lee, D.J.; Park, S.B.; Joo, N.S.; Kim, K.N. Serum gamma-glutamyltransferase as a risk factor for general cardiovascular disease prediction in Koreans. J. Investig. Med. 2012, 60, 1199–1203. [Google Scholar]
- Hurjui, D.M.; Nita, O.; Graur, L.I.; Mihalache, L.; Popescu, D.S.; Hutanasu, I.C.; Ungureanu, D.; Graur, M. Non-alcoholic fatty liver disease is associated with cardiovascular risk factors of metabolic syndrome. Rev. Med. Chir. Soc. Med. Nat. Iasi. 2012, 116, 692–699. [Google Scholar]
- Schneider, A.L.; Lazo, M.; Ndumele, C.E.; Pankow, J.S.; Coresh, J.; Clark, J.M.; Selvin, E. Liver enzymes, race, gender and diabetes risk: The Atherosclerosis Risk in Communities (ARIC) Study. Diabet. Med. 2013, 30, 926–933. [Google Scholar]
- Nguyen, Q.M.; Srinivasan, S.R.; Xu, J.H.; Chen, W.; Hassig, S.; Rice, J.; Berenson, G.S. Elevated liver function enzymes are related to the development of prediabetes and type 2 diabetes in younger adults: The Bogalusa Heart Study. Diabetes Care 2011, 34, 2603–2607. [Google Scholar] [CrossRef]
- Onat, A.; Can, G.; Ornek, E.; Cicek, G.; Ayhan, E.; Dogan, Y. Serum gamma-glutamyltransferase: Independent predictor of risk of diabetes, hypertension, metabolic syndrome, and coronary disease. Obesity (Silver Spring) 2012, 20, 842–848. [Google Scholar] [CrossRef]
- Lee, J.H.; Um, M.H.; Park, Y.K. The association of metabolic syndrome and serum gamma-glutamyltranspeptidase: A 4-year cohort study of 3,698 korean male workers. Clin. Nutr. Res. 2013, 2, 67–75. [Google Scholar] [CrossRef]
- Bian, A.L.; Wang, X.F. Relationship between serum gamma-glutamyltransferase and the risk of metabolic syndrome. Zhonghua Liu Xing Bing Xue Za Zhi 2011, 32, 625–628. [Google Scholar]
- Oh, H.J.; Kim, T.H.; Sohn, Y.W.; Kim, Y.S.; Oh, Y.R.; Cho, E.Y.; Shim, S.Y.; Shin, S.R.; Han, A.L.; Yoon, S.J.; et al. Association of serum alanine aminotransferase and gamma-glutamyltransferase levels within the reference range with metabolic syndrome and nonalcoholic fatty liver disease. Korean J. Hepatol. 2011, 17, 27–36. [Google Scholar] [CrossRef]
- Bozbas, H.; Yildirir, A.; Karacaglar, E.; Demir, O.; Ulus, T.; Eroglu, S.; Aydinalp, A.; Ozin, B.; Muderrisoglu, H. Increased serum gamma-glutamyltransferase activity in patients with metabolic syndrome. Turk Kardiyol. Dern. Ars. 2011, 39, 122–128. [Google Scholar] [CrossRef]
- Castellano, I.; Merlino, A. γ-Glutamyltranspeptidases: Sequence, structure, biochemical properties, and biotechnological applications. Cell. Mol. Life Sci. 2012, 69, 3381–3394. [Google Scholar] [CrossRef]
- Abete, I.; Goyenechea, E.; Zualet, M.A.; Martinez, J.A. Obesity and metabolic syndrome: Potential benefit from specific nutritional components. Nutr. Metab. Cardiovasc. Dis. 2011, 21 (Suppl. 2), B1–B15. [Google Scholar] [CrossRef]
- McNeill, A.M.; Rosamond, W.D.; Girman, C.J.; Golden, S.H.; Schmidt, M.I.; East, H.E.; Ballantyne, C.M.; Heiss, G. The metabolic syndrome and 11-year risk of incident cardiovascular disease in the atherosclerosis risk in communities study. Diabetes Care 2005, 28, 385–390. [Google Scholar] [CrossRef]
- Guize, L.; Thomas, F.; Pannier, B.; Bean, K.; Jego, B.; Benetos, A. All-cause mortality associated with specific combinations of the metabolic syndrome according to recent definitions. Diabetes Care 2007, 30, 2381–2387. [Google Scholar] [CrossRef]
- Shimizu, Y.; Imano, H.; Ohira, T.; Kitamura, A.; Kiyama, M.; Okada, T.; Sato, S.; Shimamoto, T.; Yamagishi, K.; Tanigawa, T.; et al. Gamma-Glutamyltranspeptidase and incident stroke among Japanese men and women: The Circulatory Risk in Communities Study (CIRCS). Stroke 2010, 41, 385–388. [Google Scholar] [CrossRef]
- Fraser, A.; Harris, R.; Sattar, N.; Ebrahim, S.; Smith, G.D.; Lawlor, D.A. Gamma-glutamyltransferase is associated with incident vascular events independently of alcohol intake: Analysis of the British women’s heart and health study and meta-analysis. Arterioscler. Thromb. Vasc. Biol. 2007, 27, 2729–2735. [Google Scholar] [CrossRef]
- Ruttmann, E.; Brant, L.J.; Concin, H.; Diem, G.; Rapp, K.; Ulmer, H. Gamma-glutamyltransferase as a risk factor for cardiovascular disease mortality: An epidemiological investigation in a cohort of 163,944 Austrian adults. Circulation 2005, 112, 2130–2137. [Google Scholar] [CrossRef]
- Liu, C.F.; Zhou, W.N.; Fang, N.Y. Gamma-glutamyltransferase levels and risk of metabolic syndrome: A meta-analysis of prospective cohort studies. Int. J. Clin. Pract. 2012, 66, 692–698. [Google Scholar] [CrossRef]
- Hanley, A.J.; Williams, K.; Festa, A.; Wagenknecht, L.E.; D’Agostino, R.B., Jr.; Kempf, J.; Zinman, B.; Haffner, S.M. Elevations in markers of liver injury and risk of type 2 diabetes: The insulin resistance atherosclerosis study. Diabetes 2004, 53, 2623–2632. [Google Scholar] [CrossRef]
- Lee, D.H.; Jacobs, D.R., Jr.; Gross, M.; Steffes, M. Serum gamma-glutamyltransferase was differently associated with microalbuminuria by status of hypertension or diabetes: The Coronary Artery Risk Development in Young Adults (CARDIA) Study. Clin. Chem. 2005, 51, 1185–1191. [Google Scholar] [CrossRef]
- Xu, Y.; Bi, Y.F.; Xu, M.; Huang, Y.; Lu, W.Y.; Gu, Y.F.; Ning, G.; Li, X.Y. Cross-sectional and longitudinal association of serum alanine aminotransaminase and gamma-glutamyltransferase with metabolic syndrome in middle-aged and elderly Chinese people. J. Diabetes 2011, 3, 38–47. [Google Scholar] [CrossRef]
- Hwang, A.C.; Lin, Y.C.; Liu, P.T.; Kao, Y.M.; Chen, J.D. Synergistic effect of gamma glutamyltransferase and obesity on metabolic syndrome, independent of hepatic steatosis. Ann. Epidemiol. 2012, 22, 876–880. [Google Scholar] [CrossRef]
- Lee, K.; Yang, J.H. Which liver enzymes are better indicators of metabolic syndrome in adolescents: The Fifth Korea National Health and Nutrition Examination Survey, 2010. Metab. Syndr. Relat. Disord. 2013, 11, 229–235. [Google Scholar] [CrossRef]
- Goessling, W.; Massaro, J.M.; Vasan, R.S.; D’Agostino, R.B., Sr.; Ellison, R.C.; Fox, C.S. Aminotransferase levels and 20-year risk of metabolic syndrome, diabetes, and cardiovascular disease. Gastroenterology 2008, 135, 1935–1944.e1. [Google Scholar] [CrossRef]
- Hanley, A.J.; Williams, K.; Festa, A.; Wagenknecht, L.E.; D’Agostino, R.B., Jr.; Haffner, S.M. Liver markers and development of the metabolic syndrome: the insulin resistance atherosclerosis study. Diabetes 2005, 54, 3140–3147. [Google Scholar] [CrossRef]
- Patel, D.A.; Srinivasan, S.R.; Xu, J.H.; Chen, W.; Berenson, G.S. Persistent elevation of liver function enzymes within the reference range is associated with increased cardiovascular risk in young adults: The Bogalusa Heart Study. Metabolism 2007, 56, 792–798. [Google Scholar] [CrossRef]
- Kim, M.K.; Baek, K.H.; Kang, M.I.; Park, S.E.; Rhee, E.J.; Park, C.Y.; Lee, W.Y.; Oh, K.W. Serum alkaline phosphatase, body composition, and risk of metabolic syndrome in middle-aged Korean. Endocr. J. 2013, 60, 321–328. [Google Scholar] [CrossRef]
- Yousefzadeh, G.; Shokoohi, M.; Yeganeh, M.; Najafipour, H. Role of gamma-glutamyl transferase (GGT) in diagnosis of impaired glucose tolerance and metabolic syndrome: A prospective cohort research from the Kerman Coronary Artery Disease Risk Study (KERCADRS). Diabetes Metab. Syndr. 2012, 6, 190–194. [Google Scholar] [CrossRef]
- Kong, A.P.; Choi, K.C.; Ho, C.S.; Chan, M.H.; Ozaki, R.; Chan, C.W.; Chan, J.C. Associations of uric acid and gamma-glutamyltransferase (GGT) with obesity and components of metabolic syndrome in children and adolescents. Pediatr. Obes. 2012, 8, 351–357. [Google Scholar]
- Targher, G. Elevated serum gamma-glutamyltransferase activity is associated with increased risk of mortality, incident type 2 diabetes, cardiovascular events, chronic kidney disease and cancer—A narrative review. Clin. Chem. Lab. Med. 2010, 48, 147–157. [Google Scholar] [CrossRef]
- Alberti, K.G.; Eckel, R.H.; Grundy, S.M.; Zimmet, P.Z.; Cleeman, J.I.; Donato, K.A.; Fruchart, J.C.; James, W.P.; Loria, C.M.; Smith, S.C., Jr. Harmonizing the metabolic syndrome: A joint interim statement of the International Diabetes Federation Task Force on Epidemiology and Prevention; National Heart, Lung, and Blood Institute; American Heart Association; World Heart Federation; International Atherosclerosis Society; and International Association for the Study of Obesity. Circulation 2009, 120, 1640–1645. [Google Scholar] [CrossRef]
- Chen, C.; Lu, F.C. The guidelines for prevention and control of overweight and obesity in Chinese adults. Biomed. Environ. Sci. 2004, 17, 1–36. [Google Scholar]
- Rantala, A.O.; Lilja, M.; Kauma, H.; Savolainen, M.J.; Reunanen, A.; Kesaniemi, Y.A. Gamma-glutamyl transpeptidase and the metabolic syndrome. J. Intern. Med. 2000, 248, 230–238. [Google Scholar] [CrossRef]
- Sakugawa, H.; Nakayoshi, T.; Kobashigawa, K.; Nakasone, H.; Kawakami, Y.; Yamashiro, T.; Maeshiro, T.; Tomimori, K.; Miyagi, S.; Kinjo, F.; et al. Metabolic syndrome is directly associated with gamma glutamyl transpeptidase elevation in Japanese women. World J. Gastroenterol. 2004, 10, 1052–1055. [Google Scholar]
- Andre, P.; Balkau, B.; Vol, S.; Charles, M.A.; Eschwege, E. Gamma-glutamyltransferase activity and development of the metabolic syndrome (International Diabetes Federation Definition) in middle-aged men and women: Data from the Epidemiological Study on the Insulin Resistance Syndrome (DESIR) cohort. Diabetes Care 2007, 30, 2355–2361. [Google Scholar] [CrossRef]
- Suh, B.S. The association between serum gamma-glutamyltransferase within normal levels and metabolic syndrome in office workers: A 4-year follow-up study. Korean J. Fam. Med. 2012, 33, 51–58. [Google Scholar] [CrossRef]
- Kang, Y.H.; Min, H.K.; Son, S.M.; Kim, I.J.; Kim, Y.K. The association of serum gamma glutamyltransferase with components of the metabolic syndrome in the Korean adults. Diabetes Res. Clin. Pract. 2007, 77, 306–313. [Google Scholar] [CrossRef]
- Nakanishi, N.; Suzuki, K.; Tatara, K. Serum gamma-glutamyltransferase and risk of metabolic syndrome and type 2 diabetes in middle-aged Japanese men. Diabetes Care 2004, 27, 1427–1432. [Google Scholar] [CrossRef]
- Lim, J.S.; Yang, J.H.; Chun, B.Y.; Kam, S.; Jacobs, D.R., Jr.; Lee, D.H. Is serum gamma-glutamyltransferase inversely associated with serum antioxidants as a marker of oxidative stress? Free Radic. Biol. Med. 2004, 37, 1018–1023. [Google Scholar] [CrossRef]
- Wu, X.Y.; Hu, C.L.; Wan, Y.H.; Su, P.Y.; Xing, C.; Qi, X.Y.; Tao, F.B. Higher waist-to-height ratio and waist circumference are predictive of metabolic syndrome and elevated serum alanine aminotransferase in adolescents and young adults in mainland China. Public Health 2012, 126, 135–142. [Google Scholar] [CrossRef]
- Oda, E.; Kawai, R.; Watanabe, K.; Sukumaran, V. Prevalence of metabolic syndrome increases with the increase in blood levels of gamma glutamyltransferase and alanine aminotransferase in Japanese men and women. Intern. Med. 2009, 48, 1343–1350. [Google Scholar] [CrossRef]
- Zhang, H.; Ding, Y.; Li, Q.; Sun, J.; He, S.; Feng, X.; Zhao, Y.; Zhou, X.; Cai, Y.; Wang, C.; et al. Relationship between serum aminotransferase levels and metabolic disorders in northern China. Iran. J. Public Health 2012, 41, 15–26. [Google Scholar]
- Kasapoglu, B.; Turkay, C.; Bayram, Y.; Koca, C. Role of GGT in diagnosis of metabolic syndrome: A clinic-based cross-sectional survey. Indian J. Med. Res. 2010, 132, 56–61. [Google Scholar]
- Freiberg, M.S.; Pencina, M.J.; D’Agostino, R.B.; Lanier, K.; Wilson, P.W.; Vasan, R.S. BMI vs. waist circumference for identifying vascular risk. Obesity (Silver Spring) 2008, 16, 463–469. [Google Scholar] [CrossRef]
- Abbasi, F.; Blasey, C.; Reaven, G.M. Cardiometabolic risk factors and obesity: Does it matter whether BMI or waist circumference is the index of obesity? Am. J. Clin. Nutr. 2013, 98, 637–640. [Google Scholar] [CrossRef]
© 2013 by the authors; licensee MDPI, Basel, Switzerland. This article is an open access article distributed under the terms and conditions of the Creative Commons Attribution license (http://creativecommons.org/licenses/by/3.0/).
Share and Cite
Tao, L.; Li, X.; Zhu, H.; Gao, Y.; Luo, Y.; Wang, W.; Wang, Z.; Chen, D.; Wu, L.; Guo, X. Association between γ-Glutamyl Transferase and Metabolic Syndrome: A Cross-Sectional Study of an Adult Population in Beijing. Int. J. Environ. Res. Public Health 2013, 10, 5523-5540. https://doi.org/10.3390/ijerph10115523
Tao L, Li X, Zhu H, Gao Y, Luo Y, Wang W, Wang Z, Chen D, Wu L, Guo X. Association between γ-Glutamyl Transferase and Metabolic Syndrome: A Cross-Sectional Study of an Adult Population in Beijing. International Journal of Environmental Research and Public Health. 2013; 10(11):5523-5540. https://doi.org/10.3390/ijerph10115523
Chicago/Turabian StyleTao, Lixin, Xia Li, Huiping Zhu, Yue Gao, Yanxia Luo, Wei Wang, Zhaoping Wang, Dongning Chen, Lijuan Wu, and Xiuhua Guo. 2013. "Association between γ-Glutamyl Transferase and Metabolic Syndrome: A Cross-Sectional Study of an Adult Population in Beijing" International Journal of Environmental Research and Public Health 10, no. 11: 5523-5540. https://doi.org/10.3390/ijerph10115523