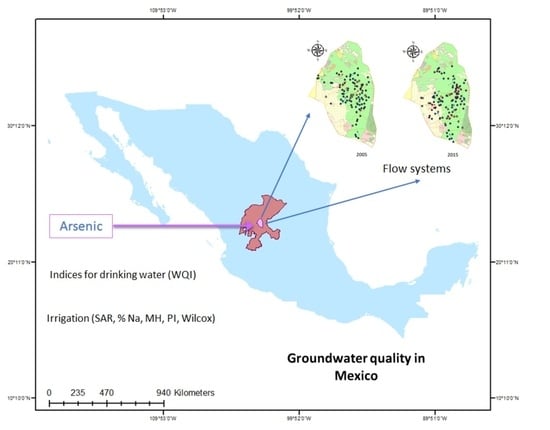
This research was carried out during two monitoring periods in the Calera aquifer in the state of Zacatecas, Mexico, where it was identified different flow systems and evaluate them for human and agricultural consumption; determined the water quality and its hydrogeochemical characteristics for human and agricultural consumption; and performed a statistical analysis with the data collected by applying the bivariate data analysis system (BiDASys).
3.1. Identification of Flow Systems
The groundwater in the study area is the most important source of human, agricultural, and industrial water supply, which is why its evolution has previously been studied using the theory of flow systems. Avila et al. [
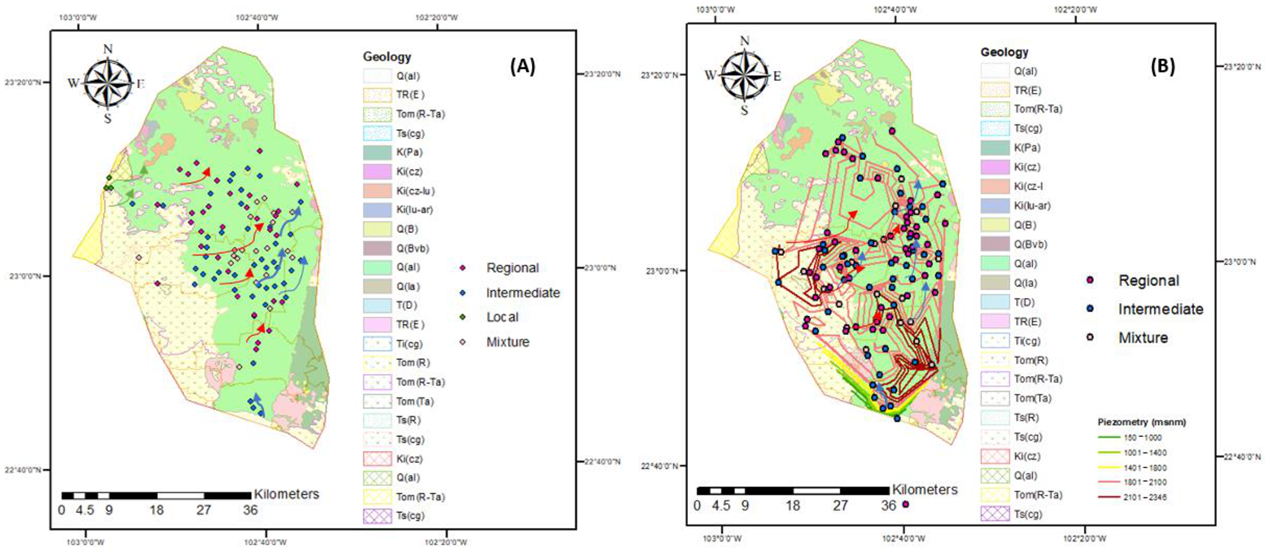
43] identified regional, local, intermediate, and mixed flows through cluster analysis to group samples into groups that allow for the determination of the flow systems for the years 2005 and 2015, the results of which are shown in
Figure 2. For 2005, 99 samples were analyzed from different wells—32 belonged to regional flow, 44 to intermediate flow, 3 to local flow, and 20 to mixed flow. (
Table 4). On the other hand, for 2015 116 wells were evaluated as a result of cluster analysis—47 belonged to regional flow, 49 to intermediate flow, and 20 to mixed flow (
Table 5).
The method in this research was used with some modifications, such as consideration of the depth of the exploitations, for the evaluation of the suitability of groundwater quality for domestic use and irrigation in the period of 2005−2015. This type of study has not previously been carried out in this region, but it is necessary to evaluate the quality of water here in order to achieve sustainability, as, currently, is extracted on a large scale to meet the human consumption demands of approximately 500,000 inhabitants and for the irrigation of 25,000 hectares. [
43]. One of the challenges of the scientific world is finding the origins of arsenic contamination, which can have different sources depending on the study region, requiring research in all of the planet to create a database that allows us to record the behavior of this element. Thereby helping to make necessary recommendations for the consumption of this type of water and preventing the deterioration of human health. In this research, the average arsenic content was higher in 2015 than in 2005 for the regional flow system (the monitoring of the 2016−2020 period presents very similar results; however, in this report they are not presented, because the data are currently in process of being analyzed), impacting the quality of water for human use. The origin of arsenic may be natural, due to water–rock interactions, as rocks such as pyrite, chalcopyrite, galean and marcasite contain it, and this type of geological material is present the study region. Other anthropogenic sources may also contribute to the contamination of the water with arsenic, through pesticides, herbicides, fertilizers or mining activities. The results obtained in this research indicate that the origin of arsenic depends on pyrite rock found in the region and is incorporated through water–rock interactions, that is, it occurs naturally. On this basis, it is necessary to apply remediation techniques, such as biosorbents or the design of wells for the extraction of water, avoiding harmful effects on the consumers of these waters.
The evolution of the cations in 2005 for the regional flow was Na
+ > Ca
2+ > K
+ > Mg
2+; for the remaining flow systems, the behavior is Ca
+2 > Na
+ > K
+ > Mg
2+. On the other hand, for the anions in all the flow systems, the evolution was presented as HCO
3− > SO
42− > Cl
−. In 2015, the evolution of the cations for the regional flow had the trend Na > Ca > Mg > K; It is observed that Mg
2+ displaces K
+, impacting on a deterioration of the water quality, for the remaining flow systems, there is Na
+ > Ca
2+ > K
+ > Mg
2+, that is, a very similar behavior. On the contrary, for anions in all flow systems, the present evolution is HCO
3− > Cl
− > SO
42− having an effect on water quality. Most of the samples showed a similar behavior in terms of pH, Chebotarev [
54] and others [
1,
42,
55] have reported this cationic evolution.
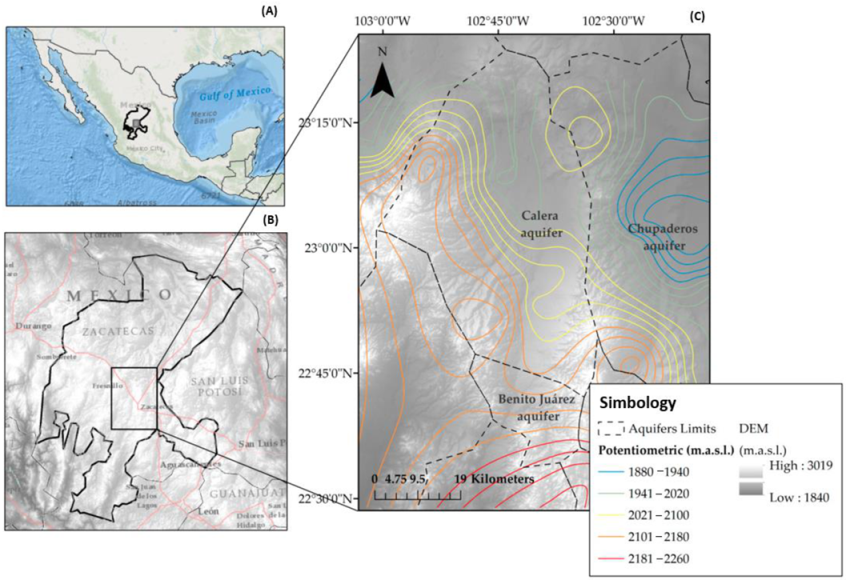
Figure 2 shows the corresponding wells for each flow system in both years. It is shown that the wells are located in the Calera aquifer, which is one of the main aquifers that supply the metropolitan area of the state of Zacatecas for human consumption. Water is also extracted for the irrigation of crops that are consumed by the inhabitants. The flow system theory used in the present study has been described by Tóth [
42], who considered groundwater flow distances and water geochemistry. However, from 2015, the depth of the extracted water was also incorporated, which varies from 10 to 300 meters.
3.2. Water Quality for Human Use
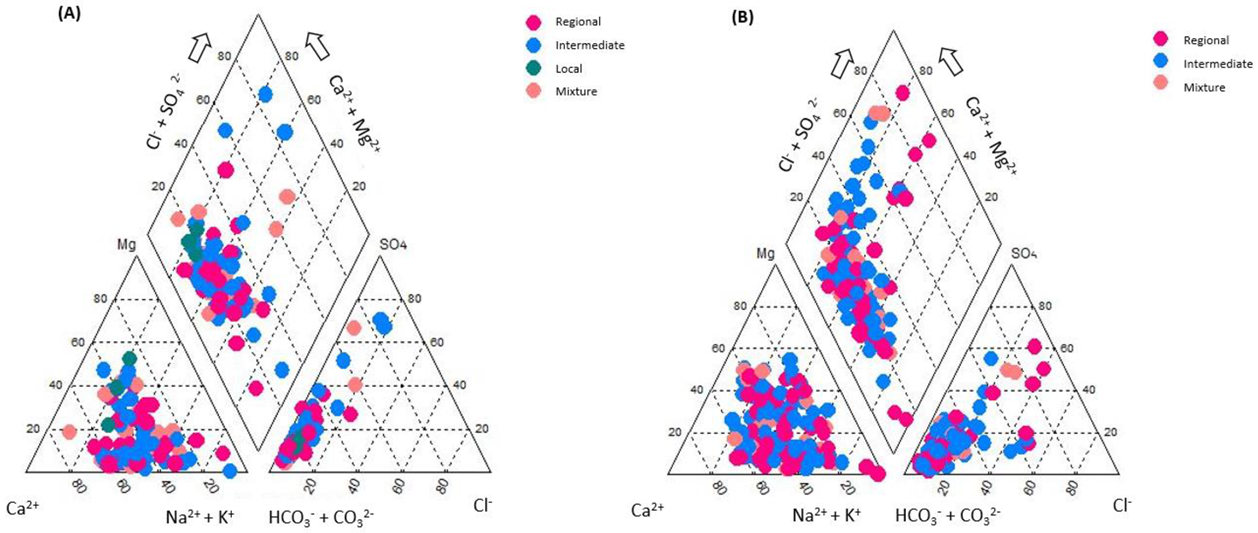
A Piper diagram is a graphical representation of some chemical components of water samples.
Figure 3 shows the corresponding diagram of the different flow system in each year analyzed. It indicates that calcium, sodium, and/or magnesium bicarbonate are present. It can be seen in this diagram that for both years, the type in most of the samples has similar behavior [
56]. This type of water is a result of the reaction between sodium chloride and silica that arise from the earth’s core in the presence of water, initially forming sodium silicate and then sodium bicarbonate of water [
12]. These results agree with those of others studies [
15,
57,
58].
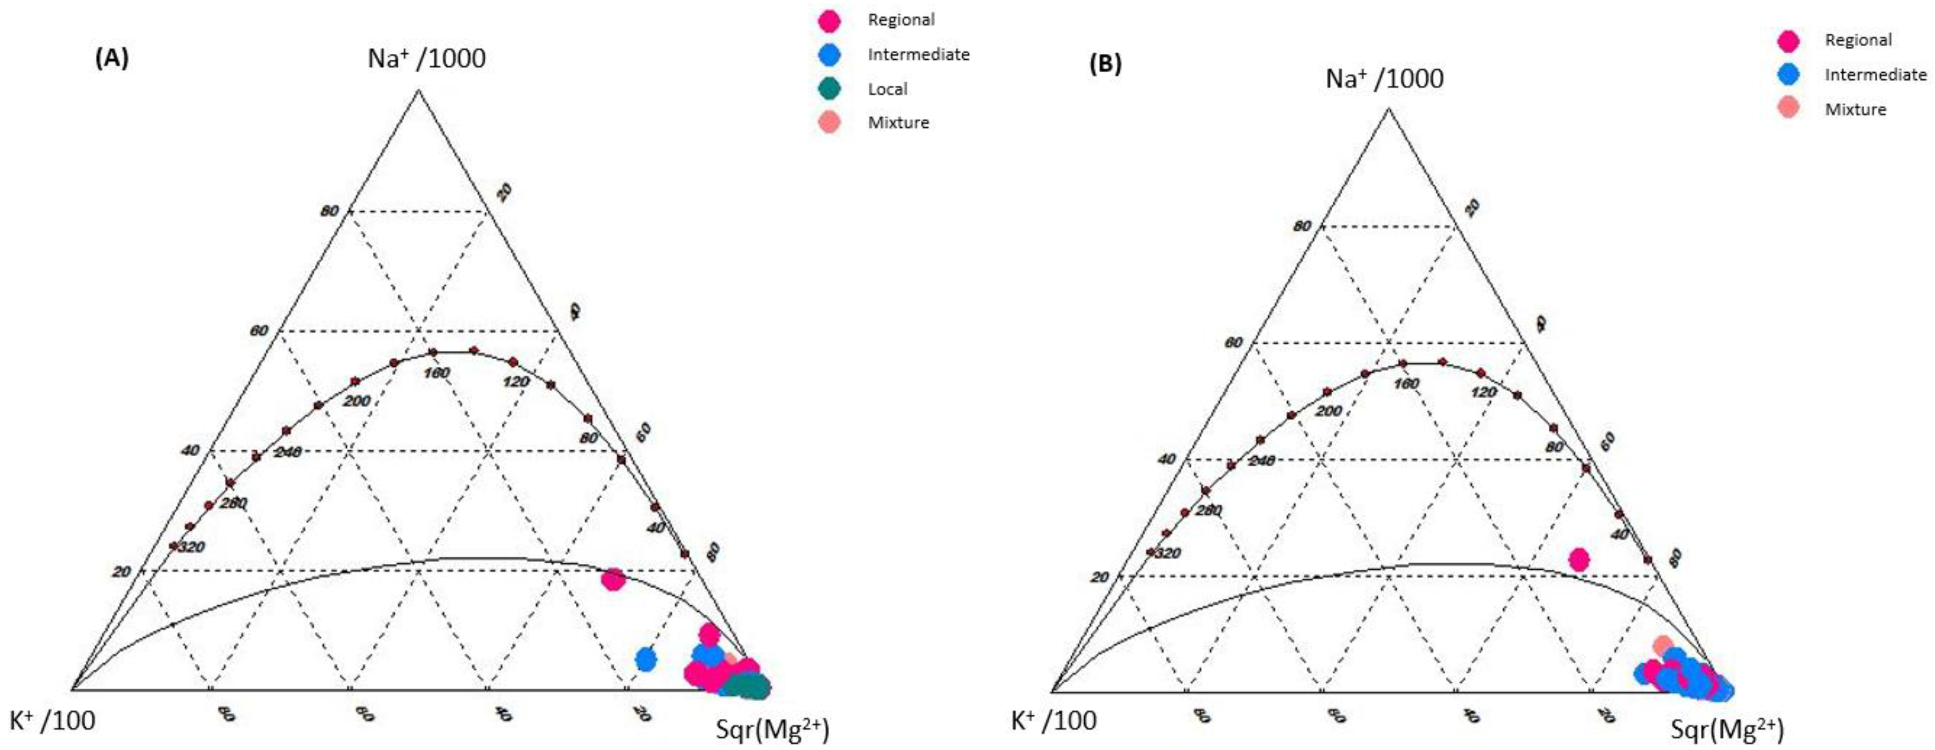
Figure 4 shows the Giggenbach triangular diagram. This scheme reveals that almost all samples are in the immature water area, which is one of the main properties of cold groundwater. This type of water is characterized by not reaching equilibrium; that is, it does not have chemical equilibrium with respect to the rock of the aquifer, where dissolution dominates and it mixes with groundwater and ion exchange occurs. This result confirms that the chemical composition of groundwater is mainly controlled by the chemical dissolution of the rock [
59], which is consistent with previously conducted studies [
12,
60].
Table 6 shows the average values of the parameters for each flow system observed in both years, and these are compared with different regulatory bodies around the world. The check mark indicates that these values are within the limits suggested by each regulation, while the cross indicates that these limits were exceeded and do not comply with the established standard. For the year 2005, most of the samples are within the permissible limit, with the exception of arsenic and nitrates that do not meet the standards of the World Health Organization. On the other hand, in 2015, a negative evolution was observed in these same parameters, thus not complying with the permissible limits of the EPA, and the samples of the mixed flow in arsenic do not comply with the Mexican standard. The scientific challenge of evaluating water quality has generated a series of studies in different regions of the world, such as India, USA, China, Switzerland, and Spain [
22,
61,
62,
63,
64]; however, they do not consider flow systems that will allow for better visualization of quality of the water in aquifers, and can provide information for implement remediation methods that can prevent health problems, for the consumption of water with bad quality Therefore, such consideration represents innovation of the current investigation.
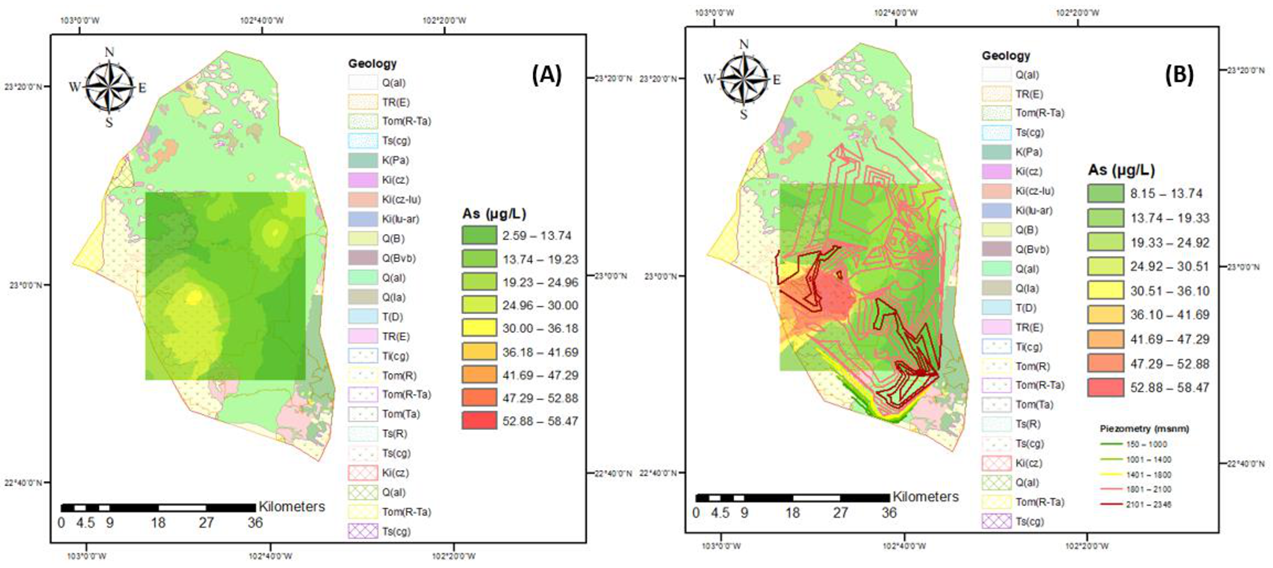
The evolution of arsenic concentrations can be observed in
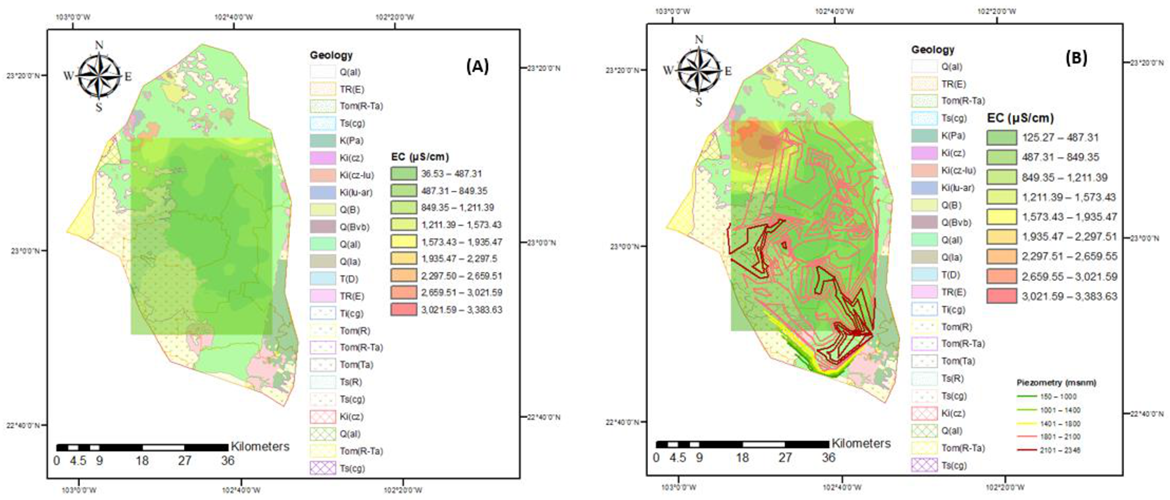
Figure 5, where problems with this element begin to appear since 2005, mainly in the southwest region of the Calera aquifer, for 2015 this trend continues but with significant increases in arsenic decreasing the quality of water for human consumption and irrigation. In 2015, the variable depth of water extraction was included, finding that the greater increase in the presence of arsenic, suggesting that the water extracted from this area should be restricted for human consumption as well as in the irrigation of agricultural crops to avoid Harmful effects on the population that drinks and consumes food, in addition to understanding the evolution of arsenic, it allows looking for treatment alternatives for the elimination of this element. On the other hand, electrical conductivity (
Figure 6) has a similar behavior to arsenic since it increases its value from 2005 to 2015 in the north of the aquifer, the effect that this parameter may have on public health is due to the increase in concentrations of salts that damages the human system, for which a treatment is required for its control. On the other hand, some crops do not tolerate high concentrations of salts.
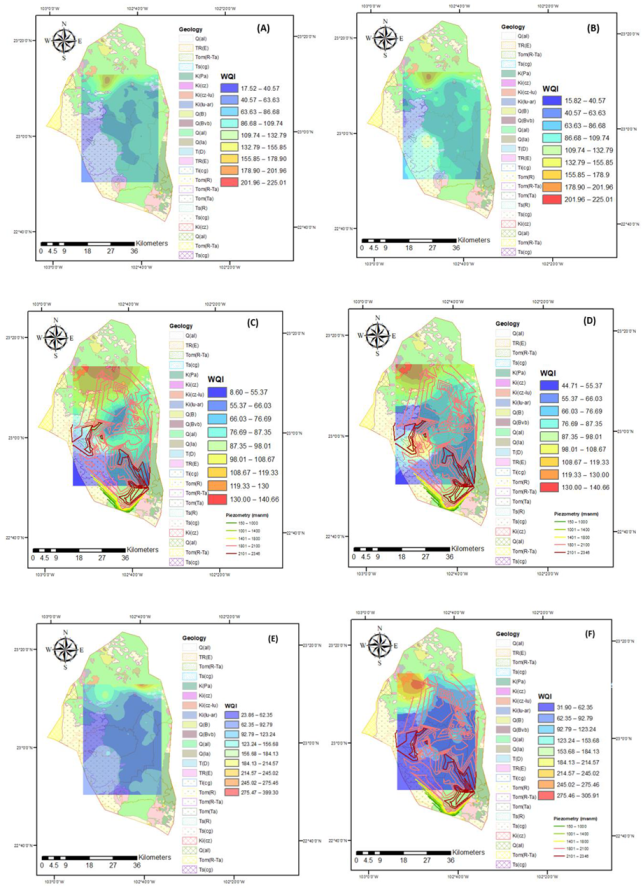
The water quality index can be seen in
Figure 7. Three indices were calculated, one without considering As, the other taking it into account, and the final one considering arsenic and fluor. For 2005, it can be observed how this index worsens when considering As in the calculation, and this can also be seen for the year 2015, which shows that it is an element of great importance for water quality and should be paid attention. These results indicate that according to the WQI, the groundwater is safe for drinking purposes; however, the quality of the water diminishes over time, with samples for 2015 belonging to the category of “unacceptable” in this year, which was not the case for 2005. Thus, it is recommended that this type of water is not used as drinking water in the region. The water quality index (WQI) is considered the most effective method of measuring water quality; however, while most studies do not consider arsenic as an important parameter, in this study, it can be observed that it is an element relevant to the quality of the water. Furthermore, a detailed analysis of water quality according to flow systems is considered to provide a better overview in order to describe the evolution of water quality in aquifers. Water quality assessment is important for pollution control and water resources management, and it is critical to identify the major contributors to spatial and temporal variations in water quality.
The water quality indices in
Figure 7 are based on the parameters that are considered high risk for human health [
46]; however, several scientific works have suggested including other parameters to more accurately estimate the WQI, thereby avoiding adverse effects on the health of the population that consumes this water. In this investigation, the WQI was obtained by considering the parameters recommended in some investigations [
15,
46,
47,
48,
64]. The second calculation of the WQI includes arsenic, which is considered a high risk element for human health if that contains a higher-than-average amount of it is consumed, according to the WHO [
31]. The estimation of WQI with the arsenic and fluorine parameters allows us to generate a value with greater significance for decision makers regarding water use. In 2005, a change in the WQI without As and with As was observed, thus allowing for an increase in the level of classification of water quality. In 2015, a similar behavior occurred; however, an increase in the WQI was observed, that is, there was an evolution in the deterioration of water quality. This research shows that including As in the calculation of the WQI is of great importance since it allows a significant improvement in the classification of water quality, in addition to coinciding with other investigations that have been carried out [
47,
48,
65,
66]. It is therefore important to continue to monitor As as well as its origins and, based on this, recommend control or remediation techniques for As. On the other hand, the results reported in the research indicate that the WQI has a spatio-temporal behavior since some values change; however, according to this index, the groundwater in the study area is classified as safe to drink. Despite this being the case in most of the samples analyzed, some samples from 2015 belong to the category of “unacceptable”. The water quality index (WQI) is considered the most effective method for measuring water quality [
46,
52,
67,
68]. However, although most studies do not consider arsenic as an important parameter, in this study, it can be observed that it is a relevant element for water quality. Furthermore, a detailed analysis of water quality according to flow systems is considered to provide a better overview in order to describe the evolution of water quality in aquifers. The evaluation of water quality must be approached with spatial–temporal variability, thereby allowing for the control or remediation of heavy metals and the management of water resources.
3.3. Irrigation Water Quality
Groundwater in the study region is the main source of water to meet the irrigation needs of evapotranspiration for each crop in the area. Approximately 25,000 hectares of land growing predominantly vegetables and cereals are irrigated in two agricultural cycles (spring–summer and autumn–winter). It is estimated that 125 million m
3 of water is annually extracted. To obtain the maximum yield, crops require comprehensive agricultural management, where water quality plays a fundamental role since it intervenes in all production processes. Groundwater is generally more mineralized with dissolved salts, which influence permeability, texture, structure, soil pH, the assimilation of nutrients, and crop growth. Poor-quality irrigation water directly influences crop yield, it is estimated that it decreases the yield of N by up to 35%, and, depending on the quality, some crops (those least tolerant to salinity) cannot be cultivated. The growth of vegetables also relies on this water, hence the importance of permanently monitoring and evaluation of the evolution of irrigation water quality. The FAO recommends some criteria for their classification and evaluation of their effect on soil and crops. The indices to classify the quality of groundwater for agricultural irrigation in the study region for the different flow systems are presented in
Figure 8,
Figure 9,
Figure 10,
Figure 11 and
Figure 12.
Quality of groundwater can be affected by the use of fertilizers and pesticides. The pumping of water, the drilling of wells, and agricultural and mining activities cause intermediate and regional flows to mix, causing high concentrations of arsenic, which constitutes a risk to the population’s water supply. Groundwater is also influenced by natural aspects, such as salinity (Cl−, SO42−, and Na+), redox conditions (Fe and Mn), age (F− and B), and geology (As).
In the study area, the largest amount of water that is extracted is used for agriculture (approximately 78%). In this region, there is a 41-year-old agricultural operation where inorganic fertilizers of the nitrogen type have been applied. It is observed that these they have not caused contamination of the aquifer, as the values are below the Mexican norm. In this study, in order to evaluate the irrigation suitability of water quality, the EC index of water is used to present the hazard of salinity [
69]. Most of the groundwater samples from this study area were categorized as good according to the EC for irrigation in the different flow systems in 2005 and 2015; however, in 2015 there was a stain with unsuitable values in the northwest region (
Figure 6).
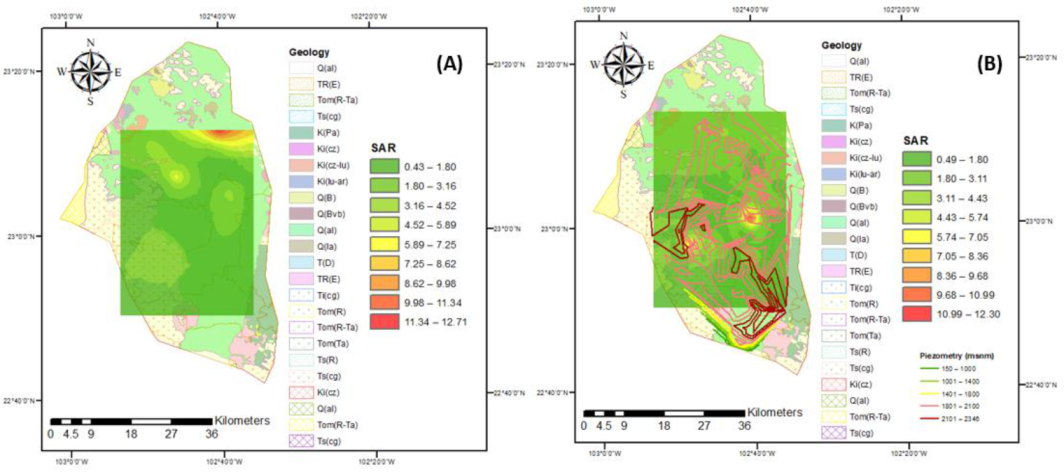
Almost all of the samples for the different flow systems and years belonged to the “excellent” category according to the criteria of the SAR, with some exceptions presented in red zones where samples belonged to the “good” category (
Figure 8). These results show the alkalization ability of the groundwater; in this case, high sodium ion content is not present, and, as such, it is very unlikely that the permeability of the soil is affected, thereby causing infiltration problems with the use of this water for irrigation.
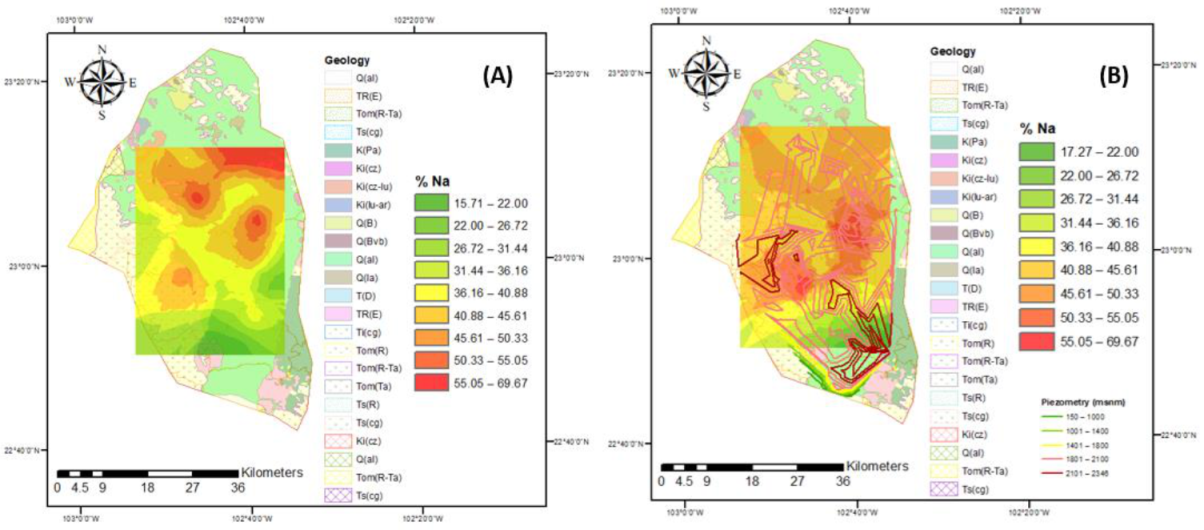
There has been an issue in regard to sodium percentage (%Na) since 2005, because most of the samples were classified as permissible and doubtful for agricultural use. This problem appears to worsen, increasing in the region with a high percentage of sodium in the aquifer, leaving in 2015 only a small area to the south with good values. This constitutes an important factor when determining groundwater quality for irrigational purpose, because excessive sodium content in groundwater could make the soil dense and impervious as a result of increasing the osmotic pressure and limiting the circulation of air and water to plants (
Figure 9).
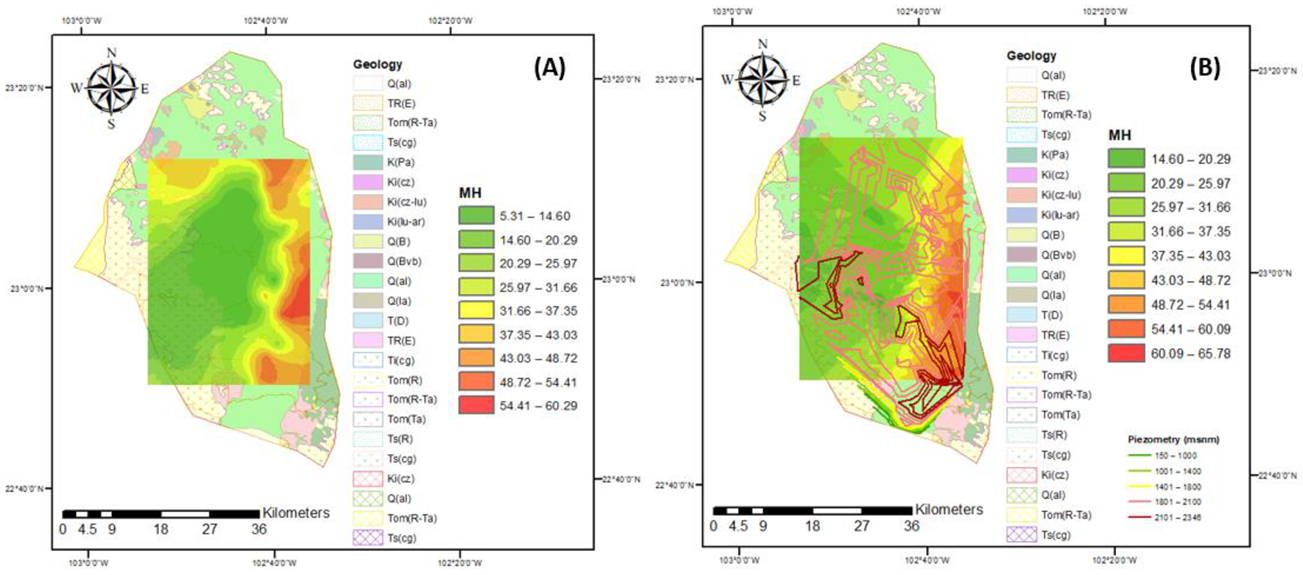
Figure 10 presents the values for the MH index in the aquifer, and most of the values present desirable concentrations; however, for both years, a strip to the east of the aquifer shows values belonging to the category of undesirable for this parameter (
Figure 10). These percentages indicate that there was an increase in magnesium content, with a greater number of wells affected in 2015. The magnesium hazardous (MH) ratio is an important parameter used to assess groundwater suitability for irrigation purposes, because high levels of Mg
2+ in groundwater exchange with Na
+ in soil. resulting in alkalization, which, consequently, decreases the crop productivity of plants.
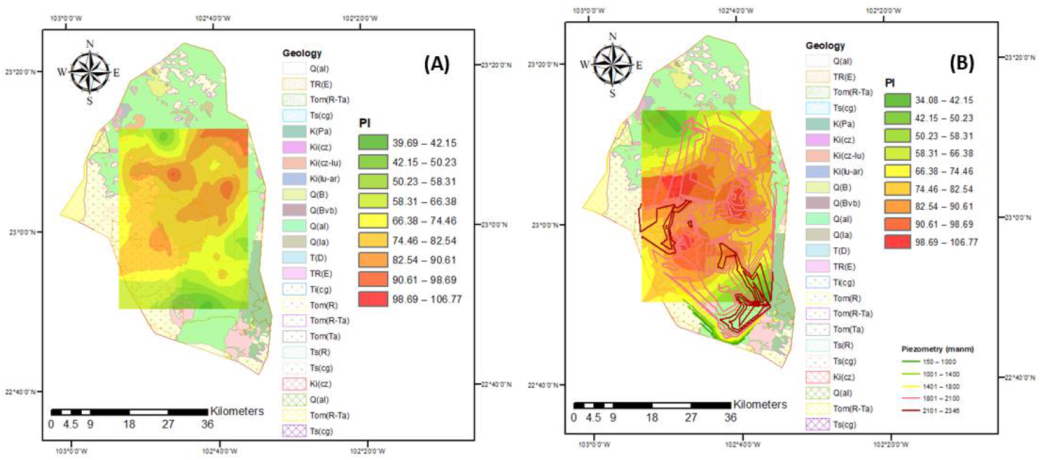
Through calculation and analysis, it was found that PI values in 2005 and 2015 for the different flow systems of the groundwater samples were in the “moderately suitable for irrigation” category; however, these values present a negative evolution through the years (
Figure 11). This implies that all of the groundwater sampling with the different flow systems were suitable for long-term agricultural irrigation purpose, displaying minimal influence on soil properties [
70]. Moreover, the cumulative presence of salts in huge amounts will not destroy the soil structure and reduce soil permeability, thereby allowing the water to be suitable for agricultural uses.
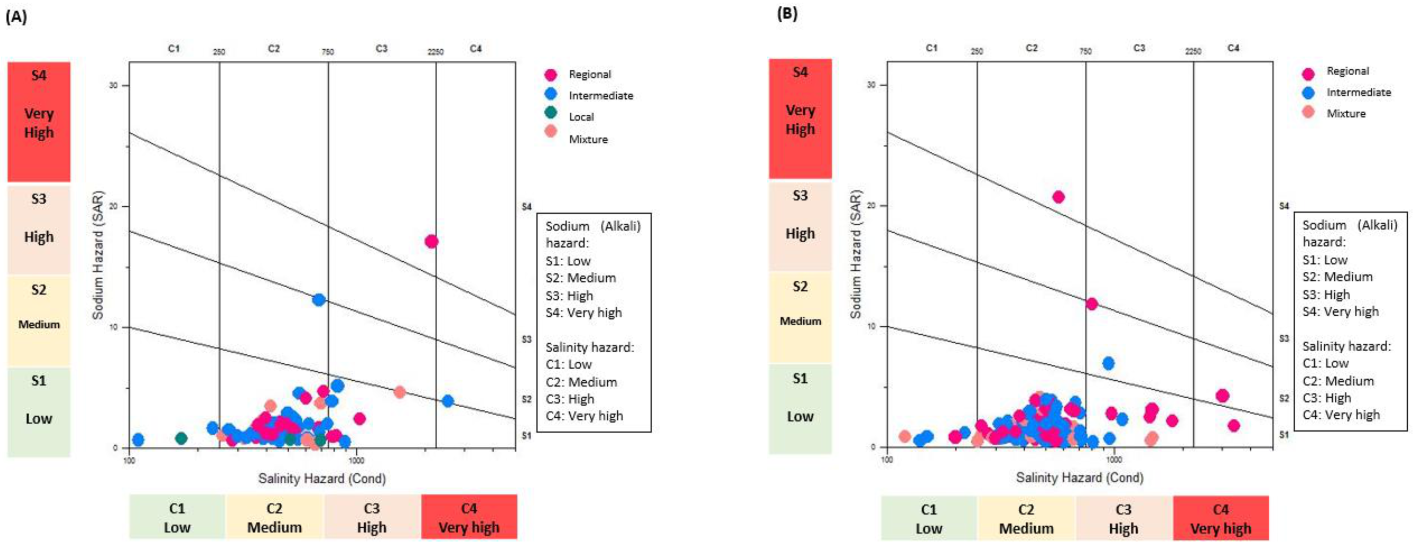
The relationship between electrical conductivity (EC) and SAR was identified by utilizing a Wilcox diagram to classify groundwater quality for irrigation purposes, as shown in
Figure 12. For both years (2005 and 2015), most of the samples were placed in the “C
2-S
1” category.
The electrical conductivity of water (C
2) indicates that some crops, such as vegetables, may present a decrease of 50% in their production, and some of them may not tolerate these concentrations of salt. As such, it is advisable in the aquifer regions to avoid cultivating these crops [
18]. However, an evolution is shown in 2015, as some samples are classified as C
3 and C
4, S
3, and S
4, mainly in the aquifer region, suggesting that crops tolerant to salinity and sodicity are established in these irrigated areas, perhaps as a result of comprehensive soil management to avoid accumulation of salts.
The United States Salinity Laboratory (USSL) diagram has been used to study the quality of groundwater suitability for irrigation purposes [
69]. As shown in
Figure 12, the majority of the samples for both years fell into the C
2−S
1 (medium salinity with low sodium hazard) category, where using groundwater for irrigation would not produce sodium damage, and according to the Wilcox diagram, a large number of water samples were within the good-to-excellent category.
Not much attention has been paid to As exposure via food, especially rice and vegetables, which have been reported to contain high inorganic As concentrations in areas with elevated As in soil and irrigation water. Human exposure to As in contaminated regions may be very high due to the high As concentrations in groundwater (drinking and cooking water), and its high content in local agricultural produce is also likely. Plant uptake of As may be high on land irrigated with contaminated groundwater, thus illustrating the importance of establishing a good monitoring of the quality of water, not only for drinking purposes but also for irrigation in agriculture. The risk of arsenicosis is clearly the highest for disadvantaged persons, often women and children in poor families, due to inadequate food and nutrient intake [
71,
72].
3.4. Bivariate Data Analysis
The BiDASys software was used to process the data and find correlations between different parameters [
53]. An uncertainty weighted least-squares linear regression (UWLR) for arsenic and other parameters was conducted (
Figure 13,
Figure 14 and
Figure 15). According to Pearson (1896), correlation analysis is used to quantify and set up connections between two factors. The correlation coefficient of less than 0.5 represents low correlation, 0.5 signifies good correlation, and more than 0.5 denotes significant correlation. A solid link between two factors is displayed by a high correlation coefficient (close to +1 or −1), while a correlation coefficient of about zero represents that there is no relationship. Based upon the correlation coefficient “r”, the relationship between two parameters designed on an XY scatter diagram can be determined to be positive or negative [
73].
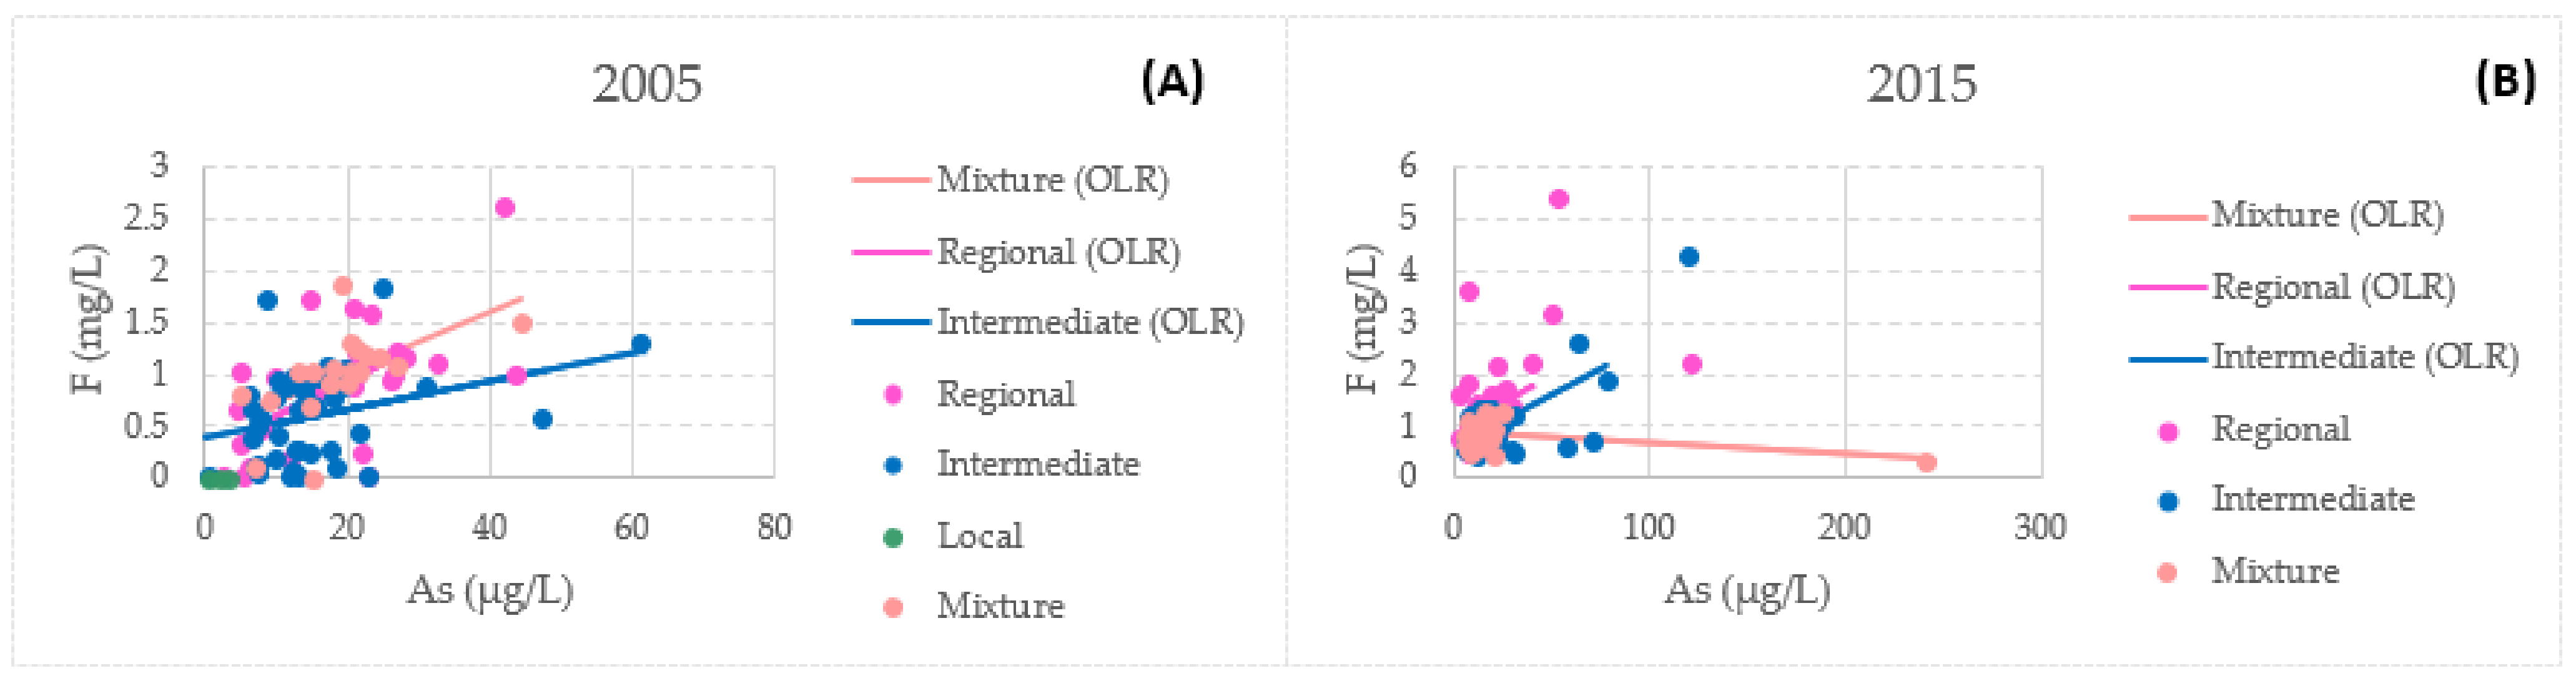
It has been reported that arsenic and fluoride co-occur, but this does not necessarily imply a positive correlation between the two contaminants. The key influencers of the strength of the co-occurrence are seasonality, environment, and climatic conditions. Moreover, existing primary ion and dissolved organic matter also affect the release and enrichment of As-F in the aquifer system [
74,
75,
76]. In this study, there is a correlation between these elements: in 2005, for arsenic and fluoride, mixed flow presented the highest correlation coefficient of all of the flows at 0.8004; on the other hand, the highest correlation coefficient in 2015 was for regional flow at 0.7135.
Figure 13 presents the relationship between fluoride and arsenic in the present study. High salinity, along with the presence of high As and F concentrations in irrigation waters, constitutes a strong limitation for agricultural productivity that can lead to a decrease in sensitive crop yields [
76].
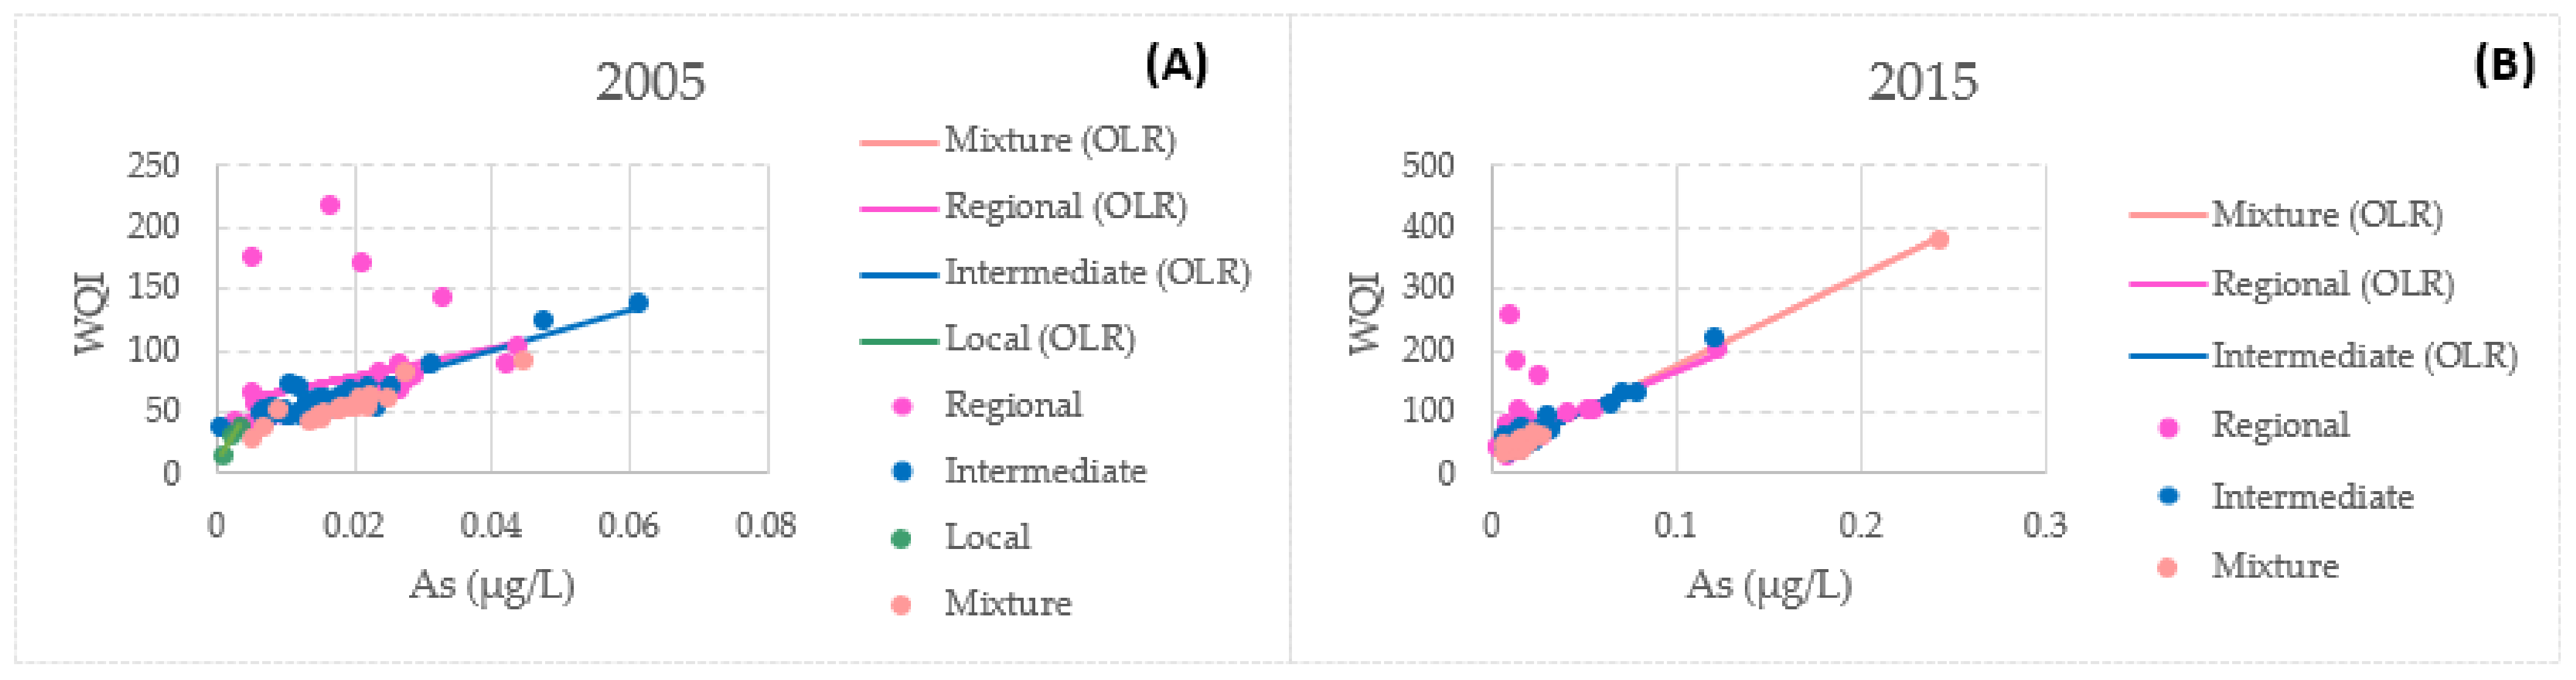
There is a correlation between the water quality index and arsenic concentrations. The mixed flow presented the highest correlation coefficients of all of the flows for both 2005 and 2015 at 0.9880 and 0.9972, respectively.
Figure 14 presents the relationship between the WQI and arsenic in the present study.
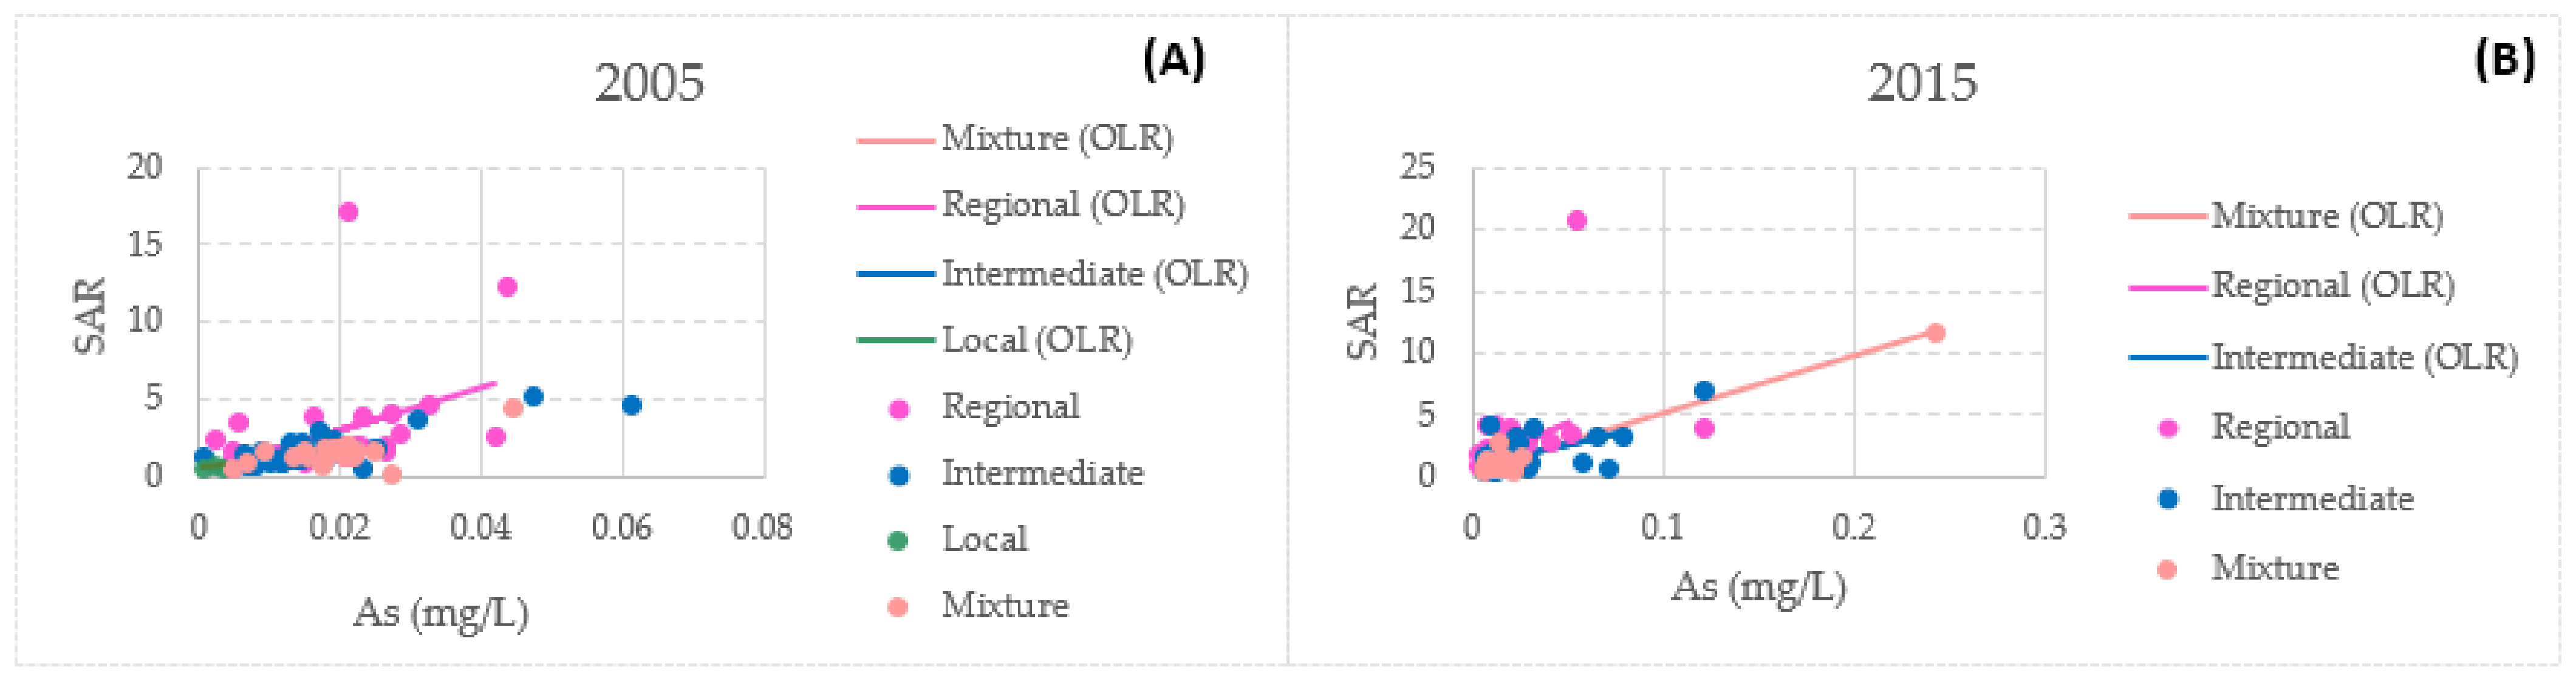
There is a correlation between SAR and arsenic. In 2005, intermediate flow presented the highest correlation coefficient of all of the flows at 0.7182. On the other hand, the highest correlation coefficient in 2015 was observed for mixed flow at 0.9930.
Figure 15 presents the relationship between these parameters in the present study.
Because there is a correlation between the calculated parameters—the WQI and the SAR—this reinforces the findings and scientific contribution of this research in terms of the importance of monitoring and studying these polluting elements for the health of the population.


 ,
, 


