1. Introduction
Handgrip strength (HGS) data have been widely used in many fields. The measurement of grip strength is recommended by the World Health Organization (WHO) for the International Classification of functioning, disability, and health (ICFDH) [
1]. Furthermore, physicians and researchers on aging have diagnosed some sarcopenia cases by grip strength. In addition, epidemiologists and physicians in public health and preventative medicine use the value of grip strength to predict the mortality of the elderly population [
2,
3,
4,
5,
6,
7]. Physical therapists and scientists determine the effectiveness of rehabilitation by measuring grip strength [
8,
9]. Handgrip strength tests were also used to determine the effects of interventions on strength levels in young athletes [
10]. Furthermore, ergonomists, industrial engineers/designers, and industrial hygienists design and select appropriate hand tools and products to ensure the safety of manual tasks based on grip strength. Therefore, discovering the norm of grip strength for the general population has been done previously by researchers, physicians, physical therapists, and ergonomists [
3,
4,
6,
7,
11,
12,
13,
14,
15,
16,
17,
18,
19,
20,
21,
22,
23,
24,
25,
26,
27,
28,
29,
30,
31]. In addition, there are two novel studies that measure and mention handgrip strength in children and haemodialysis patients [
32,
33].
Apart from the grip strength, there are other types of hand exertions existing in our daily lives or working environments [
34,
35,
36,
37,
38]. For example, Shoorlemmer and Kanis showed that there were 11 types of hand exertions when interacting with controls, e.g., pinching, pressing, rotating, etc. [
37]. Shaub et al. (2015) conducted a project and showed the eight types of most frequently used hand exertions in car and truck assembly plants in EU countries [
36,
39]. Furthermore, measurement of pinch strength has been done previously [
15,
16,
18,
19,
20,
24,
26,
27,
28,
40]. However, there were few studies measuring the thumb press, palm press, ball of thumb, or index finger press [
29,
39].
To build normative data on hand exertions, standard-testing procedures should be followed. Chaffin (1975) proposed an ergonomic guide on how to measure and report human strength [
41]. The American Society of Hand Therapists (ASHT) proposed recommendations for the procedures and postures used to measure grip strength and three types of pinch strength [
42]. Both guides recommend that measurements be taken three times on each hand to get valid and reliable data. Chaffin (1975) also recommended that experimenters should provide at least 2 min between testing trials to avoid muscle fatigue, if the total testing trials exceed 15 trials in one session [
41]. In addition, a possible novel approach for measuring grip strength could be through smartphones or similar novel technologies since mobile phones are popular ways for measuring strength in different populations [
43,
44,
45]. Moreover, in the application of normative data for evaluations and treatments, there are some demographic and anthropometric factors that should be considered. Demographic factors include age, gender, race, occupation, hand dominance, socioeconomic situation, nutrition, lifestyle, etc. Anthropometric variables include height, weight, body mass index, hand width, hand length, waist circumference, etc. It is hard to recruit study participants while measuring all the anthropometric variables described above because of the time constraints. Therefore, researchers attempted to propose models by applying these demographic and anthropometric variables to predict the grip strength and pinch strength more easily and accurately [
11,
13,
14,
15,
16,
17,
18,
19,
20,
21,
22,
23,
24,
46,
47,
48,
49,
50,
51].
To follow the standard procedures of hand strength tests proposed by previous studies either using traditional measures or advanced technology, has a long testing duration. The testing duration increases as the number of trials of hand exertions to be measured increases. A long testing duration not only decreases the motivation of study participants but also results in localized muscle fatigue, which may affect the results. For example, Schaub et al. (2015) measured eight different types of finger‒hand forces used by the workers at several major European vehicle and trunk manufacturing companies [
39]. Lo et al. (2019) also reported five types of hand exertions used by Taiwanese workers in manufacturing industries [
29]. The test duration for one session was 1 h or longer. The numbers of hand exertions were 15 or more. The best solution to solve the problem of long testing periods is to divide them into two sessions. However, this may create another problem in that study participants may withdraw from the study. Another method is to propose a prediction model, considering not only demographic and anthropometric variables, but also the types of hand exertions. Previous studies focused on either grip strength or pinch strength [
11,
12,
13,
14,
15,
16,
17,
18,
19,
20,
21,
22,
23,
24,
46,
47,
48,
49,
52]. Sung et al. (2015) developed grip and key pinch strength prediction models using the regression method and artificial neural networks (ANN) and found that there were no significant differences between the two models [
16]. To the best of our knowledge, there are no studies investigating the relationship between grip strength, pinch strength, and press strength of finger‒hand exertions. Therefore, the purpose of this study is to propose models to predict different types of hand strength using grip strength.
2. Materials and Methods
2.1. Study Participants
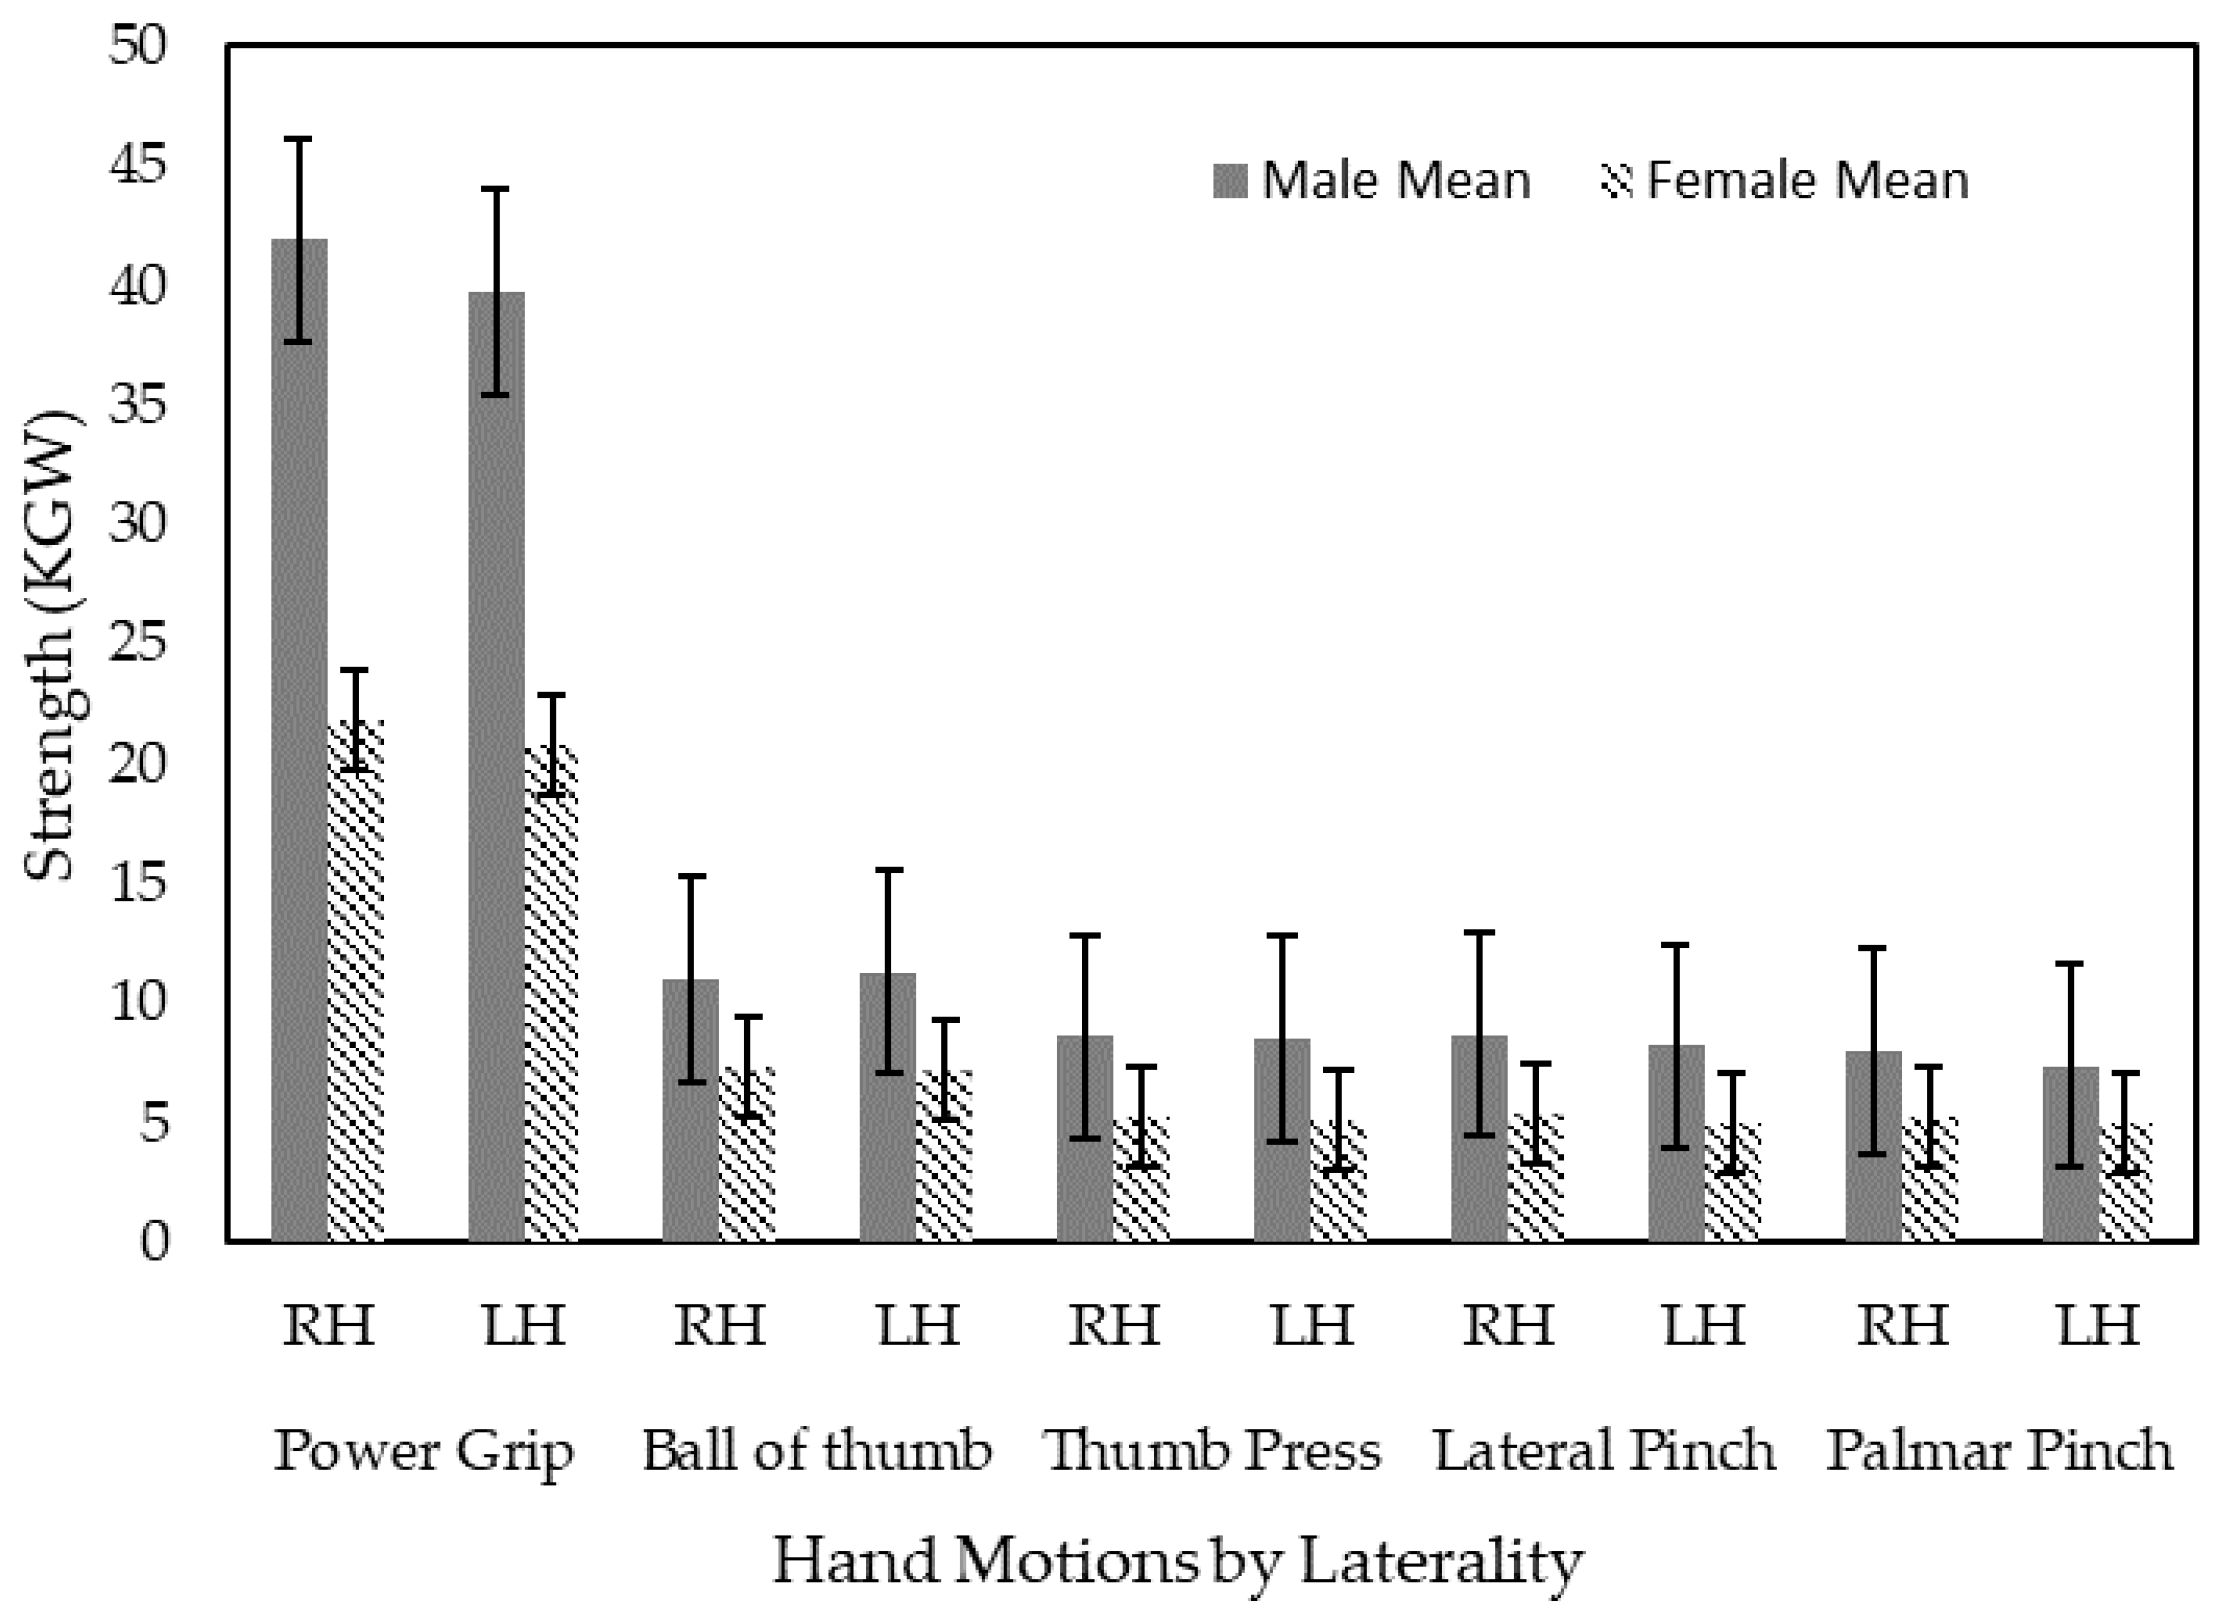
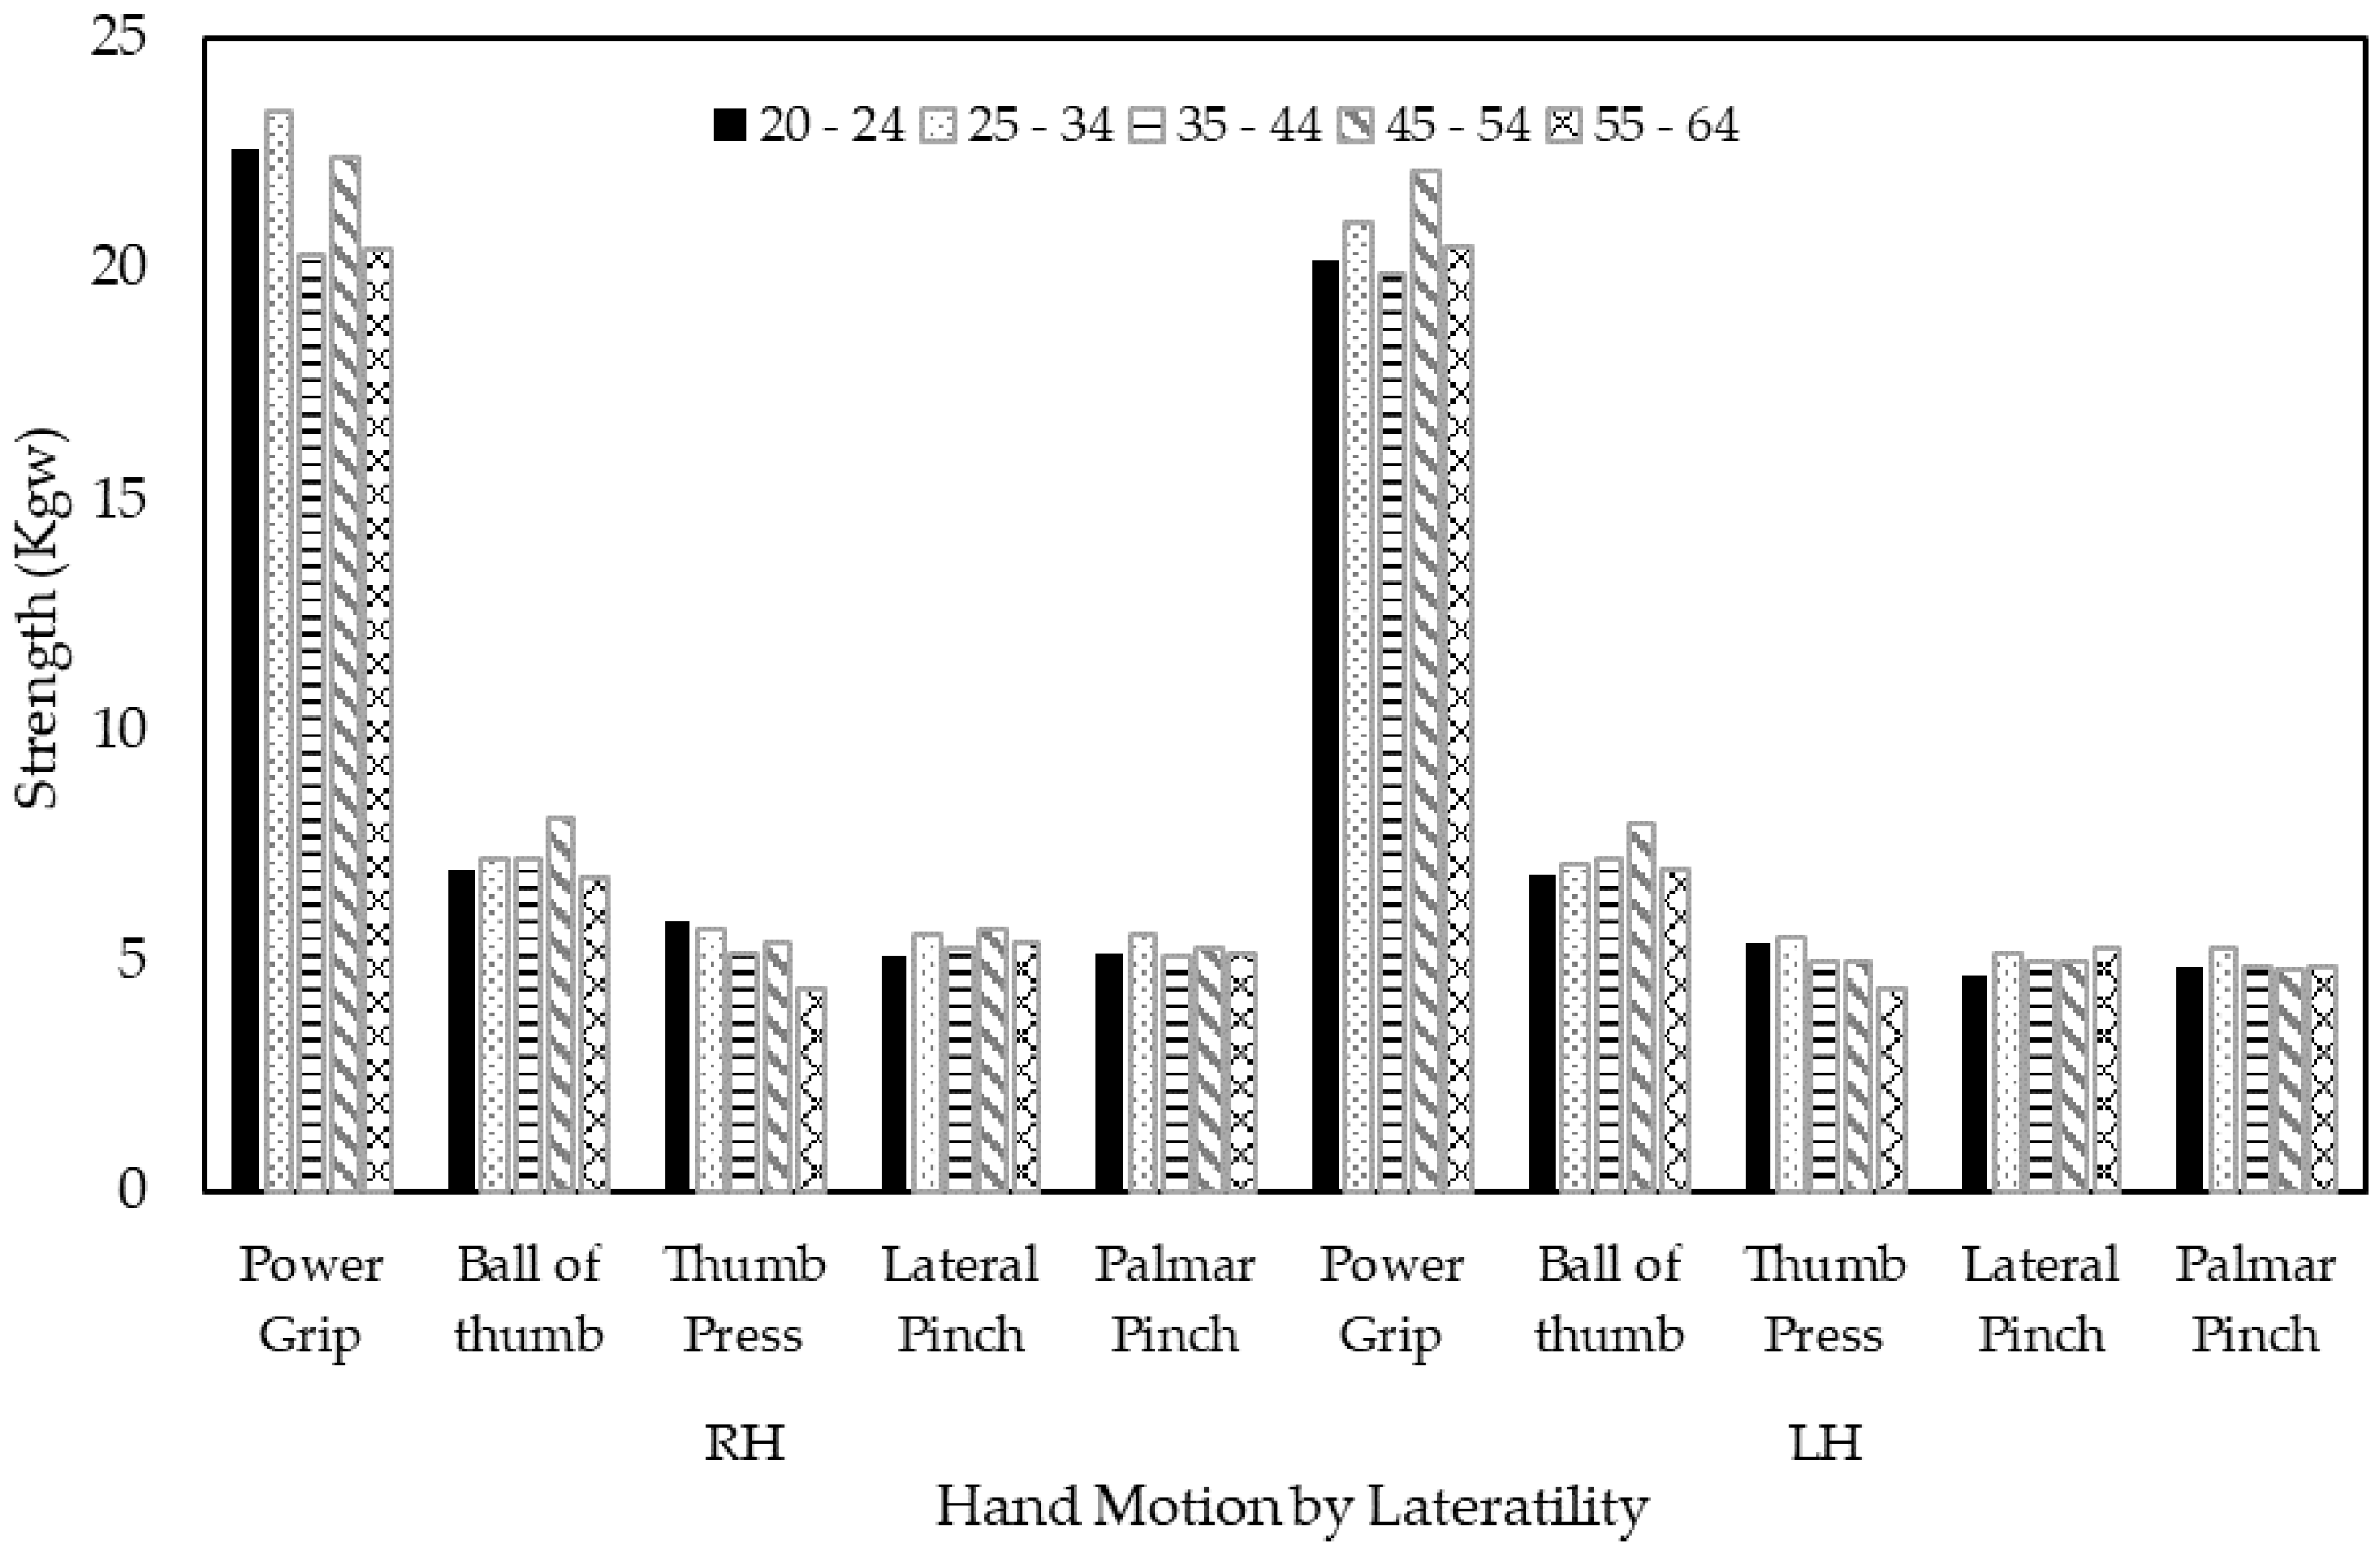
A convenient sample of 198 healthy volunteers recruited from the manufacturing industries in Central Taiwan participated in this study. The sampling strategy and recruitment procedures are detailed elsewhere [
29]. All volunteers were free of any diagnosed disorders, diseases or pain in the upper extremities in the past six months. In addition, they had no known diseases that may affect hand strength, such as rheumatoid arthritis or heart disease. When the volunteers sent emails or called for participation, the experimenter checked for those exclusion criteria and informed these volunteers that they could not drink caffeine or tea, and perform strenuous work one day before the study date if they were qualified to participate the study. These volunteers were distributed into five age groups of 20–25, 25–34, 35–44, 45–54, and 55–64 years with 32, 48, 48, 38, and 32 volunteers, respectively. All study volunteers received information regarding the study purposes, procedures, and data security process and signed the informed consent forms, approved by the Research Ethics Committee at China Medical University and Hospital (CMUH106-REC2-156), before participating in the study. There was no sex difference in terms of age (
p = 0.974). The mean age was 39.1 years. There were significant sex differences in terms of height, weight, body mass index (BMI), and handspan. Detailed demographic and anthropometric information is given in
Table 1.
2.2. Types of Hand Motions
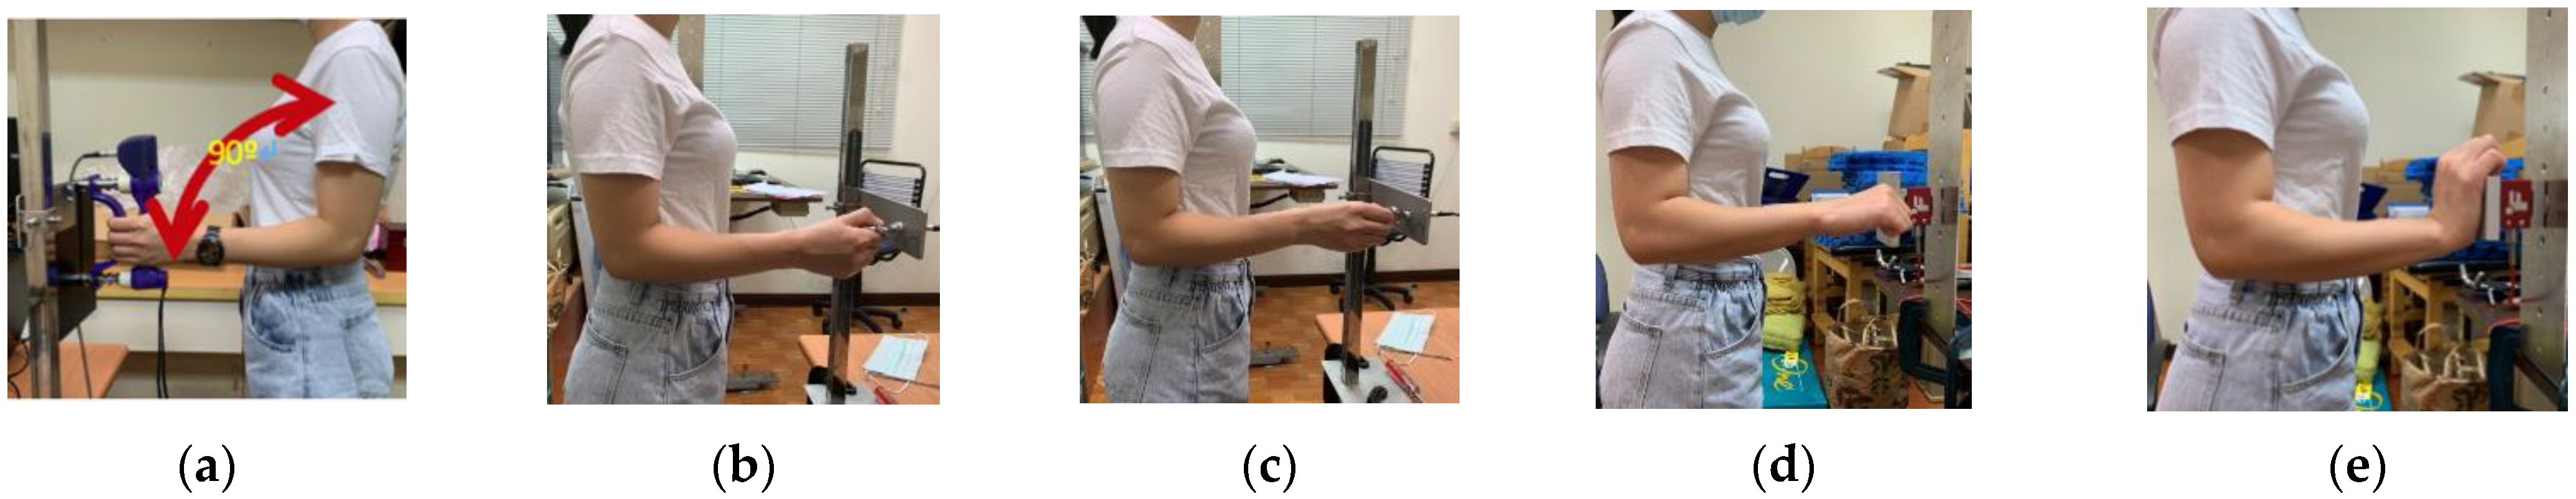
There are five different types of hand motions that are frequently used in the automotive and home appliance facilities in the manufacturing industry [
39]. The five types of hand motions are power grip, lateral pinch, palmar pinch (3-jaw chuck pinch), thumb press, and ball of thumb press. The tests of these hand motions followed the instructions of Shaub et al. (2015) and Mathiowetz et al. (1984) [
36,
53], and are shown in
Figure 1a–e, respectively. The posture of the shoulders and upper limbs for the power grip and two types of pinch exertions followed the guidelines recommended by the American Society of Hand Therapists (i.e., a standing position, instead of a sitting position). Volunteers stood upright and relaxed their shoulders. Their elbows flexed at 90° and the forearms were in a neutral position. For the two pressing tasks, volunteers’ elbows flexed at 90°, the forearms pronated at 90°, and the wrists were in a neutral position for the thumb press (
Figure 1d) or flexed at 90° for the ball of thumb press (
Figure 1e).
2.3. Equipment
A standardized digital handgrip dynamometer (G200, Biometrics, Ltd., Ynysddu, UK) was used to measure the power grip strength. The grip span ranged from 3.4 to 8.6 cm at 1.3 cm increments and the experimenter set the grip span based on the results of the study conducted by Ruiz et al. (2006) [
54]. A digital pinchmeter (P200, Biometrics, Ltd., Ynysddu, UK) was used to measure lateral and palmar pinch strength. Both the grip dynamometer and pinchmeter were connected to a 16-channel BIOPCA MP 150 system (BIOPAC System, Inc., Goleta, CA, USA) via a general-purpose transducer amplifier (DA 100C, BIOPAC System, Inc., Goleta, CA, USA) for data acquisition and analysis. The sampling rate was 1000 Hz.
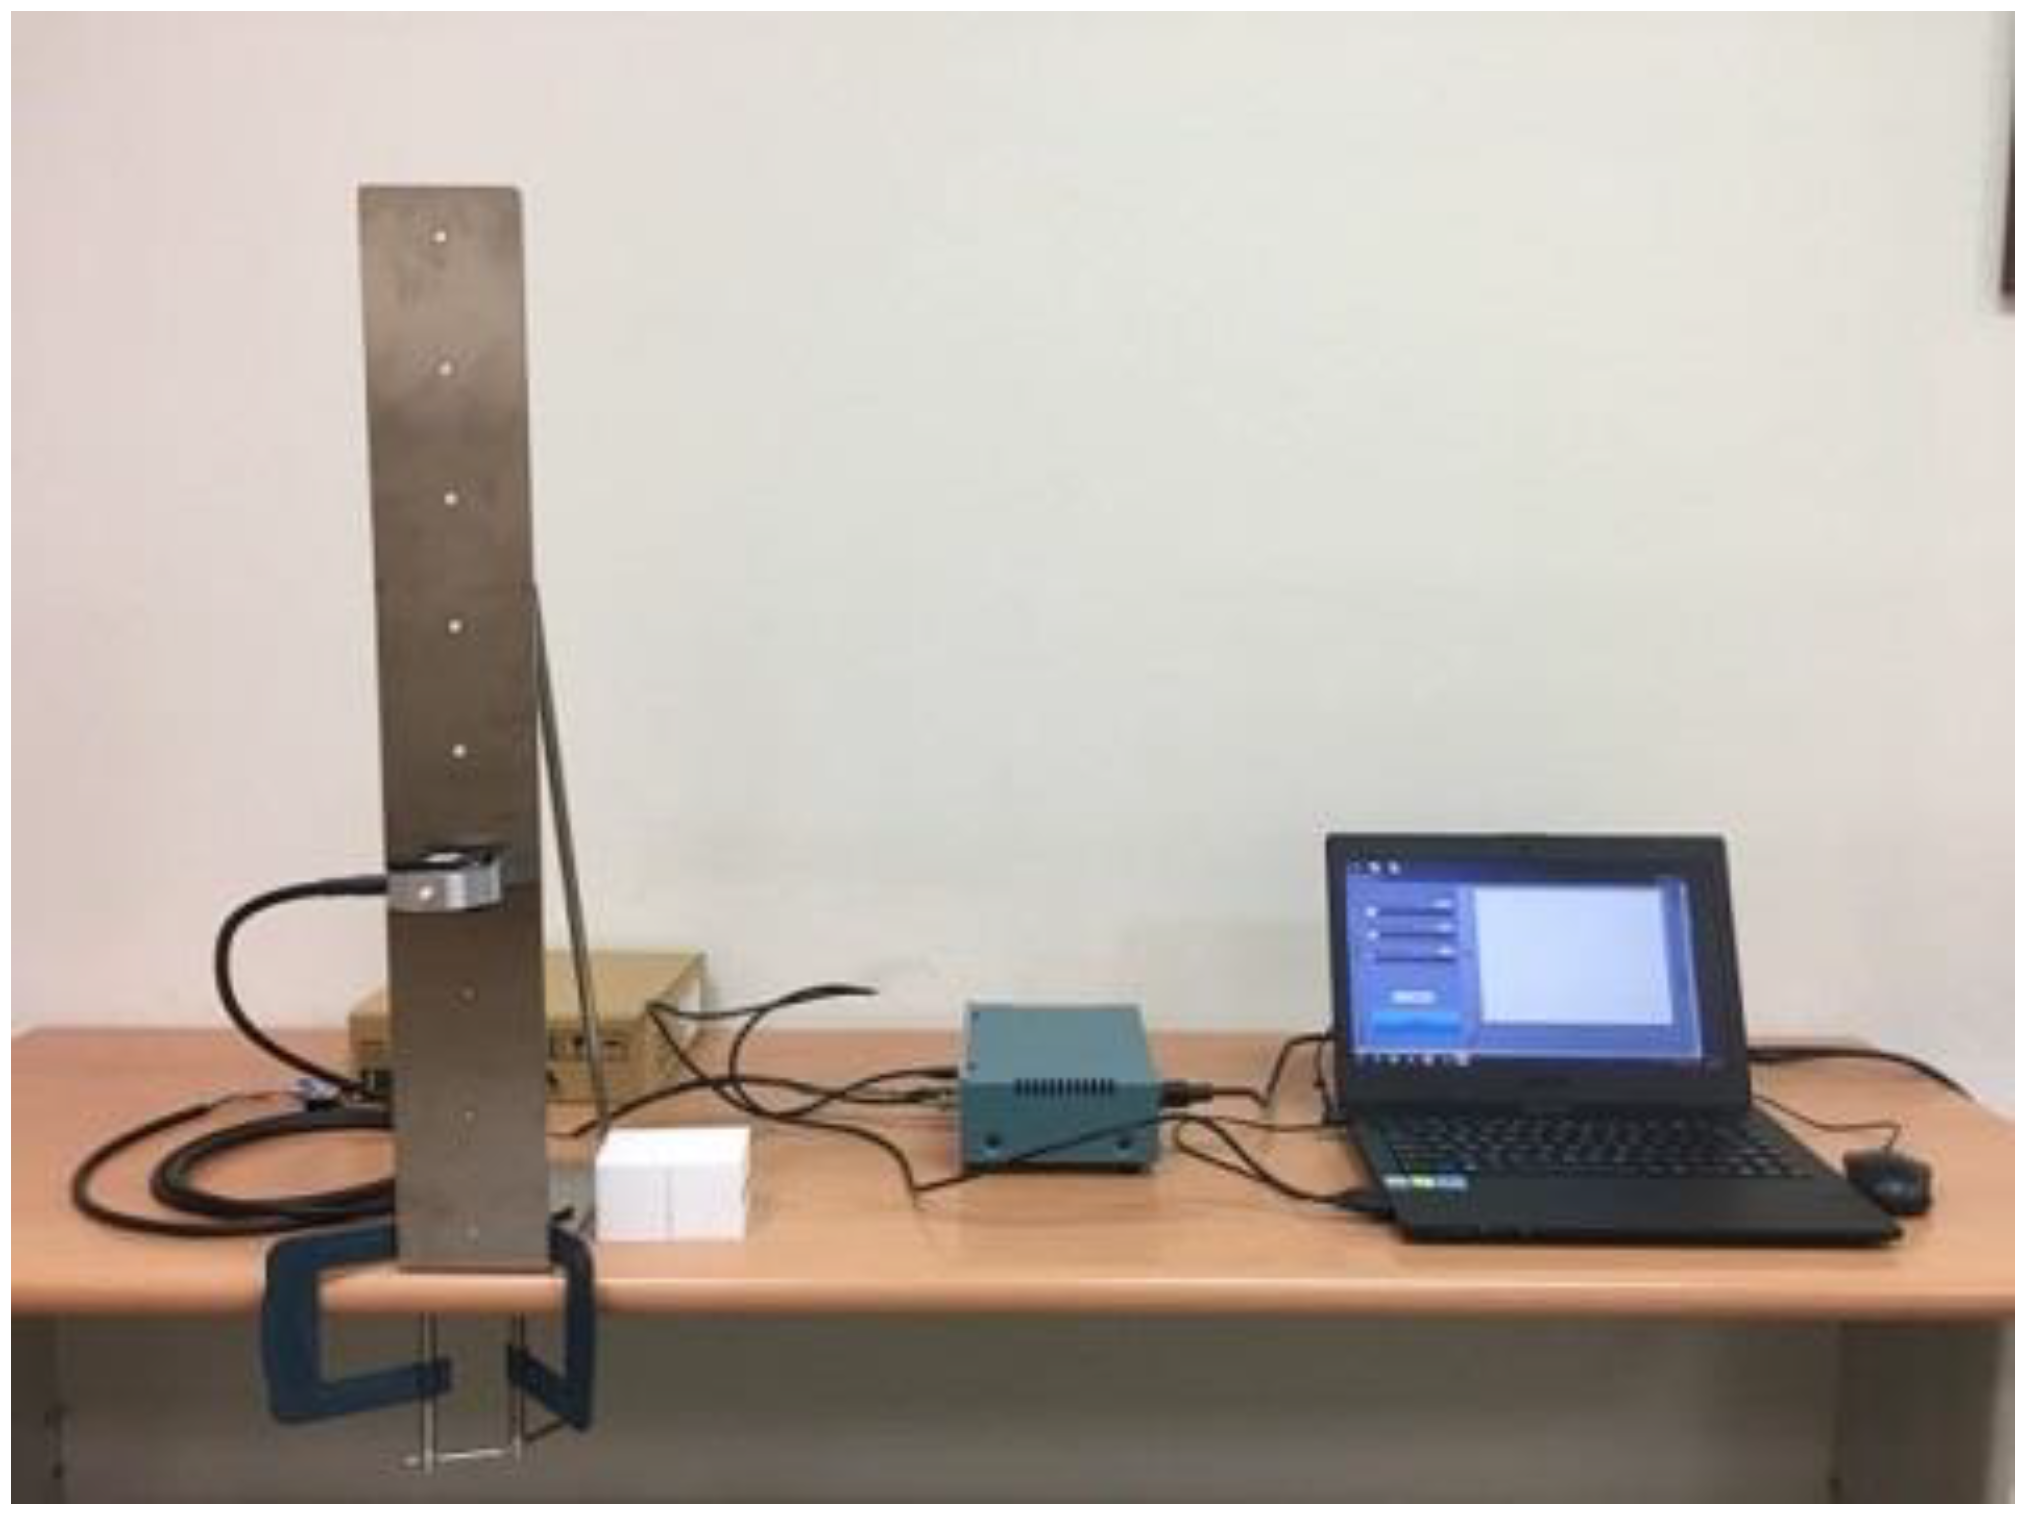
Customized devices were designed to measure the strength of two types of press, the thumb press and ball of thumb (
Figure 1d,e). A square of Teflon was attached to a S-Beam load cell (LSB302, Futek Advanced Sensor Technology, Inc., Irvine, CA, USA) and secured to a piece of L-shape stainless steel (20 cm Length × 10 cm width × 70 cm height) with a screw. There were 8 holes in the L-shape stainless steel starting from 3 cm above the base with a distance of 8 cm in between in order to adjust the height of the load cell (
Figure 2). Signals were sent to a customized four-channel data acquisition box (NI DAQ USB-6002, National Instruments, Austin, TX, USA) and software written in LabVIEW (National Instruments, Austin, TX, USA) recorded the signals at a sampling rate of 100 Hz. Before the experiment started each day, the experimenters used the standard weights of 2 kg and 10 kg to calibrate the grip dynamometer, the pinchmeter, and load cells.
A questionnaire was designed to record demographic and anthropometric information, including participants’ name, age, gender, medical history (checking for the exclusion criteria), health conditions (pain or soreness), hand dominance, job information, height, weight, and handspan. A Martin-type anthropometer was used to measure the participants’ handspan, defined as the maximum distance from the tip of the thumb to the tip of the small finger with the hand open as wide as possible.
2.4. Procedures
When volunteers arrived, the experimenter asked questions related to demographic information, medical history, and health conditions, and then explained the instructions and procedures to the participant. If the volunteers did not have any questions, they signed the informed consent, and then started the experiment. Volunteers were instructed to exert their maximum force within 1–2 s in a standing position and maintained the force for at least 3 s until the experimenter said to stop [
36]. Each type of hand motion was repeated three times. The mean of the 3 s data points represented the maximum strength of a specific trial. The average of three strength scores was used as the maximum strength for a specific type of hand motion. After the volunteers completed the three trials of a specific hand motion, the experimenter calculated the coefficient of variation (CV) to ensure the data quality (Equation (1)). If the CV was greater than 10%, the participant did it again until the CV was less than 10%. A minimum rest period of 3 min was provided between two repetitions. It took about 1 h to complete the experiment. For detailed information, please refer to our previous article [
26].
where:
σ—the standard deviation
μ—the mean.
2.5. Statistical Analysis
The mean, standard deviation, and/or percent was used to present the demographic and strength data. Repeated measures ANOVA were used to determine the main effects and their interactions with age and type of hand motions. Bonferroni correction was used for post hoc analysis. Pearson correlation was conducted to determine the linear correlation between the variables. A p-value < 0.05 was used to determine statistical significance.
Regression analysis was used to explore the multivariate relationship of force pattern, gender, height, weight, and age to find a predictive model of muscle strength. In the regression equation, gender and age were the strongest related factors. We used the linearity, second-order interaction, and reverse curve of the dependent variable to calculate the curve fit of the two variables, and find the best one of each single factor that explained the maximum variance. We used XLSTAT software to perform the correlation of the second-order interaction items. Next, we combined all the single best fits into the stepwise multiple regression method to find the largest explanatory variance. Entry and removal probabilities were set at 0.05 and 0.10, respectively. The SPSS Chinese version 22.0 (IBM Corporation, Armonk, NY, USA) was used for statistical analyses.


