
Spatial-Temporal Evolution and Driving Forces of Drying Trends on the Qinghai-Tibet Plateau Based on Geomorphological Division

 , ,
, ,  ,
,
Abstract
:1. Introduction
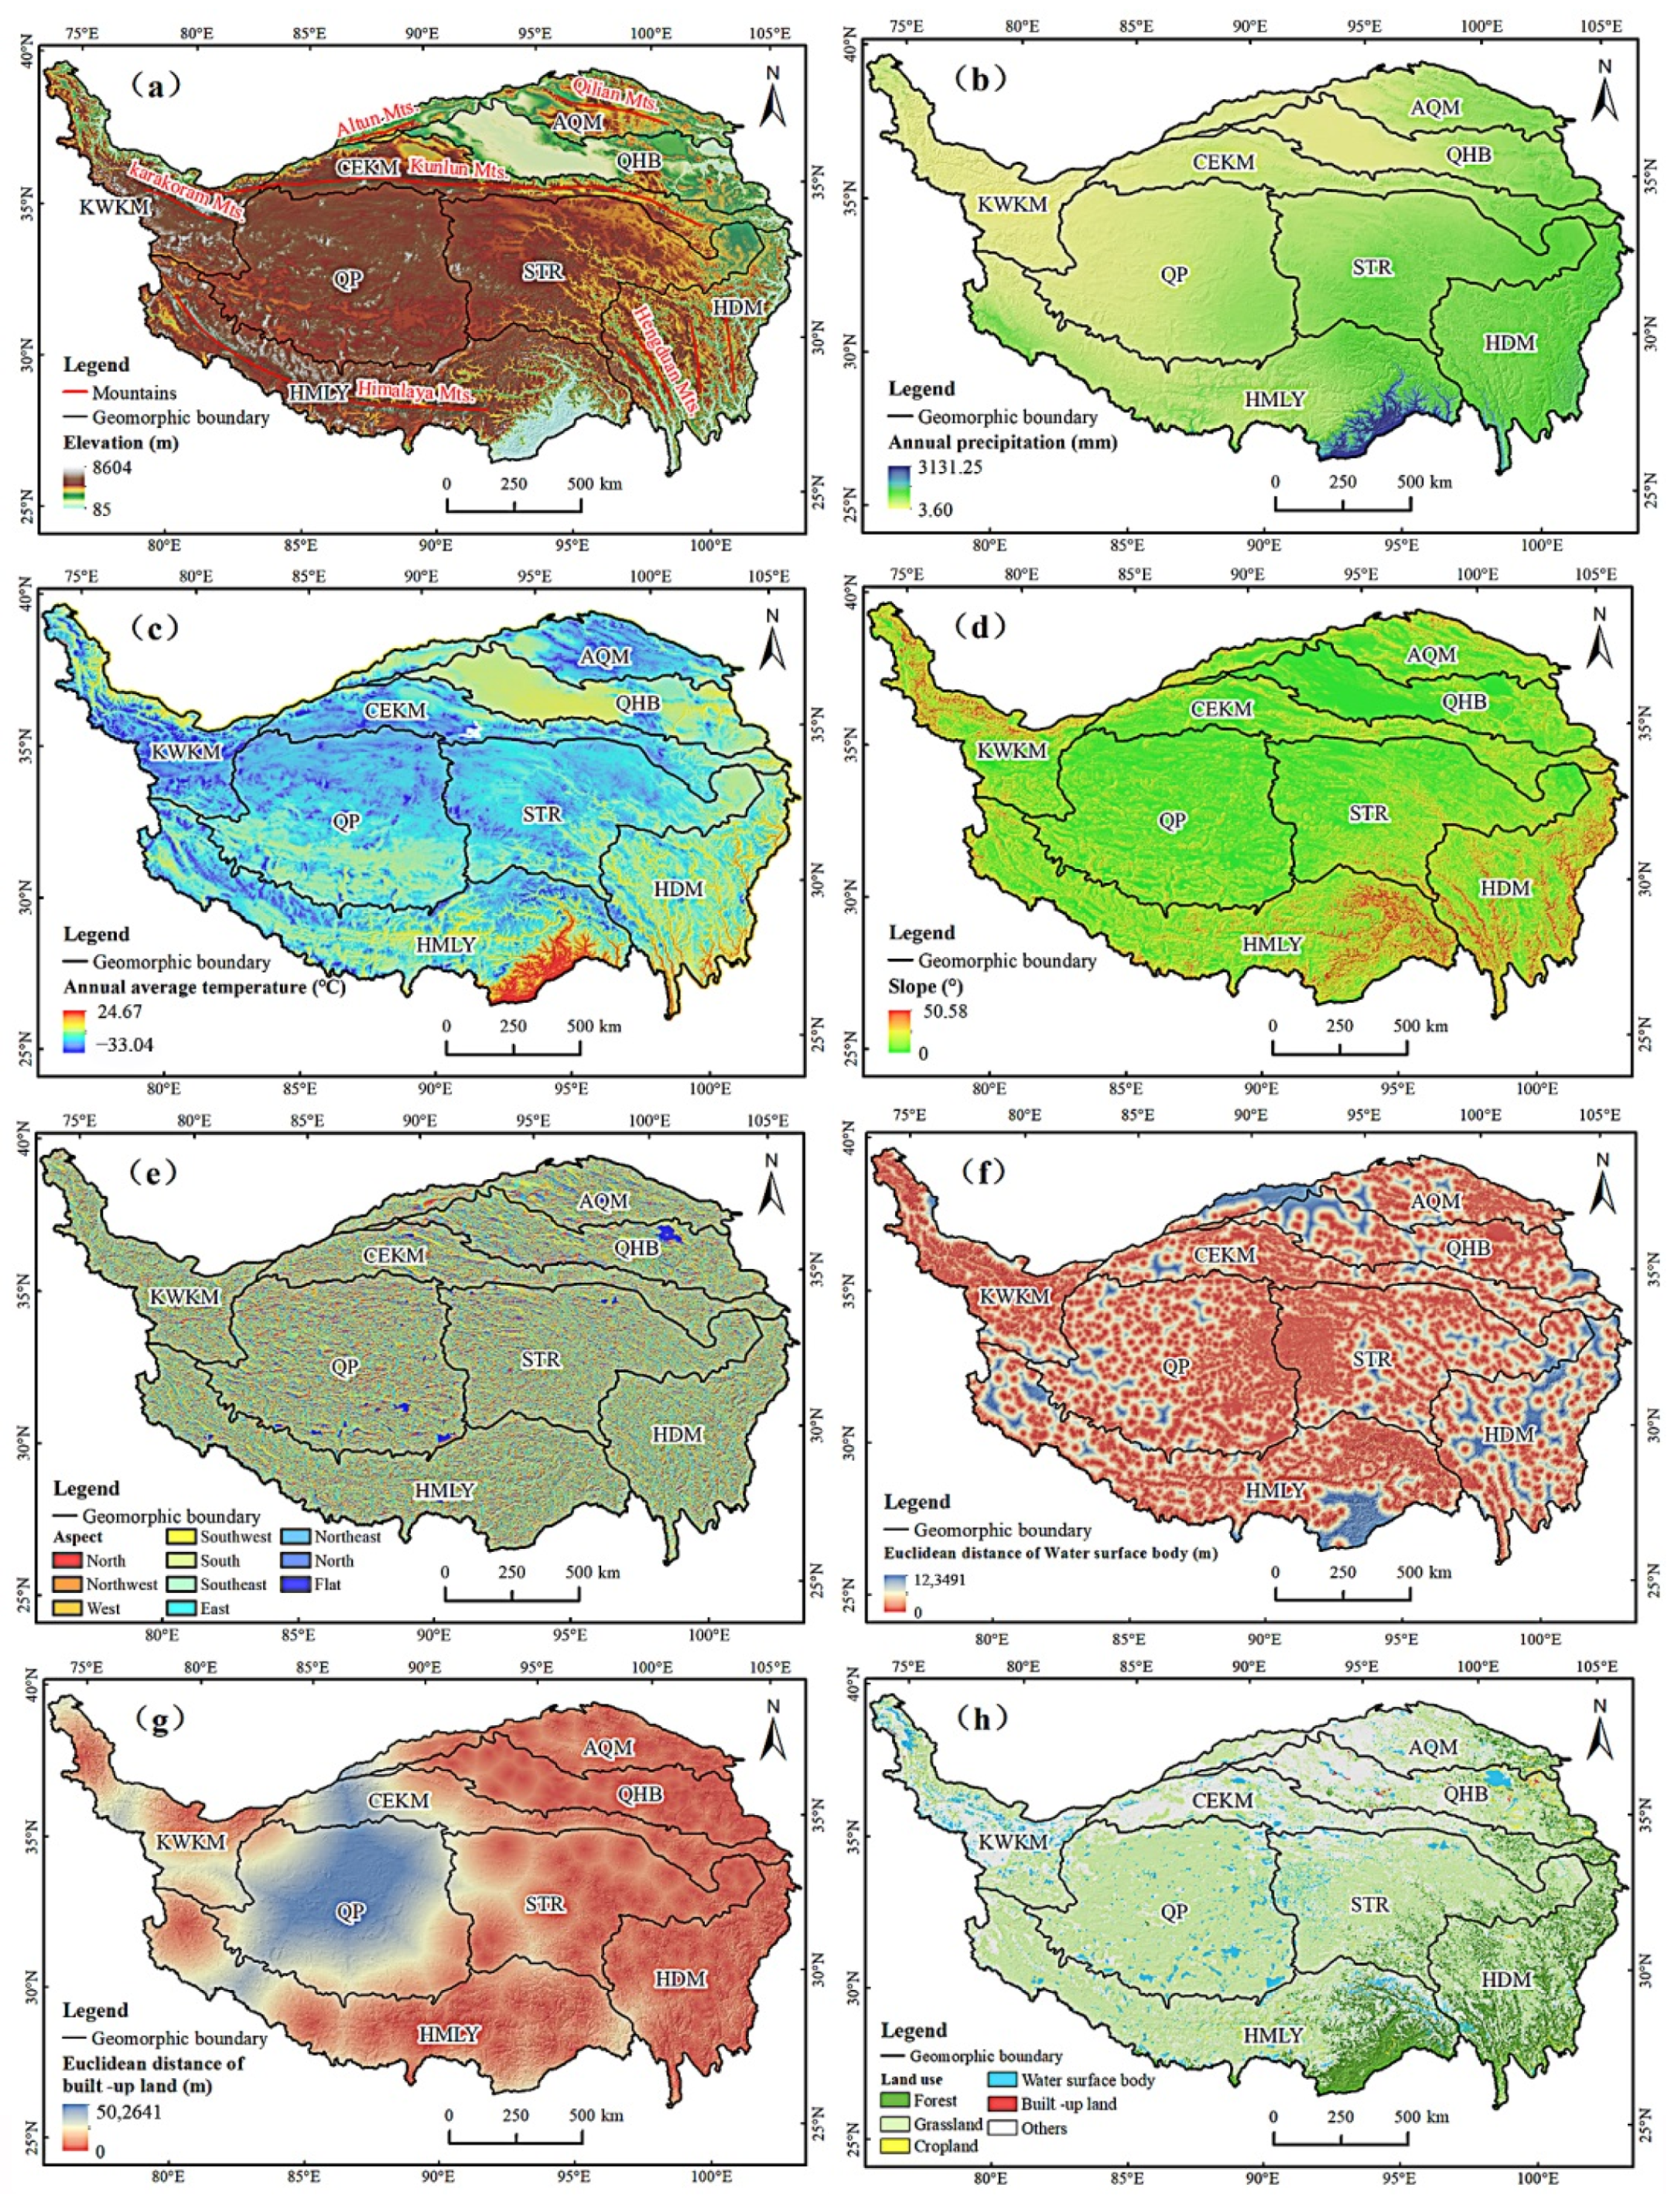
2. Study Area
3. Materials and Methods
3.1. Materials
3.1.1. MODIS Data
3.1.2. Soil Moisture Data
3.1.3. Driving Factors
3.2. Method
3.2.1. TVDI Calculation
3.2.2. Correlation Analysis
3.2.3. Linear Trend Analysis
3.2.4. Random Forest Algorithm
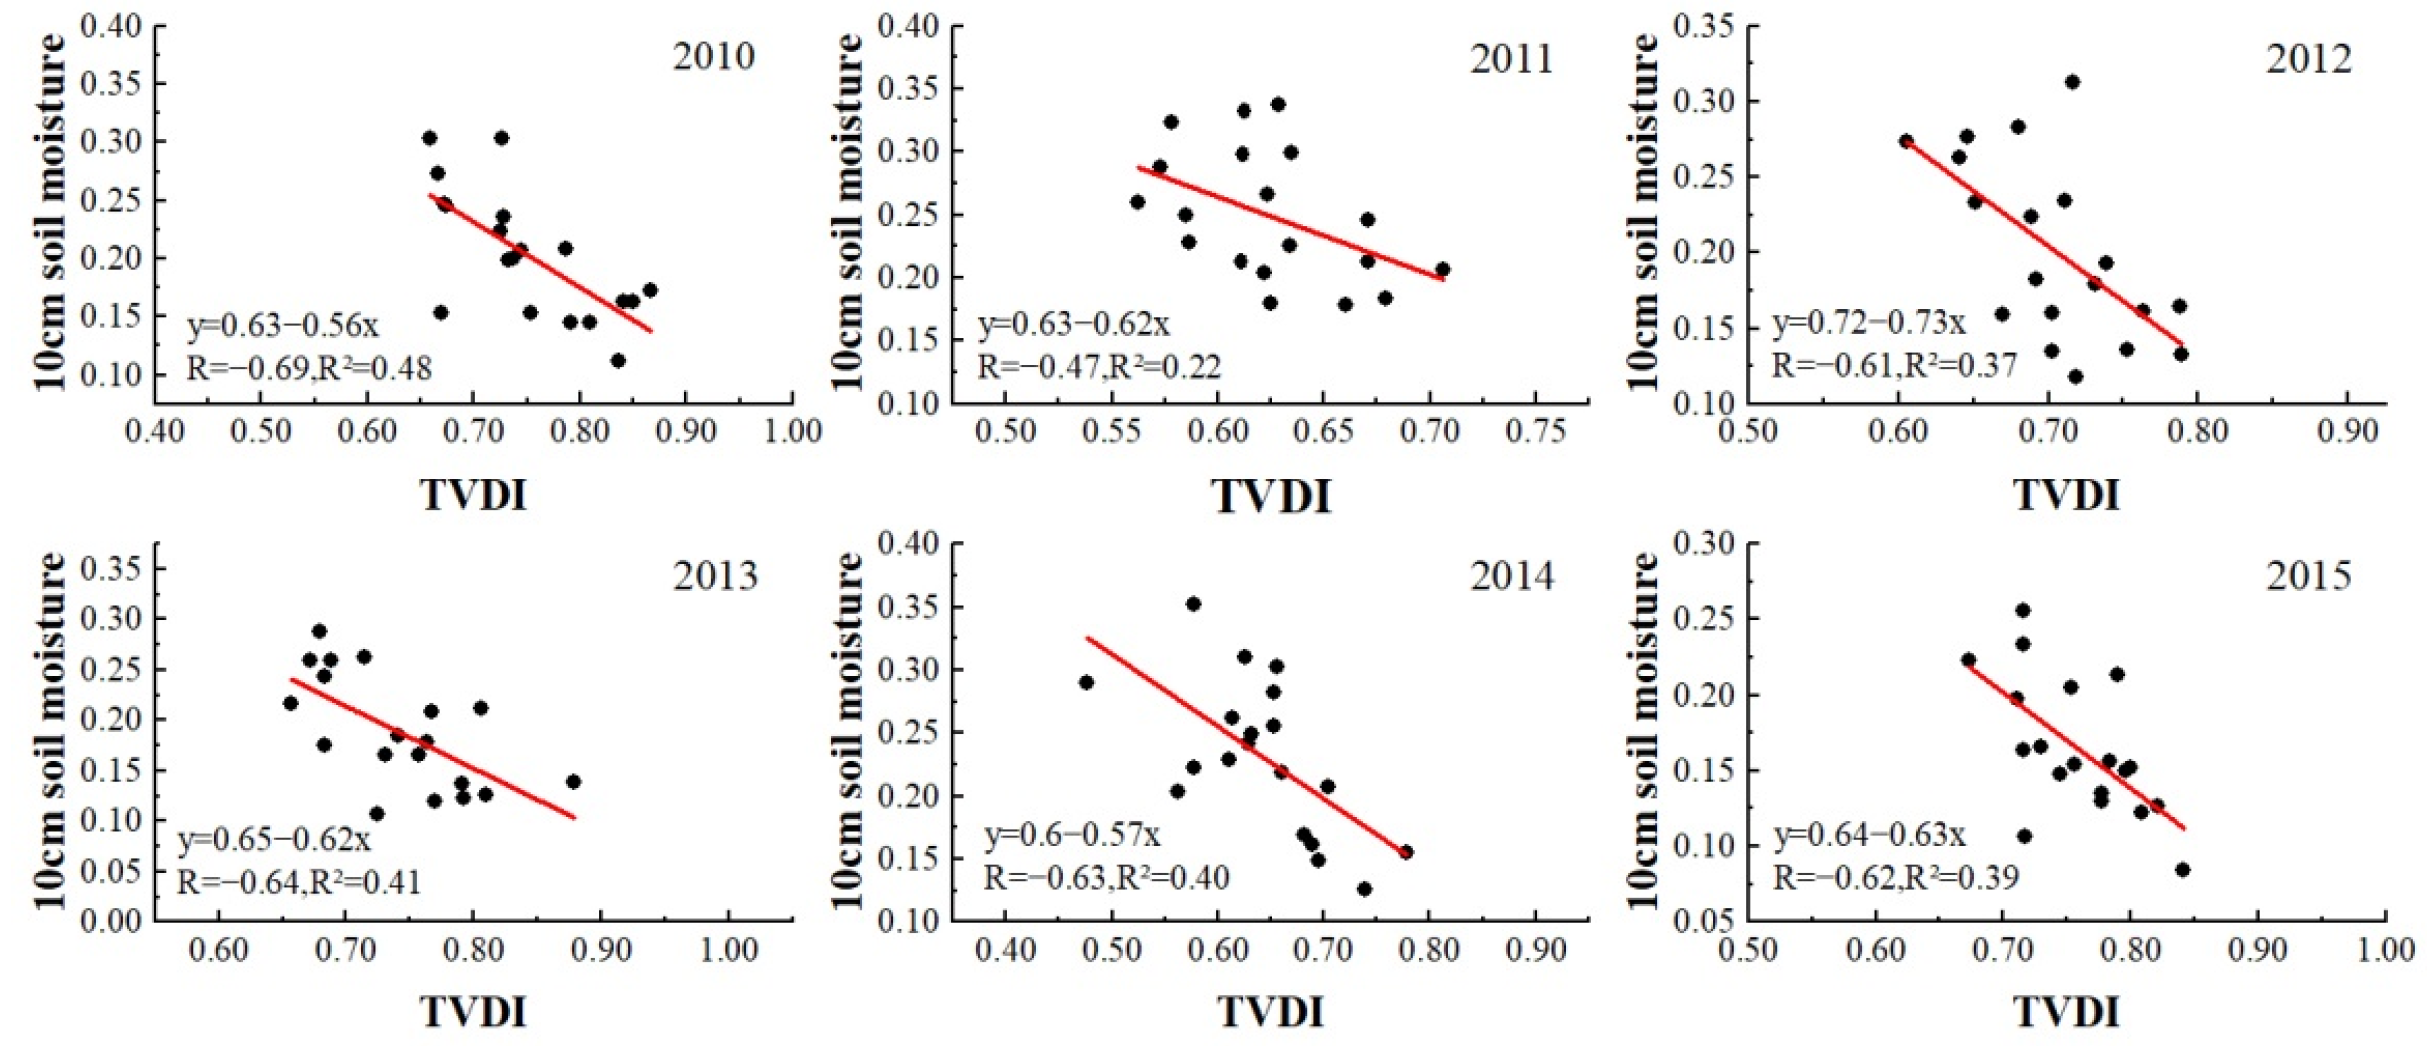
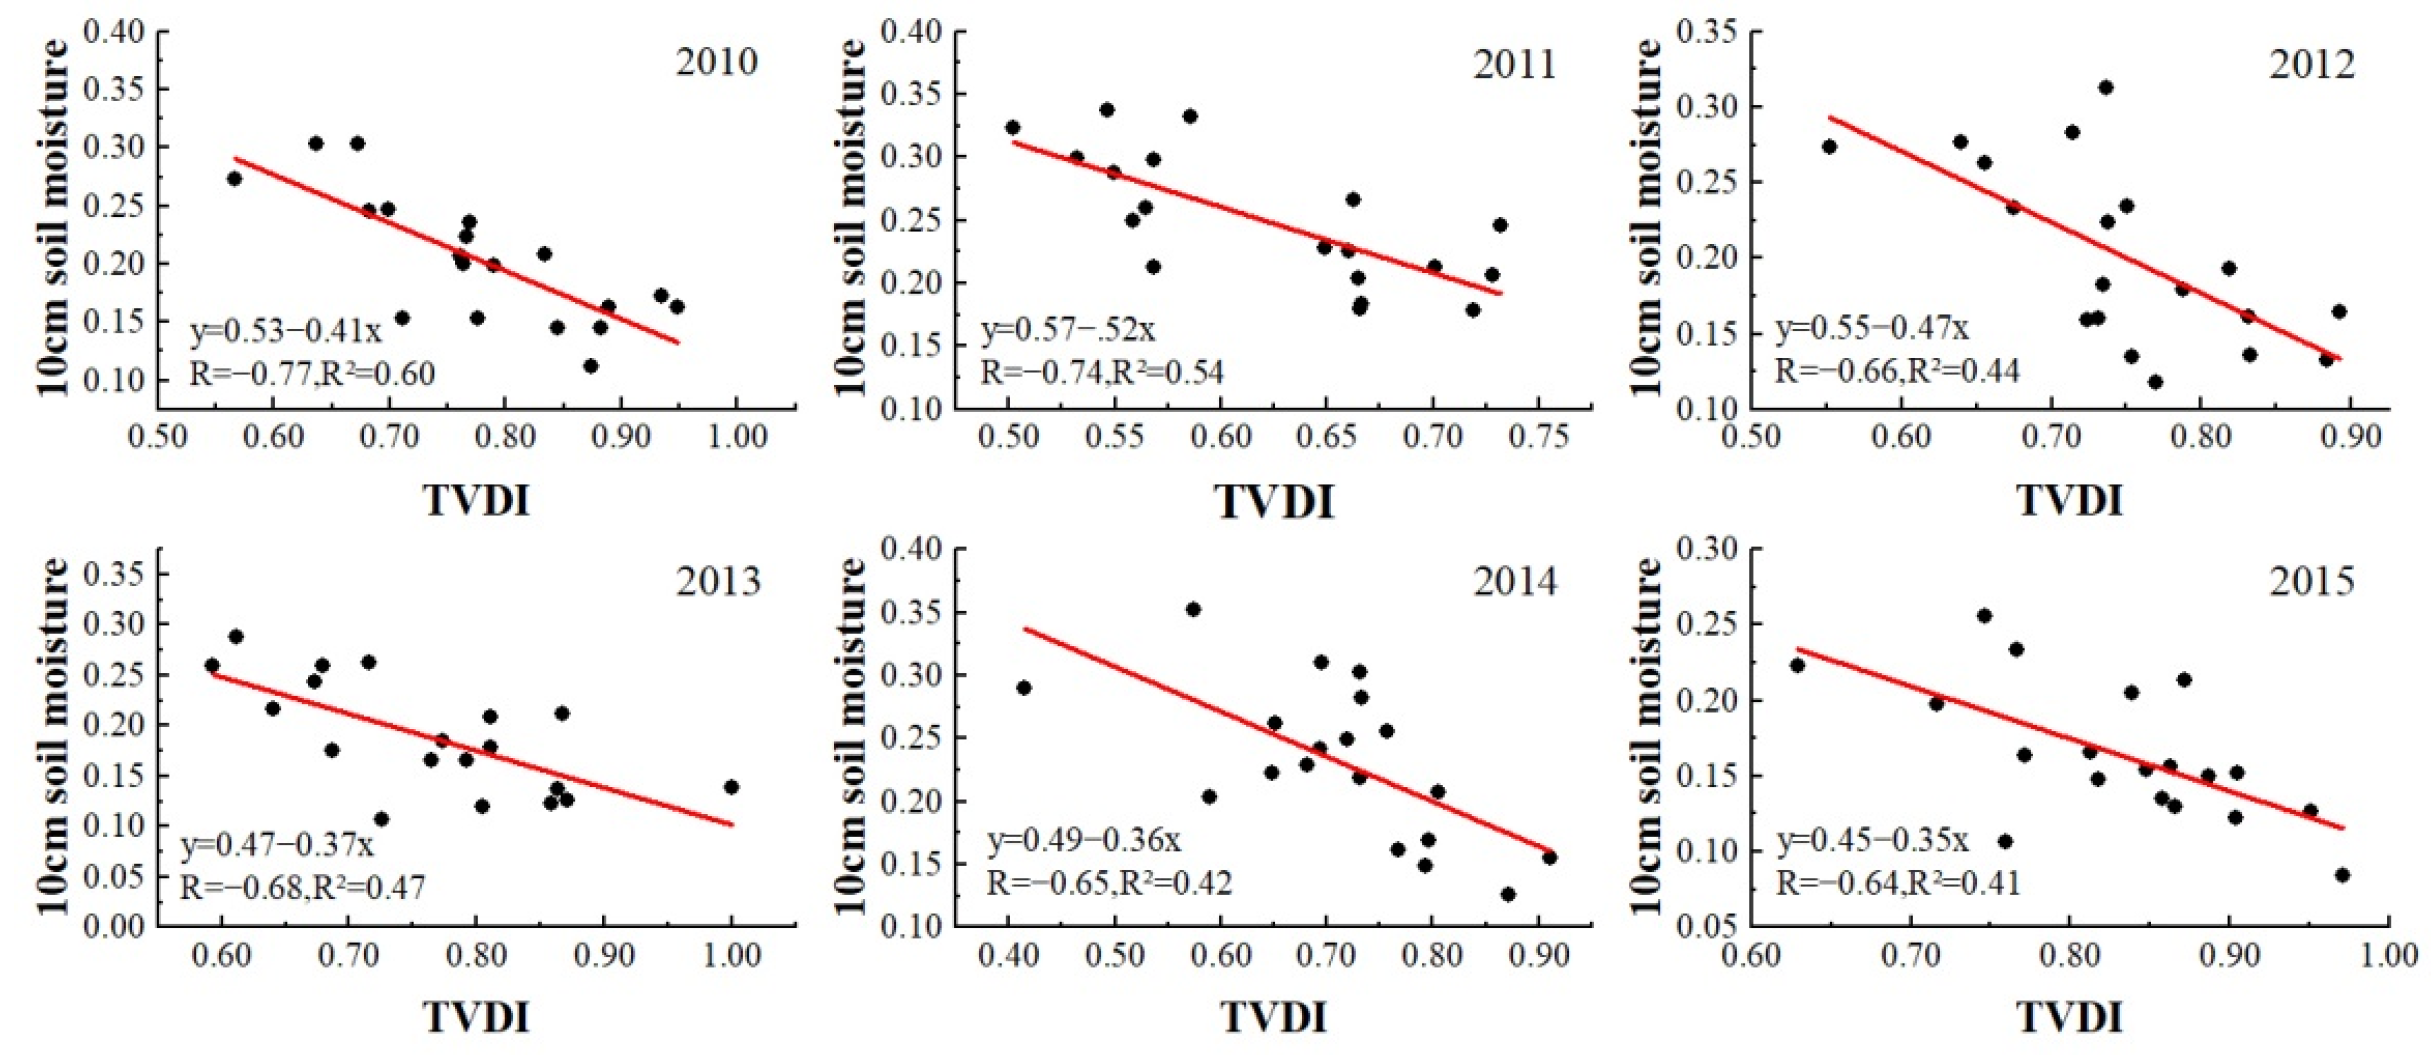
3.2.5. Verification of TVDI
4. Results
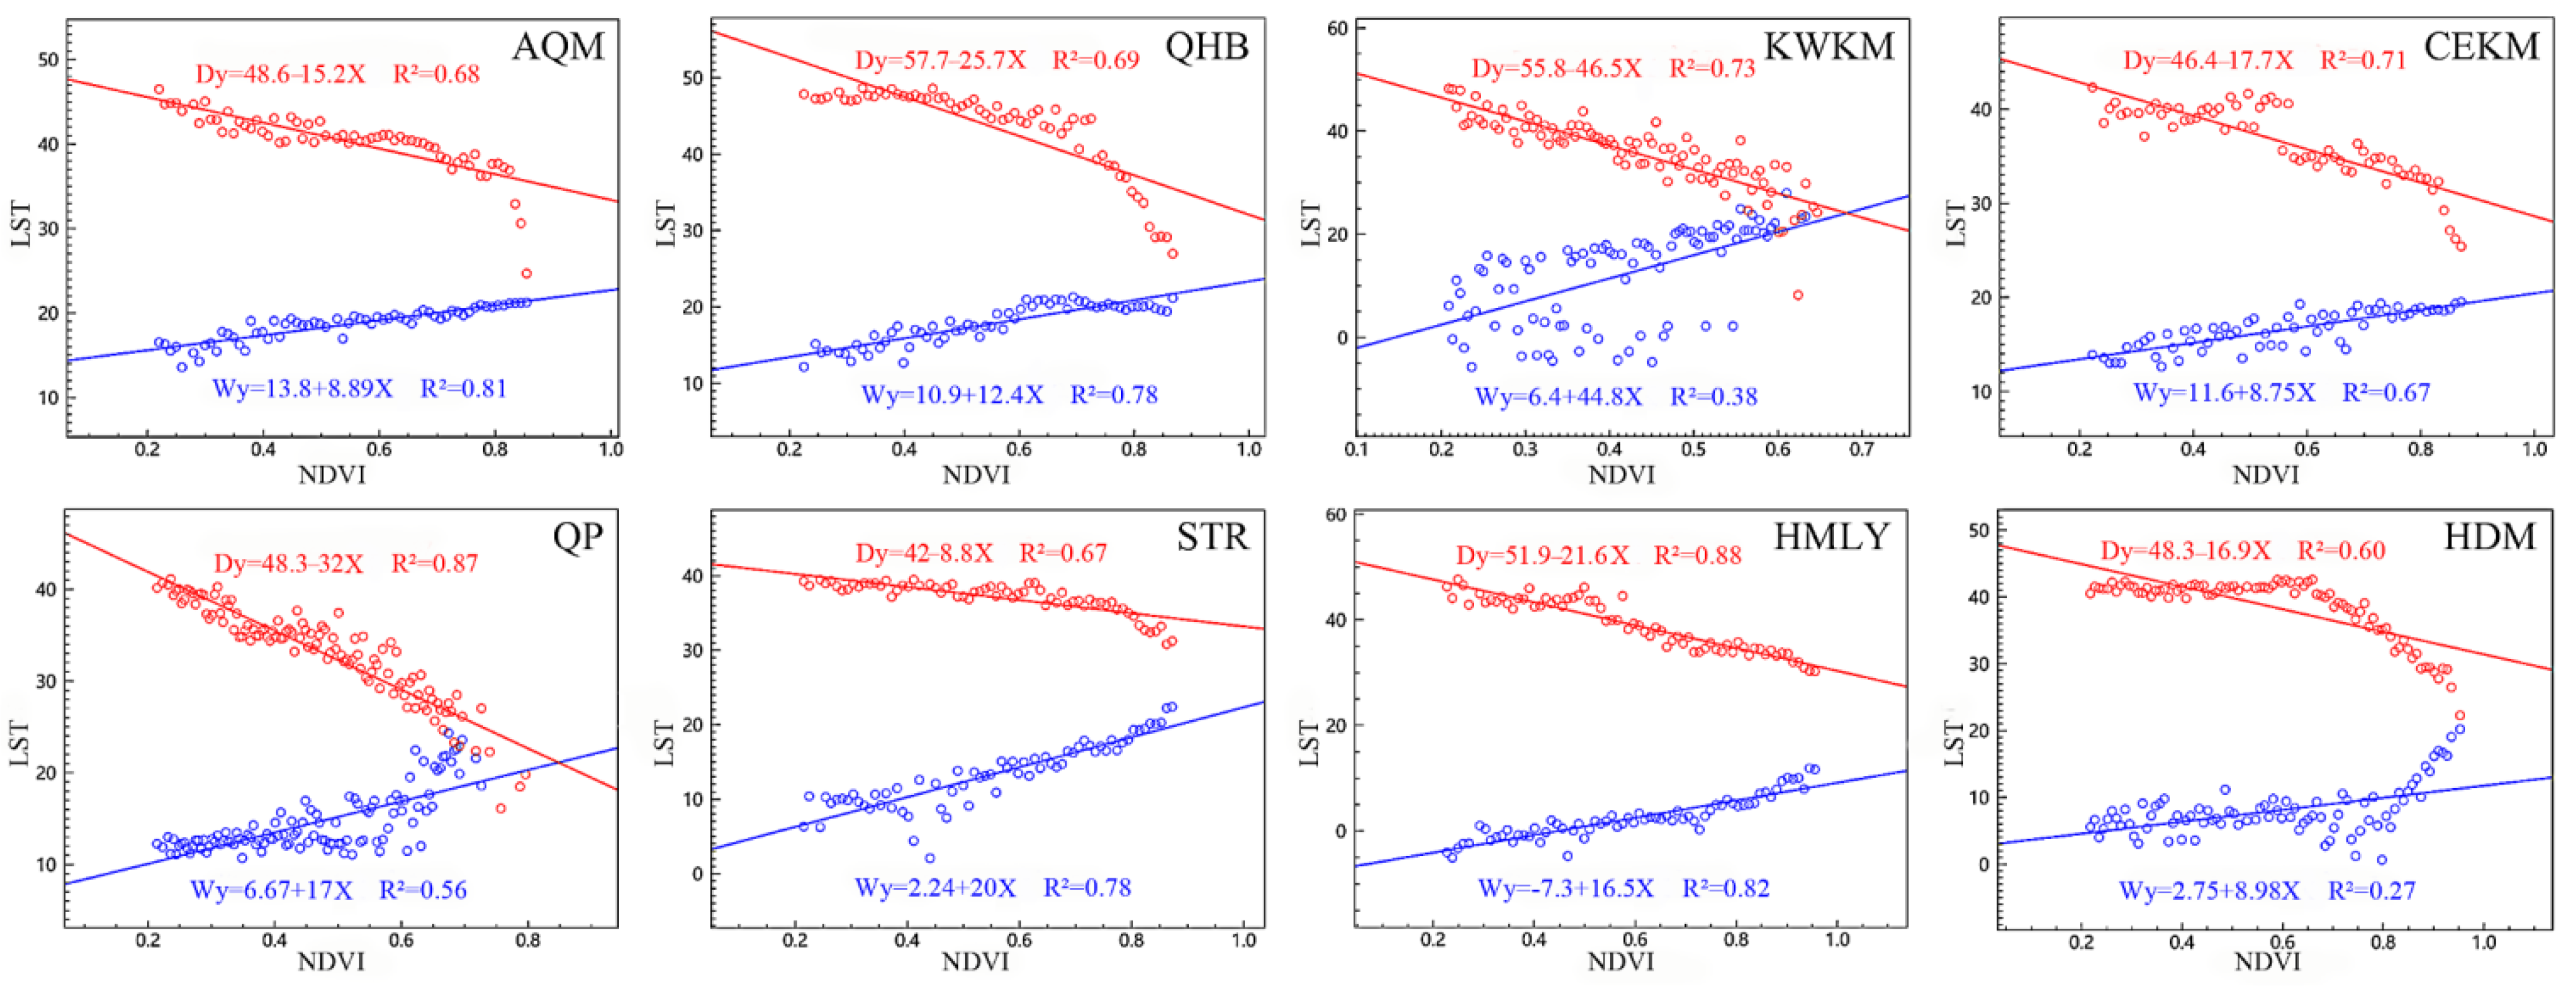
4.1. Characteristic of NDVI-LST Feature Space
4.2. Temporal and Spatial Variation Characteristics of TVDI
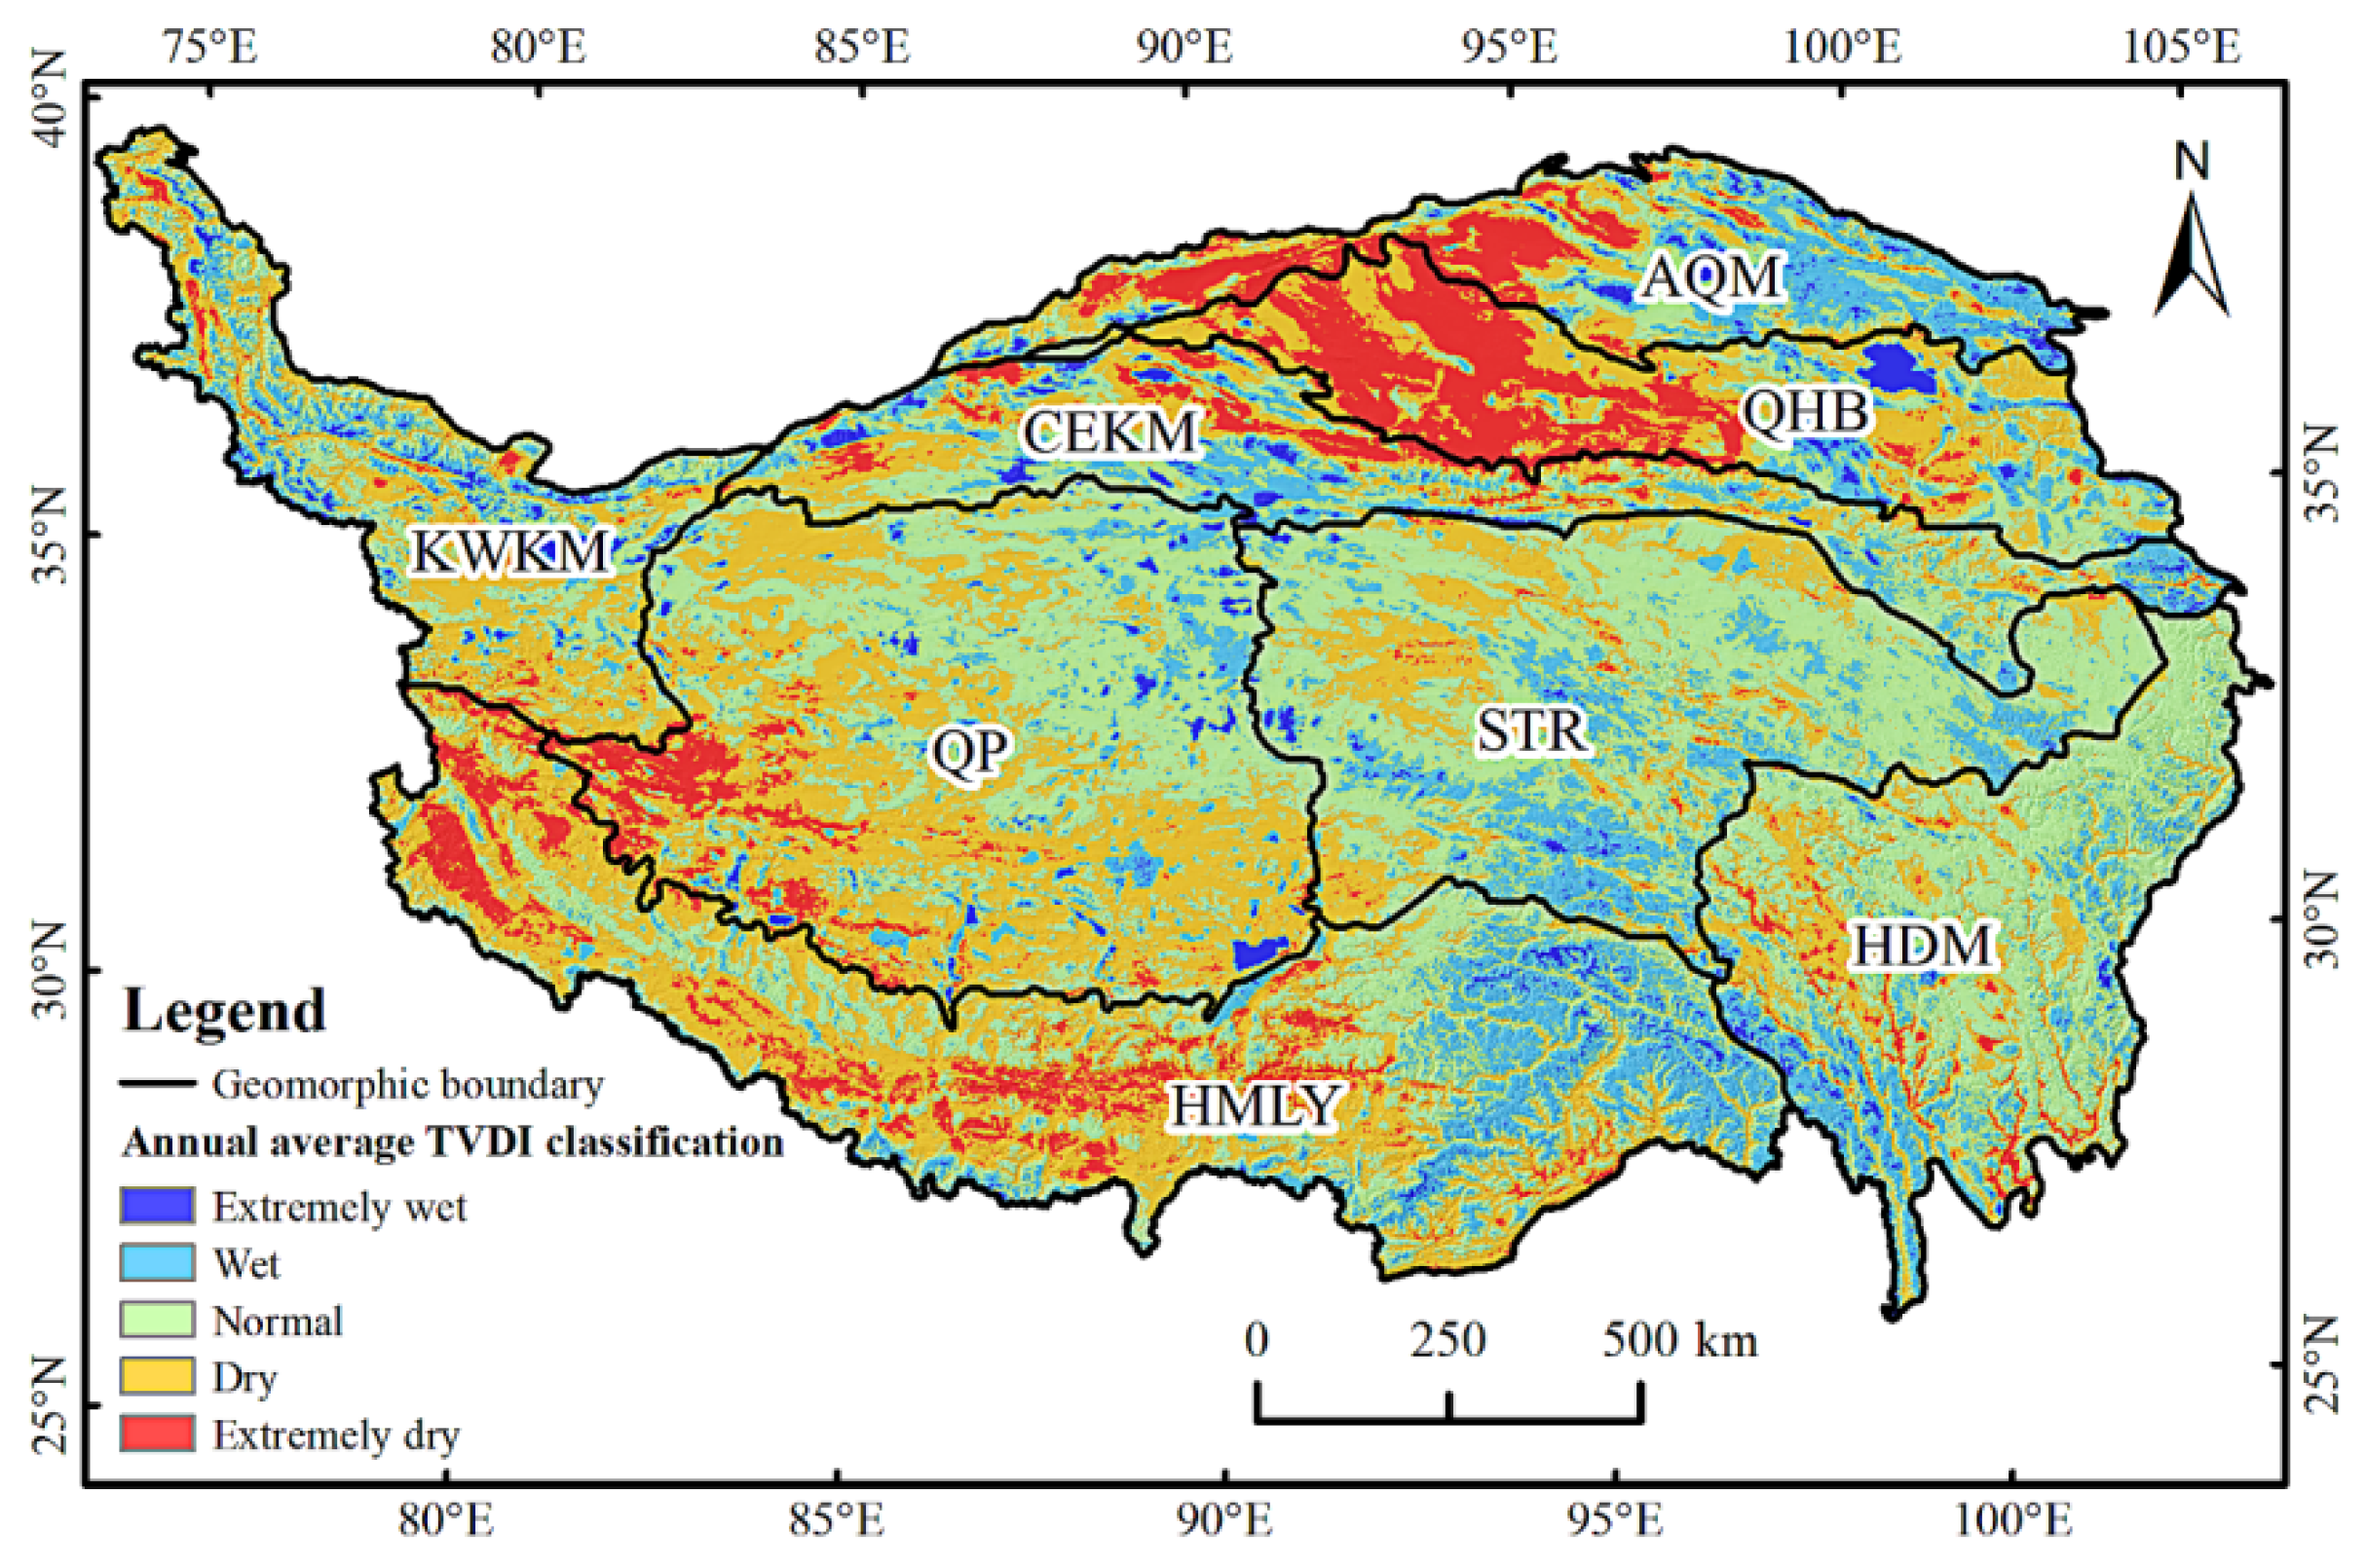
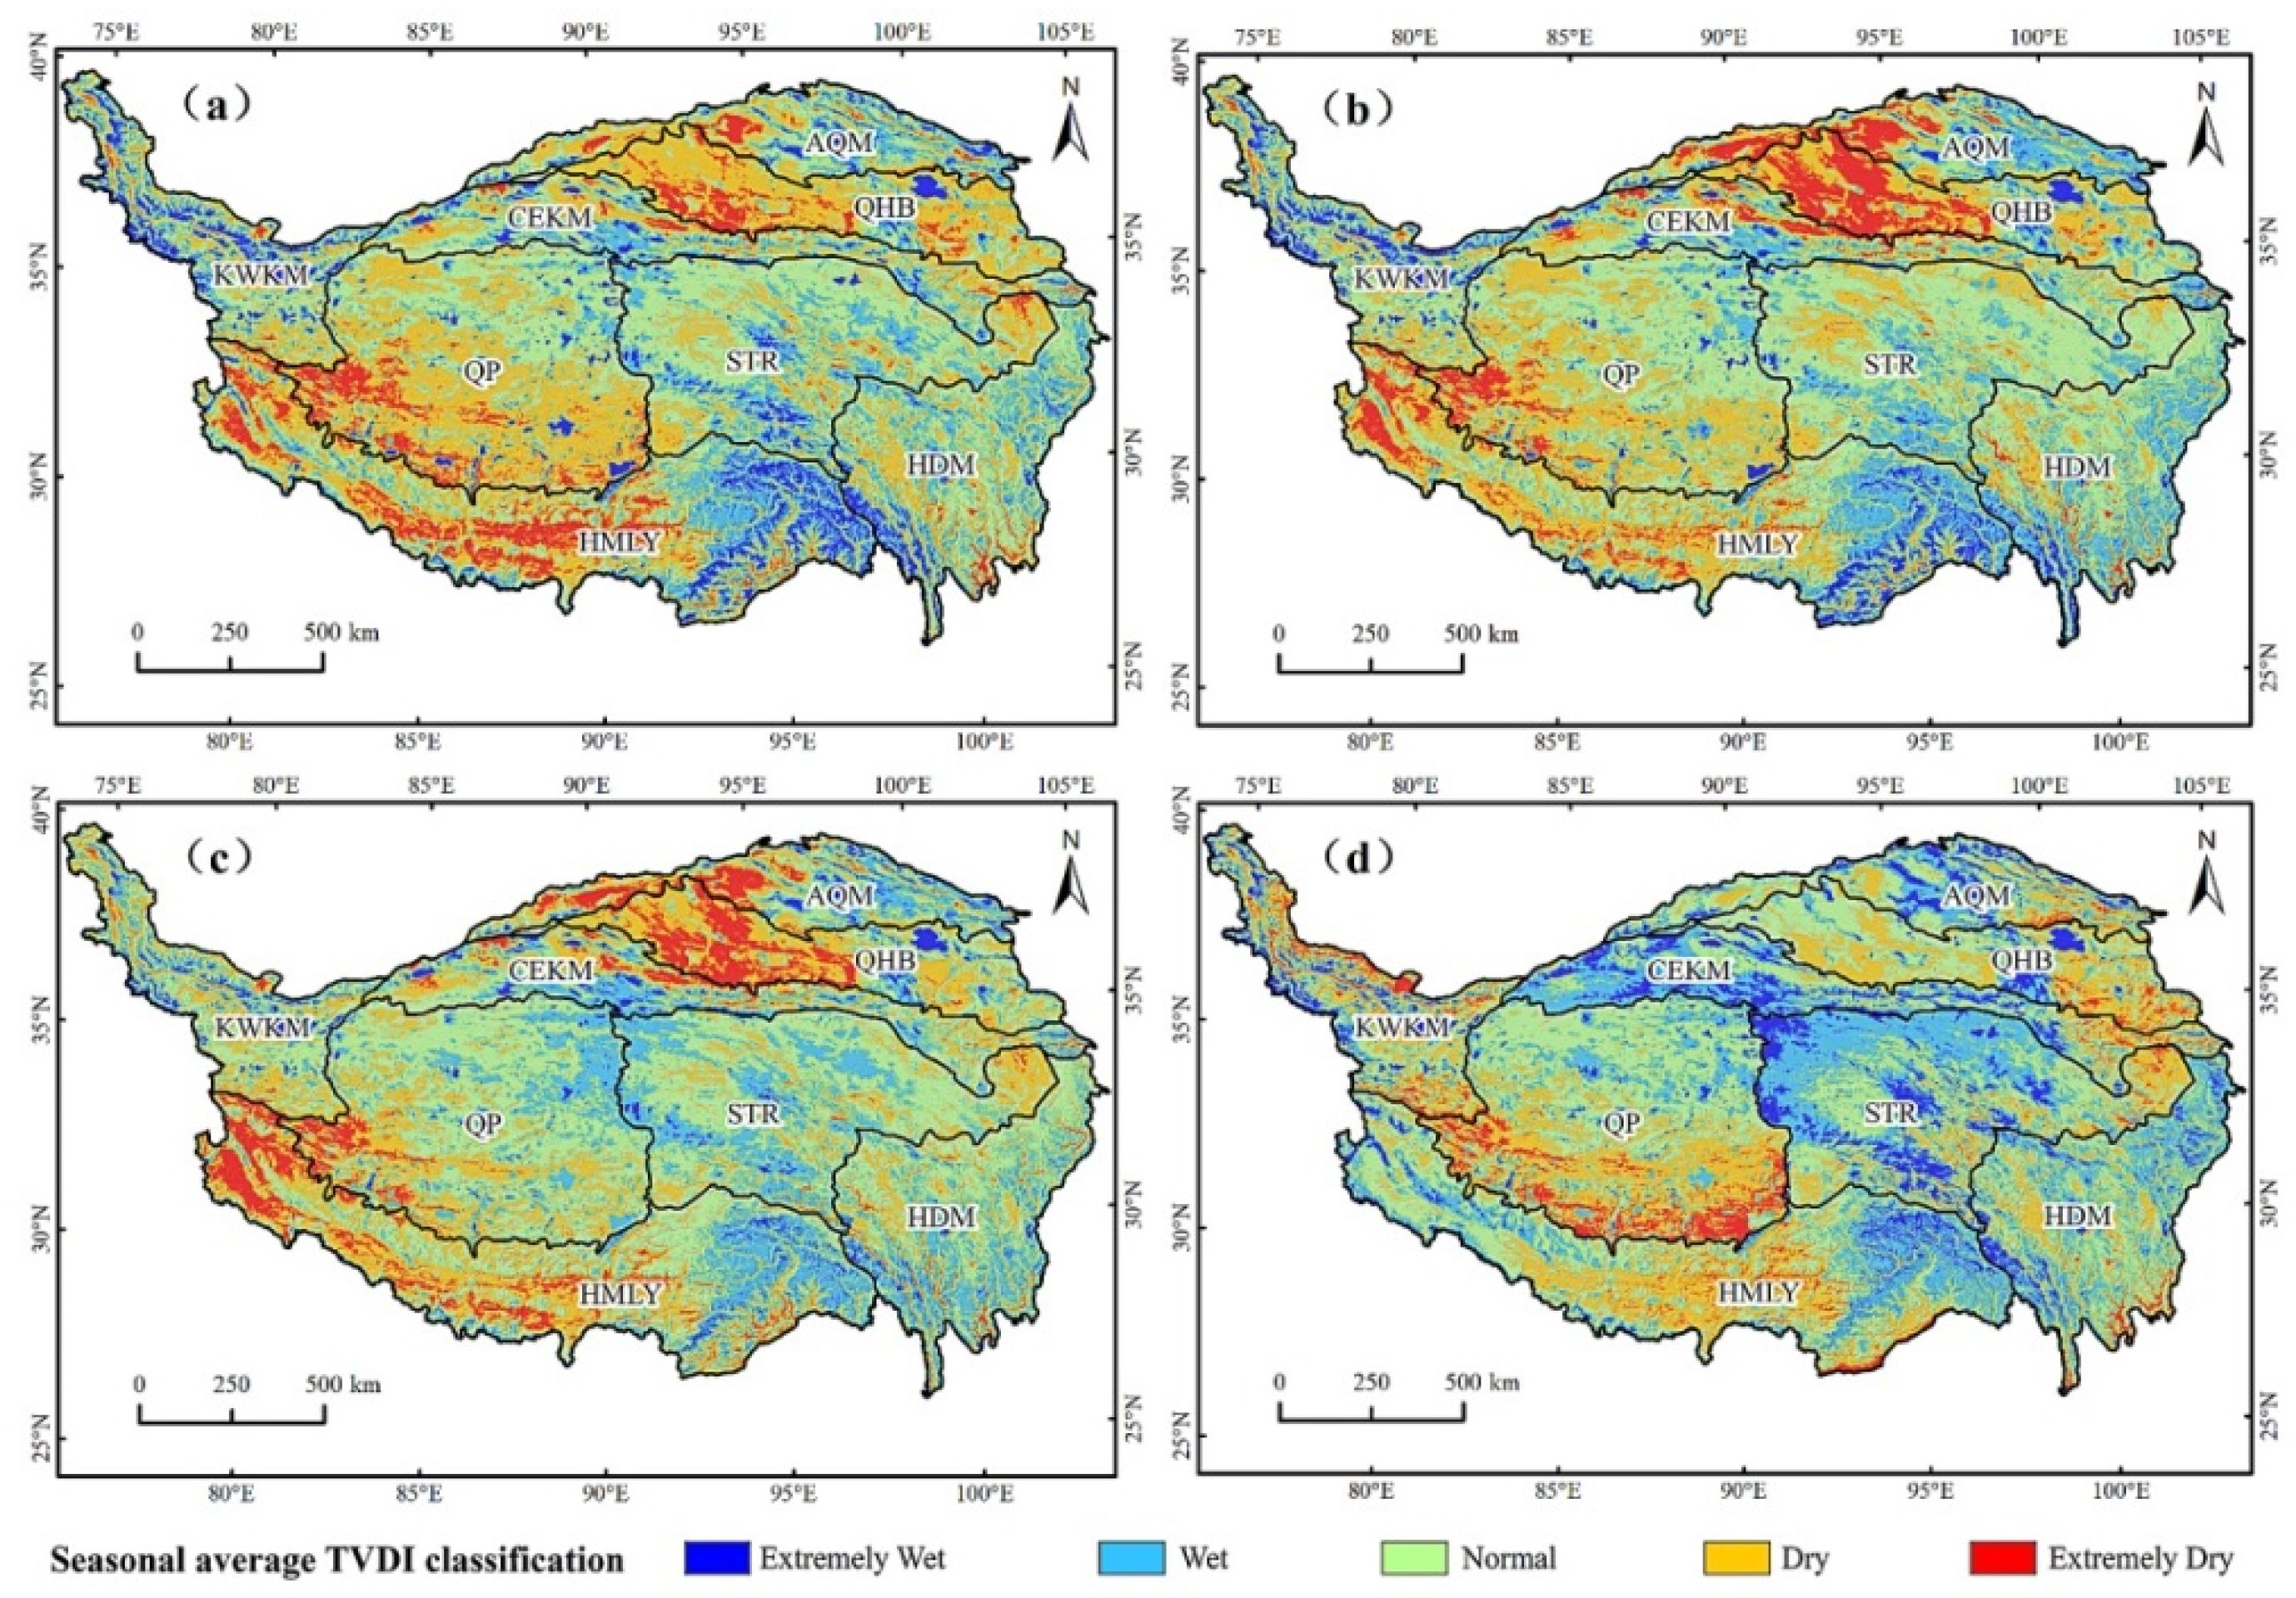
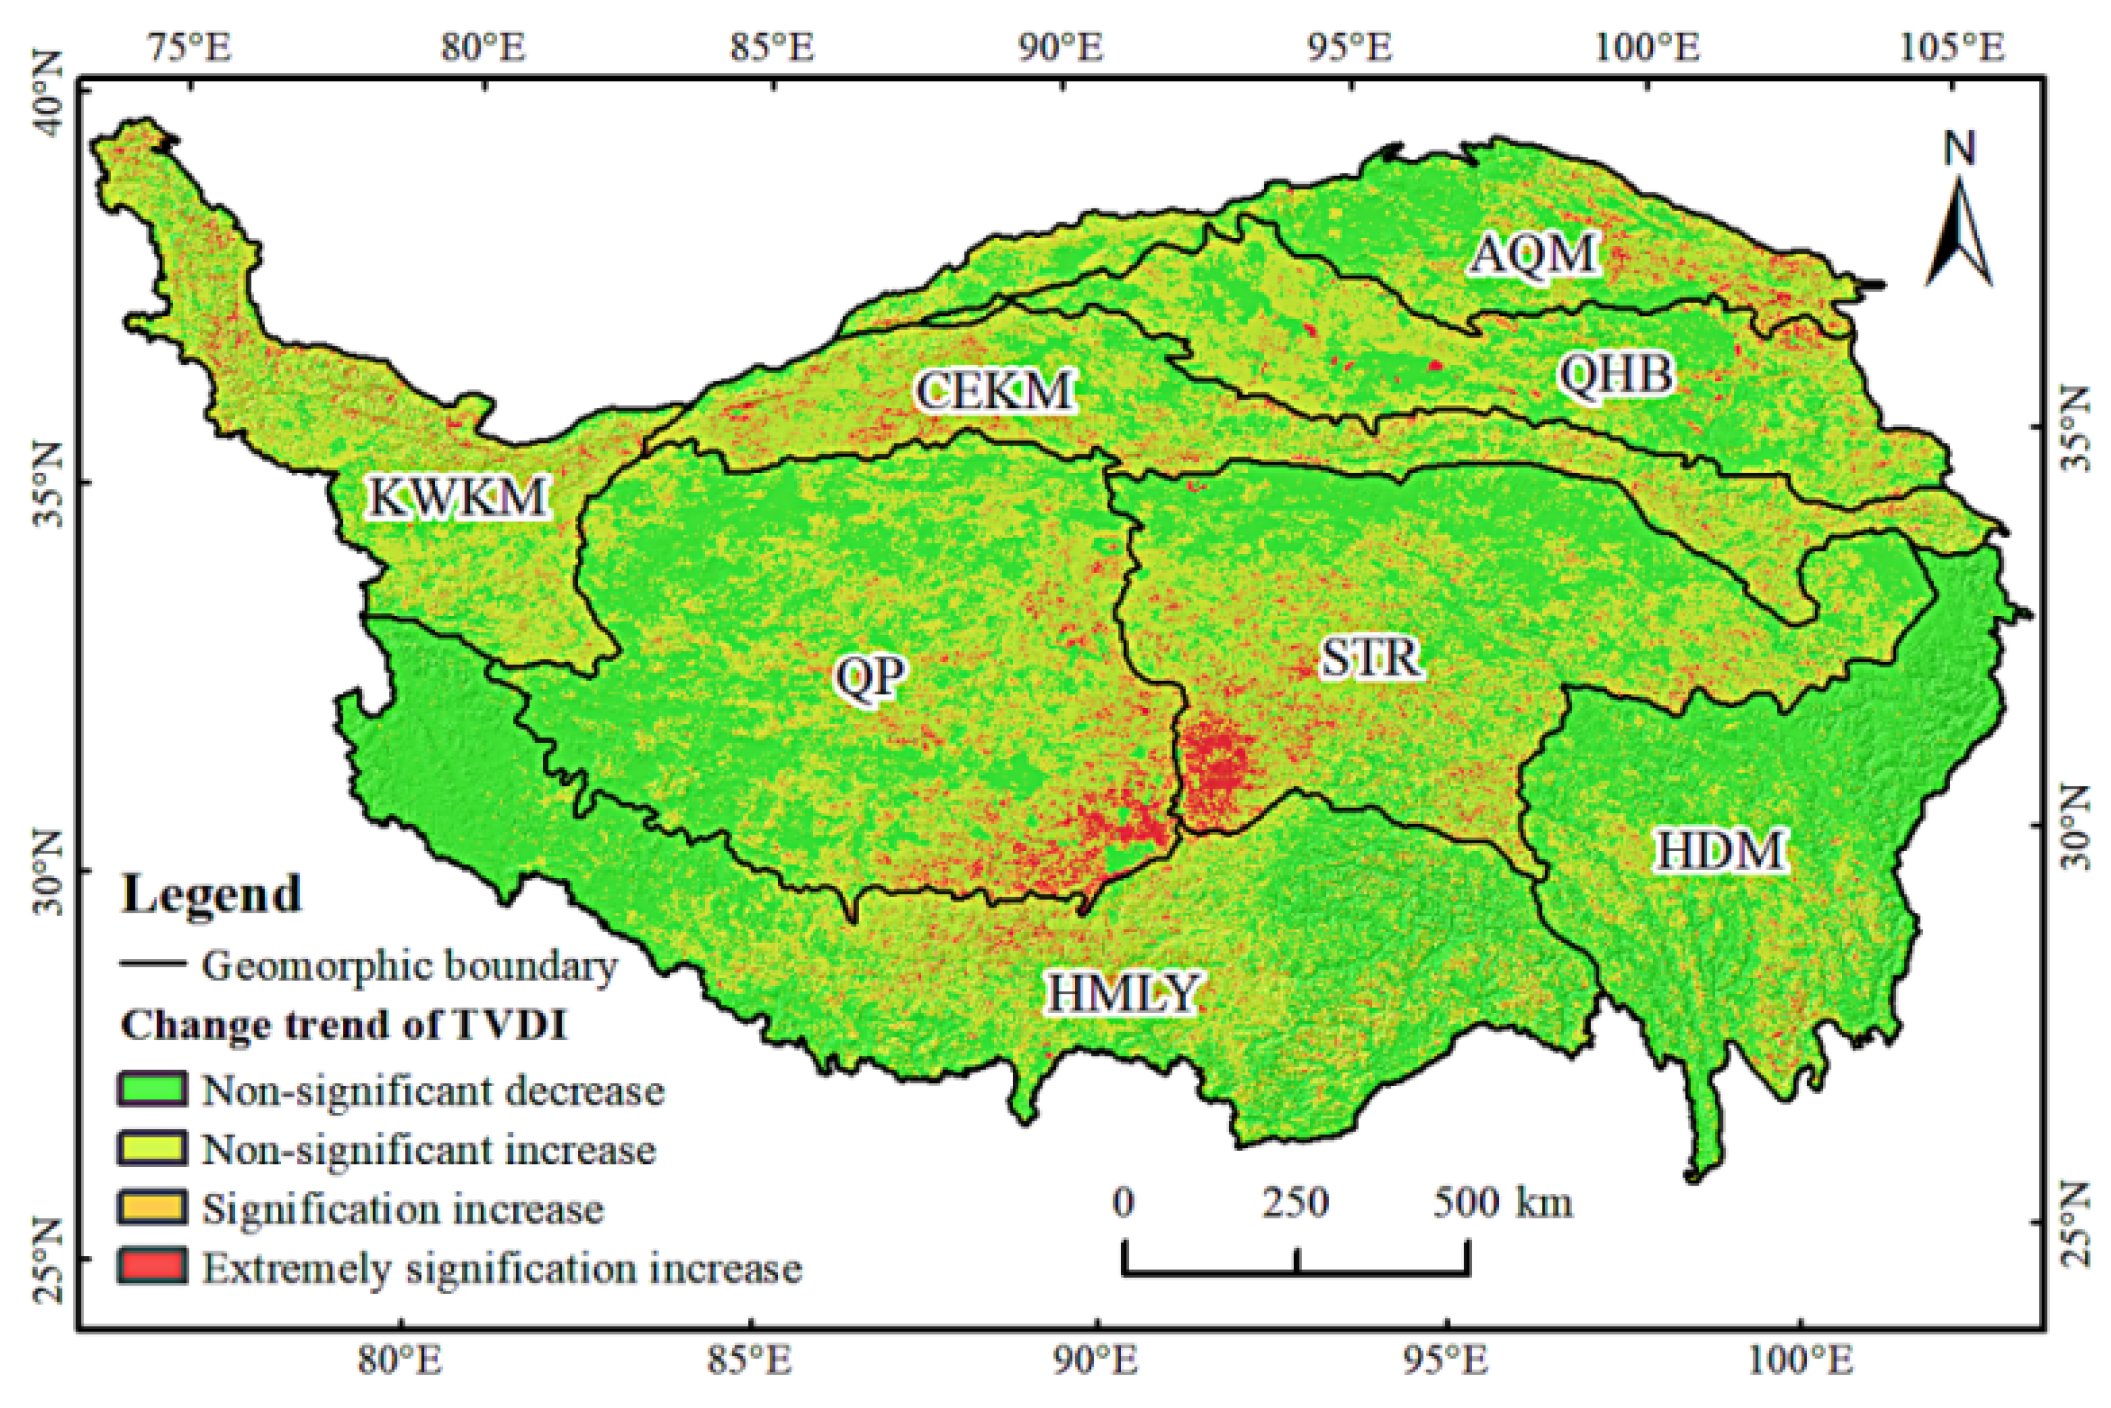
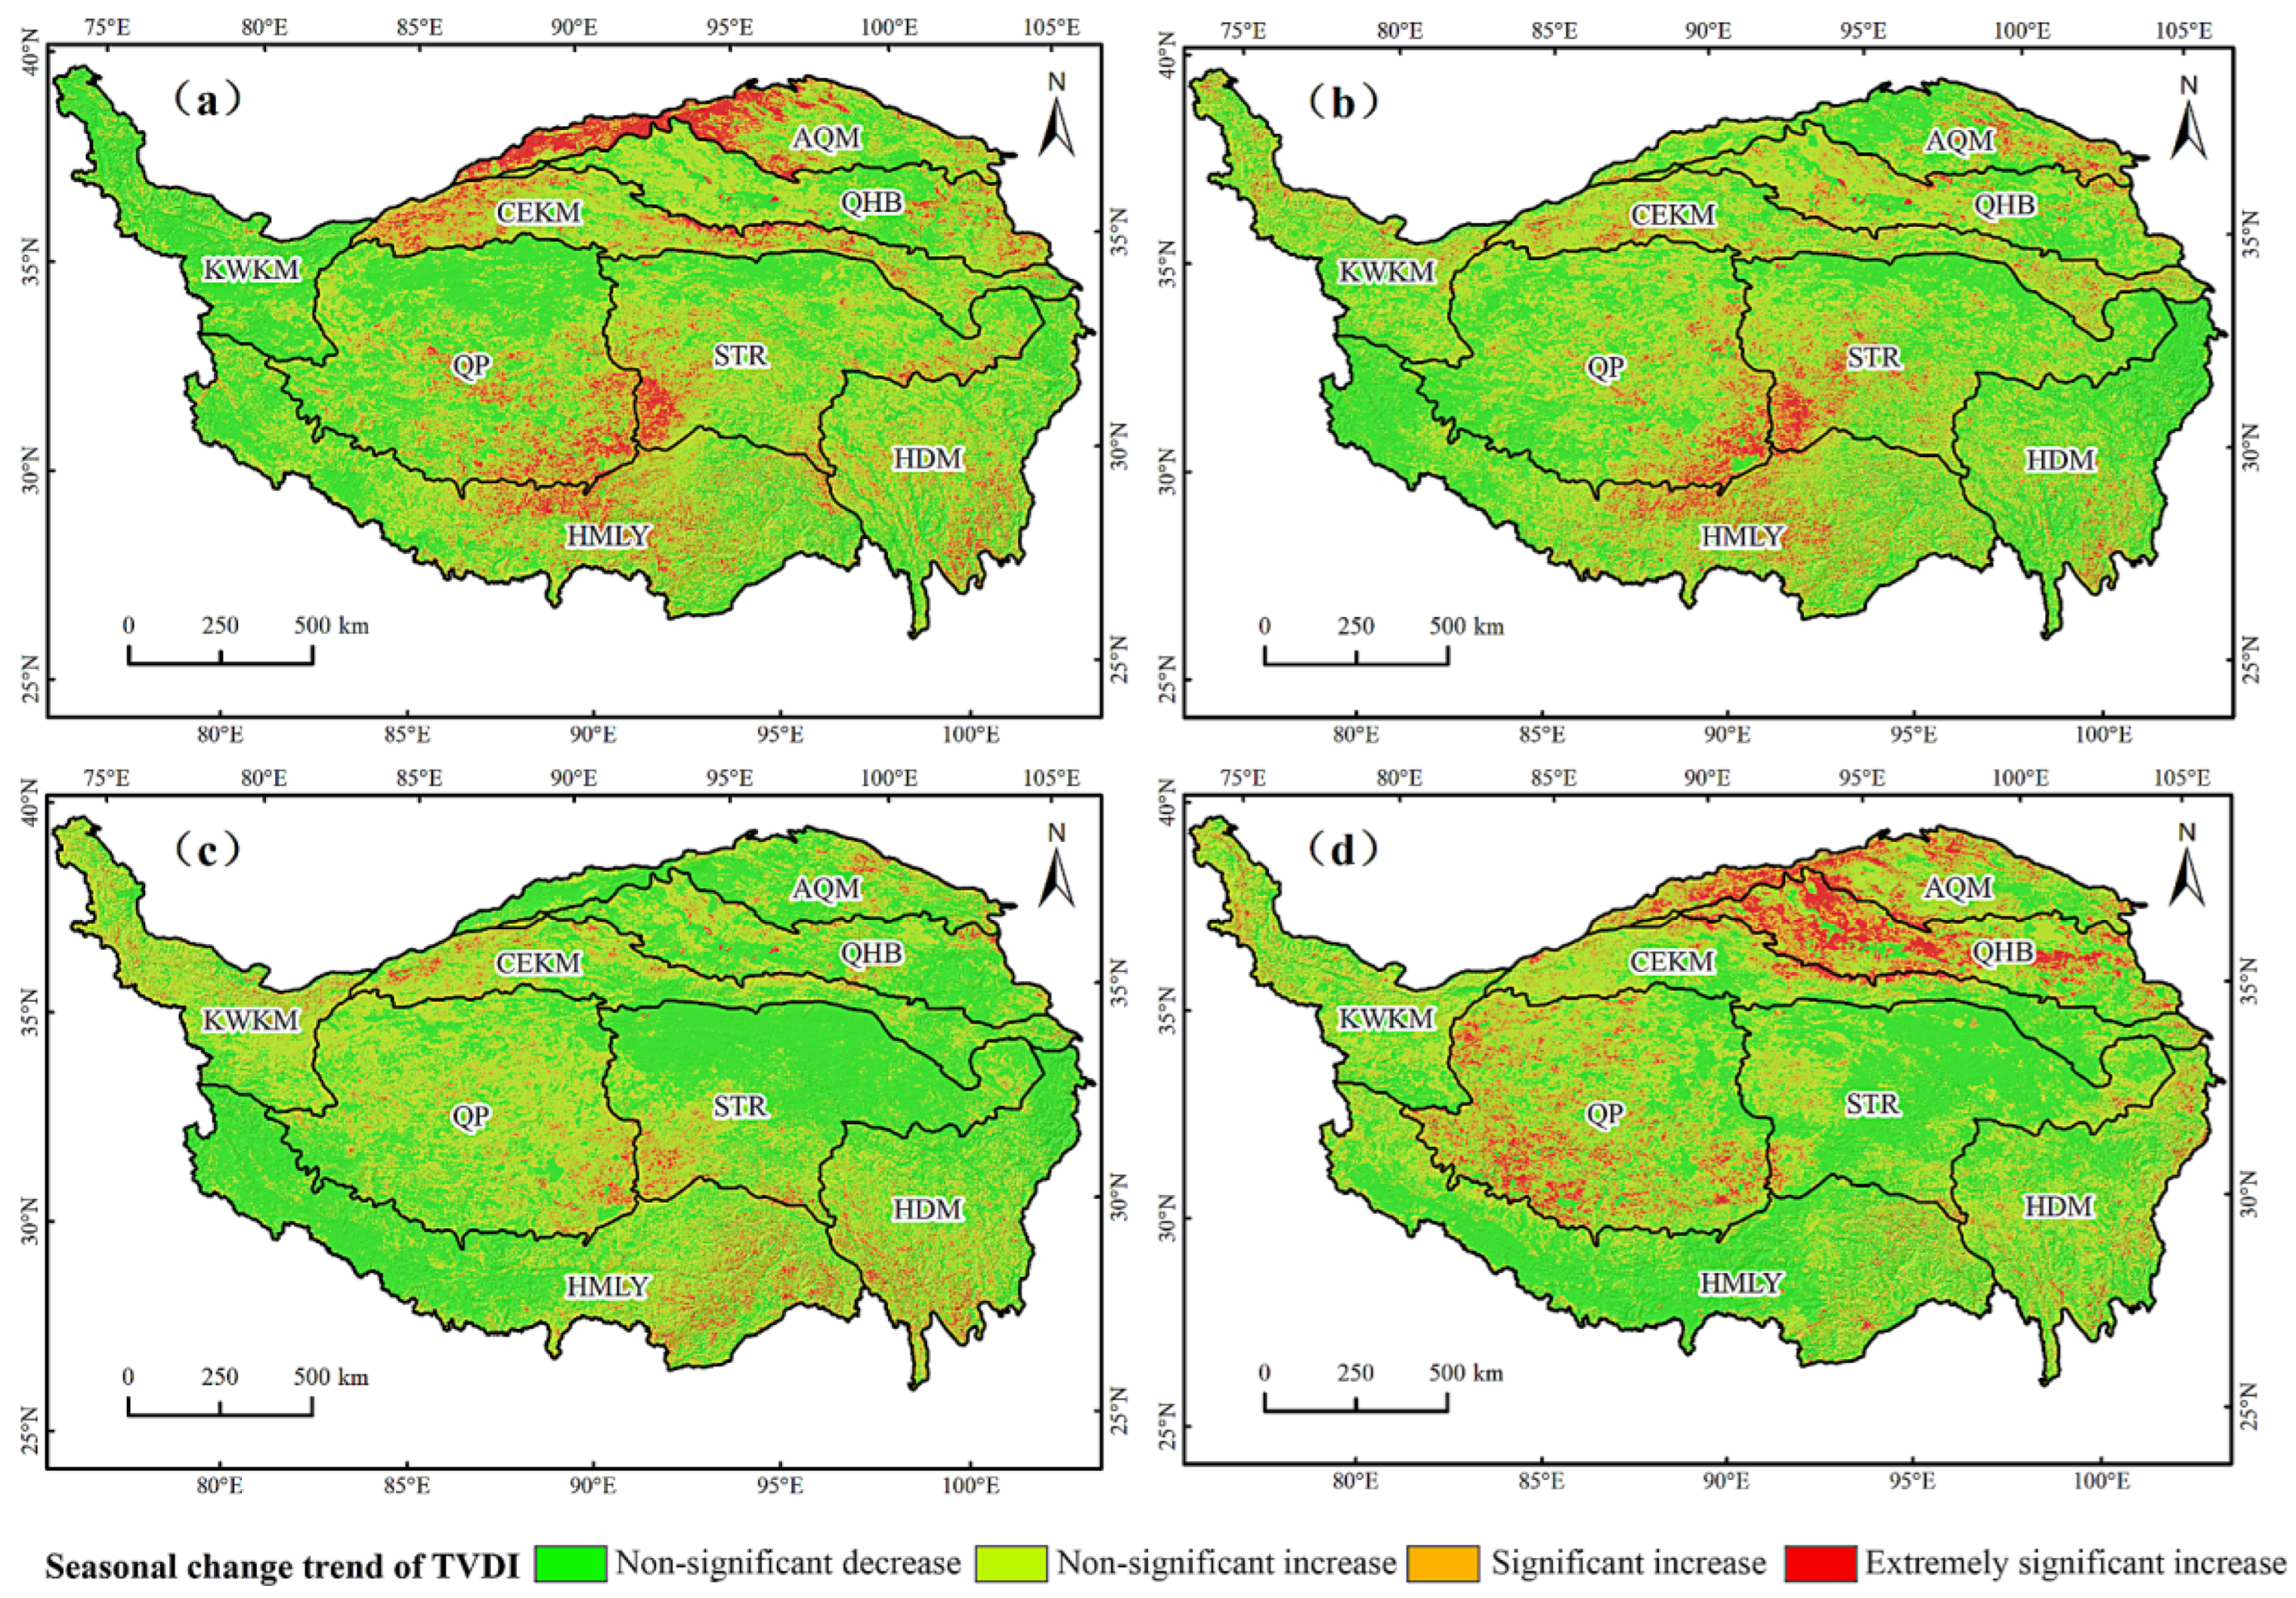
4.2.1. Spatial Variation Characteristics of TVDI
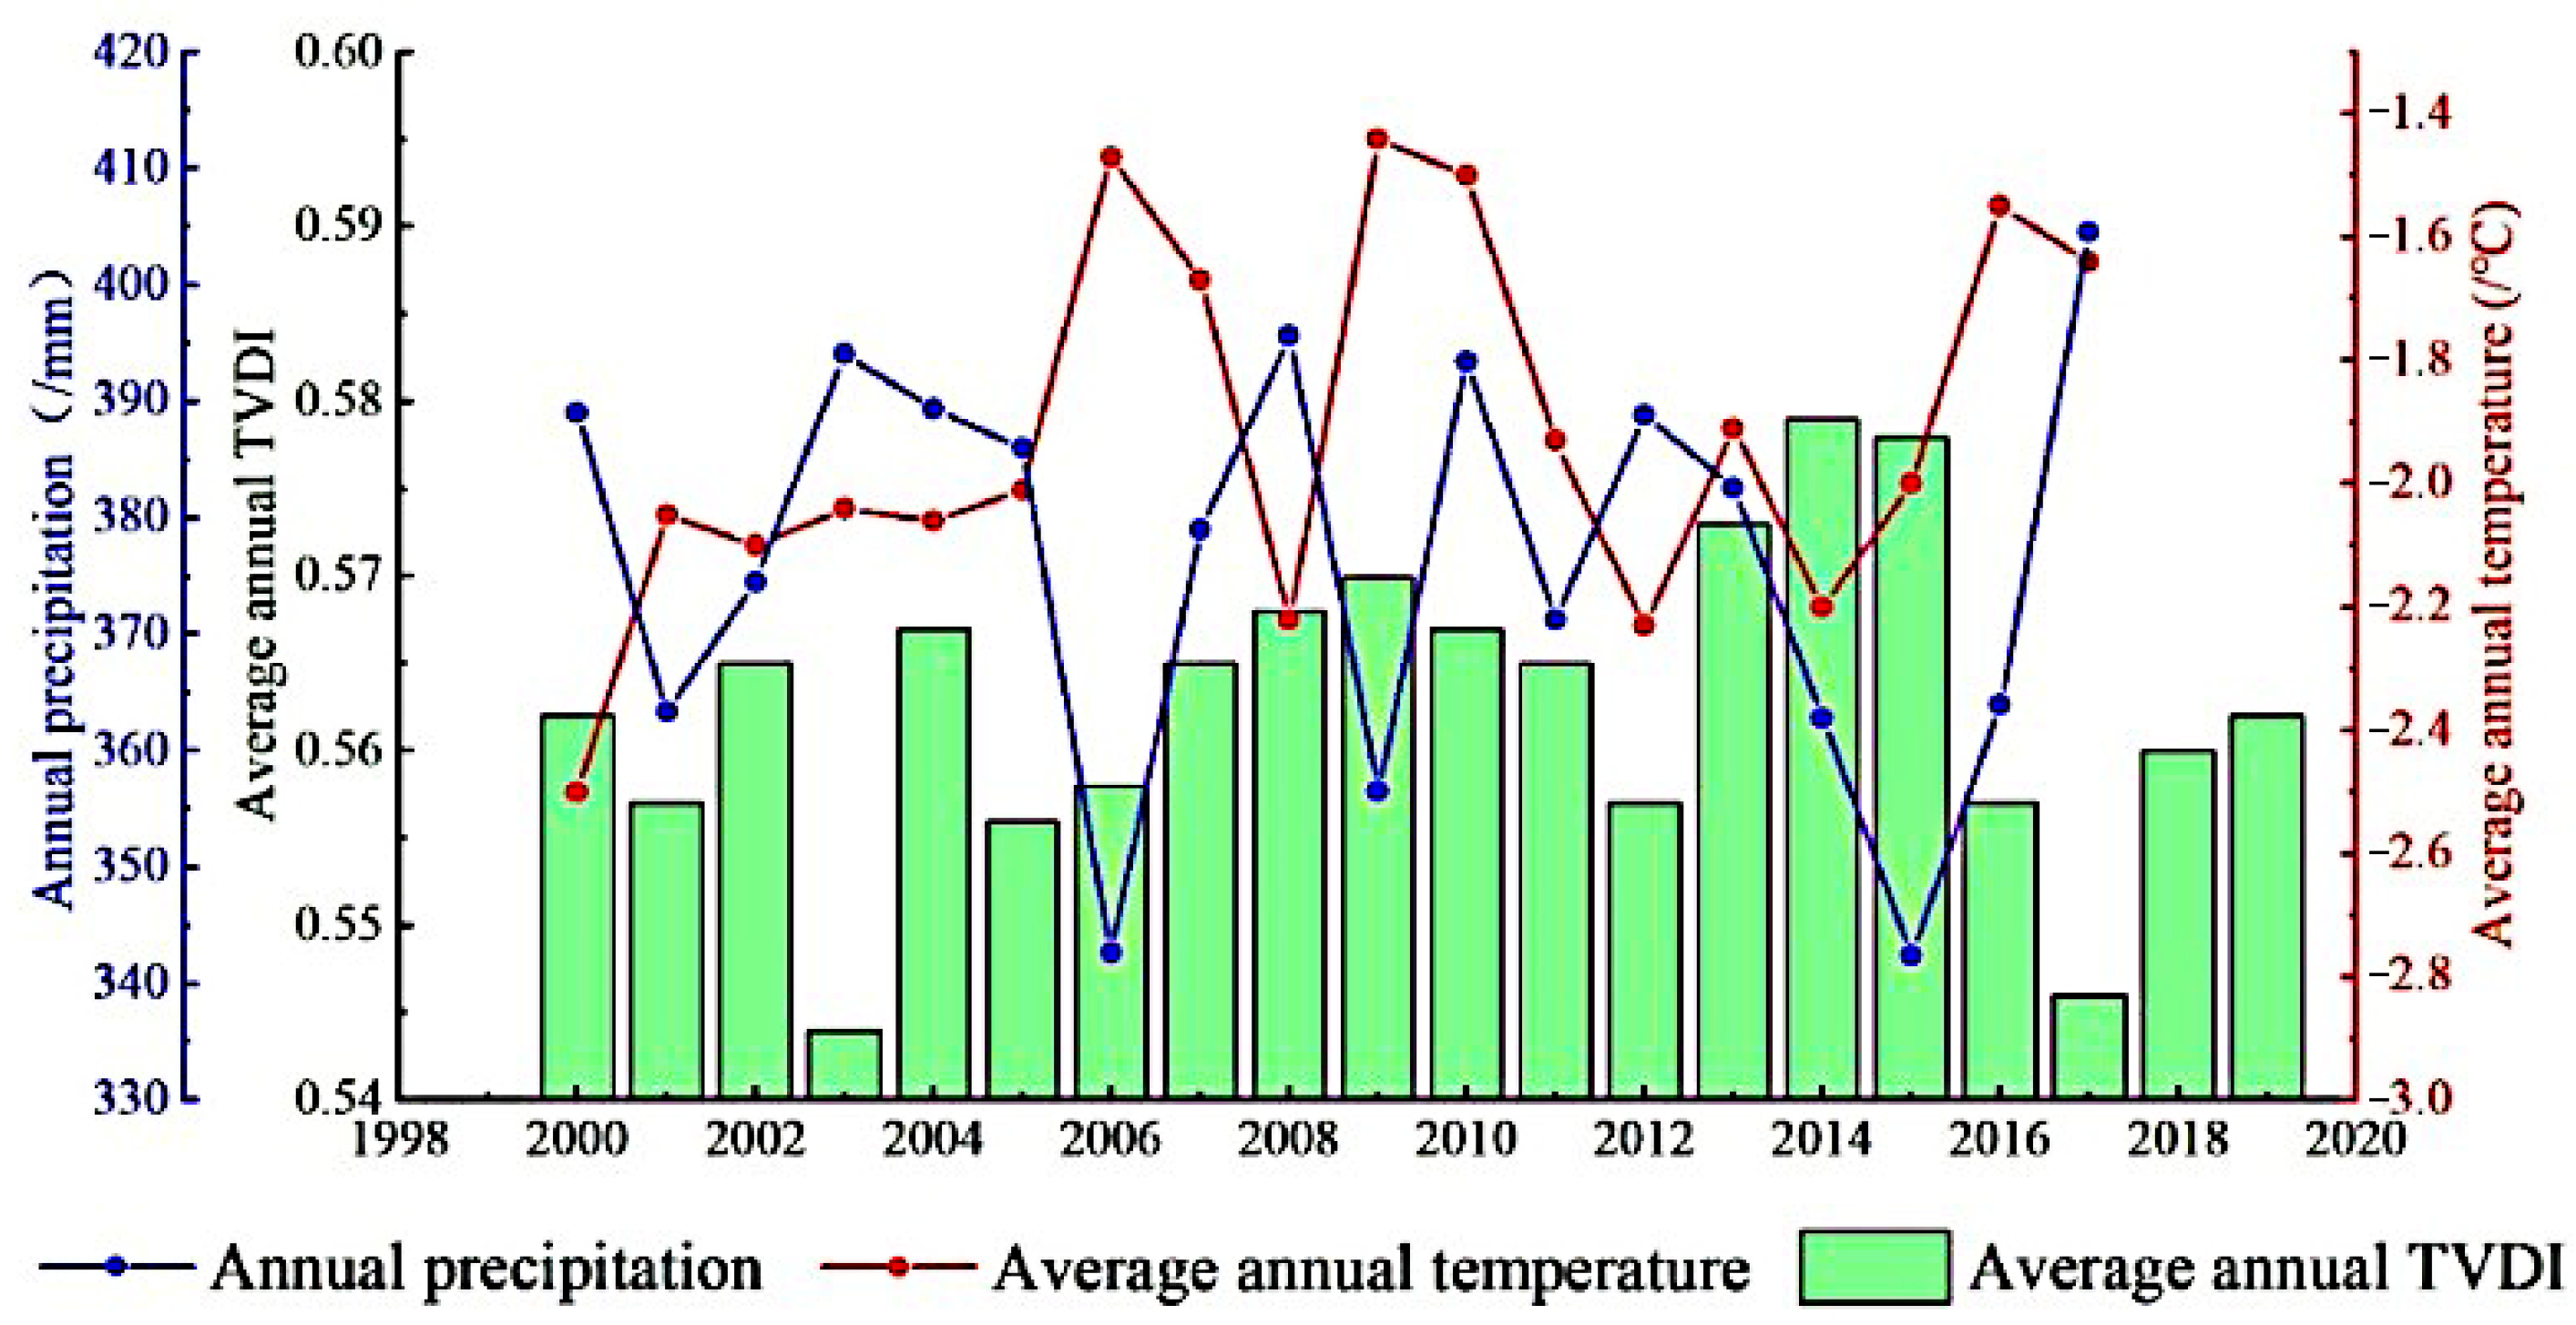
4.2.2. Temporal Variation Characteristics of TVDI
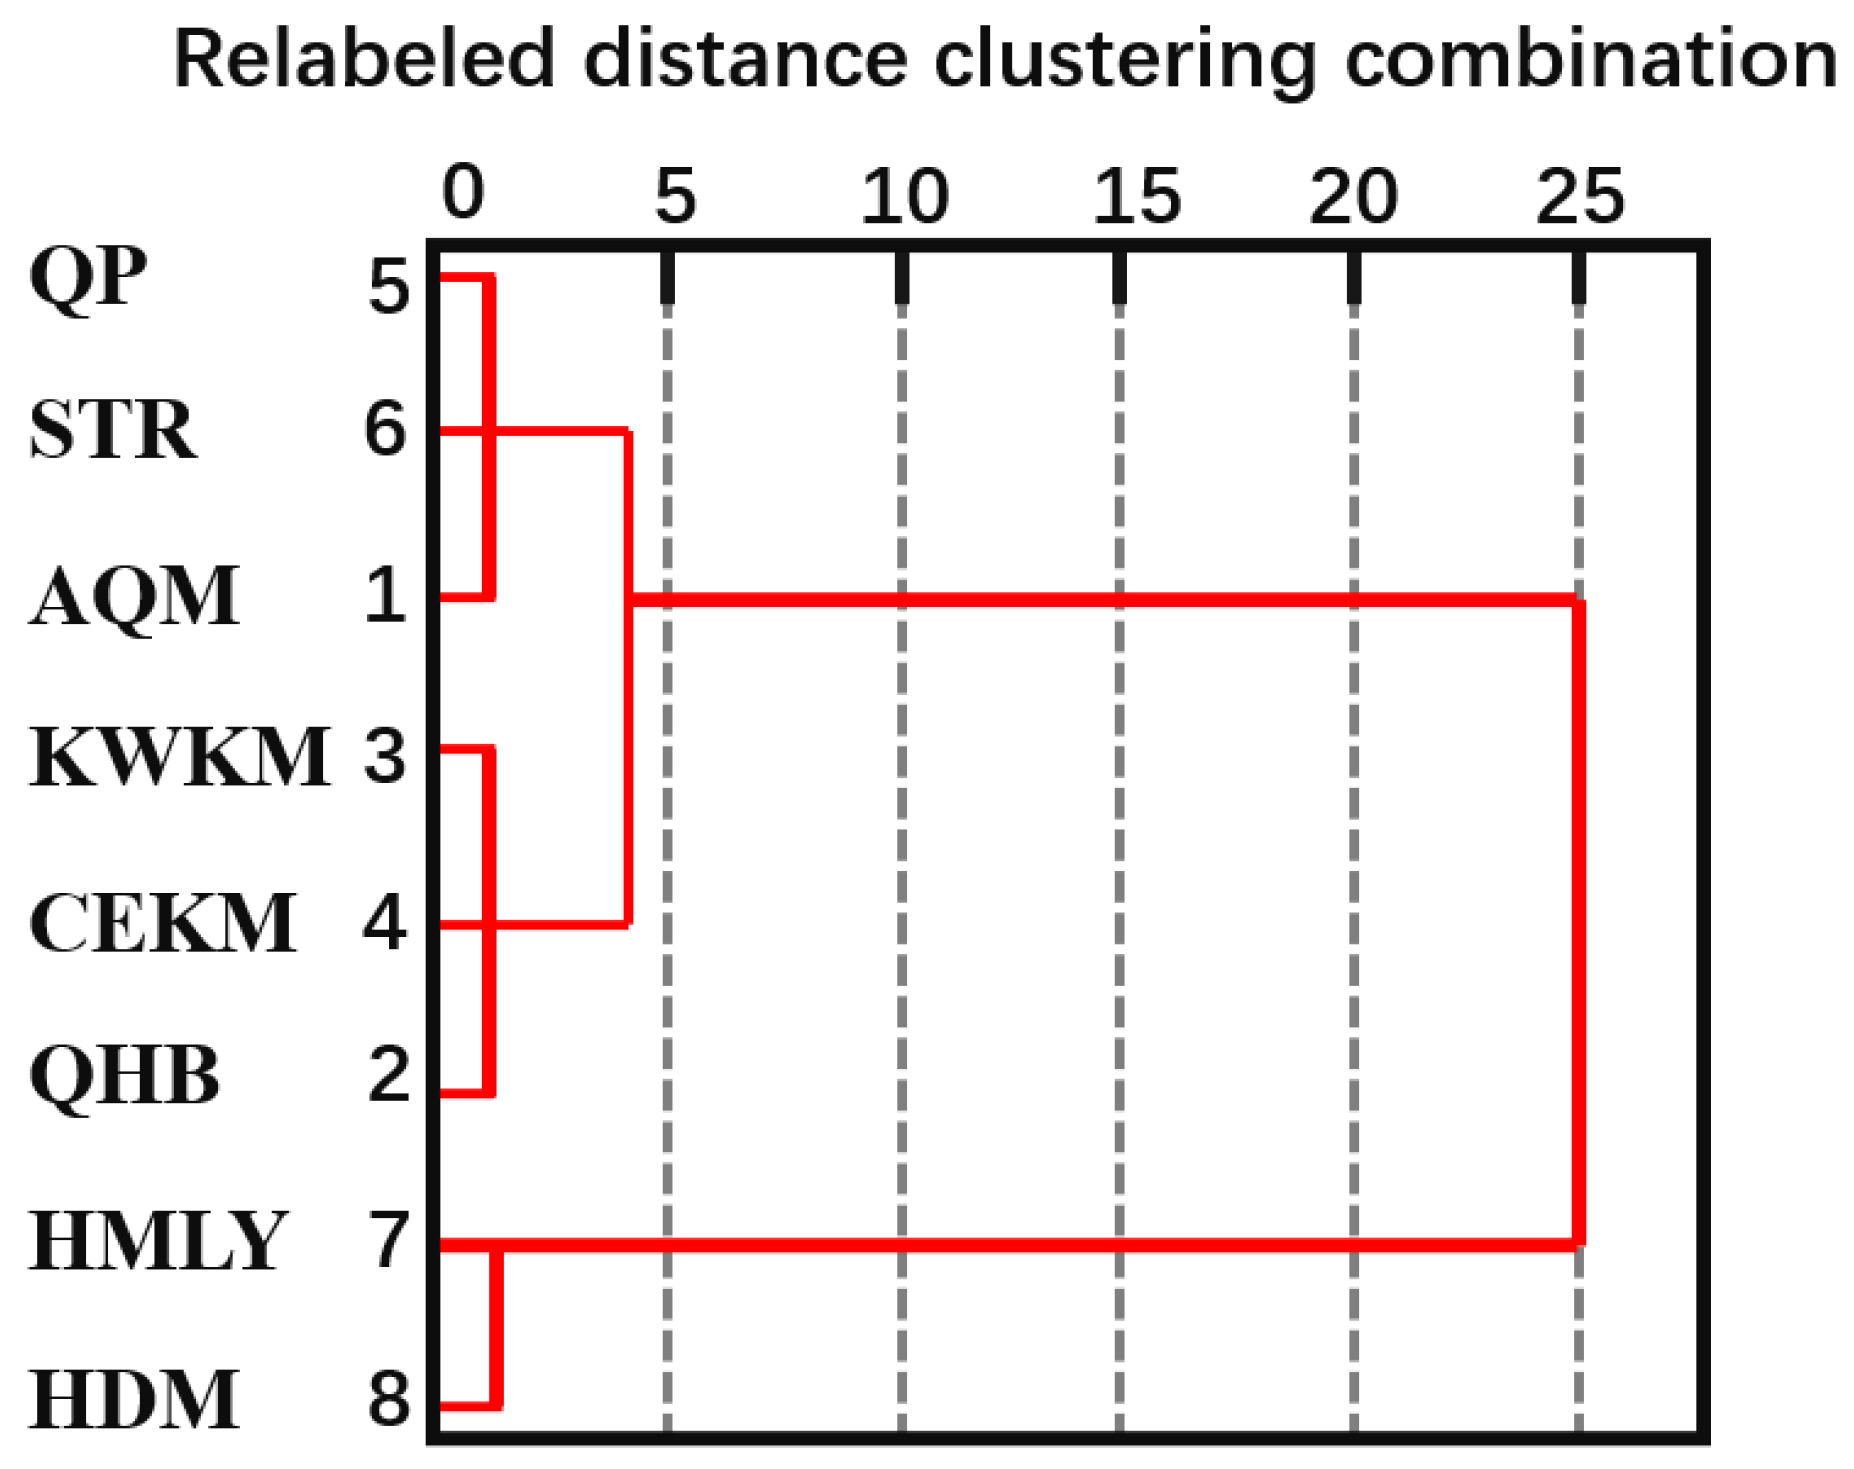
4.2.3. Spatial and Temporal Variation Characteristics of TVDI Based on Cluster Analysis
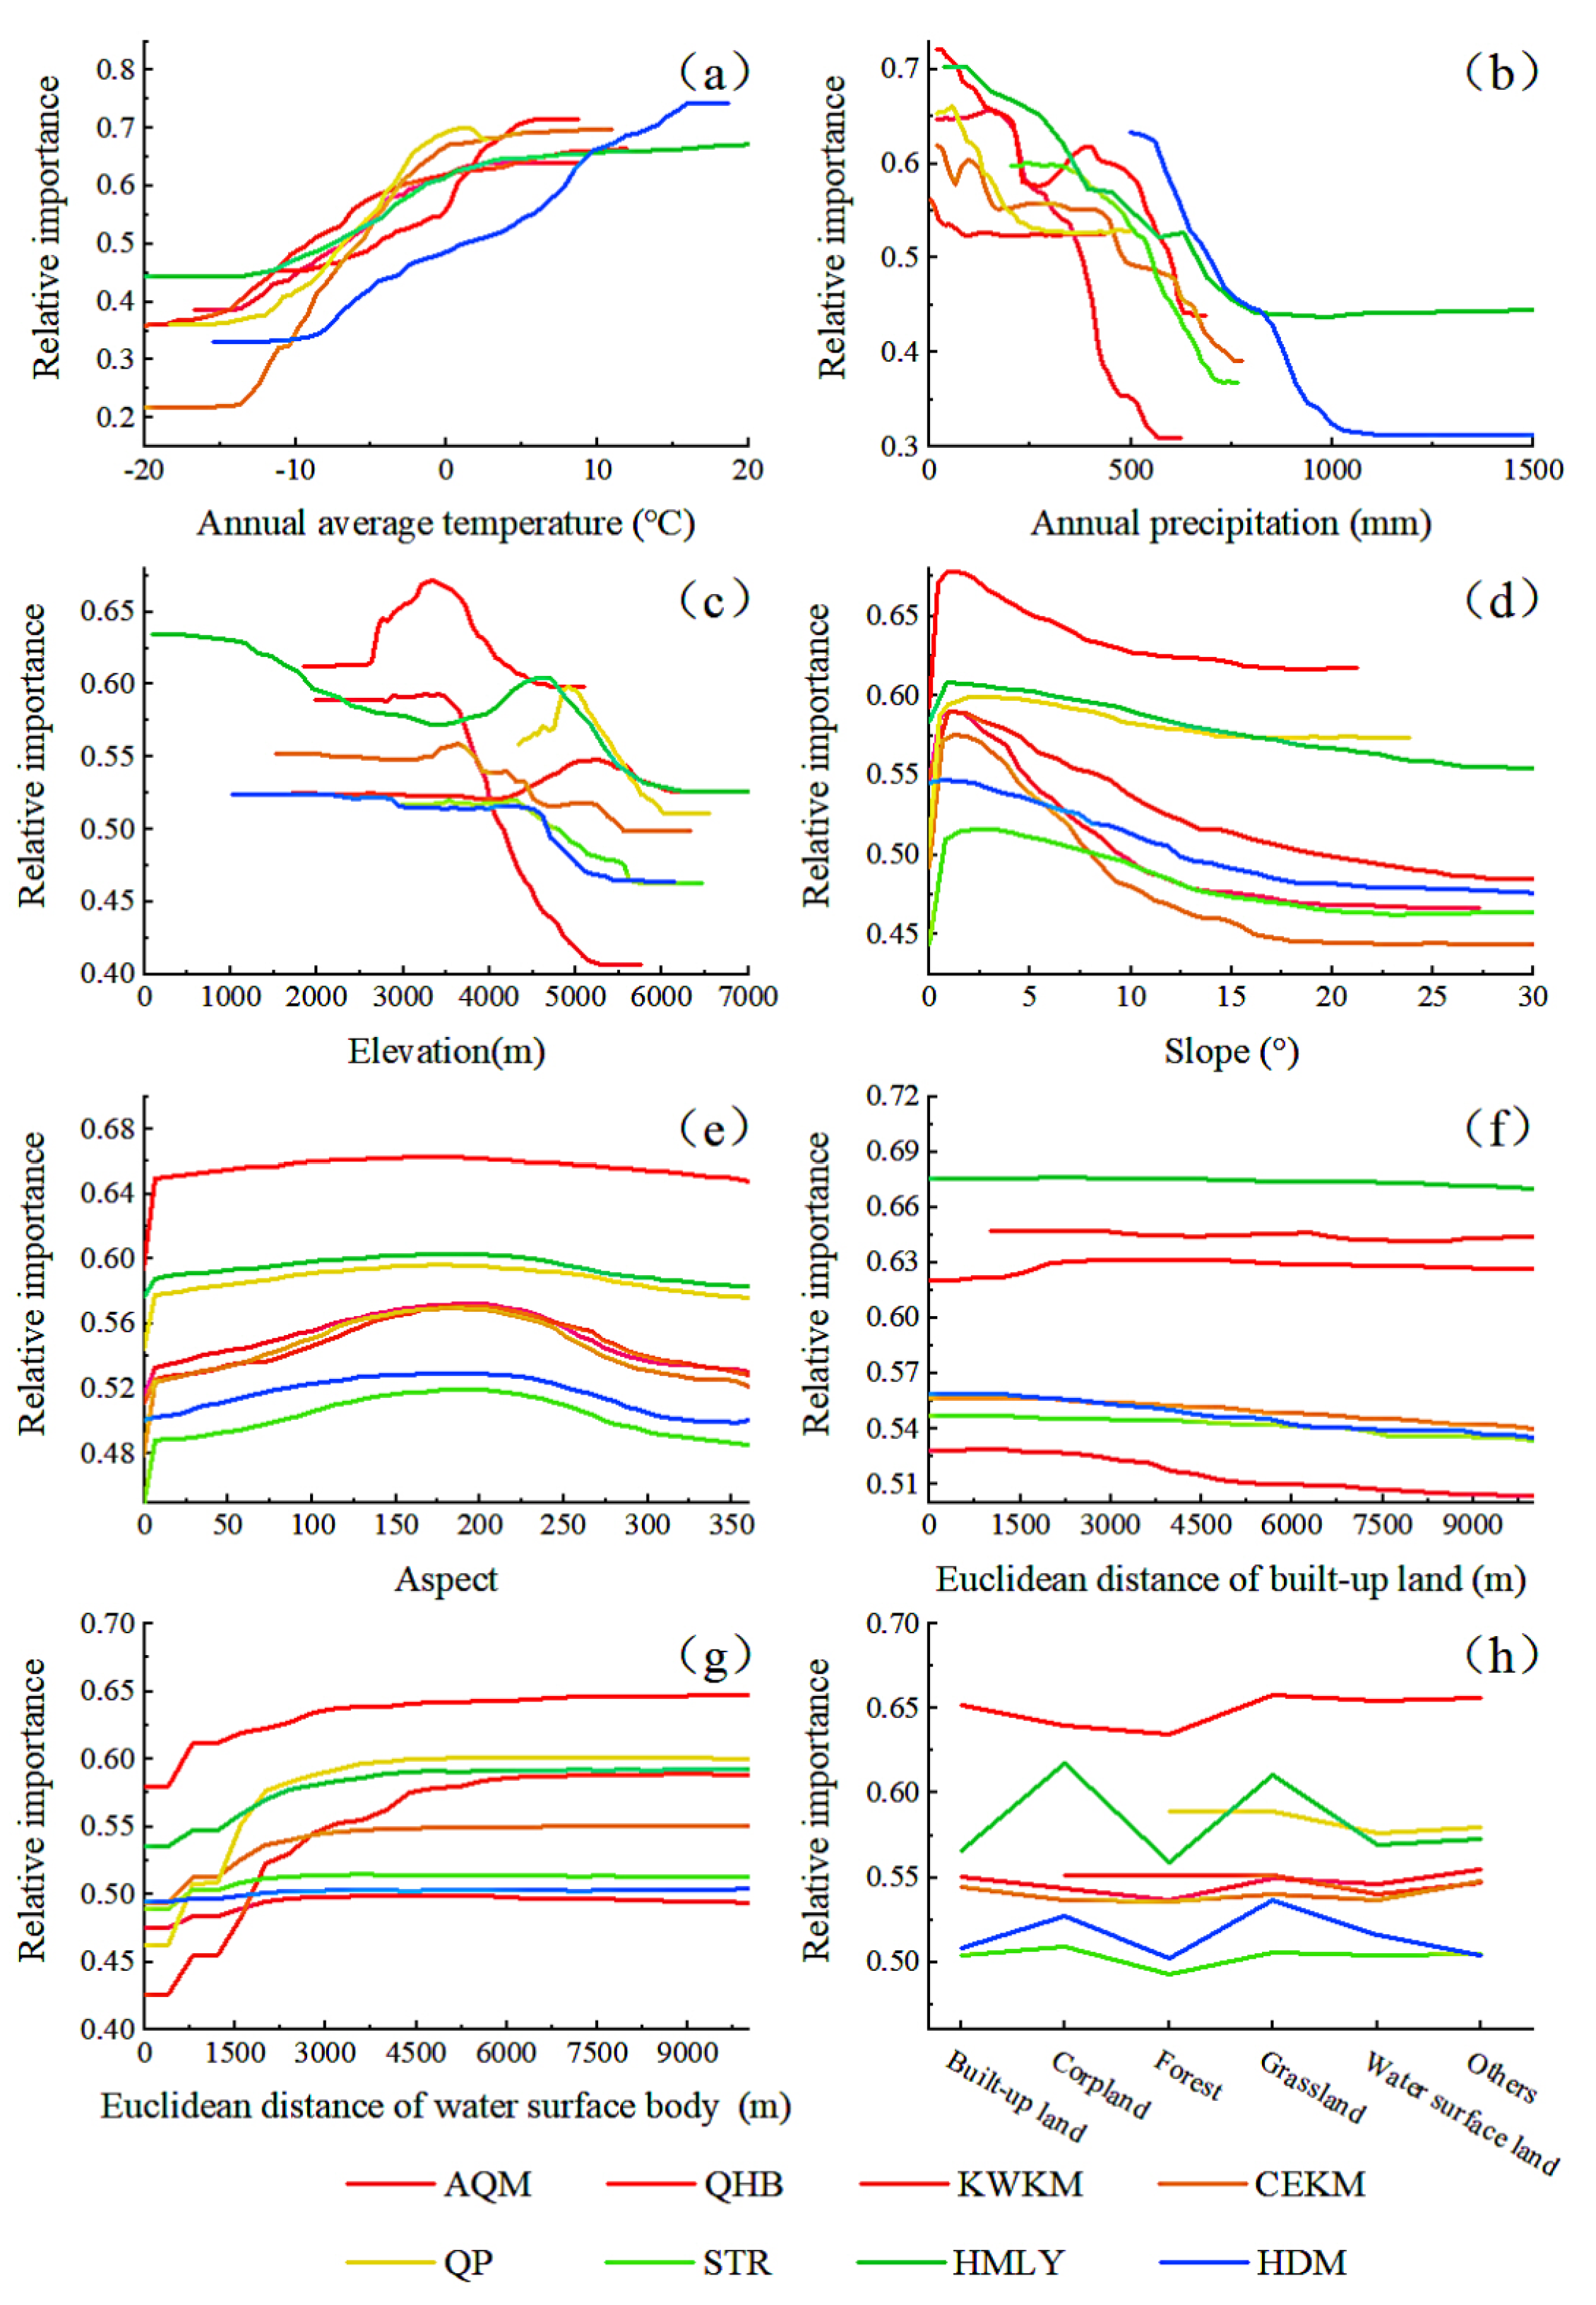
4.3. Characteristics of TVDI Drivers
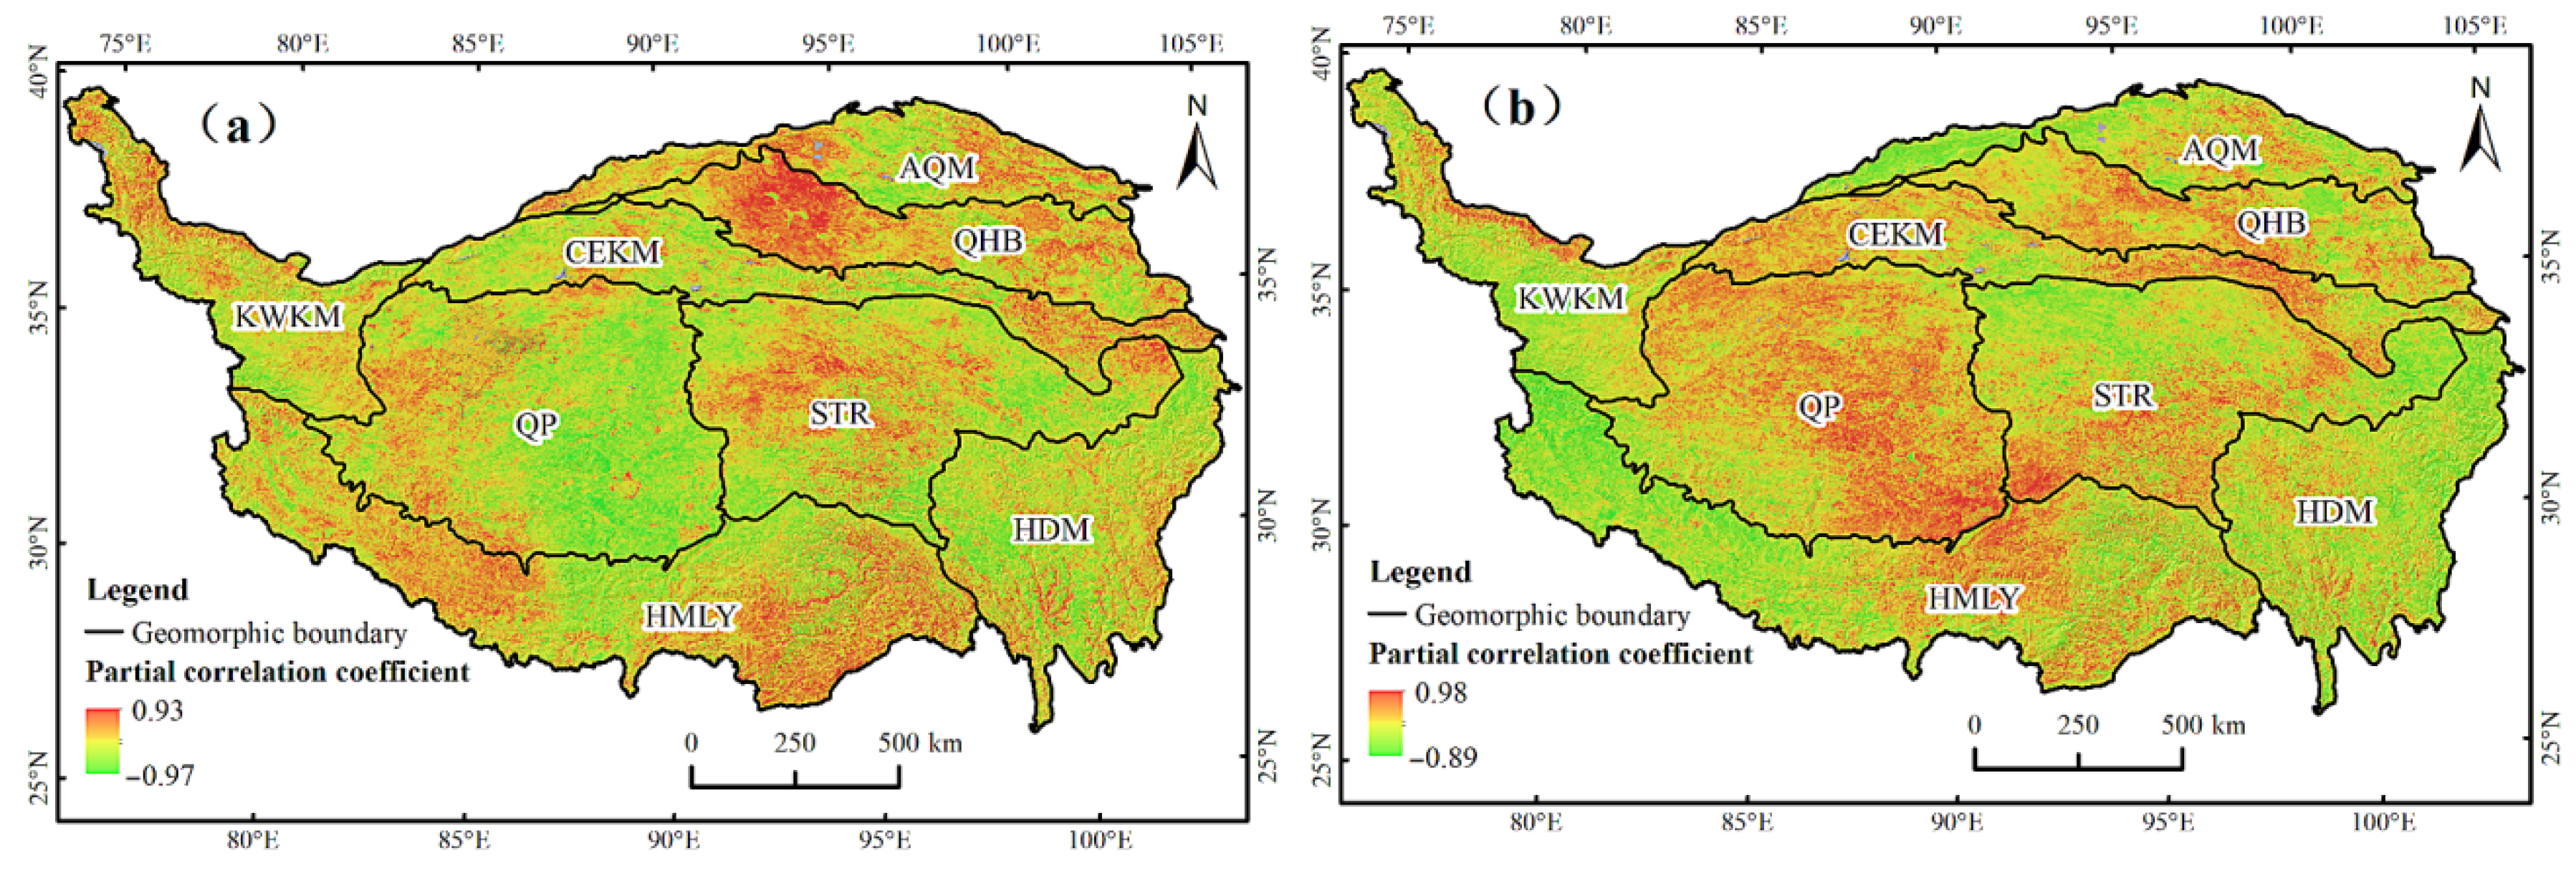
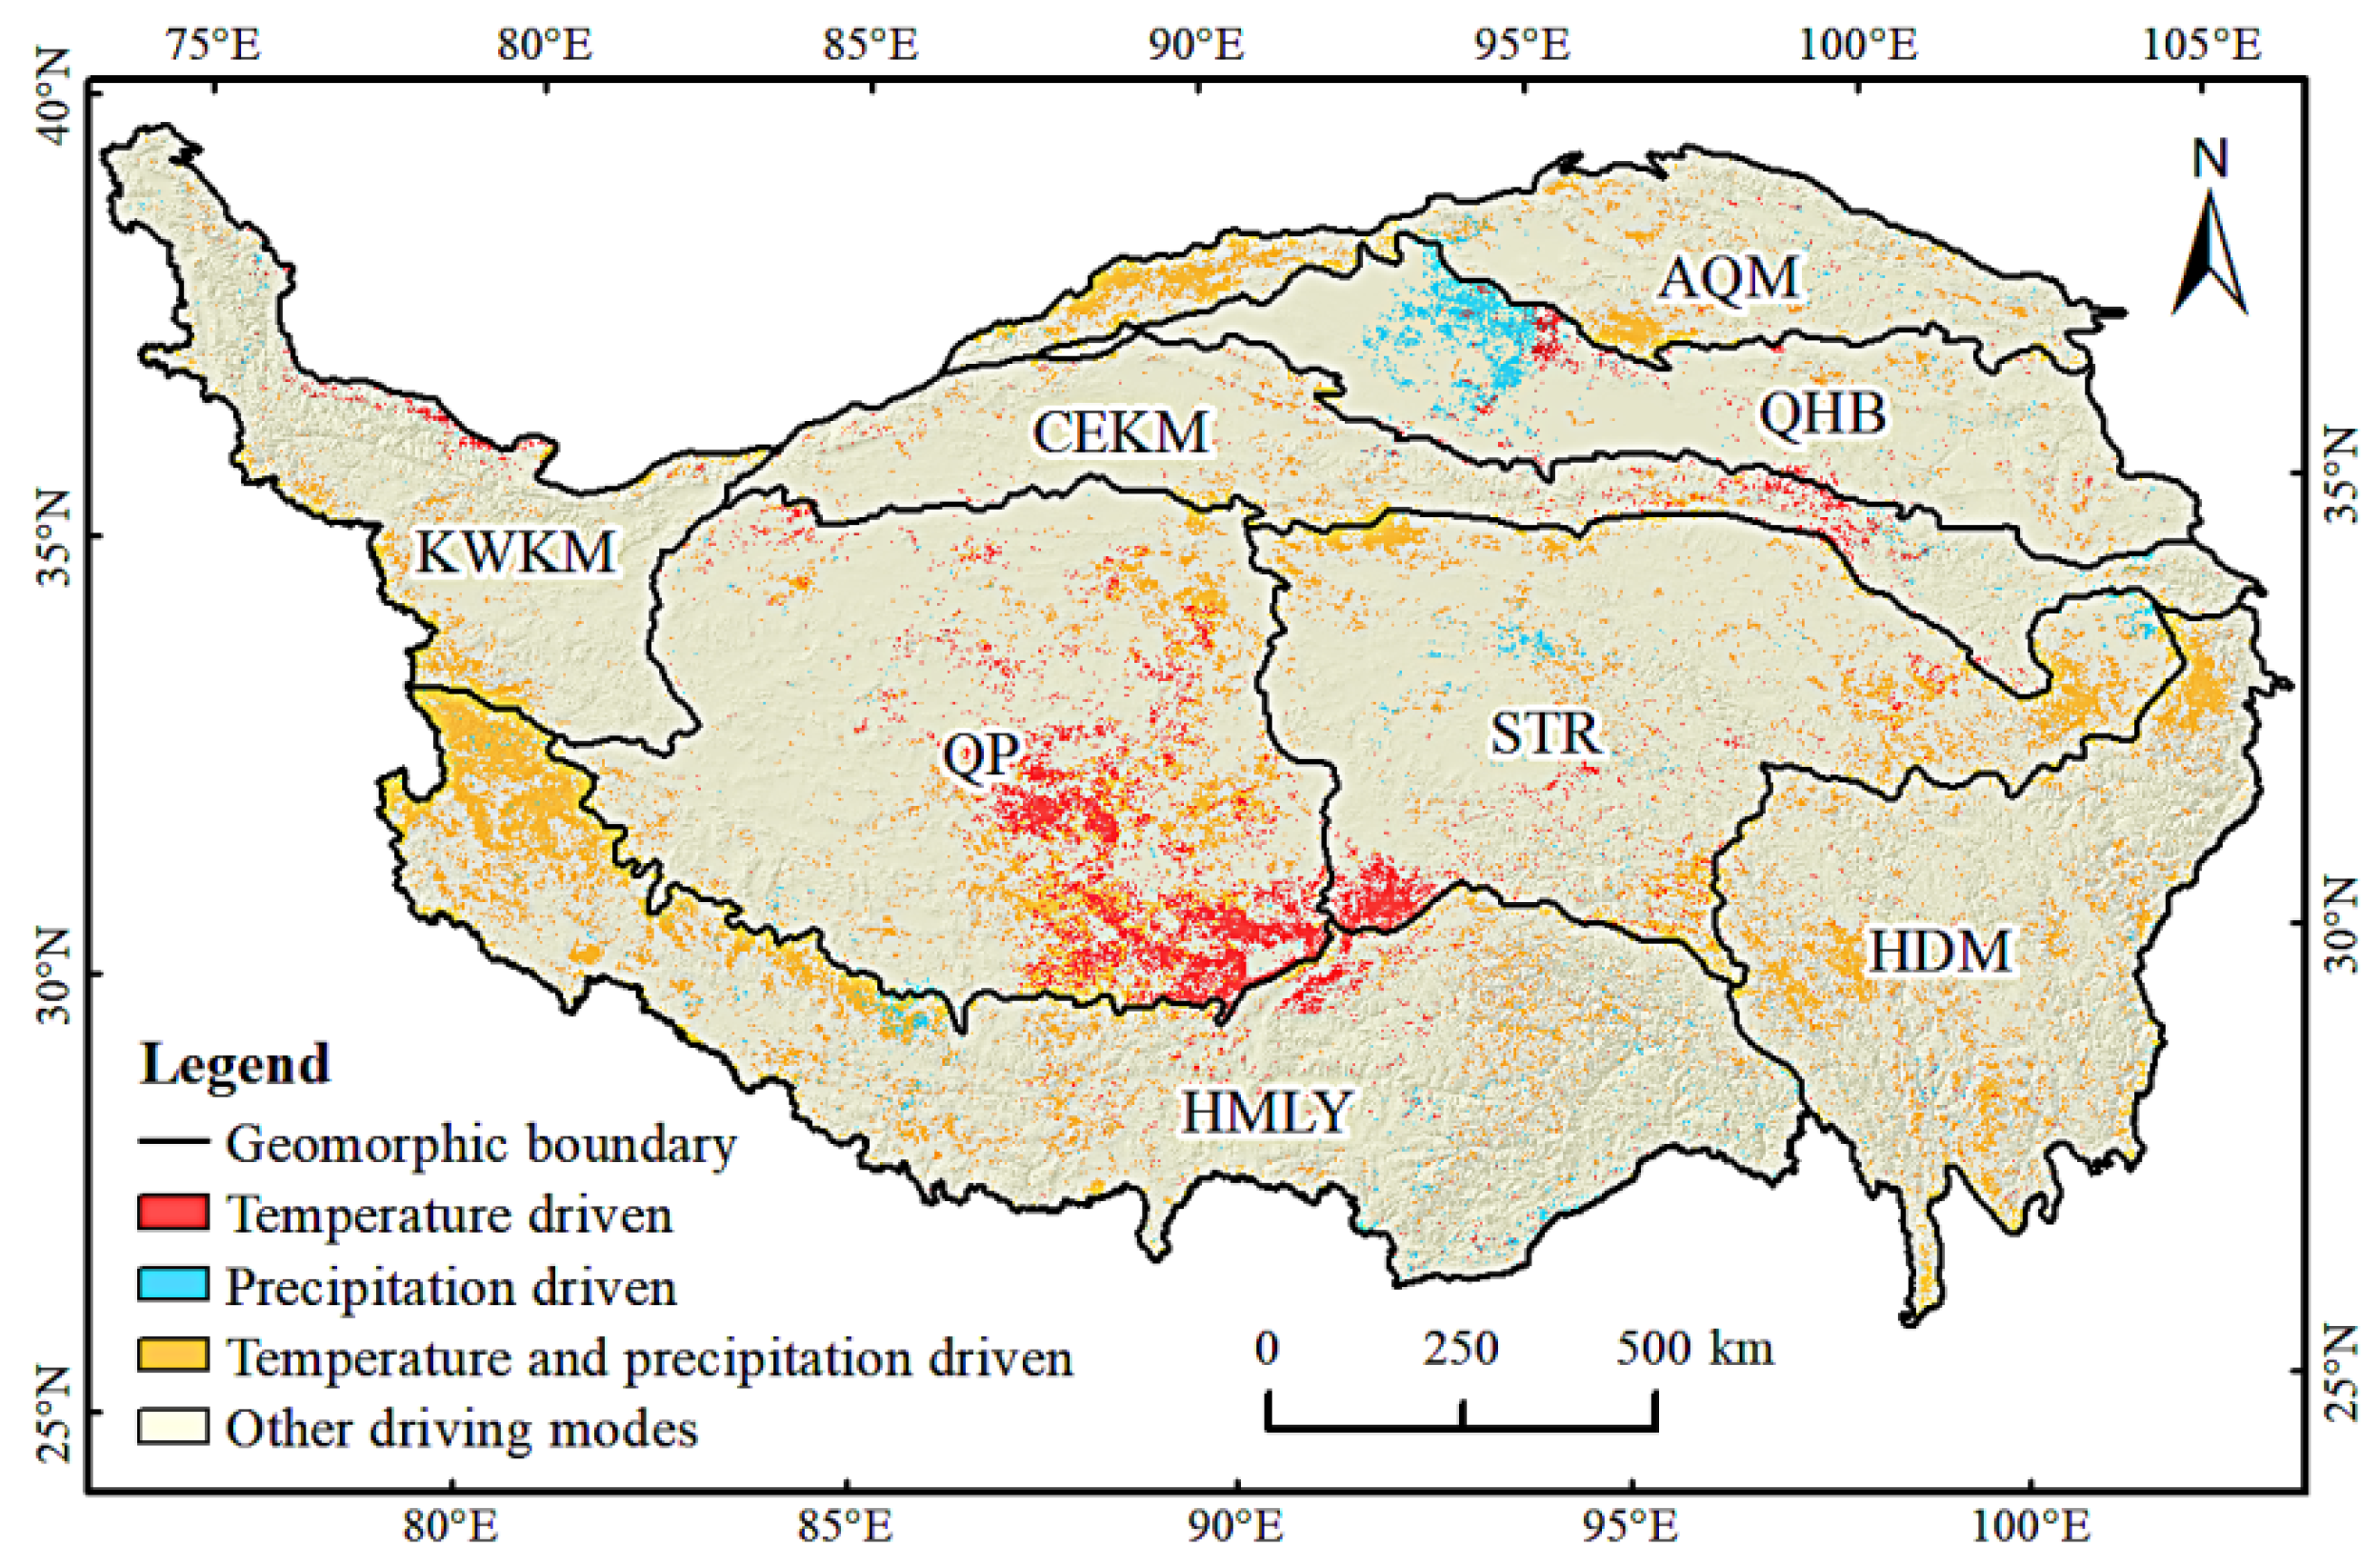
4.3.1. Climate Driven Characteristics of TVDI
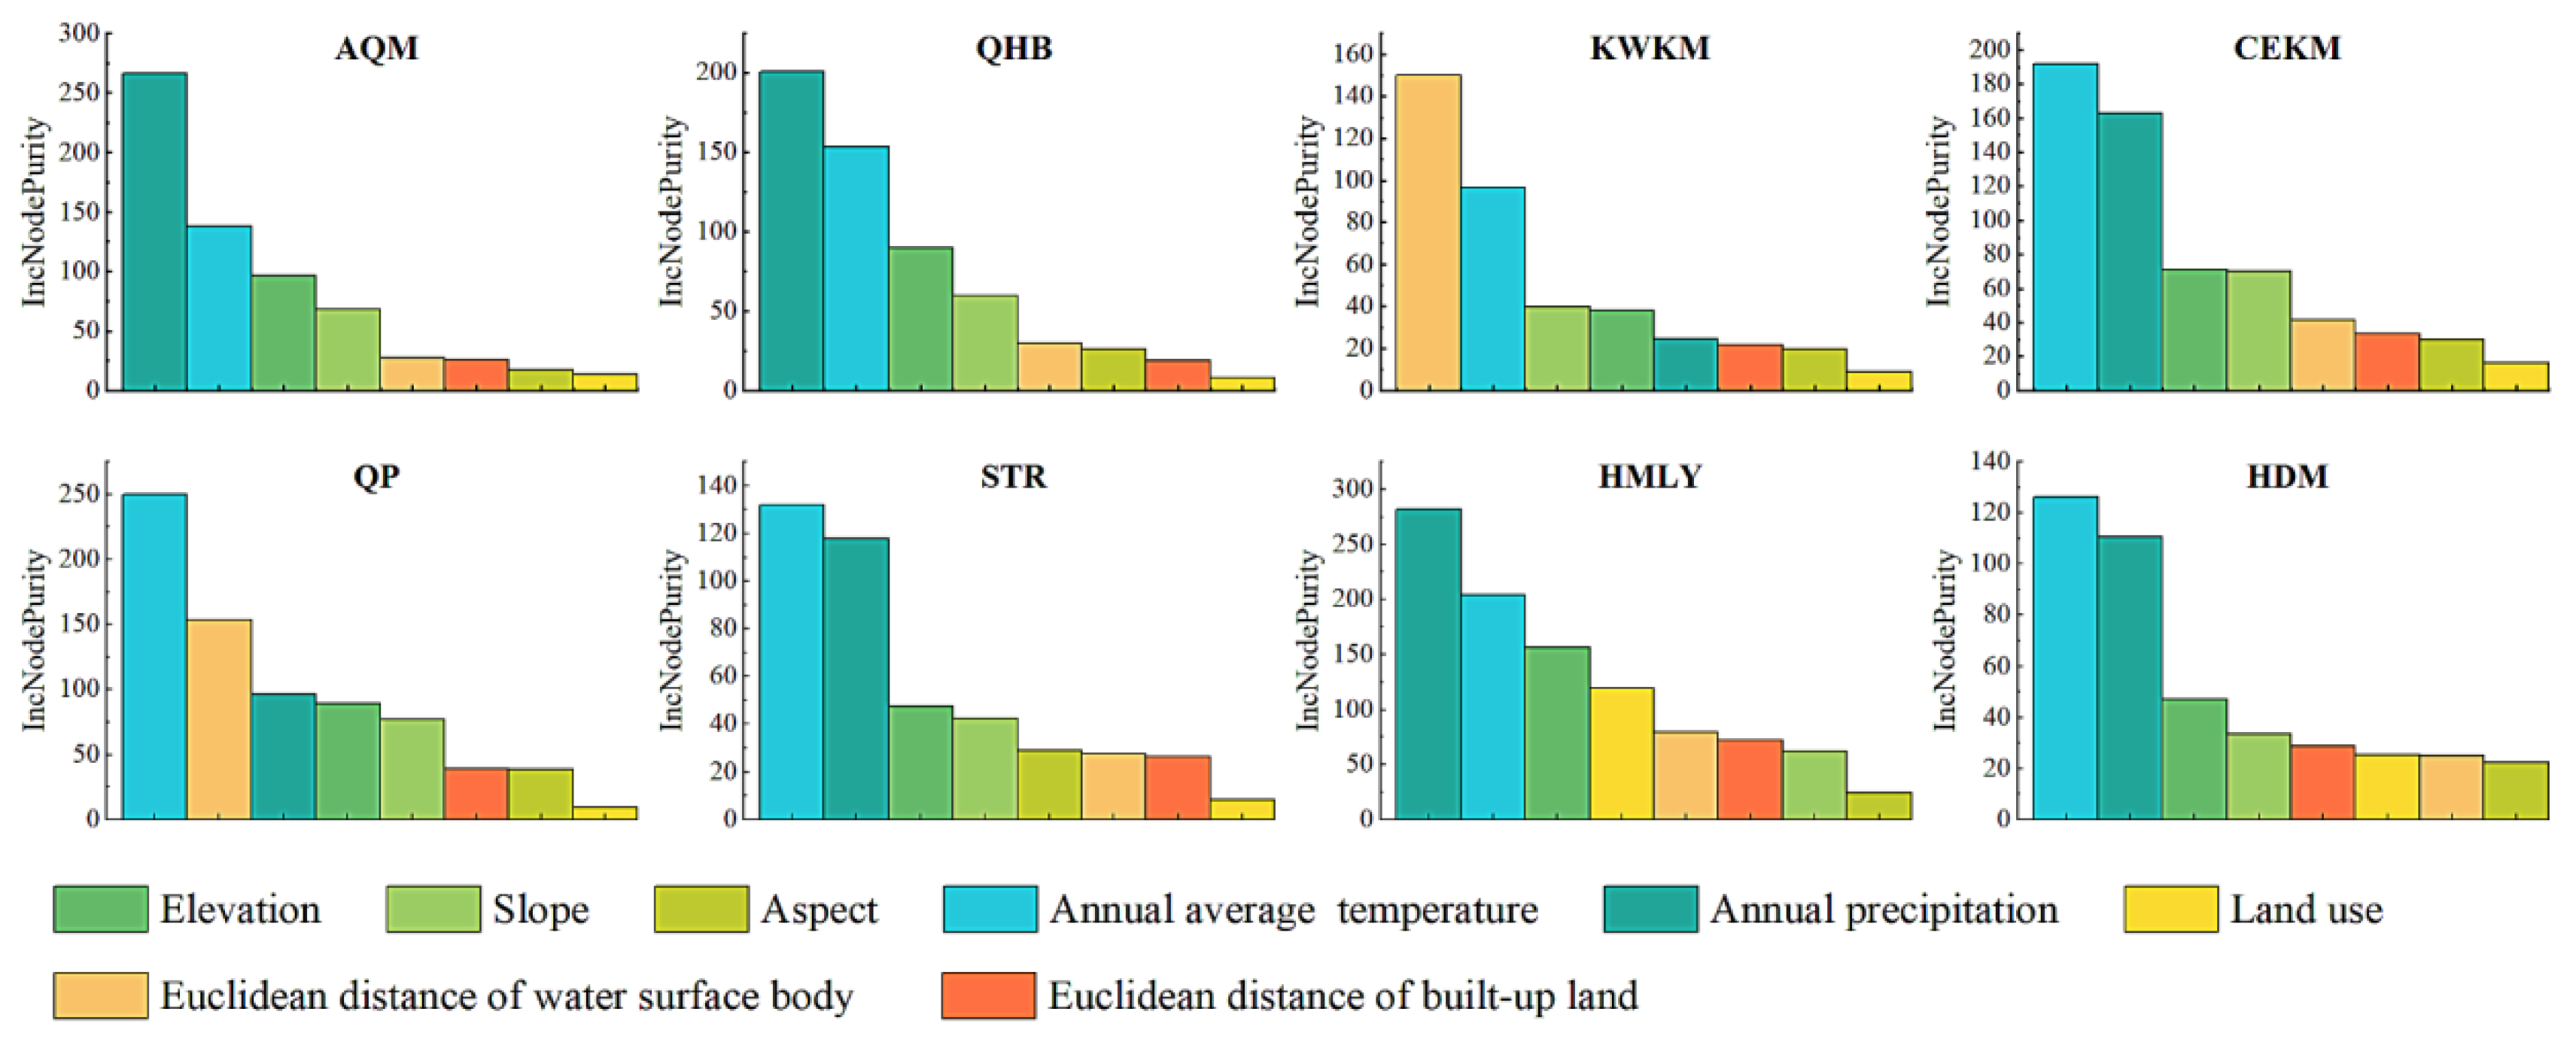
4.3.2. Driver Characteristics of TVDI
5. Discussion
5.1. Analysis of NDVI-LST Feature Space
5.2. Analysis of Spatial and Temporal Variation Trend of TVDI
5.3. Analysis of Driving Force of TVDI Change
5.3.1. Meteorological Factors
5.3.2. Geomorphological Factors
5.3.3. Accessibility Factors
5.3.4. Land Use Type Factor
5.4. Applications and Limitations
6. Conclusions
Author Contributions
Funding
Institutional Review Board Statement
Informed Consent Statement
Data Availability Statement
Acknowledgments
Conflicts of Interest
Appendix A

| Abbreviation | Full Name |
|---|---|
| TVDI | Temperature-Vegetation Drought Index |
| QTP | The Qinghai–Tibet Plateau |
| AQM | The high valley areas of Altun–Qilian Mountains |
| QHB | The high mountain areas of Qaidam-Yellow River-Huangshui River Basin |
| KWKM | The high mountain areas of Karakorum and Western Kunlun Mountain |
| CEKM | The high mountain areas of Central and Eastern Kunlun Mountains |
| QP | The lake and basin areas of Qiangtang Plateau |
| STR | The mountains Sources of the Yangtze River, Yellow River, and Lancang River (Three Rivers or Sanjiangyuan) and the valley bottom of the upper reaches of Three Rivers. |
| HMLY | The high mountain areas of Himalayan |
| HDM | The high mountain and valley areas of Hengduan Mountains |
Appendix B
| Geomorphological Division | Area (km2) | Annual Average of TVDI | Annual Average of Temperature (°C) | Annual Precipitation (mm) | Average Elevation (m) | Average Slope (°) |
|---|---|---|---|---|---|---|
| AQM | 182,475.56 | 0.55 | −4.06 | 260.01 | 3768.06 | 5.55 |
| QHB | 231,433.86 | 0.66 | 2.18 | 250.69 | 3158.97 | 2.51 |
| KWKM | 207,715.72 | 0.55 | −5.62 | 42.70 | 4765.07 | 8.70 |
| CEKM | 237,445.70 | 0.54 | −4.40 | 262.23 | 4387.32 | 4.82 |
| QP | 511,338.20 | 0.59 | −4.09 | 200.31 | 4988.01 | 2.70 |
| STR | 420,819.40 | 0.50 | −3.59 | 513.88 | 4570.68 | 4.23 |
| HMLY | 513,158.23 | 0.59 | −0.29 | 528.40 | 4492.26 | 8.99 |
| HDM | 316,219.62 | 0.52 | 2.07 | 699.36 | 3934.06 | 10.83 |
| Geomorphological Division | Year | Dry-Edge Equation | R2 | Wet-Edge Equation | R2 |
|---|---|---|---|---|---|
| AQM | 2000 | Dy = 46.4 − 9.89*X | 0.27 | Wy = 11.7 + 11.3*X | 0.50 |
| 2001 | Dy = 48.6 − 15.2*X | 0.68 | Wy = 13.8 + 8.89*X | 0.81 | |
| 2002 | Dy = 46.0 − 15.9*X | 0.78 | Wy = 11.7 + 9.81*X | 0.79 | |
| 2003 | Dy = 43.3 − 6.96*X | 0.35 | Wy = 11.1 + 11.8*X | 0.85 | |
| 2004 | Dy = 46.5 − 12.8*X | 0.69 | Wy = 11.4 + 11.1*X | 0.57 | |
| 2005 | Dy = 46.6 − 12.6*X | 0.81 | Wy = 8.89 + 14.2*X | 0.41 | |
| 2006 | Dy = 49.3 − 19.0*X | 0.93 | Wy = 12.1 + 11.7*X | 0.75 | |
| 2007 | Dy = 50.4 − 18.7*X | 0.70 | Wy = 10.2 + 14.3*X | 0.59 | |
| 2008 | Dy = 49.3 − 21.7*X | 0.78 | Wy = 11.0 + 11.6*X | 0.66 | |
| 2009 | Dy = 42.5 − 6.92*X | 0.27 | Wy = 10.8 + 12.6*X | 0.66 | |
| 2010 | Dy = 48.4 − 16.8*X | 0.85 | Wy = 9.60 + 15.5*X | 0.59 | |
| 2011 | Dy = 43.4 − 10.1*X | 0.60 | Wy = 8.41 + 16.7*X | 0.70 | |
| 2012 | Dy = 41.8 − 6.87*X | 0.39 | Wy = 8.60 + 14.1*X | 0.71 | |
| 2013 | Dy = 47.2 − 15.2*X | 0.62 | Wy = 10.9 + 12.9*X | 0.58 | |
| 2014 | Dy = 43.8 − 8.21*X | 0.45 | Wy = 11.5 + 10.5*X | 0.59 | |
| 2015 | Dy = 47.1 − 15.9*X | 0.63 | Wy = 10.6 + 11.1*X | 0.88 | |
| 2016 | Dy = 53.1 − 20.1*X | 0.92 | Wy = 14.5 + 8.93*X | 0.52 | |
| 2017 | Dy = 50.1 − 22.7*X | 0.82 | Wy = 8.76 + 15.5*X | 0.67 | |
| 2018 | Dy = 48.5 − 18.5*X | 0.75 | Wy = 8.97 + 12.7*X | 0.59 | |
| 2019 | Dy = 45.2 − 12.1*X | 0.69 | Wy = 7.19 + 14.4*X | 0.54 | |
| QHB | 2000 | Dy = 60.9 − 29.2*X | 0.78 | Wy = 12.8 + 7.97*X | 0.52 |
| 2001 | Dy = 57.7 − 25.7*X | 0.69 | Wy = 10.9 + 12.4*X | 0.78 | |
| 2002 | Dy = 55.7 − 27.4*X | 0.92 | Wy = 11.3 + 10.0*X | 0.57 | |
| 2003 | Dy = 54.3 − 17.7*X | 0.59 | Wy = 12.4 + 9.58*X | 0.81 | |
| 2004 | Dy = 53.4 − 20.7*X | 0.83 | Wy = 10.9 + 11.2*X | 0.90 | |
| 2005 | Dy = 56.0 − 27.9*X | 0.92 | Wy = 10.6 + 10.5*X | 0.80 | |
| 2006 | Dy = 57.2 − 28.2*X | 0.86 | Wy = 14.6 + 7.29*X | 0.74 | |
| 2007 | Dy = 59.0 − 30.4*X | 0.79 | Wy = 12.1 + 9.59*X | 0.78 | |
| 2008 | Dy = 55.9 − 24.2*X | 0.77 | Wy = 12.5 + 9.22*X | 0.71 | |
| 2009 | Dy = 54.5 − 23.6*X | 0.80 | Wy = 12.5 + 8.88*X | 0.79 | |
| 2010 | Dy = 53.9 − 22.1*X | 0.96 | Wy = 13.0 + 5.95*X | 0.14 | |
| 2011 | Dy = 56.4 − 26.5*X | 0.86 | Wy = 11.3 + 11.7*X | 0.73 | |
| 2012 | Dy = 53.5 − 23.4*X | 0.92 | Wy = 9.76 + 12.6*X | 0.91 | |
| 2013 | Dy = 56.5 − 27.4*X | 0.87 | Wy = 14.4 + 7.99*X | 0.58 | |
| 2014 | Dy = 57.4 − 22.8*X | 0.57 | Wy = 12.4 + 9.00*X | 0.61 | |
| 2015 | Dy = 57.6 − 28.3*X | 0.84 | Wy = 12.4 + 8.87*X | 0.73 | |
| 2016 | Dy = 59.6 − 29.1*X | 0.86 | Wy = 15.2 + 6.56*X | 0.63 | |
| 2017 | Dy = 56.5 − 25.8*X | 0.82 | Wy = 11.6 + 10.0*X | 0.84 | |
| 2018 | Dy = 55.0 − 24.4*X | 0.85 | Wy = 10.3 + 9.28*X | 0.75 | |
| 2019 | Dy = 56.1 − 28.3*X | 0.91 | Wy = 12.8 + 3.60*X | 0.45 | |
| KWKM | 2000 | Dy = 55.9 − 44.6*X | 0.75 | Wy = −4.8 + 36.0*X | 0.34 |
| 2001 | Dy = 55.8 − 46.5*X | 0.73 | Wy = −6.4 + 44.8*X | 0.38 | |
| 2002 | Dy = 53.3 − 38.6*X | 0.78 | Wy = −5.7 + 41.0*X | 0.44 | |
| 2003 | Dy = 56.2 − 44.7*X | 0.79 | Wy = −5.9 + 39.0*X | 0.41 | |
| 2004 | Dy = 54.6 − 43.4*X | 0.79 | Wy = −0.2 + 19.6*X | 0.11 | |
| 2005 | Dy = 51.8 − 38.2*X | 0.77 | Wy = −7.4 + 38.5*X | 0.44 | |
| 2006 | Dy = 56.1 − 45.8*X | 0.72 | Wy = −0.8 + 31.9*X | 0.39 | |
| 2007 | Dy = 53.0 − 37.2*X | 0.74 | Wy = −0.6 + 37.0*X | 0.34 | |
| 2008 | Dy = 52.1 − 36.2*X | 0.77 | Wy = −3.1 + 36.3*X | 0.42 | |
| 2009 | Dy = 54.3 − 43.4*X | 0.70 | Wy = −4.7 + 40.6*X | 0.39 | |
| 2010 | Dy = 52.8 − 40.6*X | 0.82 | Wy = −6.5 + 32.5*X | 0.41 | |
| 2011 | Dy = 55.5 − 40.6*X | 0.78 | Wy = −2.8 + 31.4*X | 0.28 | |
| 2012 | Dy = 56.2 − 45.1*X | 0.83 | Wy = −7.1 + 33.4*X | 0.46 | |
| 2013 | Dy = 55.6 − 39.3*X | 0.76 | Wy−−3.1 + 35.8*X | 0.31 | |
| 2014 | Dy = 53.5 − 38.3*X | 0.79 | Wy = −8.3 + 45.4*X | 0.51 | |
| 2015 | Dy = 53.2 − 38.2*X | 0.79 | Wy = −7.3 + 35.4*X | 0.33 | |
| 2016 | Dy = 54.9 − 38.9*X | 0.81 | Wy = −8.9 + 45.0*X | 0.50 | |
| 2017 | Dy = 52.0 − 31.3*X | 0.77 | Wy = −2.9 + 27.2*X | 0.31 | |
| 2018 | Dy = 55.7 − 37.0*X | 0.76 | Wy = −9.2 + 43.6*X | 0.53 | |
| 2019 | Dy = 54.4 − 38.8*X | 0.70 | Wy = −6.0 + 32.0*X | 0.40 | |
| CEKM | 2000 | Dy = 49.7 − 17.7*X | 0.65 | Wy = 10.0 + 11.4*X | 0.59 |
| 2001 | Dy = 46.4 − 17.7*X | 0.71 | Wy = 11.6 + 8.75*X | 0.67 | |
| 2002 | Dy = 44.7 − 13.8*X | 0.77 | Wy = 9.82 + 11.6*X | 0.79 | |
| 2003 | Dy = 42.1 − 2.04*X | 0.03 | Wy = 9.56 + 11.1*X | 0.77 | |
| 2004 | Dy = 42.1 − 8.66*X | 0.70 | Wy = 10.4 + 9.08*X | 0.65 | |
| 2005 | Dy = 44.2 − 17.2*X | 0.82 | Wy = 10.9 + 6.97*X | 0.39 | |
| 2006 | Dy = 47.9 − 18.9*X | 0.76 | Wy = 11.4 + 10.5*X | 0.71 | |
| 2007 | Dy = 46.0 − 16.1*X | 0.61 | Wy = 10.5 + 9.32*X | 0.71 | |
| 2008 | Dy = 42.8 − 9.09*X | 0.37 | Wy = 10.8 + 9.99*X | 0.74 | |
| 2009 | Dy = 43.4 − 14.3*X | 0.69 | Wy = 5.75 + 14.1*X | 0.59 | |
| 2010 | Dy = 44.0 − 12.7*X | 0.71 | Wy = 7.84 + 7.88*X | 0.23 | |
| 2011 | Dy = 43.2 − 12.6*X | 0.79 | Wy = 10.2 + 10.6*X | 0.74 | |
| 2012 | Dy = 45.4 − 18.0*X | 0.88 | Wy = 8.15 + 10.6*X | 0.67 | |
| 2013 | Dy = 47.3 − 19.0*X | 0.83 | Wy = 10.4 + 10.9*X | 0.67 | |
| 2014 | Dy = 45.4 − 10.4*X | 0.26 | Wy = 8.99 + 11.8*X | 0.67 | |
| 2015 | Dy = 46.1 − 15.4*X | 0.69 | Wy = 11.1 + 9.57*X | 0.72 | |
| 2016 | Dy = 46.9 − 14.6*X | 0.71 | Wy = 11.5 + 10.0*X | 0.55 | |
| 2017 | Dy = 46.8 − 17.2*X | 0.82 | Wy = 8.92 + 10.2*X | 0.62 | |
| 2018 | Dy = 43.5 − 14.3*X | 0.81 | Wy = 7.32 + 12.1*X | 0.76 | |
| 2019 | Dy = 44.1 − 15.7*X | 0.76 | Wy = 6.38 + 10.5*X | 0.52 | |
| QP | 2000 | Dy = 49.9 − 30.3*X | 0.82 | Wy = 6.68 + 14.1*X | 0.61 |
| 2001 | Dy = 47.3 − 29.5*X | 0.87 | Wy = 6.81 + 16.8*X | 0.71 | |
| 2002 | Dy = 49.1 − 26.3*X | 0.84 | Wy = 7.04 + 16.5*X | 0.69 | |
| 2003 | Dy = 48.3 − 30.0*X | 0.88 | Wy = 5.93 + 17.1*X | 0.78 | |
| 2004 | Dy = 46.9 − 23.7*X | 0.84 | Wy = 7.46 + 15.2*X | 0.68 | |
| 2005 | Dy = 49.4 − 28.8*X | 0.86 | Wy = 6.84 + 17.3*X | 0.69 | |
| 2006 | Dy = 49.9 − 30.5*X | 0.89 | Wy = 6.90 + 17.9*X | 0.66 | |
| 2007 | Dy = 4.9 − 21.5*X | 0.65 | Wy = 6.17 + 18.2*X | 0.64 | |
| 2008 | Dy = 46.2 − 28.5*X | 0.87 | Wy = 5.29 + 17.0*X | 0.74 | |
| 2009 | Dy = 50.5 − 26.2*X | 0.80 | Wy = 7.67 + 14.1*X | 0.58 | |
| 2010 | Dy = 50.5 − 27.6*X | 0.75 | Wy = 2.17 + 22.1*X | 0.68 | |
| 2011 | Dy = 47.8 − 30.3*X | 0.86 | Wy = 6.33 + 15.7*X | 0.65 | |
| 2012 | Dy = 50.7 − 26.7*X | 0.75 | Wy = 5.47 + 17.7*X | 0.65 | |
| 2013 | Dy = 51.5 − 33.1*X | 0.85 | Wy = 8.32 + 12.4*X | 0.58 | |
| 2014 | Dy = 48.8 − 23.1*X | 0.65 | Wy = 7.07 + 12.7*X | 0.57 | |
| 2015 | Dy = 49.7 − 30.0*X | 0.78 | Wy = 7.17 + 16.5*X | 0.61 | |
| 2016 | Dy = 49.8 − 30.3*X | 0.80 | Wy = 6.71 + 14.5*X | 0.71 | |
| 2017 | Dy = 45.4 − 21.7*X | 0.61 | Wy = 6.75 + 12.9*X | 0.64 | |
| 2018 | Dy = 52.6 − 28.5*X | 0.62 | Wy = 8.08 + 7.84*X | 0.67 | |
| 2019 | Dy = 50.9 − 35.6*X | 0.73 | Wy = 8.23 + 6.56*X | 0.62 | |
| STR | 2000 | Dy = 43.9 − 6.73*X | 0.33 | Wy = 4.06 + 17.0*X | 0.72 |
| 2001 | Dy = 42.0 − 8.80*X | 0.67 | Wy = 2.24 + 20.0*X | 0.78 | |
| 2002 | Dy = 43.9 − 6.73*X | 0.33 | Wy = 4.06 + 17.0*X | 0.72 | |
| 2003 | Dy = 39.8 + 3.17*X | 0.07 | Wy = 4.70 + 14.9*X | 0.66 | |
| 2004 | Dy = 42.6 − 4.75*X | 0.46 | Wy = 5.31 + 13.6*X | 0.70 | |
| 2005 | Dy = 44.1 − 13.5*X | 0.87 | Wy = 5.95 + 12.4*X | 0.86 | |
| 2006 | Dy = 42.8 − 8.80*X | 0.57 | Wy = 6.79 + 14.2*X | 0.78 | |
| 2007 | Dy = 42.7 − 2.36*X | 0.03 | Wy = 5.65 + 16.3*X | 0.79 | |
| 2008 | Dy = 37.3 + 6.57*X | 0.54 | Wy = 2.18 + 16.1*X | 0.44 | |
| 2009 | Dy = 43.8 − 8.60*X | 0.56 | Wy = 3.96 + 18.0*X | 0.87 | |
| 2010 | Dy = 42.4 − 3.37*X | 0.22 | Wy = 0.63 + 21.1*X | 0.74 | |
| 2011 | Dy = 393 − 4.56*X | 0.34 | Wy = 5.75 + 13.8*X | 0.66 | |
| 2012 | Dy = 42.6 − 9.66*X | 0.71 | Wy − 5.89 + 8.53*X | 0.27 | |
| 2013 | Dy = 44.8 − 12.2*X | 0.78 | Wy = 7.45 + 15.2*X | 0.82 | |
| 2014 | Dy = 44.1 − 9.94*X | 0.42 | Wy = 0.85 + 19.4*X | 0.81 | |
| 2015 | Dy = 43.7 − 7.17*X | 0.70 | Wy − 6.60 + 14.8*X | 0.75 | |
| 2016 | Dy = 47.8 − 11.3*X | 0.69 | Wy = 3.75 + 19.6*X | 0.79 | |
| 2017 | Dy = 45.3 − 11.4*X | 0.69 | Wy = 5.24 + 14.2*X | 0.75 | |
| 2018 | Dy = 45.6 − 9.84*X | 0.38 | Wy = 4.46 + 15.0*X | 0.76 | |
| 2019 | Dy = 42.6 − 9.37*X | 0.65 | Wy = 4.54 + 14.0*X | 0.65 | |
| HMLY | 2000 | Dy = 53.1 − 20.3*X | 0.82 | Wy = −12.0 + 17.6*X | 0.73 |
| 2001 | Dy = 51.9 − 21.6*X | 0.88 | Wy = −7.3 + 16.5*X | 0.82 | |
| 2002 | Dy = 53.5 − 22.4*X | 0.92 | Wy−−8.9 + 18.2*X | 0.76 | |
| 2003 | Dy = 51.7 − 20.2*X | 0.93 | Wy = −12.0 + 16.7*X | 0.73 | |
| 2004 | Dy = 52.0 − 19.2*X | 0.87 | Wy = −9.0 + 13.9*X | 0.70 | |
| 2005 | Dy = 52.9 − 21.5*X | 0.87 | Wy = −10.0 + 14.5*X | 0.75 | |
| 2006 | Dy = 52.0 − 20.9*X | 0.92 | Wy = −3.6 + 9.67*X | 0.46 | |
| 2007 | Dy = 56.2 − 22.6*X | 0.68 | Wy = −9.1 + 18.3*X | 0.73 | |
| 2008 | Dy = 48.9 − 16.9*X | 0.92 | Wy = −11.0 + 18.3*X | 0.76 | |
| 2009 | Dy = 55.2 − 21.2*X | 0.71 | Wy = −9.2 + 19.0*X | 0.81 | |
| 2010 | Dy = 56.1 − 23.8*X | 0.81 | Wy = −9.0 + 14.2*X | 0.71 | |
| 2011 | Dy = 50.6 − 19.6*X | 0.89 | Wy = −8.3 + 11.9*X | 0.69 | |
| 2012 | Dy = 54.3 − 22.1*X | 0.89 | Wy = −13.0 + 17.6*X | 0.73 | |
| 2013 | Dy = 52.7 − 20.4*X | 0.95 | Wy = −4.7 + 11.6*X | 0.48 | |
| 2014 | Dy = 54.4 − 21.1*X | 0.77 | Wy = −12.0 + 19.6*X | 0.83 | |
| 2015 | Dy = 52.5 − 19.9*X | 0.88 | Wy = −8.8 + 14.3*X | 0.66 | |
| 2016 | Dy = 51.6 − 18.6*X | 0.87 | Wy = −3.1 + 10.0*X | 0.41 | |
| 2017 | Dy = 51.4 − 19.0*X | 0.87 | Wy = −5.7 + 14.3*X | 0.74 | |
| 2018 | Dy = 55.4 − 22.9*X | 0.87 | Wy = −8.7 + 15.7*X | 0.83 | |
| 2019 | Dy = 54.5 − 21.9*X | 0.78 | Wy = −11. + 18.3*X | 0.84 | |
| HDM | 2000 | Dy = 47.6 − 14.8*X | 0.43 | Wy = −1.1 + 6.43*X | 0.57 |
| 2001 | Dy = 48.3 − 16.9*X | 0.60 | Wy = 2.75 + 8.98*X | 0.27 | |
| 2002 | Dy = 48.3 − 15.9*X | 0.50 | Wy = 4.75 + 6.75*X | 0.43 | |
| 2003 | Dy = 51.4 − 17.0*X | 0.42 | Wy = −0.1 + 10.4*X | 0.50 | |
| 2004 | Dy − 45.1 − 12.1*X | 0.38 | Wy = 1.06 + 4.81*X | 0.23 | |
| 2005 | Dy = 51.0 − 18.1*X | 0.43 | Wy = 0.87 + 4.39*X | 0.24 | |
| 2006 | Dy = 50.3 − 18.2*X | 0.59 | Wy = 7.95 + 2.48*X | 0.09 | |
| 2007 | Dy = 47.8 − 14.3*X | 0.48 | Wy = −0.7 + 11.1*X | 0.42 | |
| 2008 | Dy = 48.2 − 16.4*X | 0.50 | Wy = −3.1 + 13.5*X | 0.63 | |
| 2009 | Dy = 49.3 − 14.4*X | 0.38 | Wy = 5.60 + 2.31*X | 0.07 | |
| 2010 | Dy = 47.6 − 14.3*X | 0.37 | Wy = 2.64 + 6.33*X | 0.46 | |
| 2011 | Dy = 47.9 − 16.4*X | 0.65 | Wy = 4.88 + 1.54*X | 0.02 | |
| 2012 | Dy = 49.6 − 13.1*X | 0.26 | Wy = 2.93 + 3.44*X | 0.12 | |
| 2013 | Dy = 49.3 − 14.5*X | 0.33 | Wy = 7.73 + 5.00*X | 0.20 | |
| 2014 | Dy = 49.1 − 12.0*X | 0.24 | Wy = 2.89 + 4.76*X | 0.17 | |
| 2015 | Dy = 53.2 − 17.9*X | 0.40 | Wy = 6.14 + 1.77*X | 0.02 | |
| 2016 | Dy = 46.8 − 12.8*X | 0.30 | Wy = 3.83 + 3.42*X | 0.15 | |
| 2017 | Dy = 48.6 − 14.3*X | 0.37 | Wy = 3.43 + 8.85*X | 0.56 | |
| 2018 | Dy = 47.7 − 12.6*X | 0.30 | Wy = −0.0 + 7.89*X | 0.54 | |
| 2019 | Dy = 48.9 − 12.0*X | 0.23 | Wy = 3.13 + 6.85*X | 0.30 |
References
- Du, L.T.; Tian, Q.J.; Yu, T.; Meng, Q.Y.; Jancso, T.; Udvardy, P.; Huang, Y. A comprehensive drought monitoring method integrating MODIS and TRMM data. Int. J. Appl. Earth Obs. 2013, 23, 245–253. [Google Scholar] [CrossRef]
- Kogan, N.F. Application of Vegetation Index and Brightness Temperature for Drought Detection. Adv. Space Res. 1995, 15, 91–100. [Google Scholar] [CrossRef]
- Kogan, F.N. Droughts of the late 1980s in the United-States as derived from NOAA polar-orbiying satellite data. Bull. Am. Meteorol. Soc. 1995, 76, 655–668. [Google Scholar] [CrossRef] [Green Version]
- Liu, W.T.; Kogan, F.N. Monitoring regional drought using the Vegetation Condition Index. Int. J. Remote Sens. 1996, 17, 2761–2782. [Google Scholar] [CrossRef]
- McFeeters, S.K. The use of the normalized difference water index (NDWI) in the delineation of open water features. Int. J. Remote Sens. 1996, 17, 1425–1432. [Google Scholar] [CrossRef]
- Kogan, F. World droughts in the new millennium from AVHRR-based vegetation health indices. Eos Trans. Am. Geophys. Union 2002, 83, 557–563. [Google Scholar] [CrossRef]
- Gonzalez, J.; Valdes, J.B. New drought frequency index: Definition and comparative performance analysis. Water Resour. Res. 2006, 42, 1–13. [Google Scholar] [CrossRef]
- McKee, T.; Doesken, N.; Kleist, J. The relationship of drought frequency and duration to time scales. In Proceedings of the 8th Conference on AppliedClimatology, Anaheim, CA, USA, 17–22 January 1993; pp. 179–183. [Google Scholar]
- Palmer, W.C. Meteorological Drought; US Department of Commerce, Weather Bureau: Washington, DC, USA, 1965; Volume 30.
- Guttman, N.B. Comparing the Palmer Drought Index and the standardized precipitation index. J. Am. Water Resour. Assoc. 1998, 34, 113–121. [Google Scholar] [CrossRef]
- Chen, S.; Zhang, L.; Liu, X.; Guo, M.; She, D. The Use of SPEI and TVDI to Assess Temporal-Spatial Variations in Drought Conditions in the Middle and Lower Reaches of the Yangtze River Basin, China. Adv. Meteorol. 2018, 2018, 1–11. [Google Scholar] [CrossRef]
- Heim, R.R. A review of twentieth-century drought indices used in the United States. Bull. Am. Meteorol. Soc. 2002, 83, 1149–1165. [Google Scholar] [CrossRef] [Green Version]
- Vicente-Serrano, S.M.; Begueria, S.; Lopez-Moreno, J.I. A Multiscalar Drought Index Sensitive to Global Warming: The Standardized Precipitation Evapotranspiration Index. J. Clim. 2010, 23, 1696–1718. [Google Scholar] [CrossRef] [Green Version]
- Akinremi, O.O.; McGinn, S.M.; Barr, A.G. Evaluation of the Palmer Drought index on the Canadian prairies. J. Clim. 1996, 9, 897–905. [Google Scholar] [CrossRef] [Green Version]
- Mu, Q.Z.; Zhao, M.S.; Kimball, J.S.; McDowell, N.G.; Running, S.W. A Remotely Sensed Global Terrestrial Drought Severity Index. Bull. Am. Meteorol. Soc. 2013, 94, 83–98. [Google Scholar] [CrossRef] [Green Version]
- Prihodko, L.; Goward, S.N. Estimation of air temperature from remotely sensed surface observations. Remote Sens. Environ. 1997, 60, 335–346. [Google Scholar] [CrossRef]
- Carlson, T.N.; Gillies, R.R.; Schmugge, T.J. An interpretation of methodologies for indirect measurement of soil-water content. Agric. For. Meteorol. 1995, 77, 191–205. [Google Scholar] [CrossRef]
- Sandholt, I.; Rasmussen, K.; Andersen, J. A simple interpretation of the surface temperature/vegetation index space for assessment of surface moisture status. Remote Sens. Environ. 2002, 79, 213–224. [Google Scholar] [CrossRef]
- Bai, J.J.; Yu, Y.; Di, L.P. Comparison between TVDI and CWSI for drought monitoring in the Guanzhong Plain, China. J. Integr. Agric. 2017, 16, 389–397. [Google Scholar] [CrossRef] [Green Version]
- Zormand, S.; Jafari, R.; Koupaei, S.S. Assessment of PDI, MPDI and TVDI drought indices derived from MODIS Aqua/Terra Level 1B data in natural lands. Nat. Hazards 2017, 86, 757–777. [Google Scholar] [CrossRef]
- Wang, C.Y.; Qi, S.H.; Niu, Z.; Wang, J.B. Evaluating soil moisture status in China using the temperature-vegetation dryness index (TVDI). Can. J. Remote Sens. 2004, 30, 671–679. [Google Scholar] [CrossRef]
- Patel, N.; Anapashsha, R.; Kumar, S.; Saha, S.; Dadhwal, V. Assessing potential of MODIS derived temperature/vegetation condition index (TVDI) to infer soil moisture status. Int. J Remote Sens. 2009, 30, 23–39. [Google Scholar] [CrossRef]
- Yan, H.B.; Zhou, G.; Yang, F.F.; Lu, X.J. DEM correction to the TVDI method on drought monitoring in karst areas. Int. J. Remote Sens. 2019, 40, 2166–2189. [Google Scholar] [CrossRef]
- Liu, Y.; Yue, H. The Temperature Vegetation Dryness Index (TVDI) Based on Bi-Parabolic NDVI-T-s Space and Gradient-Based Structural Similarity (GSSIM) for Long-Term Drought Assessment Across Shaanxi Province, China (2000-2016). Remote Sens. 2018, 10, 959. [Google Scholar] [CrossRef] [Green Version]
- Chen, J.; Wang, C.; Jiang, H.; Mao, L.; Yu, Z. Estimating soil moisture using Temperature-Vegetation Dryness Index (TVDI) in the Huang-huai-hai (HHH) plain. Int. J. Remote Sens. 2011, 32, 1165–1177. [Google Scholar] [CrossRef]
- Chen, C.F.; Son, N.T.; Chen, C.R.; Chiang, S.H.; Chang, L.Y.; Valdez, M. Drought monitoring in cultivated areas of Central America using multi-temporal MODIS data. Geomat. Nat. Hazards Risk 2017, 8, 402–417. [Google Scholar] [CrossRef] [Green Version]
- Shi, S.Q.; Yao, F.M.; Zhang, J.H.; Yang, S.S. Evaluation of Temperature Vegetation Dryness Index on Drought Monitoring Over Eurasia. IEEE Access 2020, 8, 30050–30059. [Google Scholar] [CrossRef]
- Maduako, I.N.; Ndukwu, R.I.; Ifeanyichukwu, C.; Igbokwe, O. Multi-index soil moisture estimation from satellite earth observations: Comparative evaluation of the topographic wetness index (TWI), the temperature vegetation dryness index (TVDI) and the improved TVDI (iTVDI). J. Indian Soc. Remote Sens. 2017, 45, 631–642. [Google Scholar] [CrossRef]
- Rahimzadeh-Bajgiran, P.; Omasa, K.; Shimizu, Y. Comparative evaluation of the Vegetation Dryness Index (VDI), the Temperature Vegetation Dryness Index (TVDI) and the improved TVDI (iTVDI) for water stress detection in semi-arid regions of Iran. ISPRS J. Photogramm. 2012, 68, 1–12. [Google Scholar] [CrossRef]
- Yao, Y.; Zhang, B. Estimation of air temperature and warming effect on the Qinghai-Tibet Plateau based on MODIS data. J. Geogr. Sci. 2013, 68, 95–107. (In Chinese) [Google Scholar]
- Wang, W.; Zhu, Y.; Xu, R.; Liu, J. Drought severity change in China during 1961-2012 indicated by SPI and SPEI. Nat. Hazards 2015, 75, 2437–2451. [Google Scholar] [CrossRef]
- He, B.; Lü, A.; Wu, J.; Zhao, L.; Liu, M. Drought hazard assessment and spatial characteristics analysis in China. J. Geogr. Sci. 2011, 21, 235–249. [Google Scholar] [CrossRef]
- Wang, A.; Lettenmaier, D.P.; Sheffield, J. Soil moisture drought in China, 1950–2006. J. Clim. 2011, 24, 3257–3271. [Google Scholar] [CrossRef]
- Xu, K.; Yang, D.; Yang, H.; Li, Z.; Qin, Y.; Shen, Y. Spatio-temporal variation of drought in China during 1961-2012: A climatic perspective. J. Hydrol. 2015, 526, 253–264. [Google Scholar] [CrossRef]
- Feng, W.; Lu, H.; Yao, T.; Yu, Q. Drought characteristics and its elevation dependence in the Qinghai–Tibet plateau during the last half-century. Sci. Rep. 2020, 10, 1–11. [Google Scholar]
- Wang, H.J.; Chen, Y.N.; Pan, Y.P.; Chen, Z.S.; Ren, Z.G. Assessment of candidate distributions for SPI/SPEI and sensitivity of drought to climatic variables in China. Int. J. Climatol. 2019, 39, 4392–4412. [Google Scholar] [CrossRef]
- Jain, V.K.; Pandey, R.; Jain, M.K. Spatio-temporal assessment of vulnerability to drought. Nat. Hazards 2015, 76, 443–469. [Google Scholar] [CrossRef]
- Liu, X.; Zhu, X.; Pan, Y.; Li, S.; Liu, Y.; Ma, Y. Agricultural drought monitoring: Progress, challenges, and prospects. J. Geogr. Sci. 2016, 26, 750–767. [Google Scholar] [CrossRef] [Green Version]
- Famiglietti, J.S.; Rudnicki, J.W.; Rodell, M. Variability in surface moisture content along a hillslope transect: Rattlesnake Hill, Texas. J. Hydrol. 1998, 210, 259–281. [Google Scholar] [CrossRef] [Green Version]
- Reid, I. The influence of slope orientation upon the soil moisture regime, and its hydrogeomorphological significance. J. Hydrol. 1973, 19, 309–321. [Google Scholar] [CrossRef]
- Zhang, Q.; Fan, K.; Singh, V.P.; Song, C.; Xu, C.-Y.; Sun, P. Is Himalayan-Tibetan Plateau “drying”? Historical estimations and future trends of surface soil moisture. Sci. Total Environ. 2019, 658, 374–384. [Google Scholar] [CrossRef]
- Xia, X.; Wenbin, S.; Zhen, W. Analysis of soil moisture changes of the Buertai mining area based on TVDI. J. Min. Sci. Technol. 2019, 4, 285–291. [Google Scholar]
- Liu, H.; Zhang, A.; Jiang, T.; Lv, H.; Liu, X.; Wang, H. The spatiotemporal variation of drought in the Beijing-Tianjin-Hebei metropolitan region (BTHMR) based on the modified TVDI. Sustainability 2016, 8, 1327. [Google Scholar] [CrossRef] [Green Version]
- Breiman, L. Random forests. Mach. Learn. 2001, 45, 5–32. [Google Scholar] [CrossRef] [Green Version]
- Cutler, D.R.; Edwards Jr, T.C.; Beard, K.H.; Cutler, A.; Hess, K.T.; Gibson, J.; Lawler, J.J. Random forests for classification in ecology. Ecology 2007, 88, 2783–2792. [Google Scholar] [CrossRef] [PubMed]
- Li, T.; Tian, Y.; Wu, L. Landslide hazard zoning based on random forest method. Geogr. Geo-Inf. Sci. 2014, 30, 25–30. (In Chinese) [Google Scholar]
- Wang, C.; Jue, A.; Zeng, Y. Population distribution pattern and influencing factors in Tibet Based on random forest model. J. Geogr. Sci. 2019, 74, 664–680. (In Chinese) [Google Scholar]
- Zhang, Q.; Gao, W.; Su, S.; Weng, M.; Cai, Z. Biophysical and socioeconomic determinants of tea expansion: Apportioning their relative importance for sustainable land use policy. Land Use Policy 2017, 68, 438–447. [Google Scholar] [CrossRef]
- Wang, N.; Cheng, W.; Wang, B.; Liu, Q.; Zhou, C. Geomorphological regionalization theory system and division methodology of China. J. Geogr. Sci. 2020, 30, 212–232. [Google Scholar] [CrossRef]
- Yuan, L.; Li, L.; Zhang, T.; Chen, L.; Zhao, J.; Hu, S.; Cheng, L.; Liu, W. Soil moisture estimation for the Chinese Loess Plateau using MODIS-derived ATI and TVDI. Remote Sens. 2020, 12, 3040. [Google Scholar] [CrossRef]
- Wu, L.; Zhang, Y.; Wang, L.; Xie, W.; Song, L.; Zhang, H.; Bi, H.; Zheng, Y.; Zhang, Y.; Zhang, X. Analysis of 22-year Drought Characteristics in Heilongjiang Province Based on Temperature Vegetation Drought Index. Comput. Intell. Neurosci. 2022, 2022, 1003243. [Google Scholar] [CrossRef]
- Yang, F.; Duan, X.; Guo, Q.; Lu, S.; Hsu, K. The spatiotemporal variations and propagation of droughts in Plateau Mountains of China. Sci. Total Environ. 2022, 805, 150257. [Google Scholar] [CrossRef]
- Xu, Y.; Zhang, X.; Wang, X.; Hao, Z.; Singh, V.P.; Hao, F. Propagation from meteorological drought to hydrological drought under the impact of human activities: A case study in northern China. J. Hydrol. 2019, 579, 124147. [Google Scholar] [CrossRef]
- Holgate, C.; Van Dijk, A.; Evans, J.; Pitman, A. Local and remote drivers of southeast Australian drought. Geophys. Res. Lett. 2020, 47, e2020GL090238. [Google Scholar] [CrossRef]
- Liang, L.; ZHAO, S.-h.; QIN, Z.-h.; HE, K.-x.; Chong, C.; LUO, Y.-x.; ZHOU, X.-d. Drought change trend using MODIS TVDI and its relationship with climate factors in China from 2001 to 2010. J. Integr. Agric. 2014, 13, 1501–1508. [Google Scholar] [CrossRef]
- Chen, Y.; Li, X.; Shi, P. Analysis of climatic factors driving NDVI change in China from 1983 to 1992. J. Plant Ecol. 2001, 25, 716. (In Chinese) [Google Scholar]
- Liu, J.; Wu, J.; Wu, Z.; Liu, M. Response of NDVI dynamics to precipitation in the Beijing–Tianjin sandstorm source region. Int. J. Remote Sens. 2013, 34, 5331–5350. [Google Scholar] [CrossRef]
- Cao, X.; Feng, Y.; Wang, J. An improvement of the Ts-NDVI space drought monitoring method and its applications in the Mongolian plateau with MODIS, 2000–2012. Arab. J. Geosci. 2016, 9, 433. [Google Scholar] [CrossRef]
- Son, N.T.; Chen, C.F.; Chen, C.R.; Molina Masferrer, M.G.; Recinos, L.E.M. Multitemporal Landsat-MODIS fusion for cropland drought monitoring in El Salvador. Geocarto Int. 2019, 34, 1363–1383. [Google Scholar] [CrossRef]
- Han, L.; Wang, P.; Wang, J.; Liu, S. Study on characteristic space of vegetation index surface temperature composition. Chin. Sci. Part D 2005, 35, 371–377. [Google Scholar]
- Du, L.; Song, N.; Liu, K.; Hou, J.; Hu, Y.; Zhu, Y.; Wang, X.; Wang, L.; Guo, Y. Comparison of two simulation methods of the temperature vegetation dryness index (TVDI) for drought monitoring in semi-arid regions of China. Remote Sens. 2017, 9, 177. [Google Scholar] [CrossRef] [Green Version]
- Zhang, H.; Ali, S.; Ma, Q.; Sun, L.; Jiang, N.; Jia, Q.; Hou, F. Remote sensing strategies to characterization of drought, vegetation dynamics in relation to climate change from 1983 to 2016 in Tibet and Xinjiang Province, China. Environ. Sci. Pollut. Res. 2021, 28, 21085–21100. [Google Scholar] [CrossRef]
- Li, Y.; Su, F.; Tang, Q.; Gao, H.; Yan, D.; Peng, H.; Xiao, S. Contributions of moisture sources to precipitation in the major drainage basins in the Tibetan Plateau. Sci. China Earth Sci. 2022, 65, 1088–1103. [Google Scholar] [CrossRef]
- Yang, M.; Yao, T.; Gou, X.; Koike, T.; He, Y. The soil moisture distribution, thawing–freezing processes and their effects on the seasonal transition on the Qinghai–Xizang (Tibetan) plateau. J. Asian Earth Sci. 2003, 21, 457–465. [Google Scholar] [CrossRef]
- Wang, S.; Liu, F.; Zhou, Q.; Chen, Q.; Niu, B.; Xia, X. Drought evolution characteristics of the Qinghai-Tibet Plateau over the last 100 years based on SPEI. Nat. Hazards Earth Syst. Sci. Discuss. 2021, 73, 1–20. [Google Scholar]
- Zhao, S.; Cong, D.; He, K.; Yang, H.; Qin, Z. Spatial-temporal variation of drought in China from 1982 to 2010 based on a modified temperature vegetation drought index (mTVDI). Sci. Rep. 2017, 7, 1–12. [Google Scholar] [CrossRef]
- Xie, H.; Ye, J.; Liu, X.; Chongyi, E. Warming and drying trends on the Tibetan Plateau (1971–2005). Theor. Appl. Climatol. 2010, 101, 241–253. [Google Scholar] [CrossRef]
- Zhen, D.; Zhao, D. Alpine desert zone and cold arid core region of Qinghai Xizang Plateau. Arid. Zone Res. 2019, 36, 1–6. (In Chinese) [Google Scholar]
- Xiangtao, W.; Xianzhou, Z.; Junhao, W.; Ben, N. Variations in the drought severity index in response to climate change on the Tibetan Plateau. J. Resour. Ecol. 2020, 11, 304–314. [Google Scholar] [CrossRef]
- Shi, L.; Du, J.; Zhou, K.; Zhuo, G. Temporal and spatial evolution characteristics of soil moisture in Qinghai Tibet Plateau from 1980 to 2012. J. Glaciol. Geocryol. 2017, 38, 1241–1248. (In Chinese) [Google Scholar]
- Meng, X.; Li, R.; Luan, L. Detecting hydrological consistency between soil moisture and precipitation and changes of soil moisture in summer over the Tibetan Plateau. Clim. Dyn. 2018, 51, 4157–4168. [Google Scholar] [CrossRef] [Green Version]
- Shen, Q.; Liang, L.; Luo, X.; Li, Y.J.; Zhang, L.P. Analysis of the spatial-temporal variation characteristics of vegetative drought and its relationship with meteorological factors in China from 1982 to 2010. Environ. Monit. Assess. 2017, 189, 1–14. [Google Scholar] [CrossRef]
- Sayari, N.; Bannayan, M.; Alizadeh, A.; Farid, A. Using drought indices to assess climate change impacts on drought conditions in the northeast of Iran (case study: Kashafrood basin). Meteorol. Appl. 2013, 20, 115–127. [Google Scholar] [CrossRef]
- Dubrovsky, M.; Svoboda, M.D.; Trnka, M.; Hayes, M.J.; Wilhite, D.A.; Zalud, Z.; Hlavinka, P. Application of relative drought indices in assessing climate-change impacts on drought conditions in Czechia. Theor. Appl. Climatol. 2009, 96, 155–171. [Google Scholar] [CrossRef] [Green Version]
- Naumann, G.; Alfieri, L.; Wyser, K.; Mentaschi, L.; Betts, R.; Carrao, H.; Spinoni, J.; Vogt, J.; Feyen, L. Global changes in drought conditions under different levels of warming. Geophys. Res. Lett. 2018, 45, 3285–3296. [Google Scholar] [CrossRef]
- Cook, B.I.; Smerdon, J.E.; Seager, R.; Cook, E.R. Pan-continental droughts in North America over the last millennium. J. Clim. 2014, 27, 383–397. [Google Scholar] [CrossRef] [Green Version]
- Zhen, D.; Lin, Z.; Zhang, X. Research progress of Qinghai Tibet Plateau and global environmental change. Earth Sci. Front. 2002, 9, 95–102. (In Chinese) [Google Scholar]
- Shi, Y.; Li, J.; Li, B. The uplift of the Tibetan Plateau in the late Cenozoic and the environmental changes in East Asia. J. Geogr. Sci. 1999, 54, 10–21. (In Chinese) [Google Scholar]
- Liu, X. Effects of the uplift of the Qinghai Tibet Plateau on the formation of Asian monsoon and global climate and environmental change. Plateau Meterology 1999, 18, 321–332. (In Chinese) [Google Scholar]
- Zhou, X.; Zhao, P.; Chen, J. Study on the influence of thermal action of Qinghai Tibet Plateau on the climate in the Northern Hemisphere. Chin. Sci. Part D 2009, 1473–1486. [Google Scholar]
- Van Loon, A.; Laaha, G. Hydrological drought severity explained by climate and catchment characteristics. J. Hydrol. 2015, 526, 3–14. [Google Scholar] [CrossRef] [Green Version]
- Qiu, Y.; Fu, B.; Wang, J.; Chen, L. Soil moisture variation in relation to topography and land use in a hillslope catchment of the Loess Plateau, China. J. Hydrol. 2001, 240, 243–263. [Google Scholar] [CrossRef]
- Western, A.W.; Grayson, R.B.; Blöschl, G.; Willgoose, G.R.; McMahon, T.A. Observed spatial organization of soil moisture and its relation to terrain indices. Water Resour. Res. 1999, 35, 797–810. [Google Scholar] [CrossRef] [Green Version]
- Jehanzaib, M.; Shah, S.A.; Yoo, J.; Kim, T.-W. Investigating the impacts of climate change and human activities on hydrological drought using non-stationary approaches. J. Hydrol. 2020, 588, 125052. [Google Scholar] [CrossRef]
- Kim, T.-W.; Jehanzaib, M. Drought risk analysis, forecasting and assessment under climate change. Water 2020, 12, 1862. [Google Scholar] [CrossRef]
- Li, Q.; Zhou, J.; Zou, W.; Zhao, X.; Huang, P.; Wang, L.; Shi, W.; Ma, X.; Zhao, Y.; Xue, D. A tributary-comparison method to quantify the human influence on hydrological drought. J. Hydrol. 2021, 595, 125652. [Google Scholar] [CrossRef]
- Rangecroft, S.; Van Loon, A.F.; Maureira, H.; Verbist, K.; Hannah, D.M. An observation-based method to quantify the human influence on hydrological drought: Upstream–downstream comparison. Hydrol. Sci. J. 2019, 64, 276–287. [Google Scholar] [CrossRef] [Green Version]
- Zhang, D.; Zhang, Q.; Qiu, J.; Bai, P.; Liang, K.; Li, X. Intensification of hydrological drought due to human activity in the middle reaches of the Yangtze River, China. Sci. Total Environ. 2018, 637, 1432–1442. [Google Scholar] [CrossRef]
- Pei, y.; Jiang, g.; Cui, j. Theoretical framework of the driving mechanism of drought evolution and its key issues. Adv. Water Sci. 2013, 24, 449–456. (In Chinese) [Google Scholar]
- Yao, T.; Bolch, T.; Chen, D.; Gao, J.; Immerzeel, W.; Piao, S.; Su, F.; Thompson, L.; Wada, Y.; Wang, L. The imbalance of the Asian water tower. Nat. Rev. Earth Environ. 2022, 299, 1–15. [Google Scholar] [CrossRef]
- Yao, T.; Pu, J.; Lu, A.; Wang, Y.; Yu, W. Recent glacial retreat and its impact on hydrological processes on the Tibetan Plateau, China, and surrounding regions. Arct. Antarct. Alp. Res. 2007, 39, 642–650. [Google Scholar] [CrossRef] [Green Version]
- Pritchard, H.D. Asia’s glaciers are a regionally important buffer against drought. Nature 2017, 545, 169–174. [Google Scholar] [CrossRef]
- Wang, M.; Zhou, C.; Wu, L.; Xu, X.; Ou, Y. Wet-drought pattern and its relationship with vegetation change in the Qinghai-Tibetan Plateau during 2001–2010. Arid. Land Geogr. 2013, 36, 49–56. [Google Scholar]
- Hang, J.; Zhang, Y.; Wang, M.; Wang, F.; Tang, Z.; He, H. Temporal and spatial distribution characteristics and influencing factors of drought in Xinjiang in the past 17 years. J. Ecol. 2020, 40, 1077–1088. [Google Scholar]
- Xu, M.; Zhang, T.; Zhang, Y.; Chen, N.; Zhu, J.; He, Y.; Zhao, T.; Yu, G. Drought limits alpine meadow productivity in northern Tibet. Agric. For. Meteorol. 2021, 303, 108371. [Google Scholar] [CrossRef]
- Wang, H.; Magagi, R.; Goïta, K.; Wang, K. Soil moisture retrievals using ALOS2-ScanSAR and MODIS synergy over Tibetan Plateau. Remote Sens. Environ. 2020, 251, 112100. [Google Scholar] [CrossRef]


| Data Class | Data | Data Sources | Spatial Resolution | Time of Data |
|---|---|---|---|---|
| Climatic factor | Precipitation | National Qinghai Tibet Plateau scientific data center (http://www.tpdc.ac.cn/zh-hans/, accessed on 7 April 2021) | 1 km | 2000–2017 |
| Temperature | 2000–2017 | |||
| Geomorphological factor | Elevation | China Geological Survey (https://www.cgs.gov.cn/, accessed on 21 April 2021) | 1 km | 2015 |
| Slope | ||||
| Aspect | ||||
| Accessibility factor | Water surface body | National Qinghai Tibet Plateau scientific data center (http://www.tpdc.ac.cn/zh-hans/, accessed on 21 April 2021) | 1 km | 2015 |
| Built-up land | ||||
| Land use factor | LULC | National Qinghai Tibet Plateau scientific data center (http://www.tpdc.ac.cn/zh-hans/, accessed on 21 April 2021) | 1 km | 2015 |
| Types of TVDI Changes | Zoning Criteria | ||
|---|---|---|---|
| Precipitation driven | t ≥ t0.05 | F ≥ F0.05 | |
| Temperature driven | t ≥ t0.05 | F ≥ F0.05 | |
| Temperature and precipitation driven | t ≤ t0.05 | t ≤ t0.05 | F ≥ F0.05 |
| Other drive types | F ≤ F0.05 | ||
| Grading Criteria | TVDI Trend | |
|---|---|---|
| < 0 | p > t0.01 | Extremely significant decrease |
| p ≥ t0.05 and p ≤ t0.01 | Significant decrease | |
| p < t0.05 | Non-significant decrease | |
| > 0 | p < t0.05 | Non-significant increase |
| p ≥ t 0.05 and p ≤ t0.01 | Significant increase | |
| p > t0.01 | Extremely significant increase | |
| Classification of TVDI | [0, 0.2] | (0.2, 0.4] | (0.4, 0.6] | (0.6, 0.8] | (0.8, 1.0] |
|---|---|---|---|---|---|
| Drought rank | Extremely wet | Wet | Normal | Dry | Extremely dry |
| Drought types | No drought | No drought | No drought | Drought | Severe drought |
| Geomorphological Division | TVDI-Max | TVDI-Min | TVDI-Mean | TVDI-SD | Slope-Mean | TVDI-t3 | TVDI-t4 | TVDI-t5 | TVDI-t6 |
|---|---|---|---|---|---|---|---|---|---|
| AQM | 1.00 | 0.00 | 0.55 | 0.24 | 3.75 | 47.34% | 44.11% | 6.19% | 2.37% |
| QHB | 0.97 | 0.01 | 0.66 | 0.20 | 1.04 | 42.64% | 51.48% | 4.07% | 1.82% |
| KWKM | 1.00 | 0.00 | 0.55 | 0.18 | 1.09 | 20.64% | 69.28% | 8.21% | 1.87% |
| CEKM | 1.00 | 0.00 | 0.54 | 0.21 | 1.54 | 25.59% | 62.20% | 9.96% | 2.25% |
| QP | 0.99 | 0.00 | 0.59 | 0.15 | 5.94 | 46.76% | 42.58% | 6.96% | 3.70% |
| STR | 0.94 | 0.00 | 0.50 | 0.10 | 9.69 | 41.10% | 46.45% | 8.04% | 4.41% |
| HMLY | 1.00 | 0.03 | 0.59 | 0.18 | −3.43 | 58.71% | 37.09% | 3.41% | 0.79% |
| HDM | 1.00 | 0.00 | 0.52 | 0.15 | −1.83 | 73.79% | 24.25% | 1.57% | 0.40% |
Publisher’s Note: MDPI stays neutral with regard to jurisdictional claims in published maps and institutional affiliations. |
© 2022 by the authors. Licensee MDPI, Basel, Switzerland. This article is an open access article distributed under the terms and conditions of the Creative Commons Attribution (CC BY) license (https://creativecommons.org/licenses/by/4.0/).
Share and Cite
Liu, Y.; Ni, Z.; Zhao, Y.; Zhou, G.; Luo, Y.; Li, S.; Wang, D.; Zhang, S. Spatial-Temporal Evolution and Driving Forces of Drying Trends on the Qinghai-Tibet Plateau Based on Geomorphological Division. Int. J. Environ. Res. Public Health 2022, 19, 7909. https://doi.org/10.3390/ijerph19137909
Liu Y, Ni Z, Zhao Y, Zhou G, Luo Y, Li S, Wang D, Zhang S. Spatial-Temporal Evolution and Driving Forces of Drying Trends on the Qinghai-Tibet Plateau Based on Geomorphological Division. International Journal of Environmental Research and Public Health. 2022; 19(13):7909. https://doi.org/10.3390/ijerph19137909
Chicago/Turabian StyleLiu, Yi, Zhongyun Ni, Yinbing Zhao, Guoli Zhou, Yuhao Luo, Shuai Li, Dong Wang, and Shaowen Zhang. 2022. "Spatial-Temporal Evolution and Driving Forces of Drying Trends on the Qinghai-Tibet Plateau Based on Geomorphological Division" International Journal of Environmental Research and Public Health 19, no. 13: 7909. https://doi.org/10.3390/ijerph19137909