1. Introduction
In recent years, waste electrical and electronic equipment (WEEE) has become the fastest-growing household waste stream in the world due to its high consumption rate, short life cycle, and low maintenance. According to the Global E-Waste Monitor 2020, the e-waste stream is expected to reach 74.7 million metric tons by 2030 [
1]. The heavy metals and organic pollutants in WEEE are hazardous to the environment and human health. In order to alleviate environmental pressure and achieve sustainable development, governments worldwide have introduced stricter regulations to speed up companies’ implementation of WEEE collection [
2,
3]. Under external environmental pressure, many companies are starting to implement closed-loop supply chain (CLSC) management [
4,
5]. As an effective means of achieving combined economic and environmental benefits, CLSC includes forward and reverse supply chains managed in a coordinated manner to maximize the use of materials on hand while also preventing excessive remnants of hazardous material entering the environment [
6,
7,
8]. For example, Apple avoids the equivalent of 2.6 million tonnes of mined rock by using recycled tin, gold, and tungsten in iPhone 13 models (
https://www.apple.com/ie/environment/ accessed on 25 July 2022). Xerox collected more than 2.7 million pounds of product through its customer equipment return program in the United States during 2021 (
https://www.xerox.com/en-us/about/ehs/reduce-waste accessed on 25 July 2022). For a complex multi-party system, it is vital to study the optimal decision-making of the participants [
9,
10].
With frequent extreme weather, rising sea levels, and mass species extinctions, global warming is attracting as much attention as WEEE. Governments are adopting various carbon emission reduction policies to reduce greenhouse gas emissions, among which carbon tax is widely considered one of the most effective market mechanisms to reduce carbon emissions [
11,
12]. By considering economic, environmental and social sustainability issues altogether, we have developed a sustainable CLSC framework [
9,
13,
14]. Through a mathematical-modeling approach, Tao et al. [
15] and Liu et al. [
16] analyze that in a sustainable CLSC, as the price of carbon tax increases, the total cost increases, and profits shrink accordingly. Apart from external government subsidies [
17], what a company itself can do to increase profits and sustainability has not been thoroughly examined. This paper proposes green marketing measures and examines the impact of green marketing on retailers’ profits and other members of sustainable CLSC.
The green marketing strategy aims to increase customers’ knowledge, awareness, and concern about environmental issues and to modify their purchase intentions and willingness to return end-of-use products as part of a corporate strategy to meet customer, stakeholder, organizational, and legal requirements [
18,
19]. To establish the image of an environmentally friendly company, Walmart has designed the Project Gigaton for suppliers to avoid gigatons of greenhouse gas emissions, a total of 416 million metric tons of emissions have been avoided through energy, waste, packaging, agriculture, forests, and product use and design since 2017 (
https://corporate.walmart.com/planet/climate-change accessed on 25 July 2022). Under green marketing, Mondal and Giri [
10] examine optimal recycler selection, Li et al. [
20] focus on the impact of government subsidies on the supply chain, and Khan et al. [
21] concentrate on green consumption behavior. There is no literature examining the collaboration of sustainable CLSC manufacturers when the downstream retailer has channel rights, is regulated by a carbon tax, and implements green marketing. As a follower of the channel, it is crucial to ensure the continued profitability of manufacturers. It is also significant to examine whether manufacturers can improve their profits by cooperating and what factors influence this decision.
This paper considers a decentralized sustainable CLSC consisting of two competing manufacturers and a dominant retailer, where the two manufacturers collect used products directly from their customers. Government imposes a carbon tax on the retailer to reduce carbon emissions. The retailer decides whether to adopt green marketing, and the manufacturer decides whether to cooperate. The equilibrium strategy, profit, and social welfare under different CLSC scenarios are investigated by using the Stackelberg and Nash game approach. In particular, we tried to address the following questions:
(1) Does a carbon tax mitigate environmental pollution and affect green marketing and social welfare? Is there an optimal carbon tax that maximizes social welfare? (2) Under the carbon tax policy, can implementing green marketing bring profit improvement to retailers? What is the impact of green marketing on other members of the CLSC? (3) Can collaboration bring profitability gains for competing manufacturers, and what factors influence the decision to collaborate?
The novelties of the article are summarized in two aspects: Firstly, in contrast to the common manufacturer–retailer CLSC model, we consider a sustainable CLSC consisting of two competing manufacturers and one dominant retailer, incorporate green marketing and carbon tax policy into the CLSC, and analyze the impact of these factors on decision making, which has not been addressed. Secondly, we consider environmental, economic, and social welfare factors in sustainable CLSCs and propose sustainable business strategies to companies.
The main contributions of this paper are as follows: Firstly, we give some advice on green marketing decisions for retailers under the carbon tax policy, and we also suggest operating tactics for retailers to cope when channel followers collaborate. Secondly, we examined the two manufacturers’ decisions on whether to cooperate under the retailer’s green marketing, the factors influencing these decisions, and the impact of these decisions on CLSC. Finally, the harm of carbon emissions to the social environment is included in social welfare, the impact of the carbon tax on green marketing and social welfare is studied, and suggestions for government carbon tax formulation are given.
The remainder of this paper is organized as follows. In
Section 2, we briefly review the relevant literature and describe our differences.
Section 3 introduces the problem and assumptions. In
Section 4, we present three models and derive their equilibrium decisions and profits. In
Section 5, we perform some comparative analyses of the optimal outcomes of three models.
Section 6 is the numerical studies. The last section is our conclusions.
4. Model Solution
4.1. Decentralized System without Green Marketing
Considering the CLSC mentioned above, we use the retailer-led Stackelberg–Bertrand game to model it. The game sequence is as follows: First, the government decides the unit carbon emission tax to maximize social welfare. Second, observing the unit carbon emission tax cost, the retailer decides the sale price to maximize his profit. Third, two manufacturers decide the wholesale prices and the return rate based on the decision of the retailer at the same time to maximize their respective profit. In the system without green marketing, the demand function is given by .
The profit function of the retailer and two manufacturers are expressed as follows:
In Equation (
1), the first two parts are the revenue earned by the retailer from selling two different products, and the last part is the total carbon taxes. In Equation (
2), the first part is the revenue earned by the manufacturer from selling the product to the retailer, the second part is the total production cost, and the third part is the total cost of collection.
According to the relevant literature, the generalized social welfare function consists of two components, a positive economic utility, and a disutility term [
52,
53,
54]. Similar to the model of Moraga-Gonzalez and Padron-Fumero [
52], the social welfare function is given by
The first four terms represent positive economic utility, which are manufacturers’ and retailer’s total profit, the government’s carbon tax revenue, and consumer surplus. The last component represents the social loss of environmental pollution caused by the total carbon emissions of the retailer.
Following Johari and Hosseini-Motlagh [
55], the consumer surplus function is expressed as
, where
denote the market price of product
i and
denotes the maximizer price that the consumers are willing to pay for the product
.
We apply the backward induction method to derive the equilibrium solutions. The main results are summarized in
Table 3.
4.2. Decentralized System with Green Marketing
In this section, the game sequence is as follows: First, the government decides the unit carbon emission tax to maximize social welfare. Second, observing the unit carbon emission tax cost, the retailer decides the sale price and green marketing level s to maximize his profit. Third, two manufacturers decide the wholesale prices and the return rate based on the decision of the retailer at the same time to maximize their respective profit. In the system with green marketing, the demand function is given by .
The profit functions of the retailer and two manufacturers are expressed as follows:
We apply the backward induction method to derive the equilibrium solutions. The main results are summarized in
Table 4.
4.3. Partial Cooperation System with Green Marketing
In this section, we model the case of partial cooperation, where two manufacturers form a coalition. The decision sequence is roughly the same as the HG model: First, the government decides the unit carbon emission tax to maximize social welfare. Second, observing the unit carbon emission tax cost, the retailer decides the sale price and green marketing level s to maximize his profit. Third, two manufacturers jointly decide the wholesale prices and the return rate based on the retailer’s decision to maximize their profit.
The profit of the retailer and the manufacturer are expressed as
and
respectively.
We apply the backward induction method to derive the equilibrium solutions. The main results are summarized in
Table 5.
5. Model Analysis
We perform comparative analysis of the equilibrium decisions and profits of the three models in
Section 4 and obtain the following propositions.
Proposition 1. Comparing the scenarios of retailer with and without green marketing, for , the following hold:
- (1)
- (2)
Proposition 1 indicates that the retailer gains more profit when he engages in green marketing. The retailer’s green marketing investment boosts its profits and those of other CLSC members. Green marketing can increase demand by engaging environmentally conscious consumers, thus increasing manufacturer return rate and total carbon emissions.
Proposition 2. In the case of retailer’s participation in green marketing, comparing manufacturers’ cooperation and non-cooperation, the following hold:
- (1)
, where .
- (2)
When , , otherwise, ,
where
- (3)
When, , otherwise, ,
where.
- (4)
When, , otherwise, ,
where.
From Proposition 2 (1)–(2), we find that retailer’s green marketing level is lower in the partial cooperation scenario than in the decentralized scenario. Manufacturers’ total profits may be higher in the partial cooperation scenario than in the decentralized scenario under certain conditions. Proposition 2 (3)–(4) provide thresholds to compare the difference in total carbon emission and the profit of the retailer between the two models, and the thresholds are related to the retailer’s green marketing level. Under certain conditions, the retailer’s profits may be lost.
Proposition 3. In Model y, where , the following hold:
- (1)
, , .
- (2)
, .
Proposition 3 indicates that total carbon emissions decrease with the increase of carbon tax in all models. The level of green marketing by the retailer will decrease with carbon tax increase.
6. Numerical Analysis
In this section, we deliver several numerical examples to illuminate the above theoretical results and gain managerial insights. With reference to the previous parameter values [
51,
56], we assume that
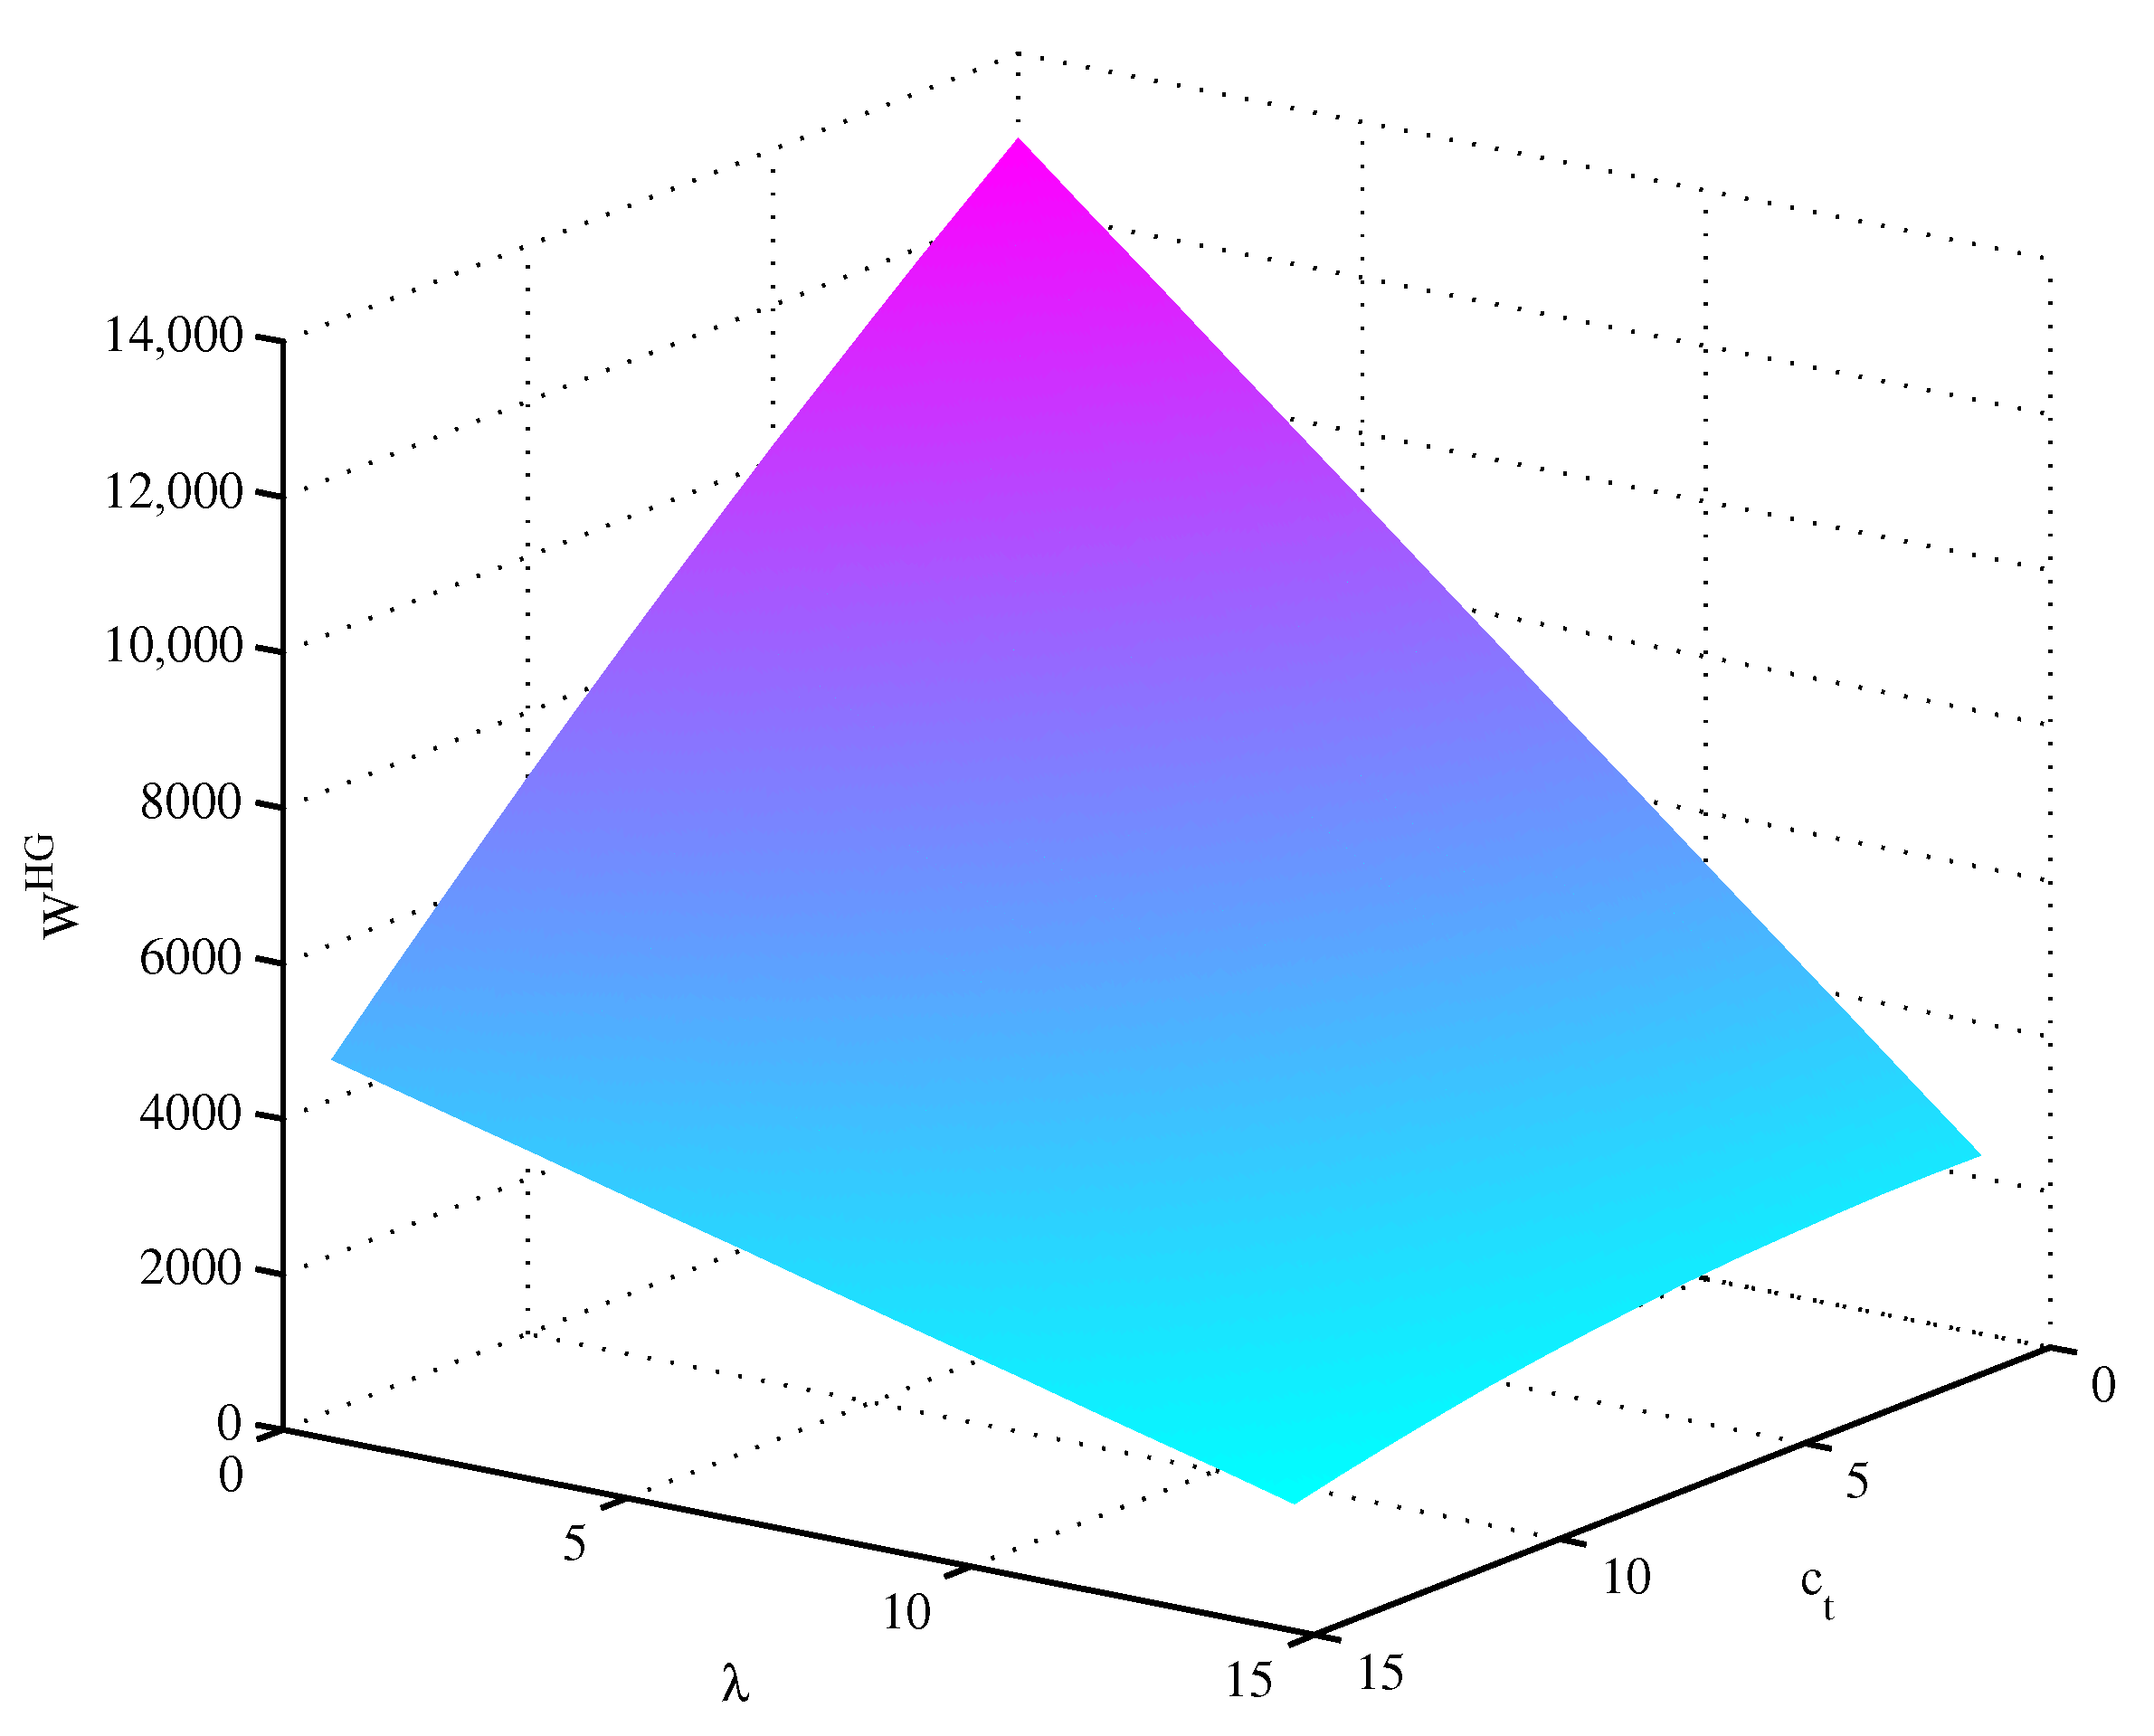
Plotting the social welfare function in the decentralized model with green marketing, we obtain
Figure 2, which depicts the effects of
and
on
. By analyzing
Figure 2, we obtain that there exists an optimal value of positive
to maximize
W when
is higher than 13.69. Otherwise, social welfare decreases as
increases. In the numerical example below, we will randomly take
and
.
The equilibrium solutions of the three models are summarized in
Table 6, and from the calculations in
Table 6, we have the following sorts of observations:
- (1)
The selling price, wholesale price, and return rate of both products, social welfare, and the profit of both manufacturers and retailer in the HG model are higher than those in the NG model. As a downstream firm, the retailer takes green marketing, but the benefits are less than those of upstream firms. Specifically, after the retailer engages in green marketing, the profits of manufacturers 1 and 2 improve by 14.47% and 24.73%, respectively, while the profits of the retailer increase by 8.37%. As the channel leader, the retailer decides the level of green marketing, takes green marketing measures, and raises the selling price of both products for less investment pressure and more profit. Manufacturers are incentivized by the retailer’s green marketing to increase return rates through improving their collection activity investment and to avoid profit decline through higher wholesale prices. Hence, the retailer’s green marketing not only increases his profits but also increases the social welfare and profits of both manufacturers.
- (2)
In the PC model, the selling price, wholesale price, and total profits of manufacturers are higher than those in the HG model. The return rate, green marketing level, the profits of the retailer, and social welfare are lower than those in the HG model. Although manufacturers’ profits are higher than before the cooperation, the trend in total profits is down, as the retailer’s profits have fallen much more than the manufacturers’ growth. Under the manufacturers cooperative model, demand for both products, total profits, government carbon tax revenues, and consumer surplus are lower than before the cooperation. Despite lower environmental pollution, total social welfare is also lower than before the cooperation.
Figure 3 depicts the effects of
on social welfare and total carbon emissions, and from the calculations in
Figure 3, we have the following sorts of observations:
- (1)
Figure 3a shows that social welfare decreases in all three models as the unit carbon tax increases when
. The value of social welfare is influenced by the interaction of positive and negative economic utility. As
increases, the social welfare value of the HG model is always greater than that of the PC model, while the social welfare values of the NG and PC models gradually approach.
- (2)
Figure 3b shows that there exists an optimal value of
to maximize
W in all three models when
, which are
,
, and
. In different models, the optimal value of
is influenced by the marginal social damage of carbon emissions and there exists a threshold value about
. When
exceeds the threshold, there exists an optimal value of
to maximize social welfare; otherwise, social welfare will decrease as
increases.
- (3)
Figure 3c shows that in all three models, total carbon emission decreases as the unit carbon tax increase when
. Total carbon emissions are the highest in the HG model, followed by the NG model and the lowest in the PC model. The government’s carbon tax on the retailer will reduce total carbon emissions, mitigating environmental pollution. Comparing
Figure 3a, we can obtain a corresponding reduction in the total value of social welfare.
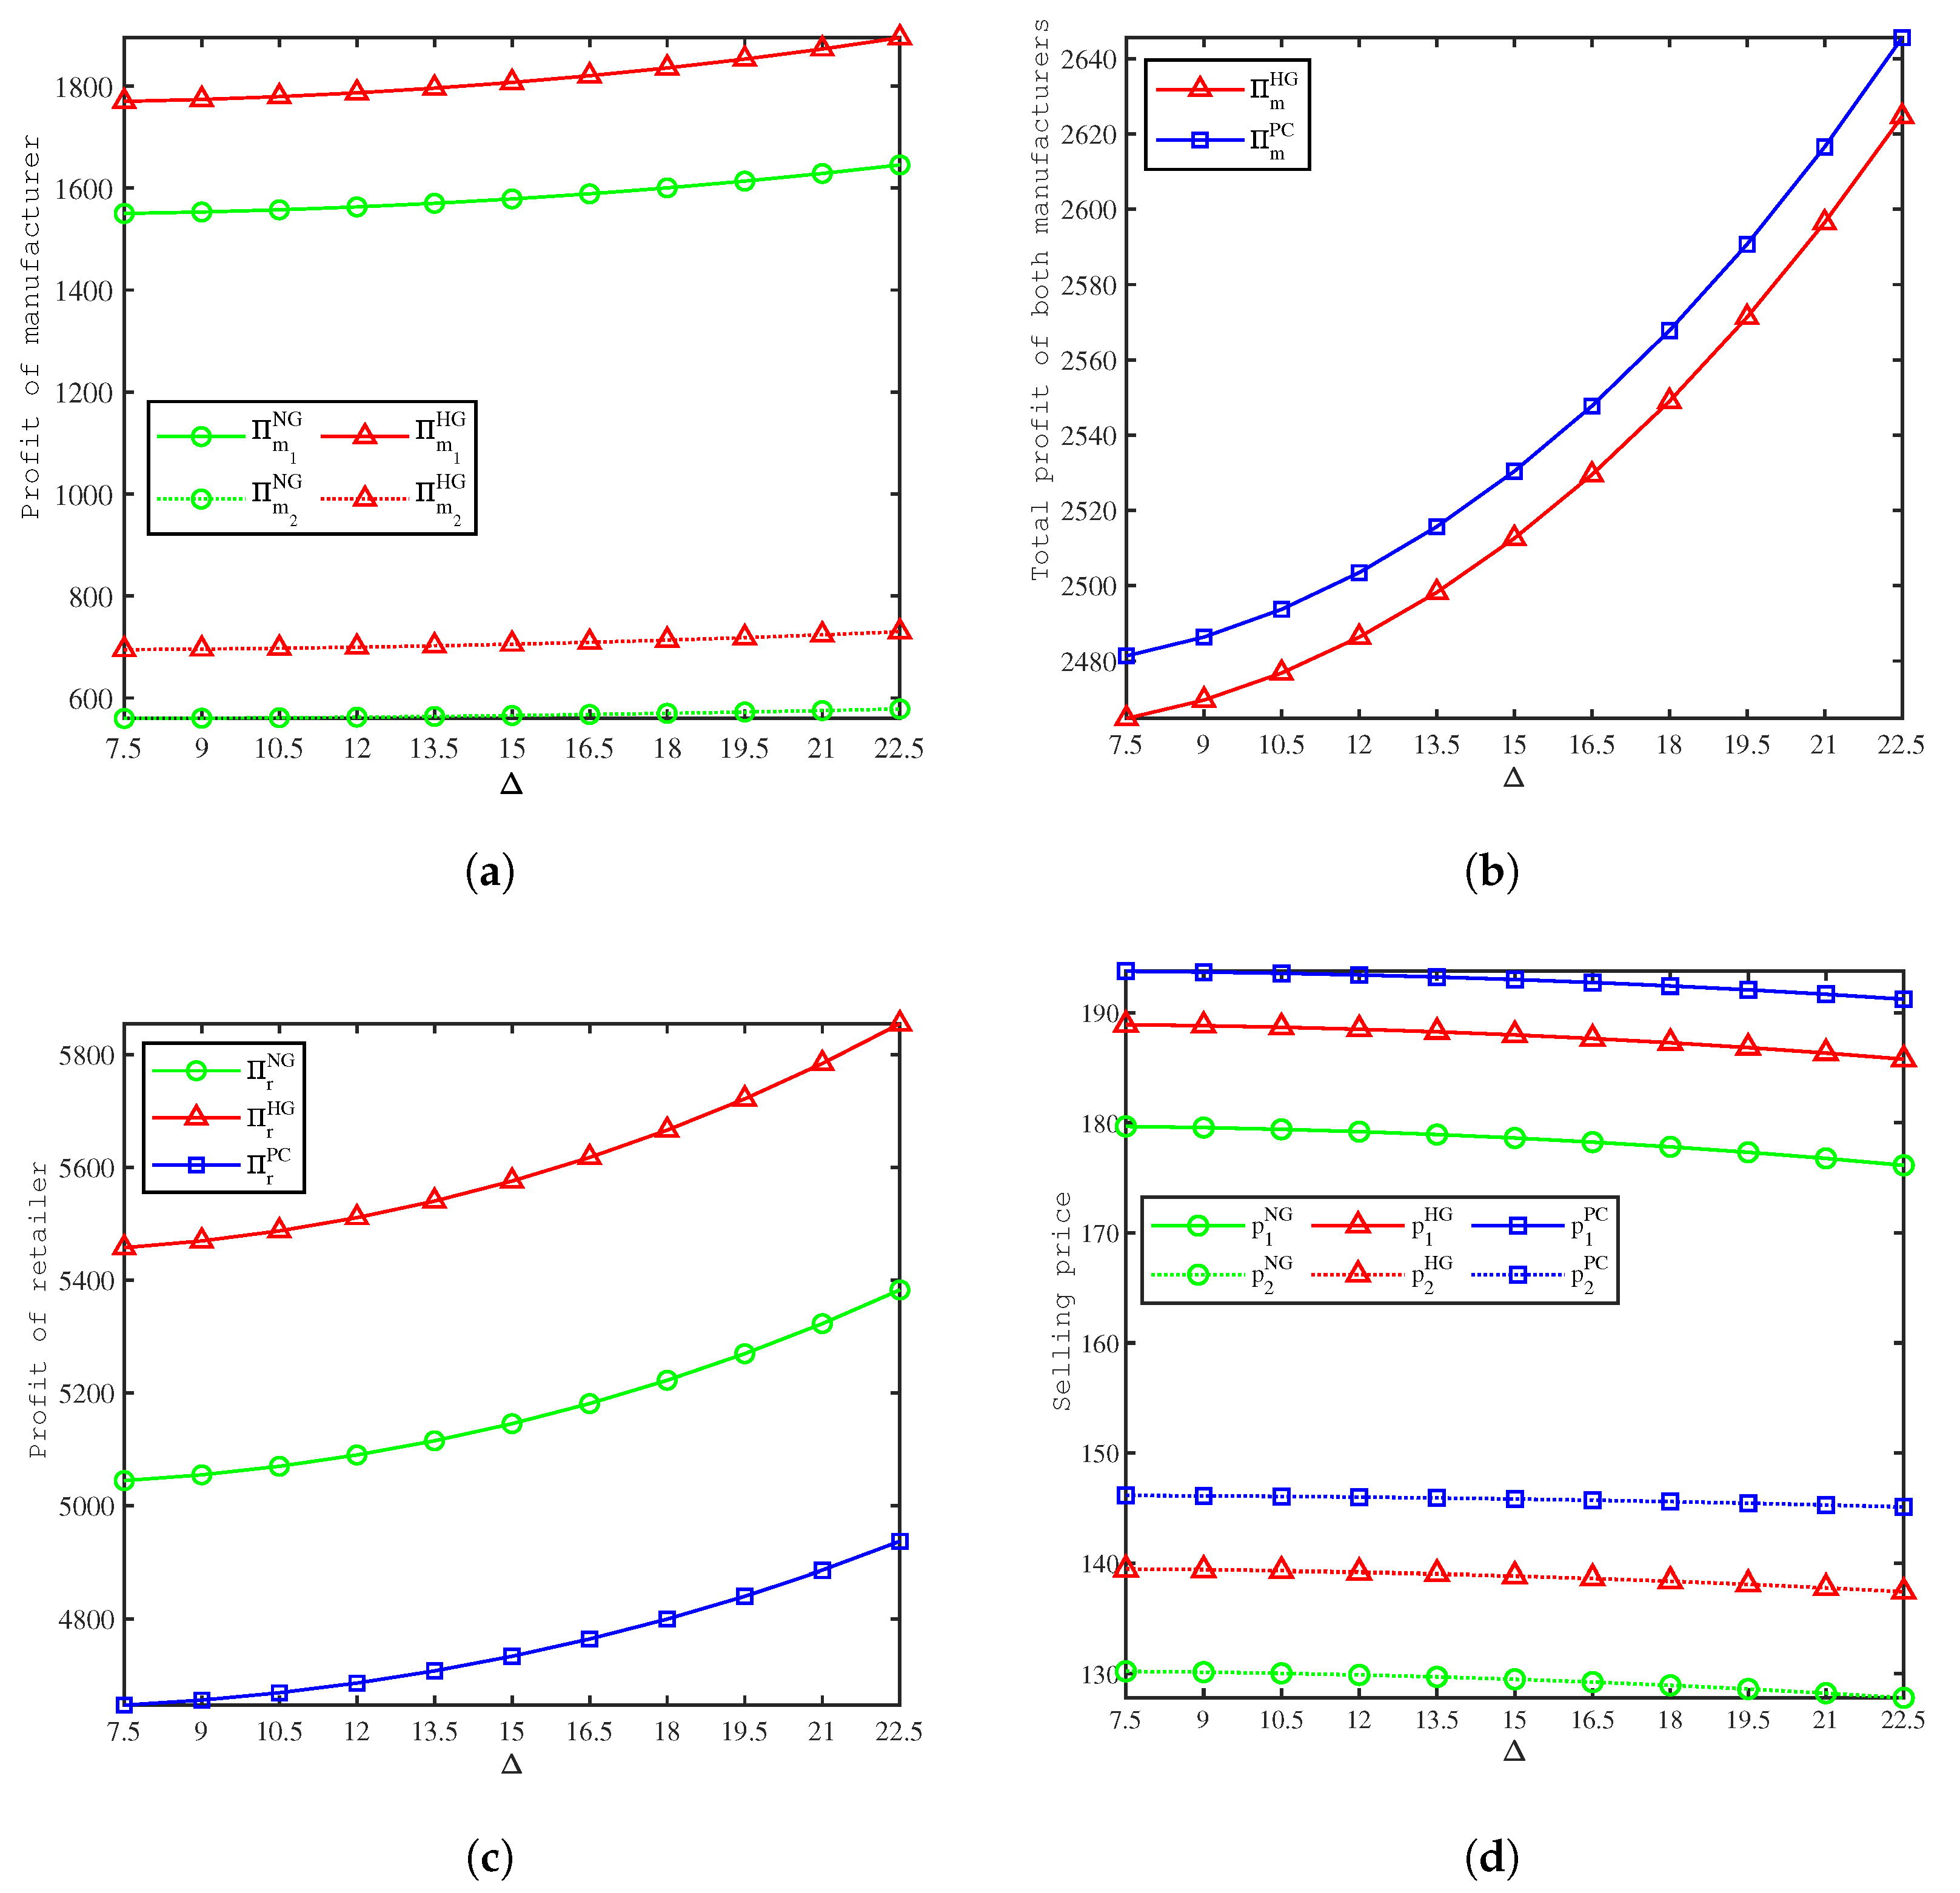
Figure 4 depicts the effects of
on profit, and from the calculations in
Figure 4, we have the following sorts of observations:
- (1)
Figure 4a shows that in the NG and HG models, the profits of both manufacturers increase as the unit cost savings from remanufacturing
increase, and the profits of both manufacturers in the HG model are higher than those in the NG model. Consistent with Proposition 1, green marketing inputs by the retailer can lead to better profits for manufacturers. As unit cost savings from remanufacturing increase, the manufacturer’s total cost of production decreases, and the manufacturer is encouraged to increase recycling investments to improve recovery rates, thereby increasing profits.
- (2)
Figure 4b shows that in the HG and PC models, the total profits of the manufacturers increase as the unit cost savings from remanufacturing
increase, and the total profits of both manufacturers in the PC model are higher than that in the HG model.
- (3)
Figure 4c shows that in all three models, the profits of the retailer increase as the unit cost savings from remanufacturing
increase, and the retailer’s profit is highest in the HG model, followed by the NG model, and lowest in the PC model.
- (4)
Figure 4d shows that in all three models, the selling price of both products decreases as the unit cost savings from remanufacturing
increase, and the selling price is highest in the PC model, followed by the HG model, and lowest in the NG model. Since Product 1 has a higher base market capacity, its prices are higher than those of Product 2. When manufacturers’ production costs are low, the retailer will stimulate consumption and increase demand by lowering the selling price.
Figure 5 depicts the effects of
on profit, and from the calculations in
Figure 5, we have the following sorts of observations:
- (1)
Figure 5a shows that in the HG model, the profits of both manufacturers increase as the green marketing elasticity parameter of demand
increases, and the profits of both manufacturers in the HG model are higher than those in the NG model. Consistent with Proposition 1, green marketing inputs by the retailer can lead to better profits for manufacturers. As the green marketing elasticity parameter of the demand
increases, the gap between the two models increases.
- (2)
Figure 5b shows that in the HG and PC models, the total profits of both manufacturers increase as the green marketing elasticity parameter of the demand
increases. There exists a threshold value of
; when
is lower than 1.68, the total profits of the manufacturers in the PC model are higher than the HG model. Consistent with Proposition 2, cooperation does not always lead to an increase in the total profits of manufacturers.
- (3)
Figure 5c shows that retailer’s profits increase with the green marketing elasticity parameter of demand
in the HG and PC models. The retailer’s profits are higher in the HG model than in the NG model, the retailer’s profits are lowest in the PC model at the beginning, and as
increases, they will surpass the NG model.
- (4)
Figure 5d shows that the selling price of both products increases as the green marketing elasticity parameter of demand
increases in the HG and PC models, and the selling price is highest in the PC model, followed by the HG model, and is lowest in the NG model.
can also be interpreted as the environmentally friendly preference of the consumers. Through green marketing, the consumers’ green consumption habits are continuously awakened and formed, leading to a certain product price tolerance. Therefore the retailer can increase the product price after engaging in green marketing.
7. Conclusions and Future Research Opportunities
7.1. Conclusions
This paper proposes a CLSC consisting of two competing manufacturers and a dominant retailer. The government imposes a carbon tax on the retailer, and two manufacturers collect used products directly from their customers. We first compare two models with and without the retailer considering green marketing; after which, we compare two scenarios of manufacturer cooperation and non-cooperation in green marketing. We analyze the equilibrium strategies and profits of each CLSC member, and consider the impact of the carbon tax on CLSC and social welfare. We finally set up some numerical analyses to test the theoretical conclusions and obtain the results.
- (1)
The carbon tax policy can be used to reduce corporate carbon emissions, which will decrease with the increase of carbon tax per unit. From the perspective of social welfare, an increase in the carbon tax price will lead to a decrease in social welfare under certain conditions. When the marginal social damage of carbon emissions is relatively low, social welfare will decrease as carbon taxes increase, while there exists an optimal value of carbon tax that maximizes social welfare when the marginal social damage of carbon emissions is relatively high.
- (2)
Green marketing is an effective means of improving the social welfare and profitability of all CLSC members. The implementation can attract environmentally friendly consumers, raise awareness of environmental issues among other consumers, change their consumption habits and increase their willingness to recycle products. Therefore, after the retailer implements green marketing, there is a corresponding increase in manufacturers’ return rate. This can reduce environmental pollution from e-waste and carbon emissions from the extraction and refinement of raw materials. The level of green marketing will be affected by the carbon tax policy. As the unit carbon tax increases for the HG and PC models, the optimal level of green marketing will decrease. That is, when the retailer faces higher carbon tax pressure, he will choose to reduce the level of green marketing appropriately to reduce the total cost. The retailer engaging in green marketing leads to an increase in demand and thus carbon emissions, but it is beneficial from a social welfare perspective.
- (3)
Cooperation can increase manufacturers’ voice in CLSC, and it can increase manufacturers’ total profit under certain conditions. The value of consumer preference for environmental friendliness determines whether manufacturers are more profitable after the partnership than before. When the value of consumers’ preference for environmental friendliness is relatively high, the total profit after cooperation may be lower than before cooperation. The manufacturer’s cooperation may damage the retailer’s profits, and he will reduce green marketing investment or increase prices to ensure profits.
7.2. Managerial Implications
Based on the analysis results of the model, we provide the following management insights to the government and CLSC enterprises.
For the government, in the face of the growing global warming problem, implementing a carbon tax policy can effectively reduce the environmental pollution caused by carbon emissions. However, the implementation of carbon tax policies may bring about a decrease in total social welfare. The marginal social damage of carbon emissions determines the impact of the unit carbon tax on social welfare. Therefore, when the government sets the unit carbon tax value, they should refer to the marginal social damage of carbon emissions and pay attention to the changes in social welfare.
For the dominant retailer, the implementation of green marketing can effectively increase his profits under the pressure of a carbon tax. Green marketers can brand themselves as green and awaken the green awareness of consumers. The retailer can increase the selling price after implementing green marketing. The selling price setting should also consider the values such as consumer preferences for environmental friendliness and savings in remanufacturing costs. When the unit carbon tax increases, the retailer should reduce the level of green marketing to reduce cost pressure. The retailer should also reduce the level of green marketing when the two manufacturers collaborate.
For the manufacturers, they should actively participate in the green marketing activities of retailers, as green marketing can increase sales and therefore their profits. Manufacturers should refer to the value of consumers’ preference for environmental friendliness to decide whether to cooperate or not.
7.3. Limitations and Future Research Opportunities
The main limitations of this paper and further research opportunities are summarized below. First, we assume deterministic demand in this CLSC and use artificial data for numerical analysis, which differs slightly from the actual market. Considering uncertain demand may yield some other insights, and using data from case studies would be more representative. Second, this may have other implications when governments tax manufacturers’ carbon emissions and manufacturers invest in emissions-reducing technologies. Finally, we may change the model in different power structures and collectors to obtain the optimal equilibrium results.


