
Impact of Industrial Structure Upgrading on Green Total Factor Productivity in the Yangtze River Economic Belt


Abstract
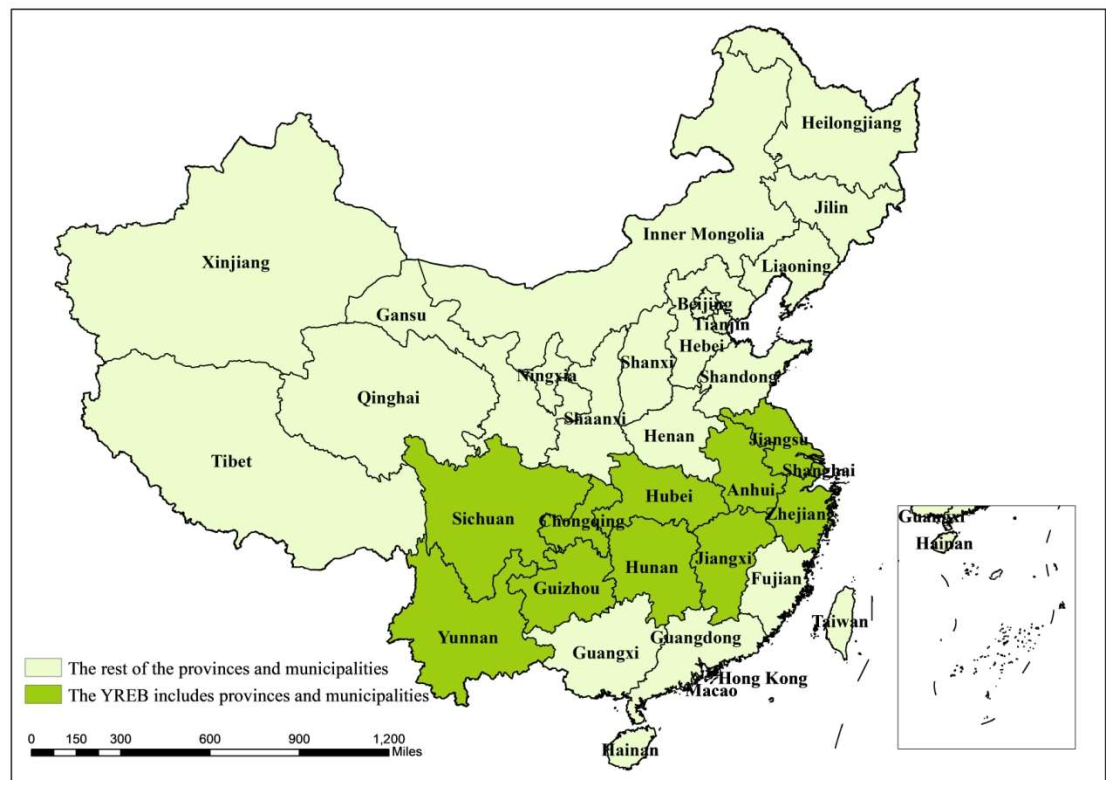
:1. Introduction
2. Review of Literature
2.1. GTFP Measurement
2.2. Industrial Structure and GTFP
3. Measurement of GTFP
3.1. Measurement Method
3.2. Selection of Measurement Variables
3.3. Measurement Result
4. Empirical Research Design
4.1. Model Construction
4.2. Variable Selection
4.2.1. Explained Variable: GTFP
4.2.2. Explanatory Variables: Industrial Structure
4.2.3. Regulatory Variable: Environmental Regulation
4.2.4. Control Variables
4.3. Data Sources and Descriptive Statistics
5. Empirical Research Results and Analysis
5.1. Main Regression Results
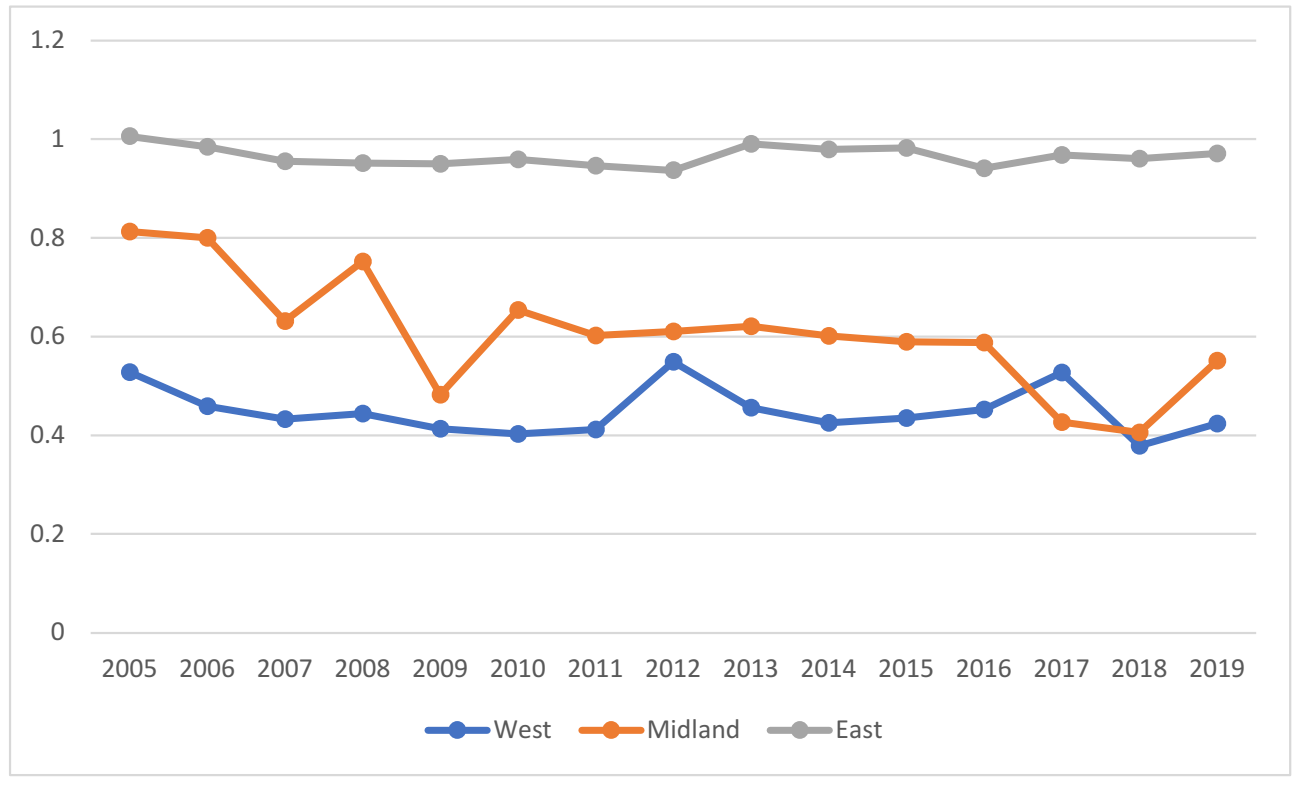
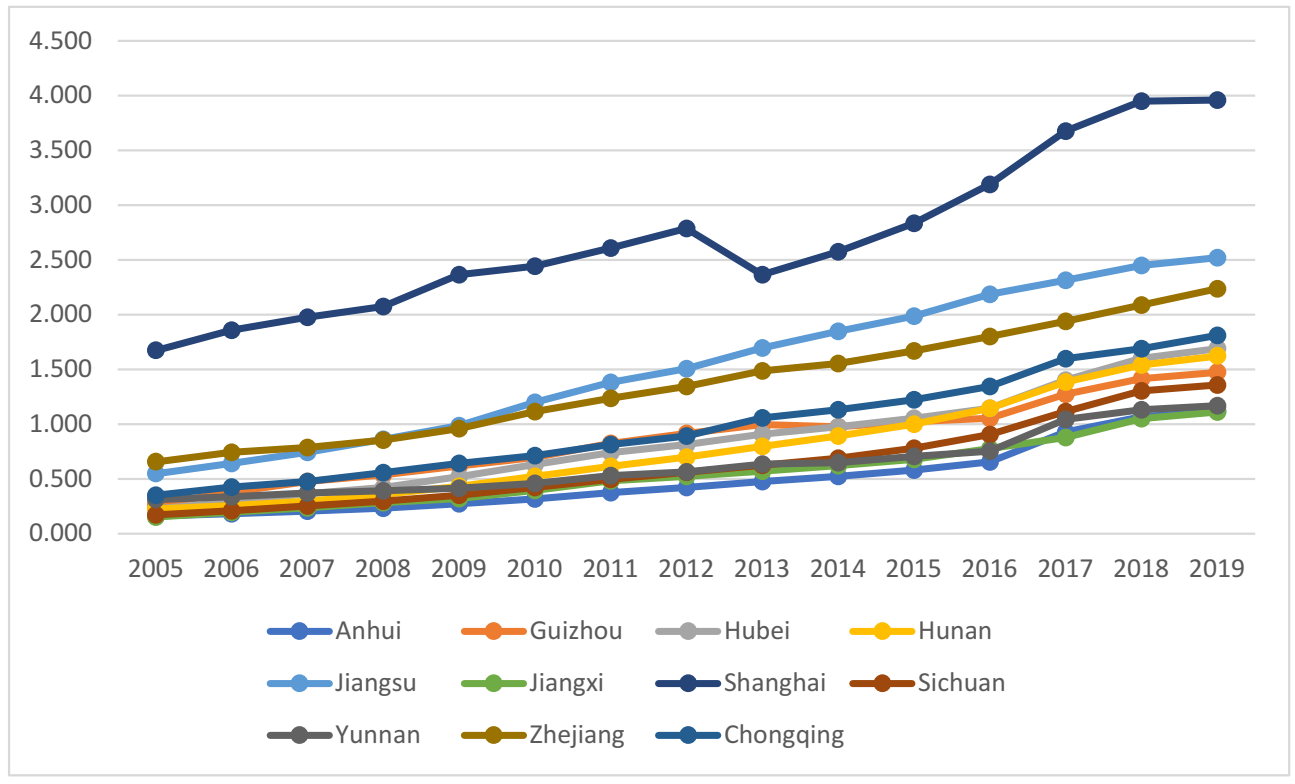
5.2. Subregional Test
6. Research Conclusions and Suggestions
6.1. Research Conclusions
6.2. Countermeasures and Suggestions
6.2.1. Promote the Industrial Structure Upgrade in Various Regions of the YREB
6.2.2. Promote Environmental Protection
6.2.3. Push Forward the New Urbanization of the YREB
6.3. Limitations and Future Research
Author Contributions
Funding
Institutional Review Board Statement
Informed Consent Statement
Data Availability Statement
Conflicts of Interest
References
- Wu, R.; Possingham, H.P.; Yu, G.; Jin, T.; Wang, J.; Yang, F.; Liu, S.; Ma, J.; Liu, X.; Zhao, H. Strengthening China’s national biodiversity strategy to attain an ecological civilization. Conserv. Lett. 2019, 12, e12660. [Google Scholar] [CrossRef] [Green Version]
- Tang, D.C.; Zhang, Y.; Bethel, B.J. A Comprehensive Evaluation of Carbon Emission Reduction Capability in the Yangtze River Economic Belt. Int. J. Environ. Res. Public Health 2020, 17, 545. [Google Scholar] [CrossRef] [PubMed] [Green Version]
- Ye, T.; Zheng, H.; Ge, X.; Yang, K. Pathway of Green Development of Yangtze River Economics Belt from the Perspective of Green Technological Innovation and Environmental Regulation. Int. J. Environ. Res. Public Health 2021, 18, 10471. [Google Scholar] [CrossRef] [PubMed]
- Kutlu, L. Greenhouse Gas Emission Efficiencies of World Countries. International journal of environmental research and public health. Int. J. Environ. Res. Public Health 2020, 17, 8771. [Google Scholar] [CrossRef] [PubMed]
- Kutlu, L.; Wang, R. Greenhouse Gas Emission Inefficiency Spillover Effects in European Countries. Int. J. Environ. Res. Public Health 2021, 18, 4479. [Google Scholar] [CrossRef] [PubMed]
- Tang, D.; Tang, J.; Xiao, Z.; Ma, T.; Bethel, B.J. Environmental regulation efficiency and total factor productivity—Effect analysis based on Chinese data from 2003 to 2013. Ecol. Indic. 2017, 73, 312–318. [Google Scholar] [CrossRef]
- Combes, P.-P. Economic structure and local growth. France, 1984-1993. J. Urban Econ. 2000, 47, 329–355. [Google Scholar] [CrossRef]
- Kong, N.Y.C.; Tongzon, J. Estimating total factor productivity growth in Singapore at sectoral level using data envelopment analysis. Appl. Econ. 2006, 38, 2299–2314. [Google Scholar] [CrossRef]
- Kuosmanen, T.; Sipiläinen, T. Exact decomposition of the Fisher ideal total factor productivity index. J. Prod. Anal. 2009, 31, 137–150. [Google Scholar] [CrossRef]
- Hu, X.Z.; Yang, L. Analysis on The Difference and Convergence of Regional Green Total Factor Productivity Growth in China. Financ. Res. 2011, 37, 123–134. [Google Scholar]
- Wang, X.Y.; Wei, Q.; Hu, X.H. Comprehensive Measurement and Temporal and Spatial Differentiation of Urban Green Economic Efficiency in China—Based on DEA-BCC and Malmquist Model. Ecol. Econ. 2016, 32, 40–45. [Google Scholar]
- Feng, J.; Zhang, S.Q. Evaluation of China’s Inter Provincial Green Total Factor Productivity Based on DEA Method—An Analysis of The Differences of Different Model Choices. J. Peking Univ. (Nat. Sci. Ed.) 2017, 53, 151–159. [Google Scholar]
- Wang, S.L.; Wang, X.L. Does FDI in Service Industry Improve Green Total Factor Productivity—An Empirical Study Based on China’s Inter Provincial Panel Data. Int. Trade Issues 2017, 12, 83–93. [Google Scholar]
- Ren, Y.J.; Wang, C.X.; Yu, C. A Study on The Spatial Spillover Effect of China’s Regional Green Total Factor Productivity. Soft Sci. 2019, 33, 40–43. [Google Scholar]
- Chen, Y.; Miao, J.; Zhu, Z. Measuring green total factor productivity of China’s agricultural sector: A three-stage SBM-DEA model with non-point source pollution and CO2 emissions. J. Clean. Prod. 2021, 318. [Google Scholar] [CrossRef]
- Li, Y.; Chen, Y. Development of an SBM-ML model for the measurement of green total factor productivity: The case of pearl river delta urban agglomeration. Renew. Sustain. Energy Rev. 2021, 145, 111131. [Google Scholar] [CrossRef]
- Xiao, Y.; Ma, D.; Cheng, Y.; Wang, L. Effect of Labor Cost and Industrial Structure on the Development Mode Transformation of China’s Industrial Economy. Emerg. Mark. Financ. Trade 2020, 56, 1677–1690. [Google Scholar] [CrossRef]
- Dar, A.H.; Mathur, S.K. The Efficiency of Indian Banks. A Non-Pparametric DEA Approach with Panel Regression Based Feedback. Prajnan 2021, 49, 407–427. [Google Scholar]
- Zhang, X.; Huang, Z.; Jiang, S. The impact of two-way FDI on total factor productivity in China and countries of the belt and road initiative. Econ. Res. -Ekon. Istraz. 2021, 1–21. [Google Scholar] [CrossRef]
- Roncaglia, A. William Petty and the Ambitions of Political Arithmetick. Eur. J. Hist. Econ. Thought 2013, 20, 532–536. [Google Scholar] [CrossRef]
- Buera, F.J.; Kaboski, J.P. Can Traditional Theories of Structural Change Fit the Data? J. Eur. Econ. Assoc. 2009, 7, 469–477. [Google Scholar] [CrossRef] [Green Version]
- Noseleit, F. Entrepreneurship, structural change, and economic growth. J. Evol. Econ. 2013, 23, 735–766. [Google Scholar] [CrossRef] [Green Version]
- Jebali, E.; Essid, H. Total Factor Environmental Productivity in the Mediterranean Countries. A Malmquist-Luenberger Index Approach. Int. J. Appl. Manag. Technol. 2020, 19, 62–76. [Google Scholar] [CrossRef]
- Fukao, K.; Paul, S. Baumol, Engel, and beyond. accounting for a century of structural transformation in Japan, 1885–1985†. Econ. Hist. Rev. 2021, 74, 164–180. [Google Scholar] [CrossRef]
- Li, Q.; Wei, W. Study on The Coupling Coordination Degree of Economic Growth Quality and Ecological Environment Optimization in The Yangtze River Economic Belt. Soft Sci. 2019, 33, 117–122. [Google Scholar]
- Liu, Y.; Tian, Y.; Luo, Y. Industrial Structure Upgrading, Energy Efficiency and Green Total Factor Productivity. Financ. Theory Pract. 2018, 39, 118–126. [Google Scholar]
- Zhang, S.; Wang, C.; Ren, Y. Spatial Spillover Effect of Producer Services Agglomeration on Green Total Factor Productivity. Soft Sci. 2019, 33, 11–15. [Google Scholar]
- She, S.; Wang, Q.; Zhang, A. Technological Innovation, Industrial Structure and Urban Green Total Factor Productivity—An Impact Channel Test Based on The National Low Carbon City Pilot. Econ. Manag. Res. 2020, 41, 44–61. [Google Scholar]
- Zhang, H.; Wang, Y. Changes of Economic System, Evolution of Industrial Structure and High-Quality Development of China’s Economy. Econ. Syst. Reform 2020, 2, 31–37. [Google Scholar]
- Zhang, R.; Wang, G.; Sun, X. Fiscal Decentralization, Industrial Structure and High Quality Development Of The Yellow River Basin. Econ. Issues 2020, 9, 1–11. [Google Scholar] [CrossRef]
- Tone, K.; Toloo, M.; Izadikhah, M. A modified slacks-based measure of efficiency in data envelopment analysis. Eur. J. Oper. Res. 2020, 287, 560–571. [Google Scholar] [CrossRef]
- Cantor, V.J.M.; Poh, K.L. Efficiency measurement for general network systems. A slacks-based measure model. J. Product. Anal. 2020, 54, 43–57. [Google Scholar] [CrossRef]
- Zhang, J.; Wu, G.; Zhang, J. Estimation of China’s Inter Provincial Physical Capital Stock. 1952–2000. Econ. Res. 2004, 10, 35–44. [Google Scholar] [CrossRef]
- Zhang, J.; Zhang, Y. Re-Estimation of China’s Capital Stock K. Econ. Res. 2003, 7, 35–43. [Google Scholar]
- Tao, F.; Zhang, H.; Hu, Y.; Duncan, A.A. Growth of Green Total Factor Productivity and Its Determinants of Cities in China. A Spatial Econometric Approach. Emerg. Mark. Financ. Trade 2017, 53, 2123–2140. [Google Scholar] [CrossRef]
- Chenery, H.B.; Syrquin, M. Patterns of Development. 1955–1975; Oxford University Press: London, UK, 1977. [Google Scholar]
- Liu, W.; Zhang, H. Industrial Structure in China’s Economic Growth. Soc. Sci. Chin. Univ. 2013, 1, 98–118. [Google Scholar]
- Zhang, H.; Zhou, F.; Yang, H.; Guo, Q. Empirical Analysis of Regulation Performance of Win-Win Between Environmental Protection and Economic Development. Econ. Res. 2009, 44, 14–26. [Google Scholar]
- Ma, J.; Wang, J.; Shen, X. Economic policy uncertainty and green economy efficiency. power or resistance?—Empirical evidence from Chinese major urban agglomerations. Econ. Res.-Ekon. Istraz. 2021, 1–19. [Google Scholar] [CrossRef]
- Li, B.; Wu, S. Effects of local and civil environmental regulation on green total factor productivity in China. A spatial Durbin econometric analysis. J. Clean. Prod. 2017, 153, 342–353. [Google Scholar] [CrossRef]
- Sun, Y.; Du, J.; Wang, S. Environmental regulations, enterprise productivity, and green technological progress. large-scale data analysis in China. Ann. Oper. Res. 2020, 290, 369–384. [Google Scholar] [CrossRef]
- Hu, W.; Xiong, Z. Do stringent environmental regulations help improve the total factor carbon productivity? Empirical evidence from China’s industrial sectors. Appl. Econ. 2021, 53, 6398–6411. [Google Scholar] [CrossRef]
- Tang, D.; Wang, L.; Bethel, B.J. An Evaluation of the Yangtze River Economic Belt Manufacturing Industry Level of Intelligentization and Influencing Factors. Evidence from China. Sustainability 2021, 13, 8913. [Google Scholar] [CrossRef]
- He, J.; Wang, L.; Tang, D. Research on Green Total Factor Productivity of Yangtze River Economic Belt Based on Environmental Regulation. Int. J. Environ. Res. Public Health 2021, 18, 12242. [Google Scholar] [CrossRef] [PubMed]
- Tang, D.; Bethel, B.J. Yangtze River Economic Belt environmental remediation efficiency based on an input-output optimization analysis. Environ. Sci. Pollut. Res. 2021, 1, 04. [Google Scholar] [CrossRef]
- Lin, B.; Zhu, J. Fiscal spending and green economic growth. Evidence from China. Energy Econ. 2019, 83, 264–271. [Google Scholar] [CrossRef]
- Qiu, S.; Wang, Z.; Liu, S. The policy outcomes of low-carbon city construction on urban green development: Evidence from a quasi-natural experiment conducted in China. Sustain. Cities Soc. 2021, 66, 102699. [Google Scholar] [CrossRef]
- Bai, Y.; Deng, X.; Jiang, S.; Zhang, Q.; Wang, Z. Exploring the Relationship between Urbanization and Urban Eco-efficiency. Evidence from Prefecture-level Cities in China. J. Clean. Prod. 2018, 195, 1487–1496. [Google Scholar] [CrossRef]


| Primary Index | Secondary Index | Variable Description |
|---|---|---|
| Input | Labor input | Number of employed persons in the region (104 persons) |
| Capital input | Calculate the capital stock by using the perpetual inventory method (CNY 108) 1 | |
| Energy consumption | Electricity consumption (100 million kwh) | |
| Desirable output | Regional GDP | Regional GDP (CNY 108) |
| The urban green space area | Urban green space area (104 hectares) | |
| Undesirable output index | Wastewater emission | Total industrial wastewater discharge (100 million tons) |
| Industrial sulfur dioxide emission | Industrial sulfur dioxide emission (100 million tons) |
| Year | West | ||||
| Yunan | Guizhou | Sichuan | Chongqing | Mean | |
| 2005 | 0.546 | 0.436 | 0.544 | 0.585 | 0.528 |
| 2006 | 0.45 | 0.416 | 0.498 | 0.473 | 0.459 |
| 2007 | 0.411 | 0.411 | 0.456 | 0.454 | 0.433 |
| 2008 | 0.405 | 0.427 | 0.469 | 0.476 | 0.444 |
| 2009 | 0.367 | 0.393 | 0.431 | 0.462 | 0.413 |
| 2010 | 0.347 | 0.371 | 0.431 | 0.464 | 0.403 |
| 2011 | 0.33 | 0.357 | 0.452 | 0.508 | 0.412 |
| 2012 | 0.338 | 0.367 | 0.482 | 1.01 | 0.549 |
| 2013 | 0.35 | 0.406 | 0.506 | 0.563 | 0.456 |
| 2014 | 0.321 | 0.373 | 0.472 | 0.534 | 0.425 |
| 2015 | 0.315 | 0.389 | 0.46 | 0.575 | 0.435 |
| 2016 | 0.295 | 0.395 | 0.451 | 0.665 | 0.452 |
| 2017 | 0.328 | 0.348 | 0.422 | 1.008 | 0.527 |
| 2018 | 0.316 | 0.332 | 0.411 | 0.458 | 0.379 |
| 2019 | 0.329 | 0.344 | 0.541 | 0.483 | 0.424 |
| mean | 0.363 | 0.384 | 0.468 | 0.581 | 0.449 |
| Year | Midland | ||||
| Hubei | Hunan | Anhui | Jiangxi | Mean | |
| 2005 | 0.599 | 1.027 | 0.61 | 1.015 | 0.813 |
| 2006 | 0.57 | 1.032 | 0.589 | 1.01 | 0.800 |
| 2007 | 0.512 | 1.033 | 0.47 | 0.508 | 0.631 |
| 2008 | 0.523 | 1.03 | 0.453 | 1.003 | 0.752 |
| 2009 | 0.513 | 0.536 | 0.421 | 0.456 | 0.482 |
| 2010 | 0.519 | 1.001 | 0.424 | 0.672 | 0.654 |
| 2011 | 0.517 | 1.009 | 0.431 | 0.451 | 0.602 |
| 2012 | 0.537 | 1.017 | 0.431 | 0.454 | 0.610 |
| 2013 | 0.556 | 1.028 | 0.433 | 0.468 | 0.621 |
| 2014 | 0.536 | 1.025 | 0.406 | 0.436 | 0.601 |
| 2015 | 0.527 | 1.032 | 0.385 | 0.41 | 0.589 |
| 2016 | 0.558 | 1.027 | 0.379 | 0.386 | 0.588 |
| 2017 | 0.484 | 0.508 | 0.365 | 0.35 | 0.427 |
| 2018 | 0.463 | 0.469 | 0.354 | 0.339 | 0.406 |
| 2019 | 0.458 | 1.038 | 0.353 | 0.354 | 0.551 |
| mean | 0.525 | 0.921 | 0.434 | 0.554 | 0.608 |
| Year | East | ||||
| Jiangsu | Shanghai | Zhejiang | Mean | ||
| 2005 | 1.043 | 1.223 | 0.751 | 1.006 | |
| 2006 | 1.032 | 1.237 | 0.683 | 0.984 | |
| 2007 | 1.011 | 1.241 | 0.613 | 0.955 | |
| 2008 | 1.001 | 1.241 | 0.611 | 0.951 | |
| 2009 | 1.019 | 1.254 | 0.577 | 0.950 | |
| 2010 | 1.018 | 1.262 | 0.598 | 0.959 | |
| 2011 | 1.023 | 1.217 | 0.597 | 0.946 | |
| 2012 | 1.029 | 1.185 | 0.596 | 0.937 | |
| 2013 | 1.044 | 1.192 | 0.733 | 0.990 | |
| 2014 | 1.045 | 1.206 | 0.685 | 0.979 | |
| 2015 | 1.051 | 1.268 | 0.628 | 0.982 | |
| 2016 | 1.057 | 1.211 | 0.556 | 0.941 | |
| 2017 | 1.039 | 1.413 | 0.453 | 0.968 | |
| 2018 | 1.029 | 1.417 | 0.435 | 0.960 | |
| 2019 | 1.045 | 1.412 | 0.456 | 0.971 | |
| mean | 1.032 | 1.265 | 0.598 | 0.965 | |
| Variable Type | Name | Code | Description |
|---|---|---|---|
| Explained variable | Green total factor productivity | GTFP | According to 3.3 measurement result |
| Explanatory variables | Industry structure upgrade | ISU | Calculated according to formula (5) |
| Industry structure rationalization | ISR | Calculated according to formula (7) | |
| Regulatory variable | Environmental regulation | ER | Calculated according to formula (8) |
| Control variable | Economic development level | EDL | EDL = Per capita GDP (CNY 104) |
| Degree of openness | EXP | ESP = Regional export trade volume/regional GDP | |
| Local government input | INP | INP = Regional government expenditure/regional GDP | |
| Urbanization rate | UR | UR = Regional urban population/total population |
| Variable | Obs | Mean | Std. Dev. | Min | Max |
|---|---|---|---|---|---|
| GTFP | 165 | 0.624 | 0.295 | 0.206 | 1.417 |
| ISU | 165 | 0.978 | 0.633 | 0.154 | 3.142 |
| ISR | 165 | 0.207 | 0.178 | 0.001 | 0.819 |
| ER | 165 | 1.331 | 0.859 | 0.352 | 5.772 |
| EDL | 165 | 4.290 | 2.999 | 0.505 | 15.659 |
| EXP | 165 | 0.187 | 0.206 | 0.020 | 0.899 |
| INP | 165 | 0.207 | 0.071 | 0.090 | 0.402 |
| UR | 165 | 0.524 | 0.148 | 0.269 | 0.893 |
| Variables | Model 1 | Model 2 | Model 3 | Model 4 |
|---|---|---|---|---|
| Ln ISU | 0.154 *** | 0.203 * | 0.282 *** | 0.328 *** |
| (4.773) | (1.935) | (7.661) | (3.039) | |
| Ln ISR | −0.047 | −0.002 | −0.030 | −0.005 |
| (−1.135) | (−0.059) | (−0.806) | (−0.119) | |
| Ln ER | 0.511 *** | 0.319 *** | ||
| (6.018) | (3.275) | |||
| Ln EDL | 0.687 *** | 0.571 *** | ||
| (4.136) | (3.434) | |||
| Ln EXP | 0.117 *** | 0.054 | ||
| (2.732) | (1.181) | |||
| Ln INP | −0.528 *** | −0.405 *** | ||
| (−4.390) | (−3.280) | |||
| Ln UR | −1.406 *** | −0.998 *** | ||
| (−4.188) | (−2.792) | |||
| Constant | −0.667 *** | −2.778 *** | −0.725 *** | −2.406 *** |
| (−5.165) | (−6.376) | (−6.627) | (−5.376) | |
| Observations | 165 | 165 | 165 | 165 |
| Number of DMU | 11 | 11 | 11 | 11 |
| VARIABLES | West | Midland | East |
|---|---|---|---|
| Ln ISU | 0.309 *** | 0.690 ** | 2.327 *** |
| (3.083) | (1.943) | (3.533) | |
| Ln ISR | −0.137 | 0.065 ** | 0.772 *** |
| (−1.065) | (2.503) | (4.860) | |
| Ln ER | 0.412 *** | 0.039 * | 0.691 *** |
| (3.208) | (0.212) | (3.219) | |
| Ln EDL | −0.723 *** | 0.072 * | −3.273 *** |
| (−2.868) | (1.034) | (−3.885) | |
| Ln EXP | 0.068 | −0.268 * | −0.409 |
| (1.062) | (−1.878) | (−1.507) | |
| Ln INP | −0.126 | −0.134 | −0.528 |
| (−0.669) | (−0.446) | (−1.300) | |
| Ln UR | 0.478 | −3.975 *** | 2.272 *** |
| (1.215) | (−3.362) | (2.915) | |
| Constant | 0.076 | −3.907 *** | 5.405 *** |
| (0.137) | (−3.393) | (3.631) | |
| Observations | 60 | 60 | 45 |
| Number of DMU | 4 | 4 | 3 |
Publisher’s Note: MDPI stays neutral with regard to jurisdictional claims in published maps and institutional affiliations. |
© 2022 by the authors. Licensee MDPI, Basel, Switzerland. This article is an open access article distributed under the terms and conditions of the Creative Commons Attribution (CC BY) license (https://creativecommons.org/licenses/by/4.0/).
Share and Cite
Sun, J.; Tang, D.; Kong, H.; Boamah, V. Impact of Industrial Structure Upgrading on Green Total Factor Productivity in the Yangtze River Economic Belt. Int. J. Environ. Res. Public Health 2022, 19, 3718. https://doi.org/10.3390/ijerph19063718
Sun J, Tang D, Kong H, Boamah V. Impact of Industrial Structure Upgrading on Green Total Factor Productivity in the Yangtze River Economic Belt. International Journal of Environmental Research and Public Health. 2022; 19(6):3718. https://doi.org/10.3390/ijerph19063718
Chicago/Turabian StyleSun, Jinhua, Decai Tang, Haojia Kong, and Valentina Boamah. 2022. "Impact of Industrial Structure Upgrading on Green Total Factor Productivity in the Yangtze River Economic Belt" International Journal of Environmental Research and Public Health 19, no. 6: 3718. https://doi.org/10.3390/ijerph19063718