Figure 1:.
VIS micro-sensor dyes are internalized neutrophils. Neutrophil cultures were treated with either vehicle or visible-spectra micro-sensor dyes (fluorescein or calcein; 20 μg/106 cells) and incubated for 24 hours. After this incubation period, neutrophil cultures were stimulated with LPS for 24 hours. After the 24-hour stimulation period, neutrophil cultures were analyzed for VIS micro-sensor dye uptake. Spectral absorptivity was used as the endpoint for indicating cellular uptake. Percent values are expressed as the mean ± SEM, N = 8. Statistical significance (a), (b), and (c) were expressed as P ≤ 0.05 in comparison to each other.
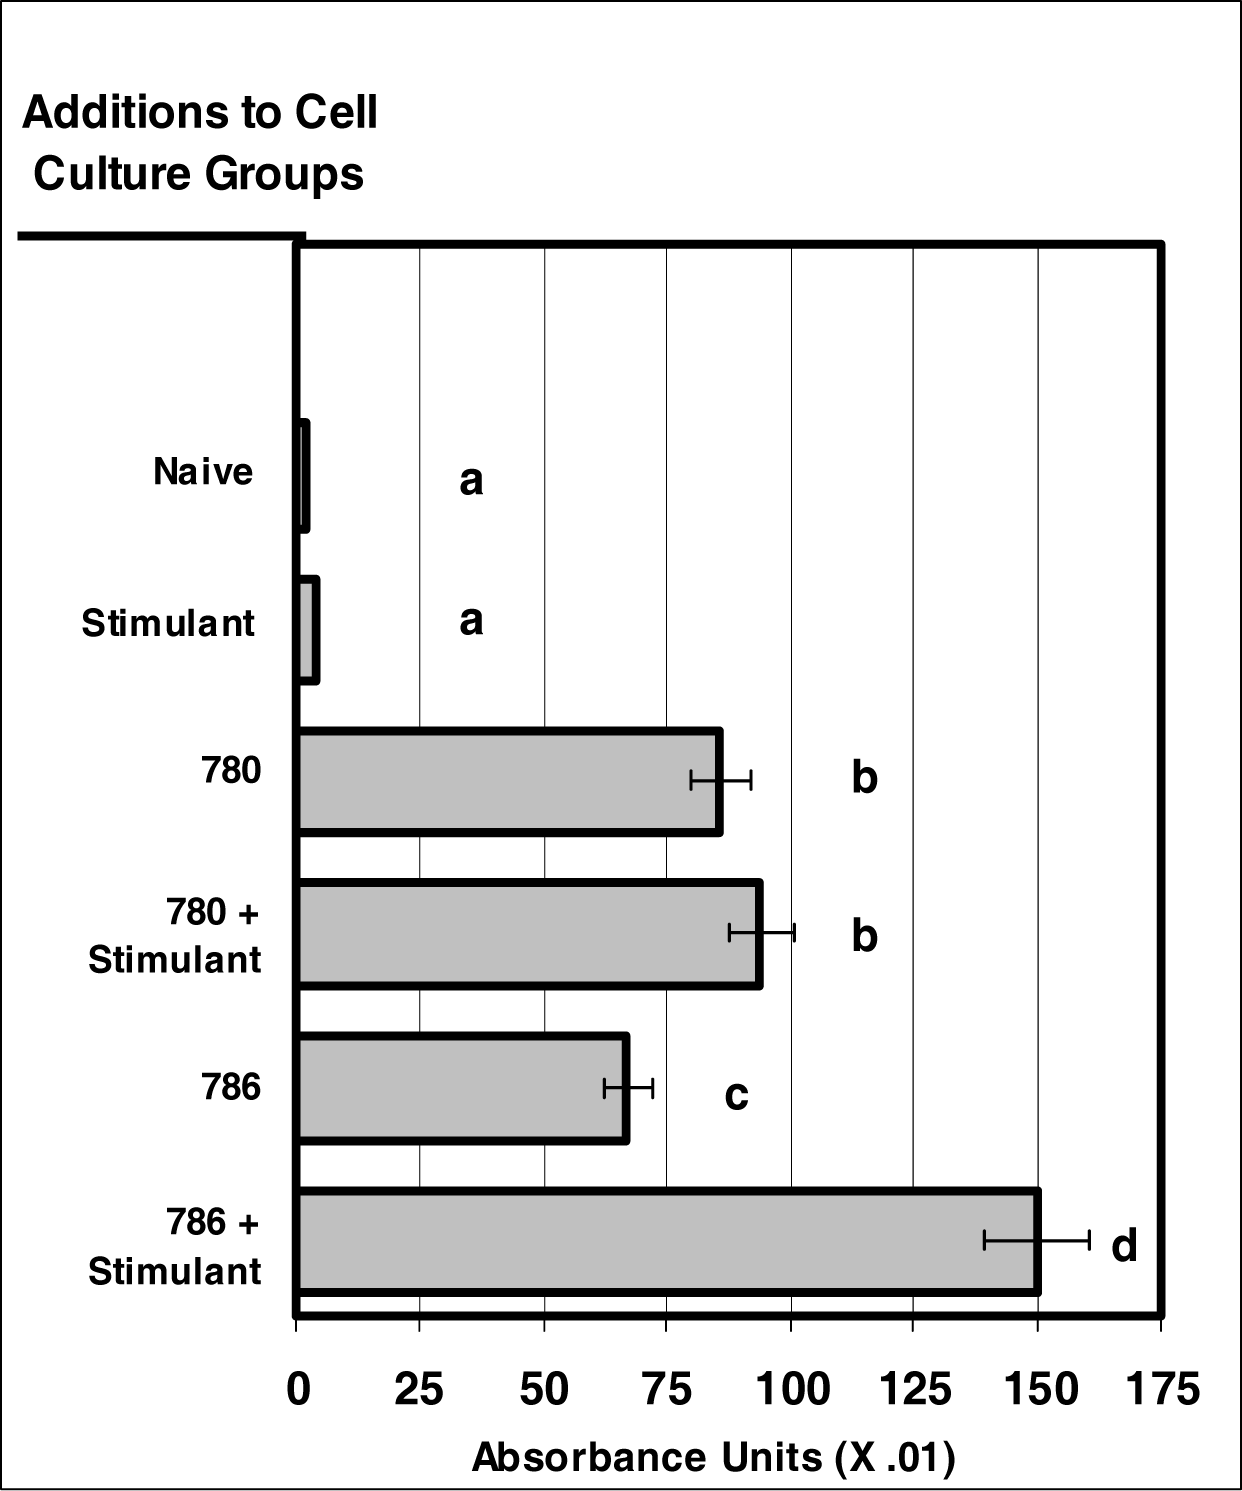
Figure 2:.
NIR micro-sensor dyes are internalized neutrophils. Neutrophil cultures were treated with either vehicle or NIR-spectra micro-sensor dyes (NIR-786 or NIR-780; 20 μg/106 cells, respectively) and incubated for 24 hours. After this incubation period, neutrophil cultures were stimulated with LPS for 24 hours. After the 24-hour stimulation period, neutrophil cultures were analyzed for micro-sensor dye uptake. Spectr al absorptivity was used as the endpoint for indicating cellular uptake. Percent values are expressed as the mean ± SEM, N = 8. Statistical significance (a), (b), (c), and (d) were expressed as P ≤ 0.05 in comparison to each other.
Figure 3:.
VIS micro-sensor dyes exhibit intracellular fluorescence after internalization by neutrophils. Neutrophil cultures were treated with either vehicle or VIS micro-sensor dyes (fluorescein or calcein; 20 μg/106 cells), and incubated for 24 hours. After this incubation period, the cultures were stimulated with LPS for 24 hours. After the 24-hour stimulation period, intracellular fluorescence of the VIS micro-sensor dyes was analyzed. Percent values are expressed as the mean ± SEM, N = 8. Statistical significance (a), (b), and (c) were expressed as P ≤ 0.05 in comparison to each other.
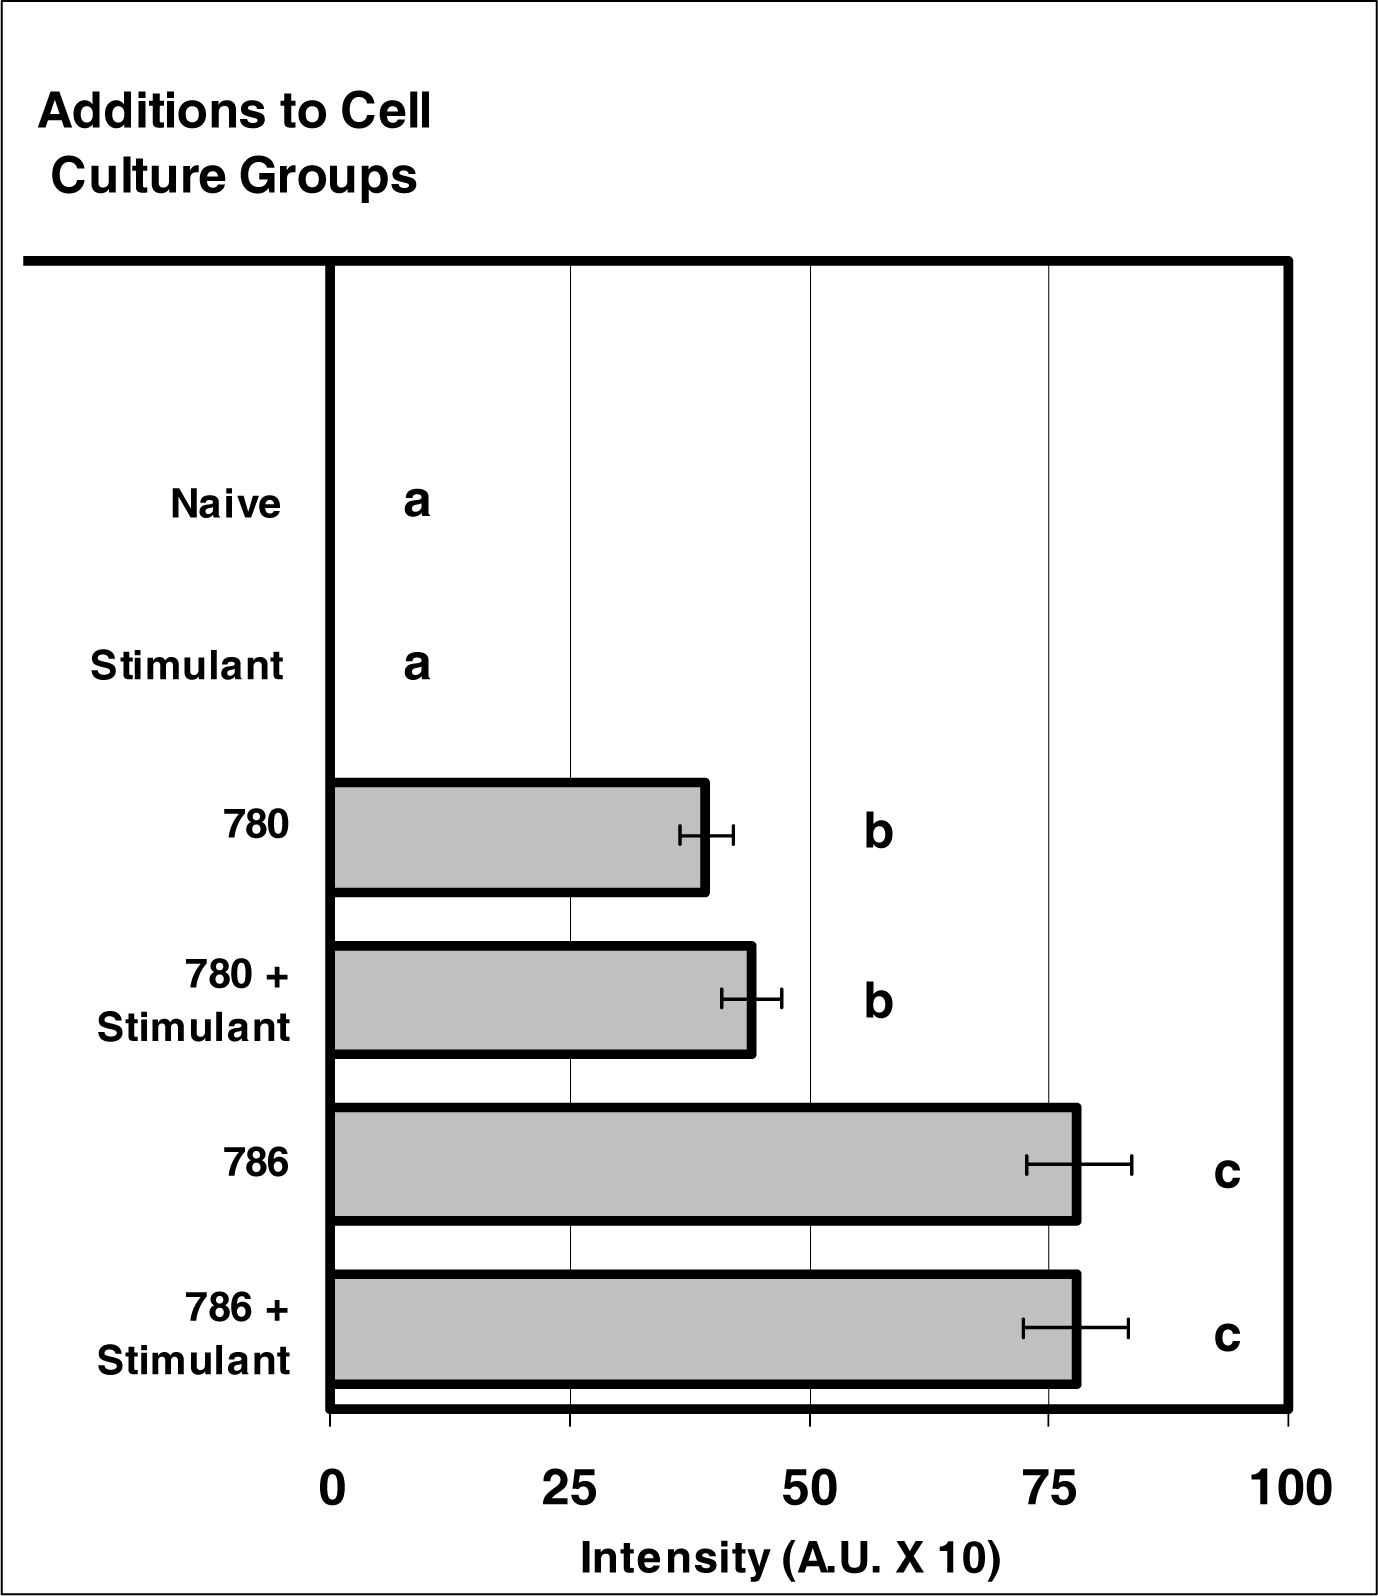
Figure 4:.
NIR micro-sensor dyes exhibit intracellular fluorescence after internalization by neutrophils. Neutrophil cultures were treated with either vehicle or NIR micro-sensor dyes (NIR-786 or NIR-780; 20 μg/106 cells) and incubated for 24 hours. After this incubation period, the cultures were stimulated with LPS for 24 hours. After the 24-hour stimulation period, intracellular fluorescence of the micro-sensor dyes was analyzed. Percent values are expressed as the mean ± SEM, N = 8. Statistical significance (a), (b), and (c) were expressed as P ≤ 0.05 in comparison to each other.
Figure 5:.
Internalization of VIS micro-sensor dyes did not alter neutrophil degranulation in response to stimuli. Neutrophil cultures were treated with either vehicle or visible micro-sensor dyes (fluorescein or calcein; 20 μg/106 cells) and incubated for 24 hours. After this incubation period, neutrophil cultures were stimulated with LPS for 24 hours. After the 24-hour stimulation period, neutrophil degranulation was analyzed using myeloperoxidase assays. Degranulation was used as a marker of normal NEUTROPHIL function. Percent values are expressed as the mean ± SEM, N = 8. Statistical significance (a) was expressed as P ≤ 0.05.
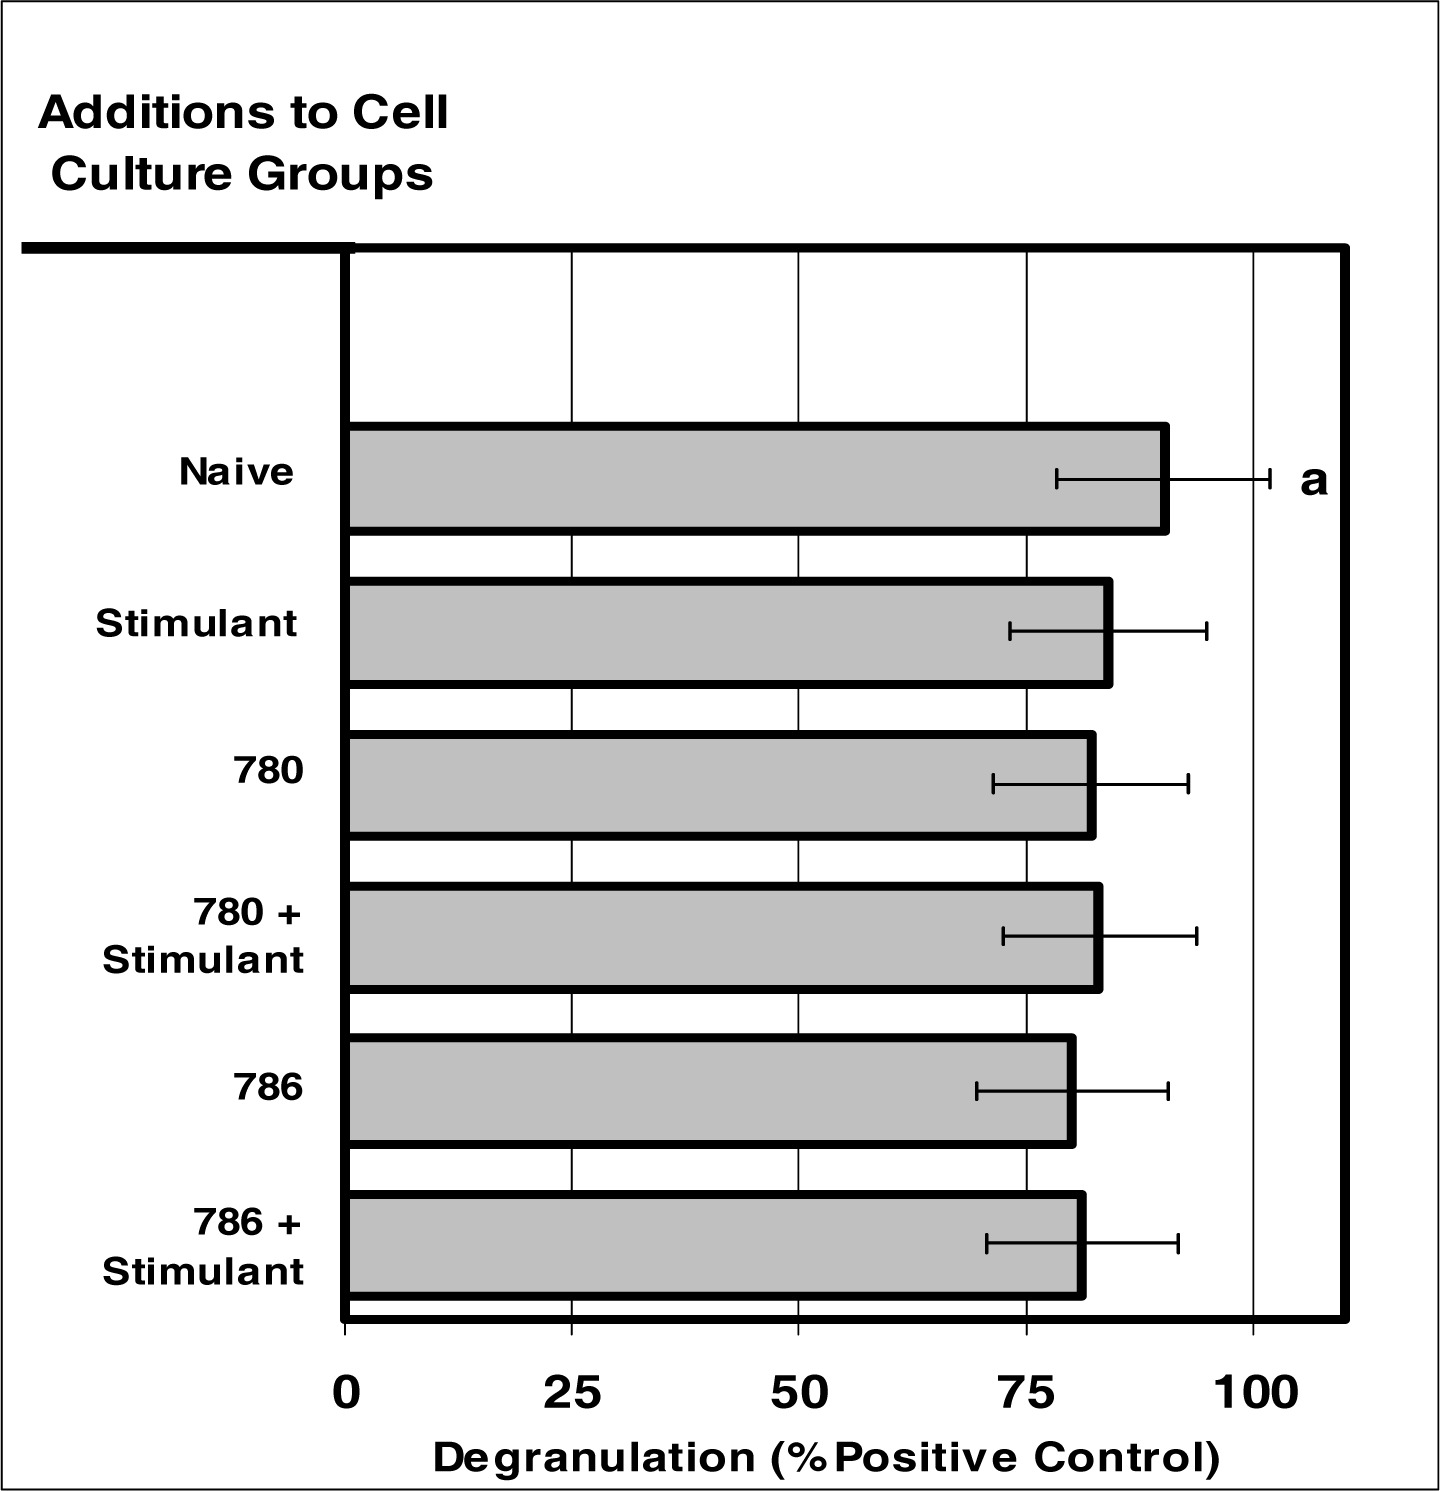
Figure 6:.
Internalization of NIR micro-sensor dyes did not alter neutrophil degranulation in response to stimuli. Neutrophil cultures were treated with either vehicle or NIR-spectra micro-sensor dyes (NIR-786 or NIR-780; 20 μg/106 cells) and incubated for 24 hours. After this incubation period, the cultures were stimulated with LPS for 24 hours. After the 24-hour stimulation period, neutrophil degranulation was analyzed usin g myeloperoxidase assays. Degranulation was used as a marker of normal neutrophil function. Percent values are expressed as the mean ± SEM, N = 8. Statistical significance (a) was expressed as P ≤ 0.05.
Figure 7:.
The internalization of VIS or NIR micro-sensor dyes did not alter normal cell viability. Neutrophil cultures were treated with either vehicle, visible micro-sensor dyes (fluorescein or calcein; 20 μg/106 cells), or NIR micro-sensor dyes (NIR-786 or NIR-780; 20 μg/106 cells) and incubated for 24 hours. After this incubation period, neutrophil cultures were stimulated with LPS for 24 hours. After this second incubation period, neutrophil cultures were analyzed for viability. Trypan blue exclusion and eosin Y uptake were used as endpoints for the determination of lethality. Percent values are expressed as the mean ± SEM, N = 8. Statistical significance (a) was expressed as P ≤ 0.05 in comparison to other groups.
Figure 8:.
The internalization of VIS or NIR micro-sensor dyes did not alter neutrophil super oxide production in response to stimuli. Neutrophil cultures were treated with either vehicle, VIS micro-sensor dyes (fluorescein or calcein; 20 μg/106 cells), or NIR micro-sensor dyes (NIR-786 or NIR-780; 20 μg/106 cells) and incubated for 24 hours. After this incubation period, the cultures were stimulated with LPS for 24 hours. After the 24-hour stimulation period, the ability of neutrophils to produce super oxide was analyzed. Super oxide production was also used as a marker of normal neutrophil function. Percent values are expressed as the mean ± SEM, N = 8. Statistical significance (a), (b), and (c) were expressed as P < 0.05 in comparison to each other.


