Article

Mapping Risk–Return Linkages and Volatility Spillover in BRICS Stock Markets through the Lens of Linear and Non-Linear GARCH Models

1
Department of Commerce, Himachal Pradesh University, Shimla 171005, Himachal Pradesh, India
2
Axtria Pvt. India Ltd., Pune 411057, Maharastra, India
3
GDC Tissa, Chamba 176316, Himachal Pradesh, India
4
Accounting, College of Business Administration, Northen Border University, Arar 91431, Saudi Arabia
*
Authors to whom correspondence should be addressed.
J. Risk Financial Manag. 2024, 17(10), 437; https://doi.org/10.3390/jrfm17100437 (registering DOI)
Submission received: 17 August 2024 / Revised: 16 September 2024 / Accepted: 25 September 2024 / Published: 29 September 2024
(This article belongs to the Special Issue Risk Management in Capital Markets)

Abstract

:
This paper explores the influence of the risk–return relationship and volatility spillover on stock market returns of emerging economies, with a particular focus on the BRICS countries. This research is undertaken in a context where discussions on de-dollarization and the expansion of BRICS membership are gaining momentum, making it a novel and distinct exercise compared to prior studies. Utilizing econometric techniques to investigate daily market returns from 1 April 2008 to 31 March 2023, a period that witnessed major events like the global financial crisis, the COVID-19 pandemic, and the Russia–Ukraine conflict, linear and non-linear models like ARCH, GARCH, GARCH-M, EGARCH, and TGARCH, are employed to assess stock return volatility behaviour, assuming a Gaussian distribution of error terms. The diagnostic test confirms that the distribution is non-normal, stationary, and heteroscedastic. The key findings indicate a lack of the risk–return relationship across all BRICS stock markets, except for South Africa; a more pronounced effect of unpleasant news over pleasant news; a slow mean-reverting process in volatility; the EGARCH model is the best fit model as evidenced by a higher log likelihood and lower Akaike information criterion and Schwardz information criterion parameters; and finally, the presence of significant bidirectional and unidirectional spillover effects in the majority of instances. These findings are valuable for investors, regulators, and policymakers in enhancing returns and mitigating risk through portfolio diversification and informed decision making.

1. Introduction

The financial markets are undergoing greater economic integration globally, driven by national stock exchanges at both domestic and international levels. Deregulation, technological advancements, globalisation, and the quest for economic progress are many vital factors propelling this increasing integration (Singhania and Prakash 2014). Financial integration and globalisation are closely intertwined, since globalisation reduces trade barriers and promotes cross-border economic activities that progressively strengthen financial integration (Zhang et al. 2021). Financial integration, in turn, facilitates economic integration through the seamless flow of capital, portfolio diversification, efficient resource allocation, reduced cost of capital, and adherence to policy discipline (Joo et al. 2023). The synergy between these forces enhances investment opportunities through increased market efficiency, while also bringing associated risk and uncertainty. As a result, financial markets are becoming more resilient yet increasingly volatile and challenging, with the intensification of financial integration and globalisation. This outcome exacerbates global financial risk, restricts portfolio diversification opportunities, and poses challenges to existing financial institutions and regulatory frameworks. Salisu et al. (2018) and Zhang et al. (2021) argue that the likelihood of volatility of stock markets increases with the globalisation of financial markets. Naik and Reddy (2021) observe that high stock return volatility jeopardises the integrity of the market mechanism, eroding investors’ confidence and spending, which eventually hampers economic growth. Moreover, the occurrence of several ‘black swan events’ (Corbet et al. 2022), including the Asian financial crisis (1997–1998), the financial crisis in Brazil (1999), Ecuador (2000), Argentina (2000), Uruguay (2002), the global financial crisis (2008–2009), the COVID-19 pandemic, and the recent Russia–Ukraine conflict, underscore the rationale to investigate volatility dynamics. These crises demonstrate how market shocks in a certain market or region can swiftly spread around the globe. To alleviate such spillover effects, the Markowitz hypothesis (Markowitz 1952) elucidates that investors can enhance their returns and reduce risk through portfolio diversification and investment in non-correlated financial assets. The examination of risk–return and volatility spill-over has gained considerable attention from academicians and professionals alike, given its significance in security analysis, portfolio management, risk diversification, and the formulation of economic policies (Naik and Reddy 2021). These arguments highlight the urgent need for a thorough investigation of volatility behaviour, as it is essential for assessing the performance of financial assets, portfolio diversification, risk management, trading strategies, and financial stability (Kumar and Maheswaran 2012). The current study is novel and different from the existing literature as it employs both linear and non-linear GARCH models to investigate the risk–return relationship, volatility persistence, leverage effects, and volatility spillover in the stock markets of BRICS countries. Amid the current debate on de-dollarization and the financial integration of BRICS countries, these findings will be crucial for investors, regulators, and policymakers in enhancing returns and mitigating risk via portfolio diversification and informed decision making.
Investment in emerging countries provides better investment opportunities compared to industrialised economies because of the higher degree of volatility, higher mean returns, and low correlation among financial assets (Alfreedi 2019). The emerging countries have been witnessing a renaissance in capital inflows following the global financial crisis, which is attributed to their high growth projections (Ahmed et al. 2021). This proposed research is undertaken to investigate the various dimensions of stock return volatility in emerging economies. The focus is placed on the BRICS countries, which collectively contribute to 25.78 percent of the world GDP, 40.91 percent of the global population, and 18.16 percent of global trade (Table 1). To achieve this goal, this analysis employs symmetric models like ARCH, GARCH, and GARCH-M, as well as asymmetric models such as EGARCH and TGARCH. The pioneering research studies conducted by Black (1976), Bollerslev et al. (1986), Engle (1982), Fama (1965), Glosten et al. (1993), Mandelbrot (1963), Nelson (1991), and several other scholars and professionals have generated interest in comprehending and predicting the volatility behaviour of the financial market. Extensive research was conducted on volatility dynamics globally, encompassing developed, emerging, and developing economies. The notable studies in this area include those conducted by Sabri (2004), Wang et al. (2005), Rao (2008), Al-Rjoub and Azzam (2012), Kundu and Sarkar (2016), Refai et al. (2017), Dutta et al. (2017), Ahmed et al. (2018), Mensi et al. (2021), Sharma et al. (2021), Ghozzi and Chaibi (2021), Arsalan et al. (2022), De Villiers and Venter (2022), and Khan (2023). Most research on stock market volatility focuses primarily on developed countries or between developed and emerging countries. Hence, there is a dearth of research investigating the risk–return linkages and the volatility spillover effect in emerging economies, especially in the BRICS nations.
In 2001, Jim O’Neill coined the phrase BRIC to refer to Brazil, Russia, India, and China (Maryam and Mittal 2019). The BRIC trading bloc, comprising emerging economies, was formed on 16 June 2009, at its inaugural summit in Yekaterinburg, Russia, with the aims of enhancing trade and investment cooperation, improve market access, synchronise economic policies, and foster inclusive growth and development through the utilisation of advanced technology. In 2010, the association was renamed BRICS when South Africa became a member (Lohani 2020). Table 1 displays the economic profile of the BRICS countries, where GDP and population are used as proxy measures of the size of their economies and markets, while trade and investment are used to evaluate the extent of economic integration between the BRICS countries and the rest of the globe. The BRICS countries’ share of global GDP rose from 14.90 percent in 2008 to 25.78 percent in 2022, demonstrating the substantial impact of BRICS countries on the global stage. The compound annual growth rate analysis demonstrates that the BRICS economies are experiencing a more rapid growth rate of 7.41 percent than the global economy’s growth rate of 3.29 percent. China leads the BRICS countries with the largest GDP, followed by India, Russia, Brazil, and South Africa. The BRICS countries’ share of the world population decreased from 42.92 percent to 40.91 percent in 2023, hence reducing market size. The compound annual growth rate indicates that the population growth rate of BRICS countries is 0.79 percent, which is lower than the global growth rate of 1.13%. The BRICS countries have witnessed substantial progress in trade and investment. In 2008, its share of global trade and FDI was 13.21 percent and 19.63 percent, respectively, and by 2022, these figures had risen to 18.16 percent for global trade and 23.95 percent for FDI. The examination of trade ties shows that the growth rate of trade among BRICS nations is 5.45 percent, surpassing the global trade growth rate of 3.08 percent. The BRICS countries witnessed a 0.70 percent FDI growth despite a drop of −0.72 percent globally. This mismatch shows that the BRICS countries have become preferred destinations for investment among global investors. The BRICS countries initiated capital market reforms in the early 1990s, with Brazil being the first to liberalise its market in 1991, followed by Russia in 1994, India in 1992, China in 1993, and South Africa in 1996 (Guptha and Rao 2017). These developments enabled the BRICS countries to attract significant inflows of capital. The growing intra-BRICS trade demonstrates the enhanced economic collaboration and shared development among these nations, underscoring the importance of establishing a more robust and efficient economic bloc. Therefore, the growing influence of BRICS on domestic and international arenas has motivated new countries to join the organisation.
Figure 1 depicts the trends in the BRICS GDP, population, trade, and investment patterns from 2008 to 2022. The upward trajectory of all economic indicators consistently demonstrates that the BRICS countries are undergoing significant global economic growth, solidifying their position as a formidable economic bloc. The upward trajectory of GDP indicates the growth of economic output and the growing impact of BRICS countries on a global scale. Likewise, the higher trajectory of the population trend line demonstrates the significant impact of BRICS countries on the market. The growing trade and FDI illustrate the integration of the BRICS market with the world. This also highlights the growing attraction of BRICS countries as investment destinations, contributing to the overall economic and financial stability of the global market.
Current research aims to map the risk–return relationship, persistence of volatility, leverage effect, and volatility spillover across the BRICS countries using linear and non-linear GARCH models. This study holds great significance for various reasons. First, multiple studies investigated the volatility of stock markets in industrial and emerging nations. Very few studies expressly concentrate on emerging economies, especially the BRICS markets, despite the fact that BRICS is a prominent trading bloc. Second, the fluctuating patterns of BRICS stock markets could potentially have a spillover effect on the global stock market, given their substantial market size and economic might. Third, the BRICS nations possess significant influence in global trade and investment, and any disruption might affect the movement of global trade and investment. Fourth, investors need to analyse the risk–return connections and the volatility transmission to diversify their portfolios and manage risks effectively. Additionally, it aids policymakers in formulating strategies and policies to ensure financial stability. Fifth, as globalisation progresses, the financial markets of individual nations are becoming more integrated with the global markets. Thus, any variations or disruptions in one nation have the potential to affect adjacent nations, therefore influencing both regional and global economic stability. This also poses new challenges and concerns for regulators and investors. Sixth, the analysis of the stock markets of the BRICS nations will specifically offer insightful information about the behaviour of emerging markets. Seventh, this study holds great importance since it specifically investigates the effects of crucial events, such as the financial crisis (2008), the COVID-19 epidemic, and the Russia–Ukraine conflict, on BRICS stock markets. These arguments lead to the investigation of some important aspects of the volatility of BRICS stock market returns.
This research study is planned as follows: The first section provides an overview of this study. The second section deals with a comprehensive examination of prior research on the different aspects of volatility. The third segment validates the facts, methodology, and approaches used in the investigation. The penultimate section focuses on an empirical analysis and presenting the ensuing findings. The last section encompasses the conclusive summary, policy implications, constraints, and possible directions for further study.

2. Literature Review

In finance literature, numerous studies have been conducted to investigate the risk–return relationship and volatility spillover across the world. Some are presented in the literature review to develop a clear understanding of the subject. The literature review is divided into two categories: one examines the volatility dynamics of developed, emerging, and developing countries, while the other category focuses on analysing the volatility of the BRICS stock market. Here are a few noteworthy studies:
(A). Literature Review of Emerging and Developed Markets: Srivastava (2008) analysed the return volatility of BSE and NSE stock exchanges in India using ARCH, GARCH, GARCH-M, EGARCH, and TGARCH models. The findings revealed that GARCH-M and EGARCH models demonstrated superior performance compared to other models in accurately capturing the volatility of both indexes. Jayasuriya et al. (2009) discovered in a comparative analysis of emerging and mature markets across three sub-periods that volatility was less pronounced in emerging markets during the initial two sub-periods, whereas in the third sub-period, the volatility exceeded that of mature markets in emerging markets. Nevertheless, the conclusions were derived solely from the PGARCH model. In his study, Nyamongo and Misati (2010) investigated the relationship between stock volatility and daily returns in the NSE, Kenya, and confirmed that the return volatility was highly persistent, but the leverage was not significant. In their study, Al-Rjoub and Azzam (2012) examined the impact of the financial crisis on stock return volatility in Jordan’s stock market. They found that the banking sector was the most adversely affected among all sectors, experiencing a significant decrease in stock returns during the financial crisis. Singhania and Anchalia (2013) applied the EGARCH model to examine the impact of the subprime crisis (2008) and the European debt crisis (2010) on the returns of selected Asian stock exchanges. The results of this study indicate the existence of volatility clustering, volatility persistence, and a leverage effect on the returns of the stock markets included in the sample. Li and Giles (2014) scrutinised the volatility spillover effect between developed stock markets and Asian emerging stock markets using an asymmetric multivariate GARCH model. The findings demonstrated that market conditions and crises influenced the volatility spillover dynamics, resulting in varying patterns of spillover effects across the selected countries. John et al. (2016) discovered a positive correlation between risk and return, stating a higher probability of gains than losses. Both the TGARCH-M and EGARCH-M models indicated the presence of a leverage effect. Jebran et al. (2017) in their study on volatility spillover effects found that the financial integration of emerging Asian countries significantly affects investors and policymakers. However, the EGARCH model was employed to assess the volatility spillover resulting from the stationarity of data at levels. Refai et al. (2017) studied the risk–return linkages and asymmetric volatility in the Jordanian markets using the EGARCH-M model. They revealed evidence of a positive association between risk and return in the pre-financial crisis period. Furthermore, a study also discovered that favourable news has a more pronounced effect compared to unfavourable within the same period of time. Salameh and Alzubi (2018) determined that the volatility of the Dubai financial market index mostly relied on its internal shocks, and to a lesser extent, on foreign shocks. Uludag and Khurshid (2019) observed that the most significant volatility transmission occurs between China and India among E7 markets, and the biggest volatility transmission happens between China and Japan among G7 markets. In their study, Zhang et al. (2020) found that mature markets have a stronger impact than developing markets in periods of turmoil. Additionally, they discovered that emerging markets exhibited greater sensitivity to sudden volatility changes compared to developed markets, regardless of the time period. Chaudhary et al. (2020) examined the impact of COVID-19 on the top 10 economies of the world using the GARCH model. Their study found negative mean returns for all market indices during the COVID period. However, markets show the mean reverting process. An empirical study conducted by Ahmed et al. (2021) found a notable bidirectional volatility spillover effect across most Asian stock markets, which suggests that these markets are interconnected. Bentes (2021) demonstrated a greater level of volatility during the COVID-19 era compared to the pre-pandemic period. The results also indicated that the FGARCH model is suitable for accurately measuring the volatility. Mensi et al. (2021) discovered that a negative volatility spillover had more impact than a positive volatility spillover during the COVID-19 pandemic. Setiawan et al. (2021) conducted comparative research of emerging and developed countries during the global financial crisis and COVID-19, utilising the GARCH model. The results indicated that COVID-19 exerted a more profound effect on stock returns than the global financial crisis in both emerging and developed countries. Arsalan et al. (2022) revealed that mean reversion features prevail in all stock markets under study while developing countries had the lowest mean reversion and emerging nations had the highest mean reversion. In their study, Yıldırım and Bekun (2023) utilised ARCH, GARCH, and EGARCH models to estimate the volatility of Bitcoin returns and asserted that the best-fitted model to capture the volatility was the GARCH model. Gupta (2024) found that the EGARCH model surpassed the GARCH and GJR-GARCH models in accurately predicting volatility in the stock indices of Germany, China, Japan, and Hong Kong, while in the US, the GJR-GARCH model outperformed other models.
(B). Literature Review of BRICS Markets: The volatility of stock returns in the BRICS market has been modelled by several scholars. Within this group, a few noteworthy studies are outlined as follows: Bhar and Nikolova (2009) discovered that among BRIC countries, India was highly integrated with regional and global economies, followed by Brazil, Russia, and China. Russia was the only country that influenced regional and global market equity prices. Dania and Malhotra (2013) found that the returns of all BRICS nations were symbiotic with the returns of the USA, the UK, France, and Germany, and they also noticed evidence of volatility transmission from major global markets to the BRICS stock markets. Kishore and Singh (2014) investigated that the BRICS stock market, except for Brazil and China, was significantly affected by the news from the USA, and there existed a significant difference in stock return volatility in all BRICS stock markets, suggesting significant implications for portfolio diversification. Guptha and Rao (2017) examined volatility behaviour of BRICS stock markets during the pre-crisis, crisis, and post-crisis periods of the financial crisis of 2008. The analysis discovered a significant and enduring level of volatility in all BRICS markets, except China, in the post-crisis period. Additionally, the study identified asymmetric effects in all markets, except for China. Lin’s (2018) research examined the modelling of China’s stock market using the GARCH symmetric model and the EGARCH and TGARCH asymmetric models. The asymmetric models yielded more precise forecast estimations in comparison to the symmetric models. Additionally, the EGARCH model was found optimal among the models tested. Bagchi (2017) analysed the relationship and spillover effect between crude oil prices and stock return volatility in the BRIC countries using the APARCH model. The leverage term γ > 0 for all indices of BRICS countries reported that adverse news created more volatility than favourable news and an (α + β) coefficient close to one manifested long lasting volatility persistence. Nasr et al. (2018) found that BRIC stock market returns depict heterogeneous linkages with country-specific characteristics, and an asymmetric effect was found to have a greater influence of negative news on market dynamics. In their study, Zhang et al. (2021) discovered that the G7 countries were net exporters of risk, while the BRIC countries were net importers of risk. The study also found that G7 volatility spreads more than BRIC volatility. Joo et al. (2023) employed the DCC-GARCH and AGDCC-GARCH models to investigate bidirectional volatility spillover. The analysis found a long-term integration and significant bidirectional spillover effect, confirming the close link of the BRICS stock markets.
The aforementioned literature review indicates that several studies were conducted to explore the volatility dynamics of stock returns in developed, emerging, and developing nations. However, there is a lack of research examining the risk–return linkages, volatility persistence, leverage effects, and volatility spillover effects within emerging markets, especially in BRICS stock markets using linear and non-linear GARCH models. Therefore, the objective of this research is to fill this void by investigating “Mapping Risk-Return Linkages and Volatility Spillover in BRICS Stock Markets through the Lens of Linear and Non-Linear GARCH Models.”

3. Methodological Approach

This section explains the research methodology and data used for modelling the risk–return relationship and the volatility spillover. The subsequent text provides a thorough explanation:

3.1. Objectives of This Study

The objectives of the current research framework are constructed as follows:
  • To investigate the presence of volatility persistence in BRICS countries’ stock market returns.
  • To examine the risk–return linkages in BRICS countries’ stock market returns using the GARCH-M model.
  • To assess the leverage effect on BRICS countries’ stock market returns using the non-linear models.
  • To identify the best-fitted model for capturing the volatility of BRICS countries’ stock market returns.
  • To analyse the volatility spillover effect among BRICS countries’ stock market returns.

3.2. Sample Selection and Database

This research employed a quantitative methodology incorporating linear and non-linear models. This study empirically analysed the daily data of stock price indices due to their higher data intensity, which is more appropriate for assessing stock return volatility using econometric models (Sahiner 2022). The data are freely downloaded from the database of investing.com and processed using Eviews-12 for quantitative analysis. The leading stock indices of the BRICS nations that have been chosen include the BOVESP index for Brazil’s stock market, the RTSI index for Russia, the Nifty for India, the SSE for China, and the FTSE for South Africa (Guptha and Rao 2017; Zhang et al. 2021). These indices serve as indicators for the stock market performances of BRICS countries (Joo et al. 2023). This study spans a duration of 15 years, with effect from 1 April 2008 to 31 March 2024. On the basis of a literature review, the scope of the present study is confined to linear models such as ARCH, GARCH, and GARCH-M and non-linear models, namely EGARCH and TGARCH. The daily closing prices of BRICS countries’ stock returns were transformed into log returns using the following formula:
r t = l o g p t p t 1
where r t = Returns; p t = Daily closing prices at current period: pt−1 = Closing prices of the previous day.

3.3. Distributional Assumption of Error Term

The GARCH model specification commonly employs several distributional assumptions, such as Gaussian distribution, Students’ t distribution, generalised error distribution (GED), Students’ t distribution with fixed degrees of freedom, and GED with a fixed parameter. These assumptions are used to account for the presence of fat-tailed distributions frequently observed in financial data (John et al. 2016). The estimations in this study rely on the assumption that the error term follows a Gaussian distribution.

3.4. Model Specification

The symmetric and asymmetric models were described in the following manner to address the objectives:
ARCH Model: The ARCH model, developed by Engle (1982), is used to estimate volatility. Equation (1) presents the model’s specification, as below.
σ t 2 = α 0 + i = 1 q α i ε t i 2
where σ t 2 is conditional volatility, α 0 is the mean, q denotes the number of the previous ε t 2 terms, and ε t i 2 is white noise representing the residuals of time series, i = 1 q α i < 1 stating that the process of covariance is stationary. The ARCH model signifies the variability of error terms in a typical autoregressive process, which is contingent upon the variances of previous error terms.
GARCH Model: The GARCH model, an extension of the ARCH model proposed by Bollerslev in 1986, is a symmetric model that assumes an equal effect of positive and negative news on volatility. The distinguishing feature of the GARCH model is its ability to include the influence of both prior squared error values and past conditional variance on the current conditional variance. Equations (1) and (2) provide the specification of the GARCH model, as below:
σ t 2 = α 0 + i = 1 q α i ε t i 2 + i = 1 p β i σ t i 2
Equation (2) has a constant term (α0) and coefficients for ARCH (α1, α2, …, αq) and GARCH (β1, β2, …, βp) specifications. The ARCH and GARCH processes have the following orders: q and p.
σ 2 = α 0 + α 1 ε t 1 2 + β 1 σ t 1 2
α 0 Hypothetical long-run average variance (constant term).
ε t 1 2 The first independent variable, which reflects “news” about the previous period’s volatility (ARCH term).
σ t 1 2 The second independent variable, which reflects the forecast variance from the previous period (GARCH term).
GARCH-M Model: The GARCH-M model, proposed by Bollerslev et al. (1988), represents an advancement over the GARCH model by incorporating conditional variance into the mean equation. This model takes into account risk and return trade-offs. GARCH-M is defined by Equations (4) and (5), as follows:
Mean Equation
r t = μ t + ε t   where   μ t = μ + λ σ t 2 + ε t
Variance Equation
σ 2 = α 0 + α 1 ε t 1 2 + β 1 σ t 1 2
where λ in the mean equation is the risk premium parameter. A positive λ indicates that investors are compensated for assuming the greater risk or vice versa.
EGARCH Model: The exponential GARCH model, introduced by Nelson (1991), addresses the limitation of the GARCH model, which overlooks the asymmetry in volatility. The EGARCH model considers the leveraging effect (asymmetry) of positive and negative asset returns. The E-GARCH (1, 1) specifications for conditional variance is presented by Equation (6), as below:
log σ t 2 = α 0 + i = 1 q α i ε t i σ t i + i = 1 p β i log σ t i 2 + i = 1 q γ i ε t i σ t i
where γ represents the asymmetry response parameter (leverage parameter). The positive coefficient of γ (γ > 0) reduces future volatility, while the negative value of γ (γ < 0) increases future volatility. The negative coefficient of the leverage effect and the term α i measures the volatility clustering effect.
TGARCH Model: The Threshold GARCH model, introduced by Glosten et al. (1993), represents another advancement in modelling volatility to address asymmetrical effects. In the TGARCH model, the conditional variance is thus given by Equation (7), presented as below:
σ t 2 = α 0 + i = 1 q α i ε t i 2 + i = 1 p β i σ t i 2 + i = 1 q γ i ε t i 2 I t i
where γ i = the leverage effect coefficient. If the γ i = 0 shows the symmetric effect, then α i = the impact of good news on volatility; α i + γ i = the impact of bad news on volatility.
News Impact Curve: The present study employed the news impact curve (Engle and Ng 1993) to visually depict the influence of positive and negative news on the fluctuation of stock returns. The graph’s horizontal axis depicts a range of values, where the negative parameter implies unpleasant news, and the positive parameter signifies pleasant news. The vertical axis of the graph reflects the degree of volatility in returns. A news impact curve has been constructed for all BRICS countries by using linear and non-linear models.
Volatility Spillover: The transmission of variations or shocks in one country’s stock market indices to another country is termed the volatility spillover effect (Dedi et al. 2016; Ke et al. 2010). Volatility spillover can occur in two ways: bidirectional—where shocks in the stock indices of both nations affect the stock returns of each other, or unidirectional—where shocks in one market affect the other market but not the other way around. This study administered the EGARCH model, which is shown to be the most suitable model (Table 8) to measure the volatility spillover among the BRICS countries, and this model is also utilised by Ahmed et al. (2021); Jebran et al. (2017); and Panda and Deo (2014). Additionally, this satisfies the condition of stationarity of data at levels shown by Jebran et al. (2017). Equations (8) and (9) are employed in the EGARCH model to analyse the transmission of volatility across the stock markets of the BRICS countries. Equation (8) represents the mean equation, while Equation (9) represents the variance equation. The generated volatility residual series were utilised as a proxy, which represent the shock experienced by each stock market index. The following equations describe the specification of the extended EGARCH model:
Mean Equation of Return Spillover
R t = c + ω R t 1 + γ R t 1   ( s t o c k   i n d i c e s ) + ε t
Variance Equation of Volatility Spillover
h t = α 0 + α 1 h t 1 + σ ε t 1 h t 1 + β 1 ε t 1 h t 1 + δ ( Volatility   residuals   of   stock   indices )
In the mean equation, Rt represents the stock price returns: c—intercept: ω —stock price coefficient, which measures the effect of the previous day return on the next day return, and γ —measures the return spillover from one market to another market.
In the variance equation, α 0 denotes the constant level of volatility: α 1 h t 1 is the function of volatility: σ ε t 1 h t 1 capture the asymmetric effect of volatility: β 1 ε t 1 h t 1 denotes the response of volatility to change in the news, the coefficient δ denotes the volatility spillover from one market to another market, while ‘volatility residuals of stock indices’ (RSI) represents the volatility residuals for each stock market index, which is used as a proxy of volatility spillover (Ahmed et al. 2021; Jebran et al. 2017).

3.5. Diagnostic Test

The diagnostic tests are utilised to determine the stationarity, normality, and heteroscedasticity of the BRICS countries’ stock returns, as illustrated below:
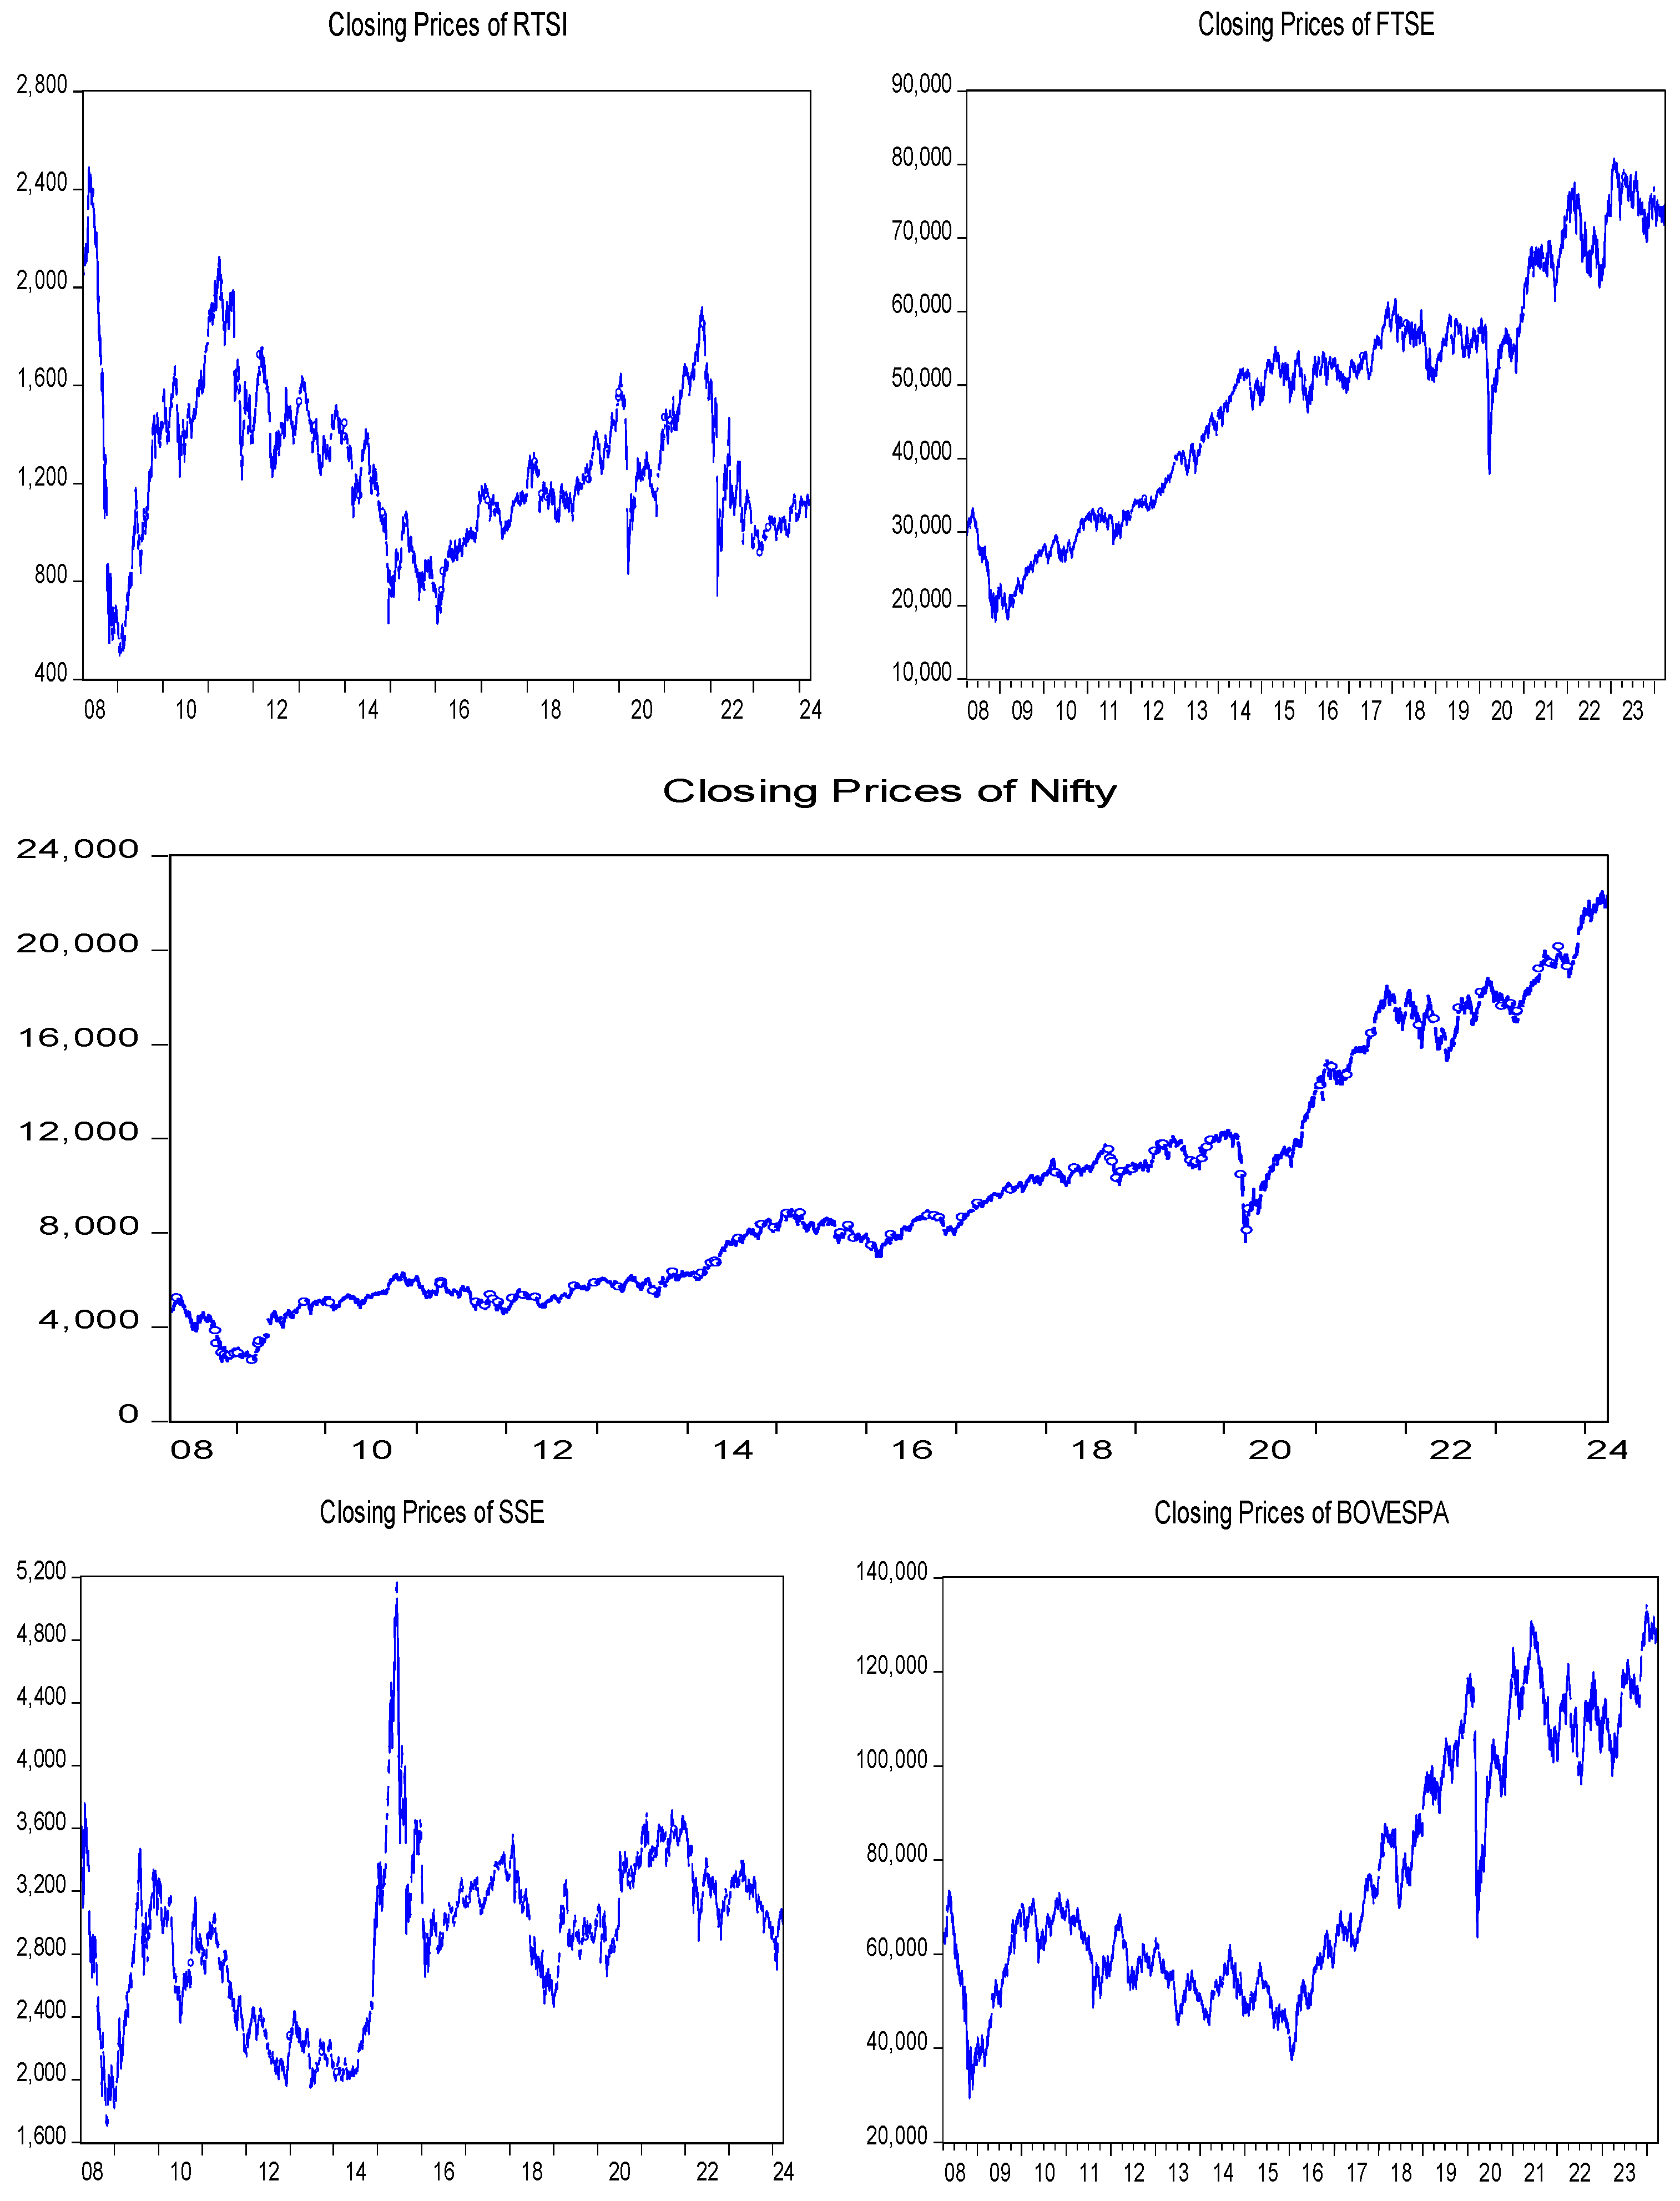
Test of Stationarity: Figure 2 shows the daily closing prices for all BRICS stock market indexes from 1 April 2008 to 31 March 2024. The variations in the closing pricing validate the non-stationary nature of the data.
To achieve stationarity in the time series, the closing prices of stock market indexes were transformed into natural logarithmic returns. Once the data were converted into log returns, a graph was created to represent the occurrence of volatility clustering of stock returns, as indicated in Figure 3.
Subsequently, the ADF and PP tests were performed on log returns to verify stationarity. These tests operate under the following hypotheses to test the stationarity of the stock returns:
H0: 
The returns series has a unit root (non-stationary).
H1: 
The returns series has no unit root (stationary).
The findings of ADF and PP tests, presented in Table 2, reject the null hypotheses at a 5 percent significance, indicating that stock returns series are stationary at level.
Test of Normality: The Jarque–Bera test was used to assess the normality of returns based on the following hypotheses:
H0: 
The returns series is normally distributed.
H1: 
The returns series is not normally distributed.
Table 3 presents the outcomes of the normality of returns. The output of the test rejects null hypotheses at a 5 percent level of significance, indicating non-normality.
Test of Heteroscedasticity: The ARCH-LM test was performed to verify the presence of heteroscedasticity in the stock indexes in the BRICS countries. The following hypotheses are proposed:
H0: 
There is no ARCH effect.
H1: 
There is an ARCH effect.
Table 4 reveals the results of heteroscedasticity for the residuals of the BRICS countries’ stock indices. This analysis supports the Box–Jenkins assumption that residuals are constant across time. All hypotheses are rejected at the 1 percent significance level, proving an ACRH effect on BRICS stock returns and confirming heteroscedasticity.

4. Discussion and Interpretation

The subsequent section provides a thorough interpretation of the risk–return relationship, leverage effect, and volatility spillover effect of the BRICS countries’ stock returns:

4.1. Risk–Return Relationship and Leverage Effect

Table 5 presents the descriptive estimates, explaining the pattern of stock returns in BRICS countries. The positive daily mean returns for South Africa, India, and Brazil exhibit that the stock market returns in these countries are higher than those in Russia and China, where the daily mean stock return is negative. The negative minimum values in all BRICS countries depict that returns on these stock indices are very low, and the maximum loss is −0.08873 in the case of China, followed by South Africa, India, Brazil, and Russia. Alternatively, all maximum values are positive, indicating that investors are gaining by investing in these indices, and the maximum gain is 0.23204 in the Russian case, followed by India, Brazil, South Africa, and China. The coefficients of the standard deviation indicate the degree of stock return volatility. The volatility is highest in Russia (0.02295), followed by Brazil, China, India, and South Africa. All BRICS countries have negative skewness coefficients, suggesting that the deviations are on the higher side of the mean, implying a larger return for South Africa, India, and Brazil and a low return for Russia and China. Kurtosis coefficients are positive and more than three for all BRICS countries, indicating a leptokurtic distribution.
Table 6 presents ARCH (1) results for BRICS countries’ stock market indexes. The positive and significant mean equation coefficients (µ) are for Russian, South African, and Indian equity markets. While in the variance equation, the ARCH terms (α) for all BRICS stock market returns series are positive and significant. Thus, the relevance of the ARCH term (short-term volatility) denotes the effect of the lagged squared error term on current volatility. The variance equation of the ARCH (1) model for BRICS countries is described below:
R u s s i a   σ 2 = 0.000257 + 0.327868 ε t 1 2 S o u t h   A f r i c a   σ 2 = 0.000104 + 0.324399 ε t 1 2 I n d i a   σ 2 = 9.84 × 10 5 + 0.433929 ε t 1 2 C h i n a   σ 2 = 0.000148 + 0.327868 ε t 1 2 B r a z i l   σ 2 = 0.000194 + 0.291403 ε t 1 2
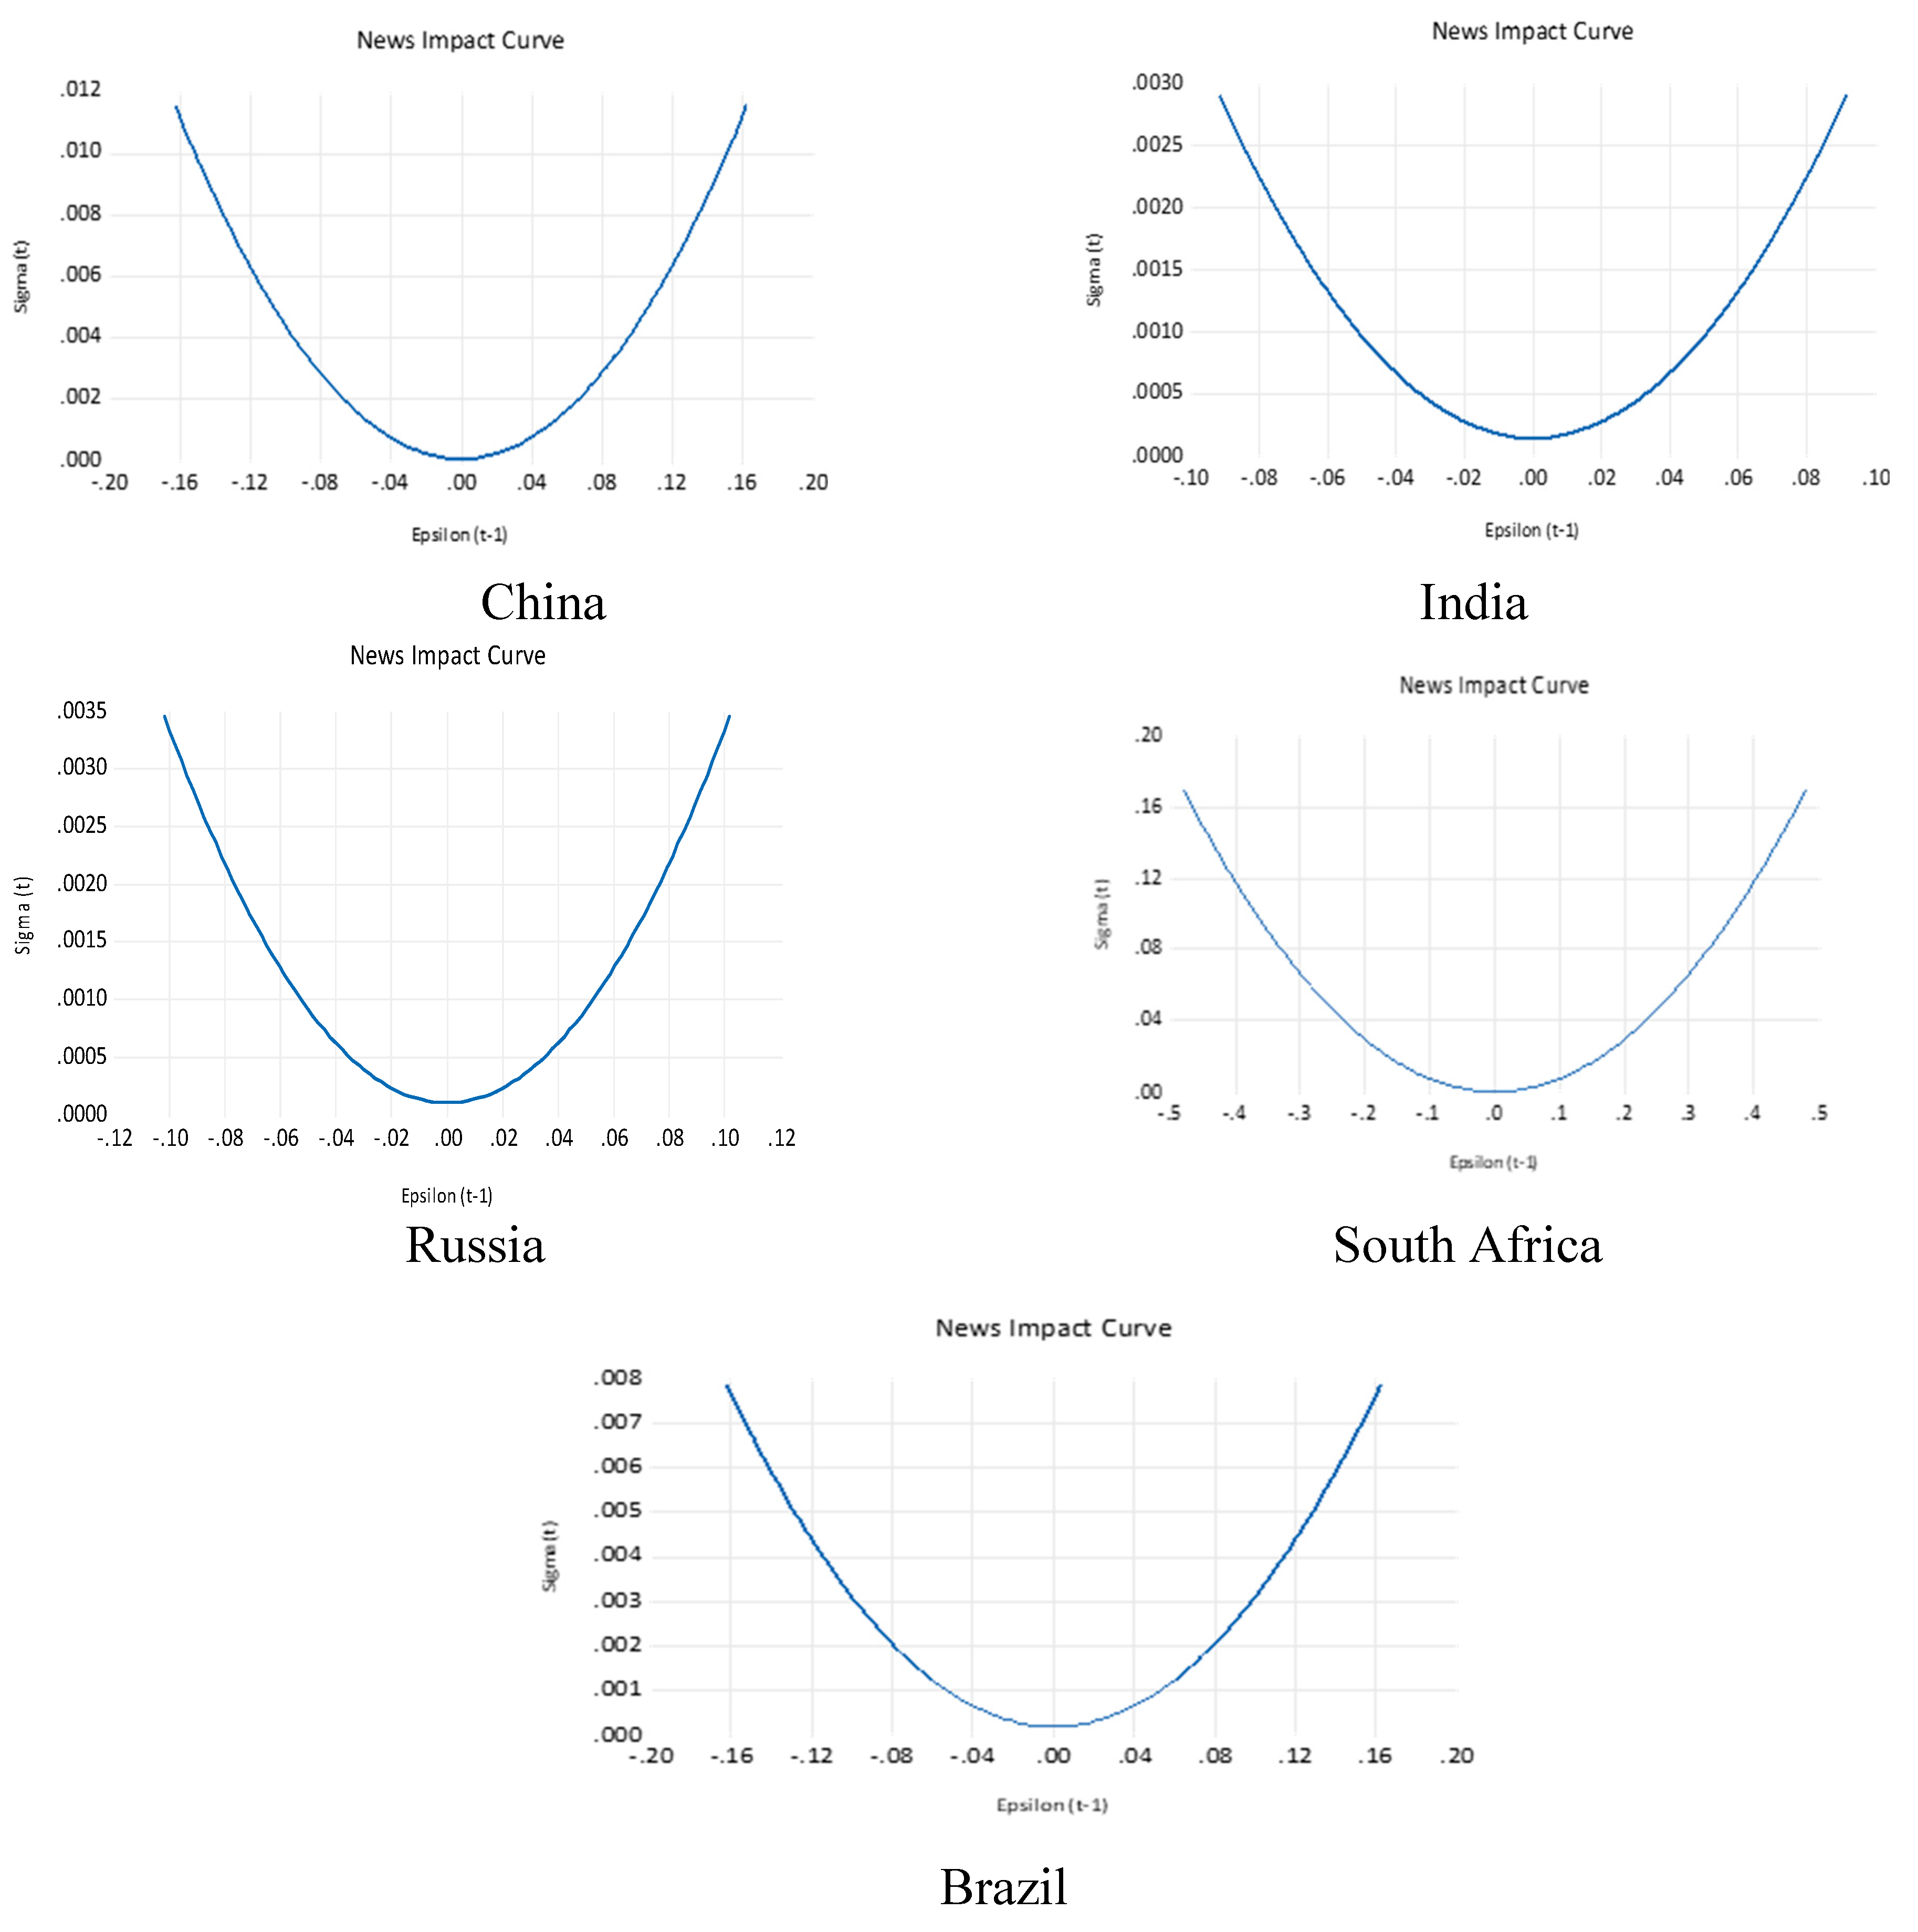
Using the ARCH model, Figure 4 shows the visual representations of the news impact curves on the volatility of the BRICS stock markets. The analysis suggests that the news impact curves are symmetrical and do not reflect any differential effect of good and bad news on the volatility of stock market. Therefore, both pleasant and unpleasant news have an equivalent effect on the conditional volatility of the BRICS countries’ stock markets.
Table 7 demonstrates the estimates of the GARCH (1, 1) model for a BRICS country’s stock returns. In the conditional mean equation, the constant terms are positive and significant for Russia, South Africa, India, and Brazil, except China, stating that the value of returns will inflate in the near future. The coefficients of ARCH (α) and GARCH terms (β) both are related to news, where α signifies the recent news and β represents the old news. Both α and β coefficients are positive and significant in all the indices, indicating the effect of recent and old news on current volatility. The coefficients of GARCH terms for all indices are 0.886934, 0.903966, 0.905193, 0.600000, and 0.903966, respectively, and the in-variance equation is found to be greater than the coefficients of ARCH terms such as 0.105867, 0.081130, 0.086815, 0.150000, and 0.081130, respectively, suggesting that the volatility responded immediately to old news instead of recent news. The aggregate of α + β coefficients reveals the volatility persistence, where a value more than one denotes the shocks at time t lasting indefinitely, while a coefficient less than one depicts the mean reverting process. High volatility results in abnormal gains, which may cause market inefficiency. In addition, sudden price movements influence investors due to high volatility persistence, which makes investors reluctant to invest (Hameed et al. 2006). The total of α and β coefficients for RTSI, FTSE, NIFTY, and BOVESPA are closer to one, indicating the slow mean reversion process; however, SSE index findings reflect a fast mean reversion process. The variance equation of the GARCH (1, 1) model for the BRICS countries is described below:
R u s s i a   σ t 2 = 5.56 × 10 6 + 0.105867 ε t 1 2 + 0.886934 σ t 1 2 S o u t h   A f r i c a   σ t 2 = 1.99 × 10 6 + 0.81130 ε t 1 2 + 0.903966 σ t 1 2 I n d i a   σ t 2 = 6.32 × 10 6 + 0.086815 ε t 1 2 + 0.905193 σ t 1 2 China   σ t 2 = 0.000135 + 0.150000 ε t 1 2 + 0.600000 σ t 1 2 B r a z i l   σ t 2 = 6.32 × 10 6 + 0.081130 ε t 1 2 + 0.903966 σ t 1 2
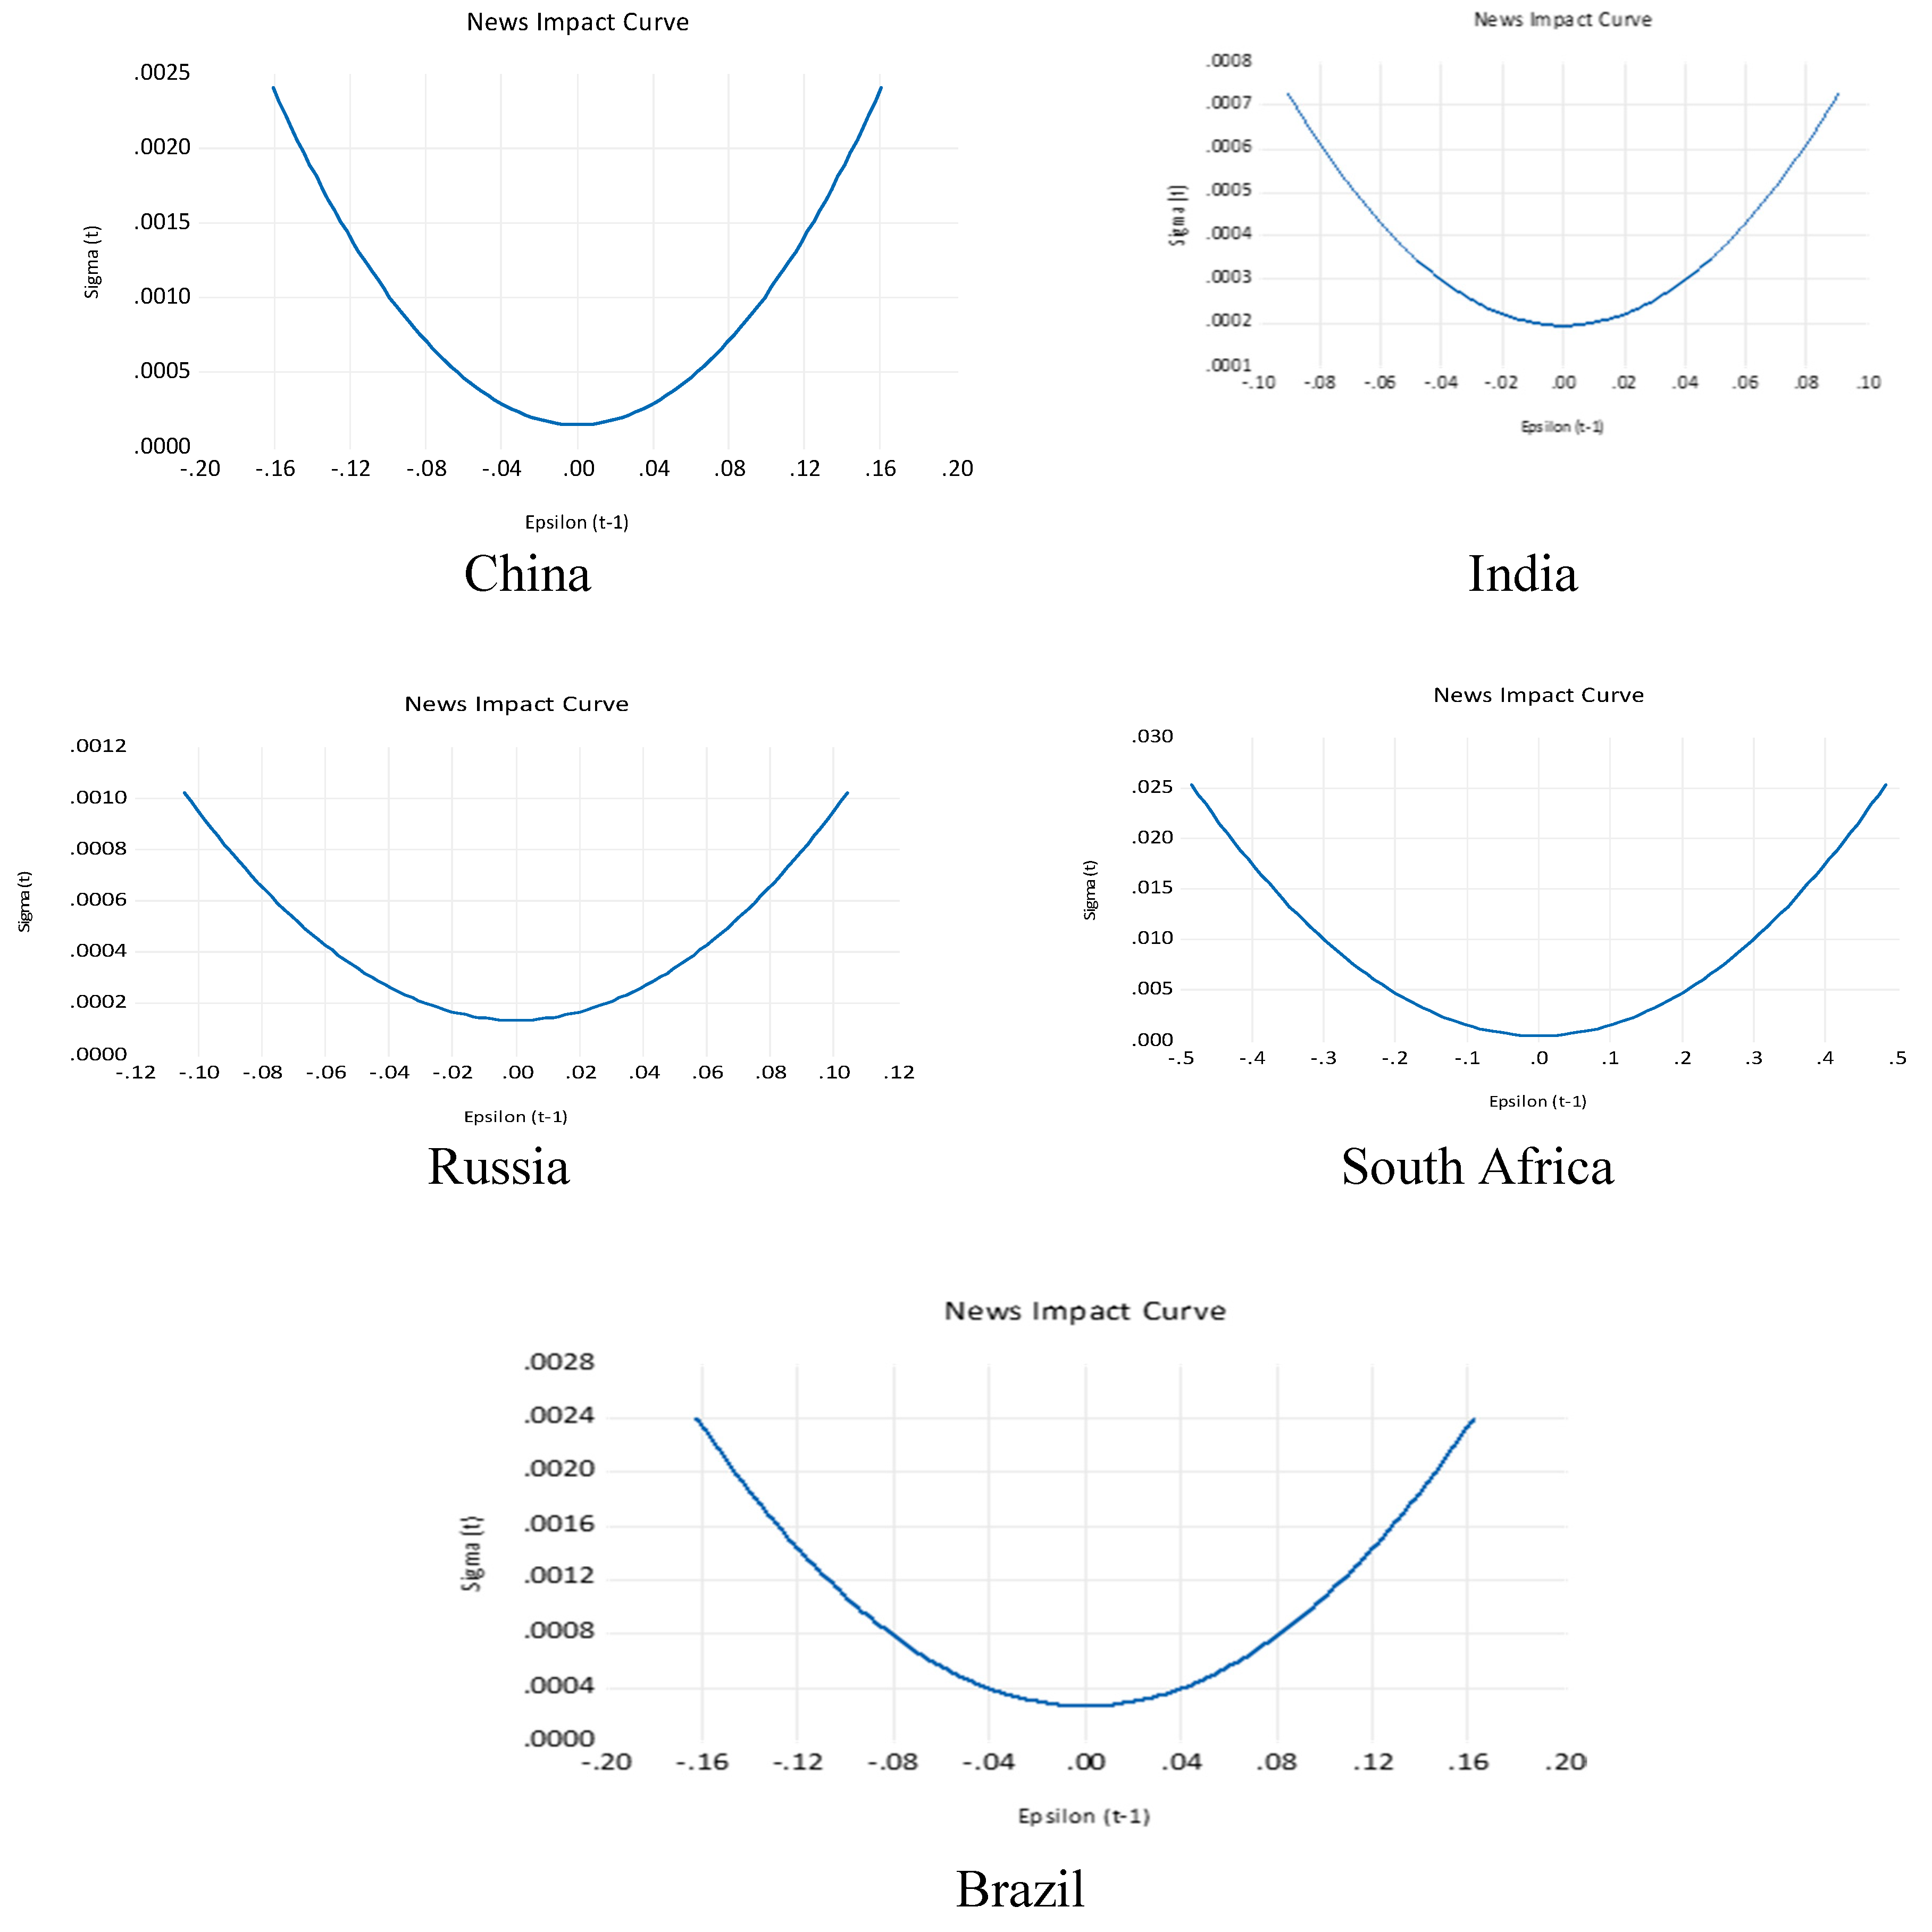
Figure 5 displays the GARCH model’s graphical representation of the news impact on conditional volatility. The analytical findings indicate that both positive and negative news have the same influence on the conditional volatility of the BRICS stock market.
Table 8 elucidates the estimates of the GARCH-M model for BRICS stock returns. The conditional mean equation coefficient (µ) is positive and significant only for India. The coefficients for constant term (c), the ARCH term (α), and the GARCH term (β) are positive and significant at a 1 percent level. This study applied the GARCH-M model to predict the risk–return relationship of BRICS stock indices, and the term Lambda (λ) represents the risk premium. Except for South Africa, all indices of risk premium coefficients are positive and insignificant, implying an absence of a risk–return link. As a result, investors in Russia, India, China, and Brazil are not rewarded for taking on higher risk, signifying that investors and hedgers should pursue risk-averse strategies. On the contrary, positive and significant findings for South Africa imply that investors are rewarded for taking on more risk. The variance equation of the GARCH-M model for BRICS countries is described below:
R u s s i a     σ t 2 = 5.61 × 10 6 + 0.106063 ε t 1 2 + 0.886588 σ t 1 2 S o u t h   A f r i c a   σ t 2 = 2.02 × 10 6 + 0.081463 ε t 1 2 + 0.903375 σ t 1 2 I n d i a   σ t 2 = 1.40 × 10 6 + 0.087213 ε t 1 2 + 0.904745 σ t 1 2 C h i n a   σ t 2 = 1.23 × 10 6 + 0.065318 ε t 1 2 + 0.929615 σ t 1 2 B r a z i l   σ t 2 = 6.35 × 10 6 + 0.081524 ε t 1 2 + 0.891748 σ t 1 2
Figure 6 displays the news impact curves using the GARCH-M model. The findings indicate that both pleasant and unpleasant news have a symmetrical influence on the conditional volatility of BRICS stock returns.
Table 9 provides the exponential GARCH output for BRICS stock returns, which aims to capture the asymmetric or leverage effect. The positive and significant parameters of ARCH and GARCH terms demonstrate that recent and past news have a discernible impact on current volatility. The higher levels of GARCH coefficients, compared to ARCH coefficients, observed across all BRICS countries, imply that markets demonstrate a longer memory. The leverage effect, represented by the symbol gamma (γ), is negative and significant in all the indices, indicating that bad news exerts a stronger influence on volatility than good news. The sum of α + β coefficients exceeds one for all BRICS countries, confirming the long-lasting volatility persistence. The variance equation of the EGARCH model for BRICS countries is outlined as follows:
R u s s i a   ln σ t 2 = 0.250792 + 0.982870 ln σ t 1 2 + 0.149606   ε t i σ t i 2 π   ( 0.092590 ) ε t i σ t i S o u t h   A f r i c a   ln σ t 2 = 0.245044 + 0.982192 ln σ t 1 2 + 0.105574   ε t i σ t i 2 π ( 0.116614 ) ε t i σ t i I n d i a   ln σ t 2 = 0.257286 + 0.984814 ln σ t 1 2 + 0.152779   ε t i σ t i 2 π ( 0.089785 ) ε t i σ t i C h i n a   ln σ t 2 = 0.205928 + 0.989852 ln σ t 1 2 + 0.157227   ε t i σ t i 2 π ( 0.017192 ) ε t i σ t i B r a z i l   ln σ t 2 = 0.312047 + 0.976677 ln σ t 1 2 + 0.147723   ε t i σ t i 2 π ( 0.076977 ) ε t i σ t i
Figure 7 displays the news impact curves of the EGARCH model for BRICS nations. The visual depiction reports that positive or negative news asymmetrically affects the volatility of stock market returns. Except for China, the negative side of the curve has a more pronounced upward slope than the positive side for all BRICS countries.
The TGARCH is an alternative approach for identifying the leverage effect, as indicated in Table 10. The coefficients of ARCH and GARCH in the TGARCH model demonstrate significant positive effects for all BRICS countries’ stock indices, except South Africa, where the ARCH coefficient is negative. The gamma value for all BRICS stock markets is found to be positive and significant, indicating the presence of a leverage effect resulting from the news. The results affirm that negative news has a more pronounced effect than pleasant news. The coefficients of volatility persistence (α + β + γ/2) for Russia, South Africa, India, China, and Brazil are 0.9867225, 0.9850295, 0.987812, 0.9943555, and 0.9718425, respectively. The high volatility persistence coefficients, which are less than one, reveal a mean reverting process, suggesting that a greater level of volatility eventually moves towards normal levels (Akhtar and Khan 2016). The variance equation of the TGARCH model for BRICS countries are described as below.
R u s s i a   u t 2 = 5.50 × 10 6 + 0.022247 u t 1 2 + 0.906231 σ t 1 2 + 0.116489 u t 1 2 I t 1 S o u t h   A f r i c a   u t 2 = 1.84 × 10 6 + 0.002094 u t 1 2 + 0.922443 σ t 1 2 + 0.129361 u t 1 2 I t 1 I n d i a   u t 2 = 1.75 × 10 6 + 0.018759 u t 1 2 + 0.905076 σ t 1 2 + 0.128014 u t 1 2 I t 1 C h i n a   u t 2 = 1.28 × 10 6 + 0.059620 u t 1 2 + 0.928545 σ t 1 2 + 0.012381 u t 1 2 I t 1 B r a z i l   u t 2 = 6.50 × 10 6 + 0.022128 u t 1 2 + 0.898608 σ t 1 2 + 0.102213 u t 1 2 I t 1
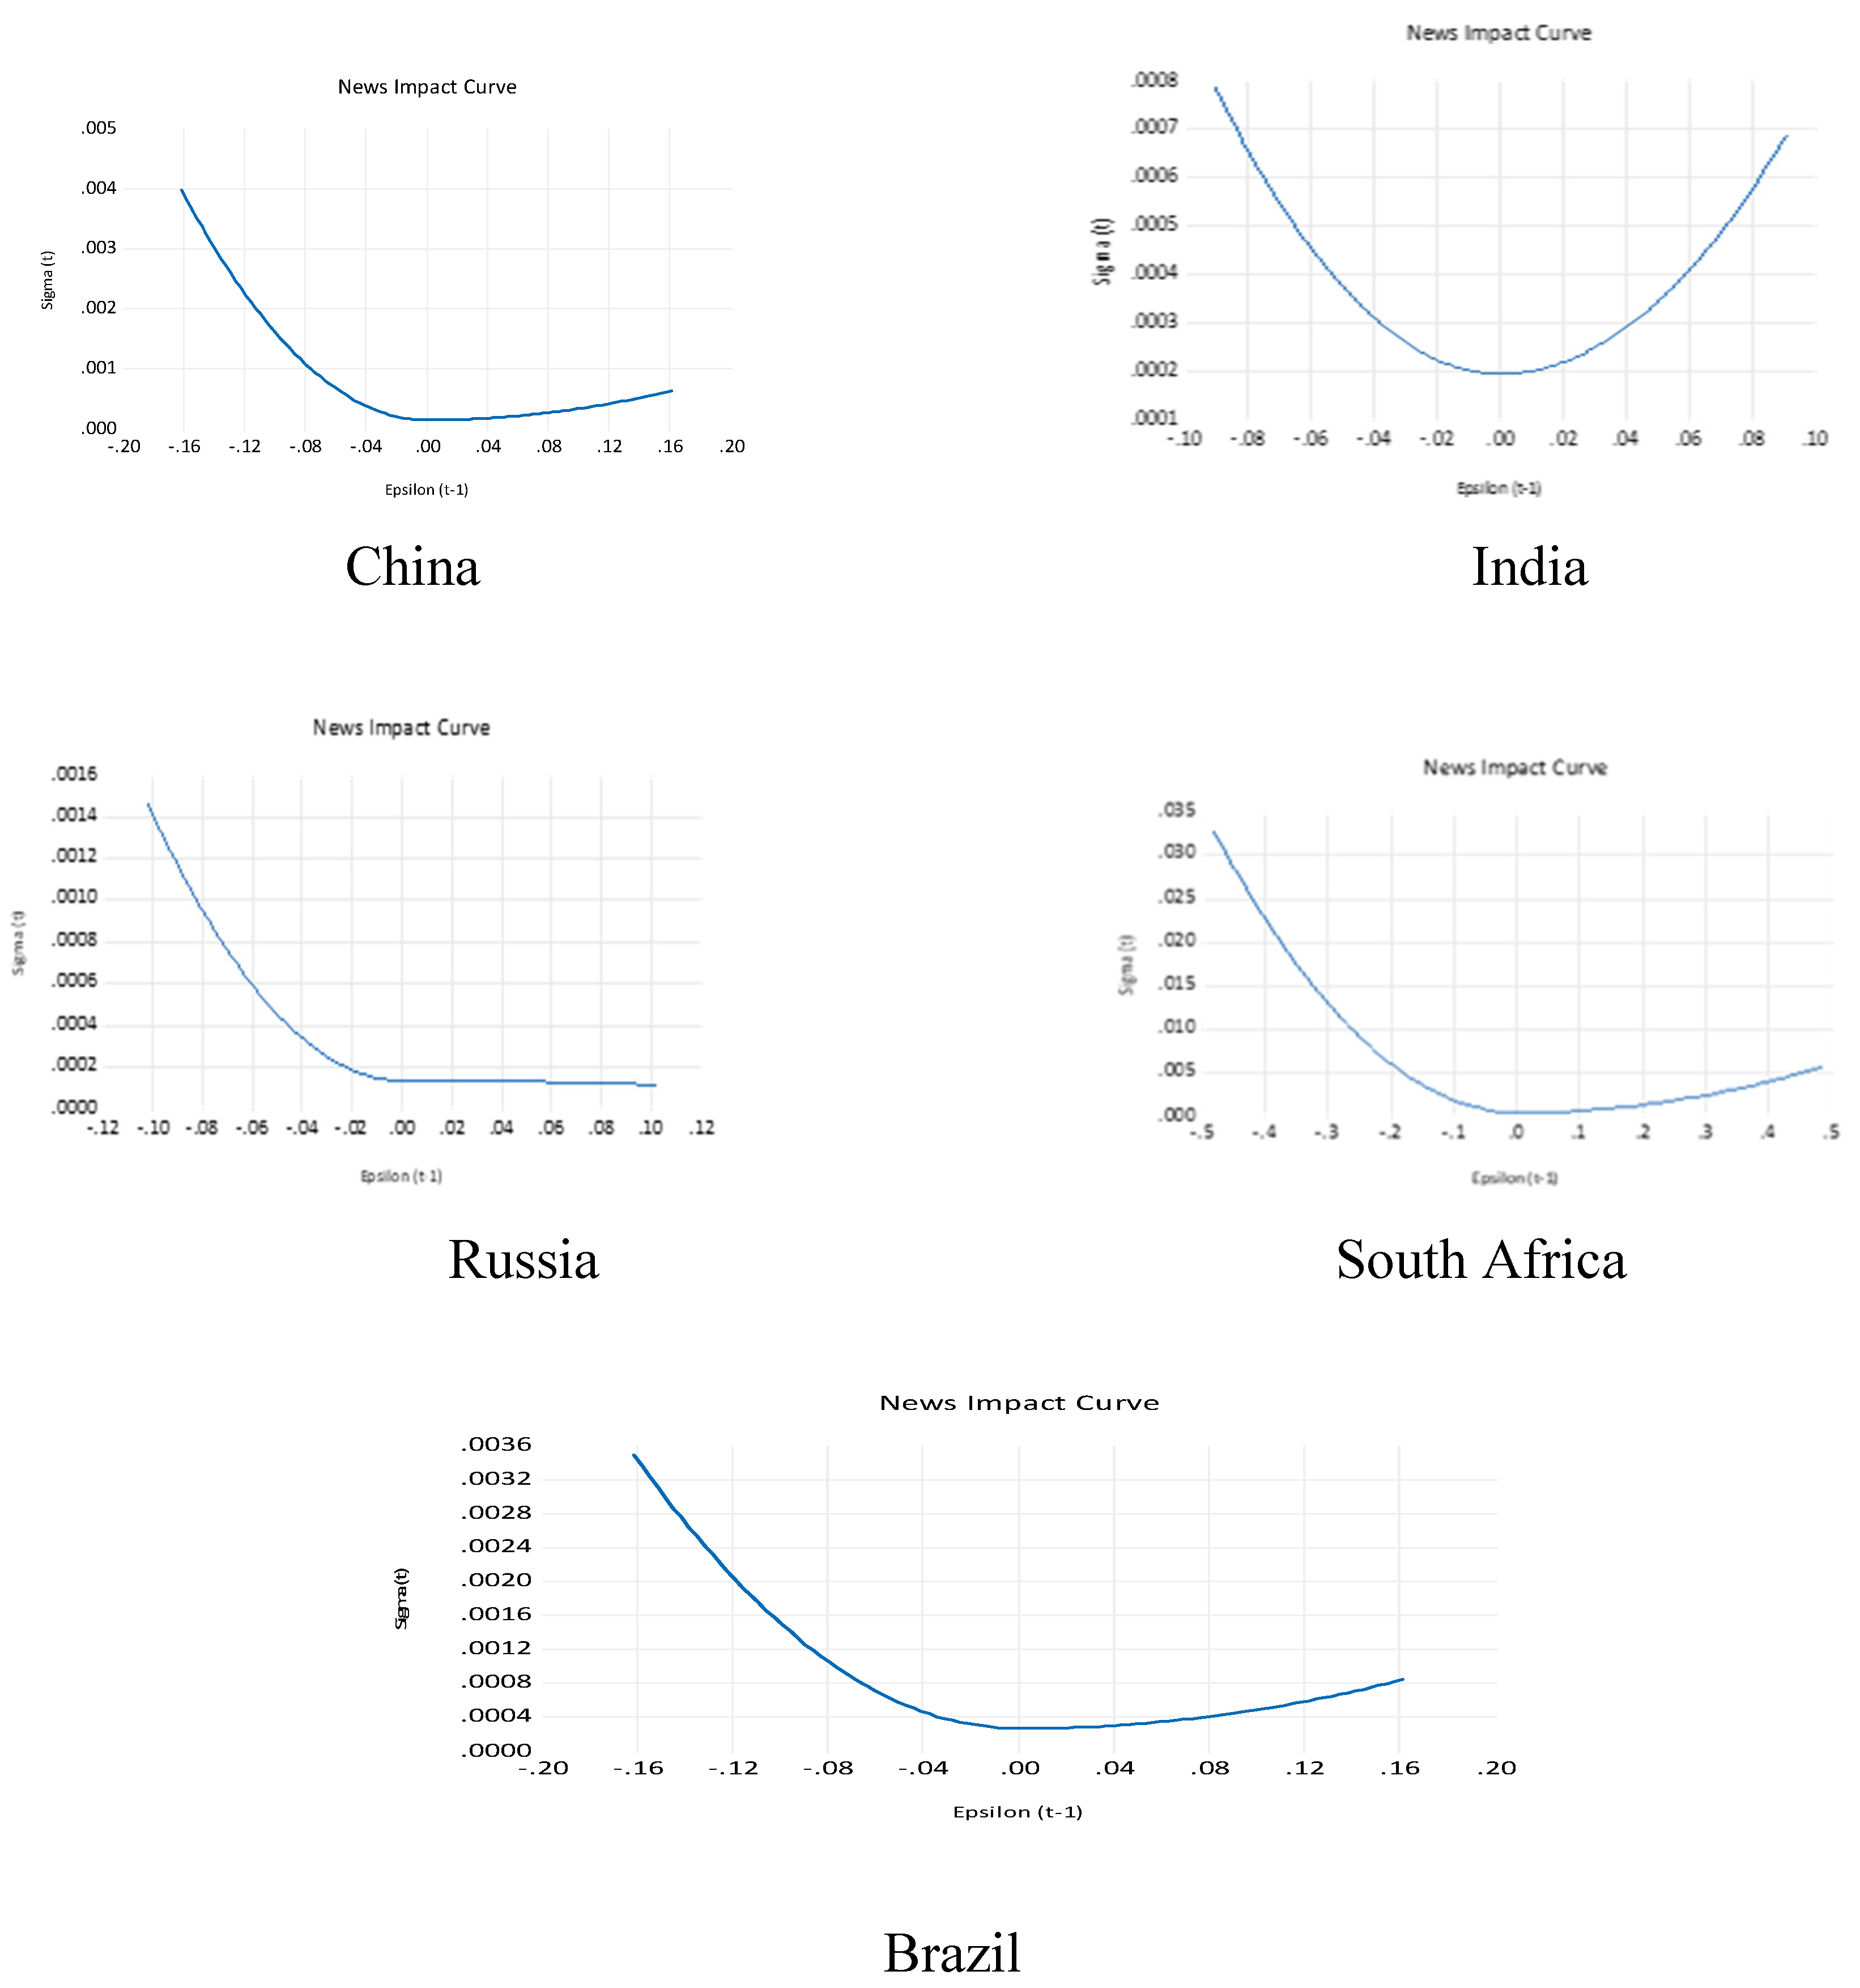
The TGARCH model is employed to capture the leverage effect on the conditional volatility of stock returns in BRICS countries. The output of Figure 8 confirms that unpleasant news has a greater effect on conditional volatility as opposed to pleasant news for all BRICS nations.

4.2. Prediction of the Best-Fitted Model among BRICS Countries Stock Markets

Table 11 presents the log likelihood, AIC, and SIC coefficients for ARCH, GARCH, GARCH-M, EGARCH, and TGARCH models. These coefficients are used to ascertain the most optimal model. The optimal model for each country is determined by selecting the model with the highest log likelihood value and the lowest AIC and SIC values. The analysis confirms that the TGARCH model is the most acceptable model for Russia, China, and Brazil, while the EGARCH model is the most acceptable for South Africa and India. However, the EGARCH model is considered the most suitable model because of its maximum log likelihood (12,656.80) coefficients and the lowest AIC (−6.331734) and SIC (−6.322285) coefficients compared to the alternative models.

4.3. Return and Volatility Spillover Effect among BRICS Stock Market

Table 12 displays the results of the mean return equation about return spillover among BRICS stock indices. The estimates of the return spillover within a country’s own markets (µ) indicate a positive and significant first lag of their own return spillover for BRICS countries’ equity market, suggesting its dependability on its own first lag (Ahmed et al. 2021; Gupta 2024). The return spillover effects for Russia, South Africa, China, and Brazil are found to be insignificant, indicating that these markets’ returns are unaffected by their own prior performance. There is the presence of bidirectional return spillover between the markets of India–Russia and India–Brazil, indicating that the return spillover of these equity markets has a positive effect on each other. Nevertheless, the current investigation did not observe any instances of a unidirectional return spillover. The findings of the mean equations confirm that the quantum of return spillover is highest for Brazil to India and lowest for India to Russia.
Table 13 thoroughly explains the EGARCH model’s estimations of the volatility spillover of BRICS countries’ stock market indices based on a variance equation analysis. The volatility transmission within domestic markets is quantified using the variance equation (Ѡ), and the results validate that the volatilities of BRIC countries, except South Africa, have a negative and significant impact on their respective markets. These estimations aim to capture the transfer of volatilities from one market to another market, as well as within each market. The ARCH (α) and GARCH (β) coefficients denote the short-term and long-term volatility spillover among the stock market returns of BRICS countries. The positive and significant coefficients of ARCH and GARCH demonstrate that BRICS countries’ stock markets are integrated and do not provide opportunities for portfolio diversification (Joo et al. 2023).
The presence of negative and significant coefficients of asymmetric volatility (γ) spillover indicates that negative shocks result in higher volatility compared to positive shocks. The presence of a positive and significant volatility spillover from South African markets to the Russian market suggests that an escalation in volatility in South Africa leads to an increase in volatility in the Russian market. The South African stock market exhibits a negative volatility spillover effect from Brazil’s stock market, indicating that a decrease in volatility in Brazil leads to a decrease in volatility in South Africa. The Indian market experiences the volatility spillover from all BRICS countries, with Russia, South Africa, and China wielding a negative and significant influence on the Indian market, while Brazil has a positive impact. All BRICS countries have a negative and significant impact on the volatility of the Chinese stock market. A bidirectional volatility spillover between Russia–Brazil, South Africa–Brazil, India–China, and India–Brazil indicates that these markets are interconnected. These findings have important implications for investors in choosing a diversified portfolio, especially with limited investment options (Kao et al. 2018). The unidirectional volatility spillover is noticed from Russia to India, South Africa to India, China to Russia, South Africa to China, and Brazil to China, which indicate that shocks originating in one market are transferred to other markets, but the market that receives the shock does not reciprocate to the original market (Ahmed et al. 2021).

5. Conclusions and Policy Implications

This study investigates the risk–return relationship and the volatility spillover effect in BRICS stock markets using linear and non-linear models. The results of the Jarque–Bera test, ADF, PP, and ARCH-LM provide evidence of non-normality, stationarity, heteroscedasticity, and volatility clustering of return series. The aggregate of α + β coefficients less than one in the GARCH, GARCH-M, and TGARCH models implies that volatility will take a long time to die away, leading to a slow mean reverting process (Chaudhary et al. 2020). In contrast, estimations from the EGARCH model indicate that the coefficients of volatility persistence are greater than one, implying that volatility will continue indefinitely without a mean reverting process.
The GRACH-M model’s findings for the risk–return link report that there is a lack of the risk–return relationship among all BRICS countries, except for South Africa. This implies that investors should adopt risk-averse strategies for the stock markets of Russia, India, China, and Brazil. Conversely, higher risk strategies may be appropriate for the South African stock market, which could be compensated for assuming greater risk. Positive or negative news effects are analysed using the symmetric and asymmetric models. The results of the symmetric models indicate that both positive and negative news exert an equal effect on stock return volatility. The findings of asymmetric models demonstrate that BRICS stock markets are more responsive to negative information compared to favourable news, which implies the necessity to be cautious while investing in the BRICS stock market. The findings are in conformity with a study conducted by Guptha and Rao (2017). The persistence of volatility and the significant effect of negative information reflect market inefficiencies and weak institutional frameworks. The examination of LL, AIC, and SIC parameters confirms that the TGARCH model is the most suitable model for Russia, China, and Brazil. In contrast, the EGARCH model is identified as optimal for South Africa and India. However, from an overall performance perspective, the EGARCH model outperformed all other models, as evidenced by its higher LL coefficient and lower AIC and SIC coefficients. These findings are in alignment with the studies conducted by Kisinbay (2010), Lin (2018), Emenogu et al. (2020), and Gupta (2024).
The EGARCH model is used to scrutinise return and volatility transmission. India–Russia and India–Brazil stock markets have a bi-directional return spillover effect, stating that these equity markets positively influence each other. This study found no instances of unidirectional return spillover. Investments from Brazil to India have the highest return spillover, while those from India to Russia have the lowest. This analysis confirms that all BRICS stock markets except South Africa suffer from internal market volatility. The existence of both short-term and long-term volatility spillover indicates that the stock markets of BRICS countries are interconnected and do not offer portfolio diversification opportunities (Joo et al. 2023). The asymmetric volatility (γ) spillover suggests that non-complimentary news has a stronger influence than complementary news. The bidirectional volatility spillover between Russia–Brazil, South Africa–Brazil, India–China, and India–Brazil confirmed the interconnectedness of BRICS stock markets, implying that portfolio diversification within these markets is unlikely to reduce risk. To manage risk more effectively, investors should focus on non-correlated assets in developed markets or outside regions. A unidirectional volatility spillover is observed from Russia to India, South Africa to India, China to Russia, South Africa to China, and Brazil to China, indicating that shocks occurring in one market affect other markets, without reciprocation.
An understanding of volatility can help investors diversify their portfolios to maximise returns and minimise risk. The findings of news impact curves and an asymmetric model indicate that unpleasant news has a greater impact than positive news. The short-term and long-term volatility spillover suggests that the BRICS stock markets are interconnected. These findings have two significant implications. First, a financial crisis in one BRICS market would affect the other BRICS stock markets and interconnected economies. Second, global capital flow will be diverted away from BRICS economies during the periods of market crises, which could have implications for capital formation, exchange rate, and economic growth. These findings can be used to identify financial crises in BRICS stock markets and offer guidance to investors on diversifying their portfolios in non-correlated markets to mitigate risk and enhance rewards. The risk–return association and the volatility transmission allow for the creation of innovative financial products and regulations that enable investors to gain from unexpected market fluctuations (Dedi et al. 2016). For policymakers, the development of advanced risk management tools and robust derivative markets is essential for managing risk. Furthermore, enhancing economic cooperation, policy coordination, and institutional and market structures among BRICS nations could reduce market volatility and bolster economic resilience against global shocks.

6. Limitations and Scope for Future Research

This research study utilises linear and non-linear econometric methods and offers novel insights into the risk–return connection and volatility transmission among BRICS countries, with some constraints. The main limitations of this study are as follows: the dataset is limited to daily closing prices of stock indices from 1 April 2008 to 31 March 2023; this study is quantitative in nature; it specifically focuses on the five BRICS countries; only univariate techniques are used for analysis; and the econometrics models, namely, ARCH, GARCH, GARCH-M, EGARCH, and TGARCH are selected from a wide range of models. In order to overcome these constraints, future studies could expand their focus to encompass both existing and prospective BRICS members by employing the most sophisticated univariate models like PGARCH, FGARCH, IGARCH, GJR-GARCH, etc., and multivariate models such as CCC-GARCH, DCC-GARCH, BEKK-GARCH, etc. An analysis with a wider sample, like G-20, OECD countries, European Economic Union, ASEAN, etc., could be undertaken to examine volatility behaviour and its impact on global stock markets and the economy as a whole. A study could also be undertaken to examine the volatility in BRICS countries with other trading blocs in the backdrop of economic policies, geopolitical events, and trade agreements. Acknowledging the vulnerability of shocks in BRICS markets, the government and regulators should implement microeconomic stabilisation measures, improve institutional governance, and ensure a resilient market structure capable of withstanding market shocks to manage the risk of capital flight.

Author Contributions

R.K.S. identified the idea of pursuing this study on “Mapping Risk-Return Linkages and Volatility Spillover of BRICS Stock Markets through the Lens of Linear and Non-Linear Models”. Y.S. and S.K. collected the data and performed the analysis. S.K., Y.S. and A.K. collaborated to create the tables and the initial draft of the paper. W.S.A. also made significant contributions in the preparation of this research paper. Each of the co-authors made contributions to the conversation at different stages throughout the manuscript’s creation. All authors have read and agreed to the published version of the manuscript.

Funding

The authors received no support for the research, authorship, and publication of this article.

Data Availability Statement

The data is publicly accessible and freely downloaded from investing.com database.

Conflicts of Interest

The authors certified that they have no affiliations with or involvement in any organization or entity with any financial interest or non-financial interest in the subject matter or material discussed in this manuscript. However, Yashvardhan Singh was employed by the Axtria Pvt. India Ltd., Pune 411057, Maharastra, India.

References

  1. Ahmed, Rahil Irfan, Guohao Zhao, and Umme Habiba. 2021. Dynamics of Return Linkages and Asymmetric Volatility Spillovers among Asian Emerging Stock Markets. The Chinese Economy 55: 156–67. [Google Scholar] [CrossRef]
  2. Ahmed, Rizwan Raheem, Jolita Vveinhardt, Dalia Štreimikienė, Saghir P. Ghauri, and Muhammad Ashraf. 2018. Stock Returns, Volatility and Mean Reversion in Emerging and Developed Financial Markets. Technological and Economic Development of Economy 24: 1149–77. [Google Scholar] [CrossRef]
  3. Akhtar, Shahan, and Naimagt U. Khan. 2016. Modelling Volatility on the Krachi Stock Exchange, Pakistan. Journal of ASIA Business Studies 10: 253–75. [Google Scholar] [CrossRef]
  4. Alfreedi, A. Ajab. 2019. Shocks and Volatility Spillover between Stock Markets of Developed Countries and GCC Stock Markets. Journal of Taibah University for Science 13: 112–20. [Google Scholar] [CrossRef]
  5. Al-Rjoub, Samer AM, and Hussam Azzam. 2012. Financial Crises, Stock Returns and Volatility in an Emerging Stock Market: The Case of Jordan. Journal of Economic Studies 39: 178–211. [Google Scholar] [CrossRef]
  6. Arsalan, Tazeen, Bilal A. Chishty, Shagufta Ghouri, and Nayeem H. Ansari. 2022. Comparison of Volatility and Mean Reversion Among Developed, Developing, and Emerging Countries. Journal of Economic and Administrative Sciences. [Google Scholar] [CrossRef]
  7. Bagchi, Bagchi. 2017. Volatility Spillover between Crude Oil Price and Stock Markets: Evidence from BRIC Countries. International Journal of Emerging Markets 12: 352–65. [Google Scholar] [CrossRef]
  8. Bentes, R. Sonia. 2021. How COVID-19 has Affected Stock Market Persistence? Evidence from the G7’s. Physica A 581: 126210. [Google Scholar] [CrossRef]
  9. Bhar, Ramaprasad, and Biljana Nikolova. 2009. Return, Volatility, and Dynamic Correlation in the BRIC Equity Markets: An Analysis using a Bivariate EGARCH Framework. Global Finance Journal 19: 203–18. [Google Scholar] [CrossRef]
  10. Black, Fischer. 1976. Studies of Stock Price Volatility Changes. In Proceedings of the 1976 Meeting of the Business and Economic Statistics Section. Washington, DC: American Statistical Association, pp. 177–81. [Google Scholar]
  11. Bollerslev, Tim. 1986. Generalised Autoregressive Conditional Heteroscedasticy. Journal of Econometrics 31: 307–327. [Google Scholar] [CrossRef]
  12. Bollerslev, Tim, Robert F. Engle, and Jeffrey M. Wooldridge. 1988. A capital asset pricing model with time-varying covariances. Journal of Political Economy 96: 116–31. [Google Scholar] [CrossRef]
  13. Chaudhary, Rashmi, Priti Bakshi, and Hemendra Gupta. 2020. Volatility in International Stock Markets: An Empirical Study During COVID-19. Journal of Risk and Financial Management 13: 208. [Google Scholar] [CrossRef]
  14. Corbet, Sorbet, Yang Hou, Yang Hu, and Les Oxley. 2022. Financial contagion among COVID-19 concept-related stocks in China. Applied Economics 54: 2439–52. [Google Scholar] [CrossRef]
  15. Dania, Akash, and D. K. Malhotra. 2013. Returns dynamics and global integration of BRICS stock markets. International Journal of Business and Emerging Markets 5: 217–33. [Google Scholar] [CrossRef]
  16. Dedi, Lidija, Burhan F. Yavas, and David McMillan. 2016. Return and Volatility Spillovers in Equity Markets: An Investigation Using Various GARCH Methodologies. Cogent Economics & Finance 4: 1–18. [Google Scholar] [CrossRef]
  17. De Villiers, Nadia, and Pierre J. Venter. 2022. Volatility Modelling of volatility indices: The case of Emerging Markets. In Springer Proceedings in Business and Economics. Cham: Springer International Publishing, pp. 31–46. [Google Scholar] [CrossRef]
  18. Dutta, Probal, Md Hasib Noor, and Anupam Dutta. 2017. Impact of Oil Volatility Shocks on Global Emerging Market Stock Returns. International Journal of Managerial Finance 13: 578–91. [Google Scholar] [CrossRef]
  19. Emenogu, Ngozi G., Monday O. Adenomon, and Nwaze O. Nweze. 2020. On the Volatility of Daily Returns of Toatl Nigeria Plc: Evidence from GARCH Models, Value at Risk and Backtesting. Financial Innovation 6: 1–25. [Google Scholar] [CrossRef]
  20. Engle, Robert F. 1982. Autoregressive Conditional Heteroscedasticity with Estimates of the Variance of United Kingdom Inflation. Econometrica 50: 987–1007. [Google Scholar] [CrossRef]
  21. Engle, Robert F., and Victor K. Ng. 1993. Measuring and testing the impact of news on volatility. The Journal of Finance 48: 1749–78. [Google Scholar] [CrossRef]
  22. Fama, Eugene F. 1965. The Behavior of Stock-Market Prices. The Journal of Business 38: 34–105. [Google Scholar] [CrossRef]
  23. Ghozzi, Bechir Ben, and Hasna Chaibi. 2021. Political Risks and Financial Markets: Emerging vs Developed Economies. EuroMed Journal of Business 17: 677–97. [Google Scholar] [CrossRef]
  24. Glosten, Lawrence, Ravi Jagannathan, and David E. Runkle. 1993. On the Relation Between the Expected Value and The Volatility of the Nominal Excess Return on Stocks. Journal of Finance 48: 1779–801. [Google Scholar] [CrossRef]
  25. Gupta, Himani. 2024. Asymmetric Volatility in Stock Market: Evidence from Selected Export-based Countries. The Indian Economic Journal, 1–20. [Google Scholar] [CrossRef]
  26. Guptha, Sivakiran, and R. Prabhakar Rao. 2017. The Volatility Behaviour of Emerging BRICS Stock Market. International Journal of Management and Development Studies 6: 95–111. [Google Scholar]
  27. Hameed, Abid, Hammad Ashraf, and Rizwana Siddiqui. 2006. Stock Market Volatility and Weak-form Efficiency: Evidence from an Emerging Market [with Comments]. The Pakistan Development Review 45: 1029–40. [Google Scholar] [CrossRef]
  28. Jayasuriya, Shamila, William Shambora, and Rosemary Rossiter. 2009. Asymmetric volatility in emerging and mature markets. Journal of Emerging Market Finance 8: 25–43. [Google Scholar] [CrossRef]
  29. Jebran, Khalil, Shihua Chen, Irfan Ullah, and Sultan S. Mirza. 2017. Does volatility spillover among stock markets varies from normal to turbulent periods? Evidence from emerging markets of Asia. The Journal of Finance and Data Science 3: 20–23. [Google Scholar] [CrossRef]
  30. John, Abonongo, Francis Tabi Oduro, and Ackora-Prah J. 2016. Modelling Volatility and the Risk-Return Relationship of Some Stocks on the Ghana Stock Exchange. American Journal of Economics 6: 281–99. [Google Scholar] [CrossRef]
  31. Joo, B. Ahmad, Younis A. Ghulam, and Simtiha Ishaq M. Ghulam. 2023. Symmetric and asymmetric Volatility Spillover among BRICS Countries’ Stock Markets. Decision 50: 473–88. [Google Scholar] [CrossRef]
  32. Kao, Wei-Shun, Tzu-Chuan Kao, Chang-Cheng Changchien, Li-Hsun Wang, and Kuei-Tzu Yeh. 2018. Contagion in International Stock Markets After the Subprime Mortgage Crisis. The Chinese Economy 51: 130–53. [Google Scholar] [CrossRef]
  33. Ke, Jian, Liming Wang, and Louis Murray. 2010. An Empirical Analysis of the Volatility Spillover Effect Between Primary Stock Markets Abroad and China. Journal of Chinese Economic and Business Studies 8: 315–33. [Google Scholar] [CrossRef]
  34. Khan, Imran. 2023. An Analysis of Stock Markets Integration and Dynamics of Volatility Spillover in Emerging Nations. Journal of Economic and Administrative Sciences. [Google Scholar] [CrossRef]
  35. Kishore, Nawal, and Raman P. Singh. 2014. Stock Return Volatility Effect: Study of BRICS. Transnational Corporation Review 6: 406–18. [Google Scholar] [CrossRef]
  36. Kisinbay, Turgut. 2010. Predictive ability of Asymmetric Volatility Models at Medium Term Horizons. Applied Economics 42: 3813–29. [Google Scholar] [CrossRef]
  37. Kumar, Dilip, and S. Maheswaran. 2012. Modelling Asymmetry and Persistence under the Impact of Sudden Changes in the Volatility of Indian Stock Markets. IIMB Management Review 24: 123–36. [Google Scholar] [CrossRef]
  38. Kundu, Srikanta, and Nityananda Sarkar. 2016. Return and Volatility Interdependences in up and Down Markets Across Developed and Emerging Countries. Research in International Business and Finance 36: 297–311. [Google Scholar] [CrossRef]
  39. Li, Yanan, and David E. Giles. 2014. Modelling Volatility Spillover Effects Between Developed Stock Markets and Asian Emerging Stock Markets. International Journal of Finance and Economics 20: 155–77. [Google Scholar] [CrossRef]
  40. Lin, Zhe. 2018. Modelling and Forecasting The Stock Market Volatility of SSE Composite Index using GARCH Models. Future Generation Computer Systems 79: 960–72. [Google Scholar] [CrossRef]
  41. Lohani, K. Kumar. 2020. Trade Flow of India with BRICS Countries: A Gravity Model Approach. Global Business Review 25: 22–39. [Google Scholar] [CrossRef]
  42. Mandelbrot, Benoit. 1963. New Methods in Statistical Economics. Journal of Political Economy 71: 421–40. [Google Scholar] [CrossRef]
  43. Markowitz, Harry. 1952. Portfolio Selection. The Journal of Finance 7: 77–91. [Google Scholar] [CrossRef]
  44. Maryam, Javeria, and Ashok Mittal. 2019. An Empirical Analysis of India’s Trade in Goods with BRICS. International Review of Economics 66: 399–421. [Google Scholar] [CrossRef]
  45. Mensi, Walid, Ramzi Nekhili, Xuan V. Vo, and Sang H. Kang. 2021. Good and bad High-frequency Volatility Spillovers among Developed and Emerging Stock Markets. International Journal of Emerging Markets 18: 2107–32. [Google Scholar] [CrossRef]
  46. Naik, Maithili S., and Y. V. Reddy. 2021. India VIX and Forecasting Ability of Symmetric and Asymmetric GARCH Models. Asian Economic and Financial Review 11: 252–62. [Google Scholar] [CrossRef]
  47. Nasr, A. Ben, Juncal Cunado, Riza Demirer, and Rangan Gupta. 2018. Country Risk Rating and Stock Market Returns in Brazil, Russia, India, and China (BRICS) Countries: A Nonlinear Dynamic Approach. Risks 6: 94. [Google Scholar] [CrossRef]
  48. Nelson, Daniel B. 1991. Conditional Heteroskedasticity in Asset Returns: A New Approach. Econometrica 59: 347–70. [Google Scholar] [CrossRef]
  49. Nyamongo, Morekwa Esman, and Roseline Misati. 2010. Modelling the Time-varying Volatility of Equities in Kenya. African Journal of Economic and Management Studies 1: 183–96. [Google Scholar] [CrossRef]
  50. Panda, Pradiptarathi, and Malabika Deo. 2014. Asymmetric cross-market volatility spillovers: Evidence from Indian equity and foreign exchange markets. Decision 41: 261–70. [Google Scholar] [CrossRef]
  51. Rao, Ananth. 2008. Analysis of Volatility Persistence in Middle East Emerging Equity Markets. Studies in Economics and Finance 25: 93–111. [Google Scholar] [CrossRef]
  52. Refai, Hisham Al, Mohamed A. Eissa, and Rami Zeitun. 2017. Asymmetric Volatility and Conditional Expected Returns. International Journal of Emerging Markets 12: 335–51. [Google Scholar] [CrossRef]
  53. Sabri, N. Rashid. 2004. Stock Return Volatility and Market Crisis in Emerging Economies. Review of Accounting and Finance/Review of Accounting & Finance 3: 59–83. [Google Scholar] [CrossRef]
  54. Sahiner, Mehmet. 2022. Forecasting Volatility in Asian Financial Markets: Evidence from Recursive and Rolling Window Methods. SN Business & Economics 2: 1–74. [Google Scholar] [CrossRef]
  55. Salameh, H. Mohammad, and Bashar Alzubi. 2018. An Investigation of Stock Market Volatility: Evidence from Dubai Financial Market. Journal of Economic and Administrative Sciences 34: 21–35. [Google Scholar] [CrossRef]
  56. Salisu, Afees A., Oluwatomisin J. Oyewole, and Ismail O. Fasanya. 2018. Modelling Return and Volatility Spillovers in Global Foreign Exchange Markets. Journal of Information and Optimization Sciences 39: 1417–48. [Google Scholar] [CrossRef]
  57. Setiawan, Budi, Marwa B. Abdallah, Maria Fekete-Farkas, Robert J. Nathan, and Zoltan Zeman. 2021. GARCH (1,1) Models ans Analysis of Stock Market Turmoil during COVID-19 Outbreak in Emerging and Developed Market. Journal of Risk and Financial Management 14: 576. [Google Scholar] [CrossRef]
  58. Sharma, Sudhi, Vaibhav Aggarwal, and Miklesh P. Yadav. 2021. Comparison of Linear and Non-linear GARCH Models for Forecasting Volatility of Select Emerging Countries. Journal of Advances in Management Research 18: 526–47. [Google Scholar] [CrossRef]
  59. Singhania, Monica, and Jugal Anchalia. 2013. Volatility in Asian Stock Markets and Global Financial Crisis. Journal of Advances in Management Research 10: 333–51. [Google Scholar] [CrossRef]
  60. Singhania, Monica, and Shachi Prakash. 2014. Volatility and Cross Correlations of Stock Markets in SAARC Nations. South Asian Journal of Global Business Research 3: 154–69. [Google Scholar] [CrossRef]
  61. Srivastava, Aman. 2008. Volatility of Indian Stock Market: An Emperical Evidence. Asia-Pacific Business Review 4: 53–61. [Google Scholar] [CrossRef]
  62. Uludag, B. Kirkulak, and Muzammil Khurshid. 2019. Volatility Spillover from The Chinese Stock Market to E7 and G7 Stock Markets. Journal of Economic Studies 46: 90–105. [Google Scholar] [CrossRef]
  63. Wang, Yun, Abeyratna Gunasekarage, and David M. Power. 2005. Return and Volatility Spillovers from Developed to Emerging Capital Markets: The Case of South Asia. In Contemporary Studies in Economic and Financial Analysis. Leeds: Emerald Group Publishing Limited, pp. 139–66. [Google Scholar] [CrossRef]
  64. Yıldırım, Hakan, and Festus V. Bekun. 2023. Predicting Volatility of Bitcoin Returns with ARCH, GARCH, and EGARCH Models. Future Business Journal 9: 2–8. [Google Scholar] [CrossRef]
  65. Zhang, Ping, Yezhou Sha, and Yifan Xu. 2021. Stock Market Volatility Spillovers in G7 and BRIC. Emerging Markets Finance and Trade 57: 2107–19. [Google Scholar] [CrossRef]
  66. Zhang, Weiping, Xintian Zhuang, and Dongmei Wu. 2020. Spatial Connectedness of Volatility Spillovers in G20 Stock Markets: Based on Block Models Analysis. Finance Research Letters 34: 101274. [Google Scholar] [CrossRef]
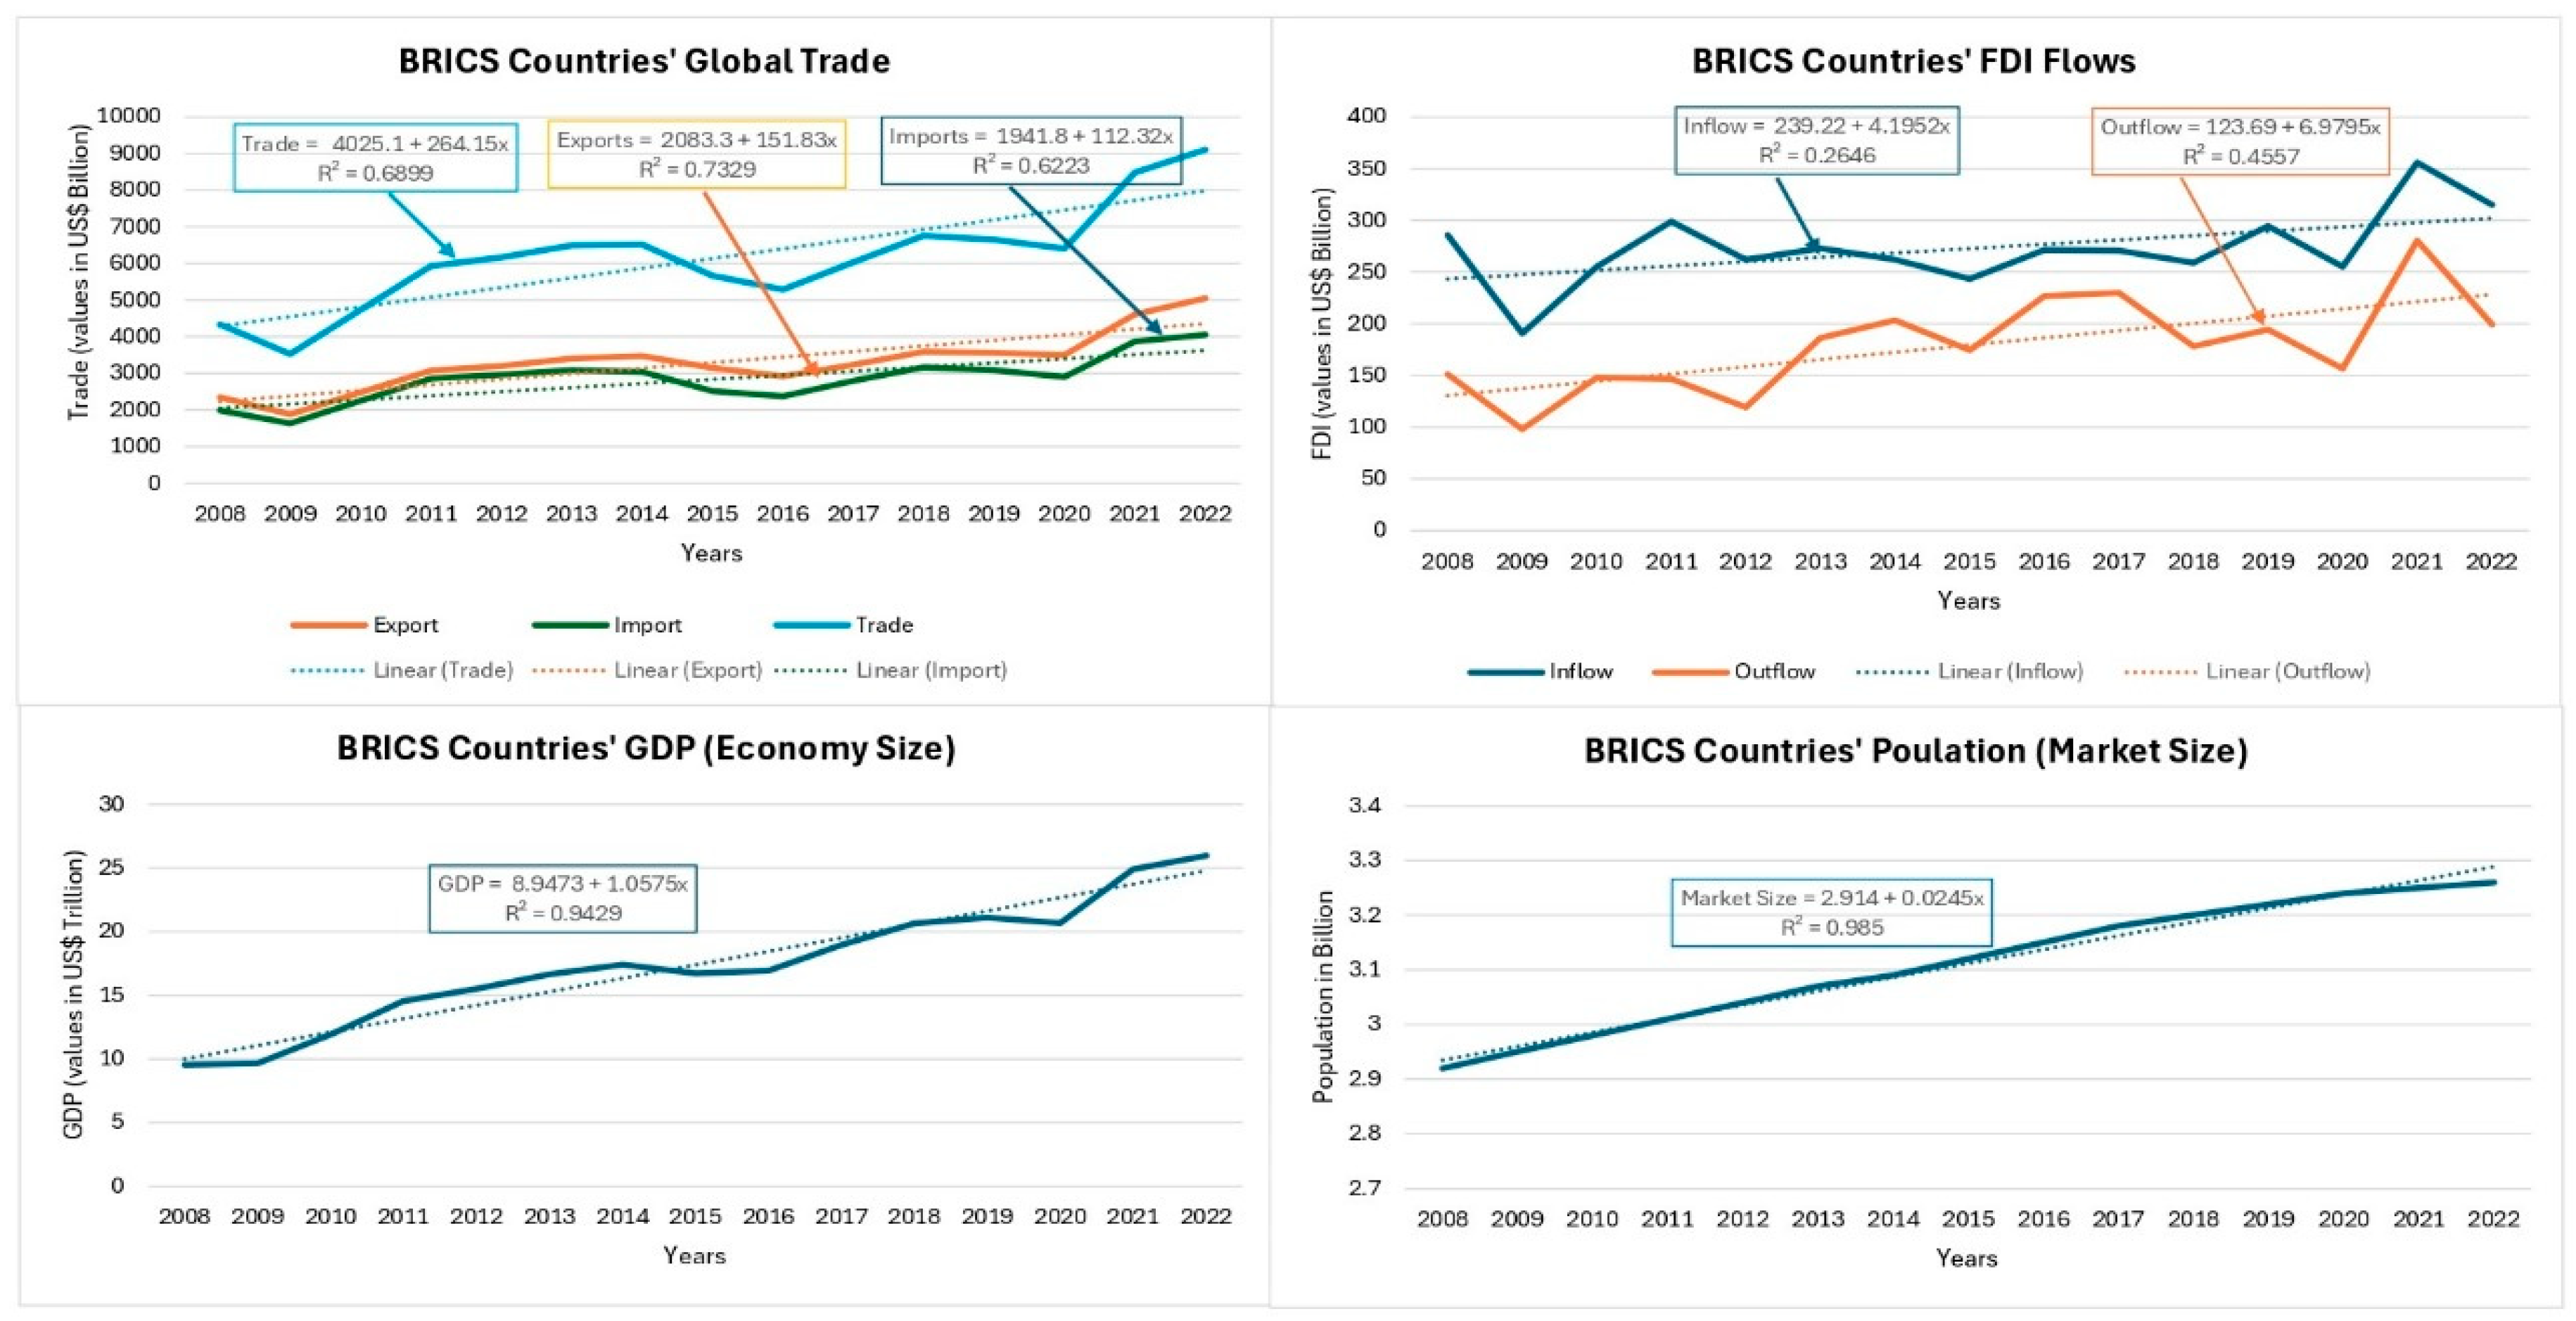
Figure 1. Trend analysis of GDP, population, trade and investment.
Jrfm 17 00437 g001
Figure 2. Time Series Graphs of Closing Price Indices.
Jrfm 17 00437 g002
Figure 3. Volatility Clustering of Stock Returns.
Jrfm 17 00437 g003
Figure 4. News Impact Curves (ARCH Model).
Jrfm 17 00437 g004
Figure 5. News Impact Curves (GARCH Model).
Jrfm 17 00437 g005
Figure 6. New Impact Curves (GARCH Mean Model).
Jrfm 17 00437 g006
Figure 7. New Impact Curves (EGARCH Model).
Jrfm 17 00437 g007
Figure 8. Asymmetric News Impact Curves (TGARCH Model).
Jrfm 17 00437 g008
Table 1. Economic profile of BRICS countries.
YearsTrade (bn)FDI Inflows (Bn)GDP (Tn)Population (Bn)Intra-BRICS Trade (%)Market Capitalization * (tn)
BRICSWorldBRICSWorldBRICSWorldBRICSWorldBRICSWorld
20084337.12
(13.21)
32,836.37285.54
(9.63)
1454.369.55
(14.90)
64.112.92
(42.92)
6.817.237.84 (15.52)47.47
20229111.08
(18.16)
50,189.72314.91
(23.95)
1314.9125.99
(25.78)
100.833.26
(40.91)
7.9810.4017.57 (18.75)93.69
CAGR5.453.080.70−0.727.413.290.791.13---7.616.38
Source: BRICS Trade and Intra-BRICS Trade from UNCOMTrade, World Trade from IMF, FDI, GDP, and Population from UNCTAD Stats, * Market Capitalization data from 2009 from World Bank. Data retrieved on 24 June 2024. CAGR—Compound Annual Growth Rate; figures in parentheses represent the percentage of global share.
Table 2. Results of the augmented Dickey–Fuller test and Phillips–Perron test.
IndexADF TestPP Test
Trend Trend and InterceptTrend Trend and Intercept
t-Statistict-StatisticAdj. t-StatAdj. t-Stat
RTSI−61.714 *61.710 *61.727 *61.722 *
FTSE−63.197 *−63.189 *−63.552 *−63.543 *
Nifty−60.935 *−60.928 *−60.927 *−60.928 *
SSE−60.827 *−60.822 *−60.827 *−60.821 *
BOVESPA−66.386 *−66.388 *−66.390 *−66.392 *
Source: E-views-12, output, author’s calculation. *, represents p-value < 1% respectively.
Table 3. Results of Jarque–Bera test for normality of stock returns.
Index/StatisticsRTSIFTSENiftySSEBOVESPA
X-Squared Values590,129.06516.82045,987.385547.34719,021.53
Prob. Values0.00000.00000.00000.00000.0000
Source: E-views output, compiled by author.
Table 4. Heteroscedasticity estimates for stock indices residuals.
Index/StatisticsRTSIFTSENiftySSEBOVESPA
ARCH-LM test Statistic257.1276126.426269.24618176.6656598.6967
Prob. Chi-Square0.00000.00000.00000.00000.0000
Source: E-views-12, output, author’s calculation.
Table 5. Descriptive statistics of stock returns for BRICS countries.
CountryIndices NMeanMin.Max.Std. Dev. SkewKurt
RussiaRTSI4007−0.00015−0.482920.232040.02295−2.51724362.2389
South AfricaFTSE39970.00023−0.102270.090480.01210−0.2561949.23440
IndiaNifty39590.00039−0.139040.163340.01284−0.26234219.6885
ChinaSSE3890−2.33 × 10⁵−0.088730.090340.01442−0.5748478.73617
BrazilBOVESPA39610.00018−0.159930.136770.01701−0.42632113.7017
Source: E-views-12, output, author’s calculation.
Table 6. Estimates of the ARCH (1) model for BRICS stock market indices.
ParametersRTSIFTSENIFTYSSEBOVESPA
Mean Equation
Constant (µ)
0.000754 *0.000413 *0.000431 *−0.0001700.000217
Variance Equation
Constant (c)
0.000257 *0.000104 *9.84 × 105 *0.000148 *0.000194 *
ARCH Term α 0.327868 *0.324399 *0.433929 *0.327868 *0.291403 *
Source: E-views-12, output, author’s calculation. * represents p-value < 1%.
Table 7. Estimates of the GARCH (1, 1) model for BRICS stock market indices.
ParametersRTSIFTSENIFTYSSEBOVESPA
Mean Equation
Constant (µ)
0.000584 **0.000468 *0.000681 *−2.41 × 1060.000489 **
Variance Equation
Constant (c)
5.56 × 106 *1.99 × 106 *6.32 × 106 *0.000135 *6.32 × 106 *
ARCH Term α 0.105867 *0.081130 *0.086815 *0.150000 *0.081130 *
GARCH term β 0.886934 *0.903966 *0.905193 *0.600000 *0.903966 *
Persistence (α + β)1.035480.9850960.9920080.750.985096
Source: E-views-12, output, author’s calculation. *, and ** represents p-value < 1%, and 5% respectively.
Table 8. Estimates of the GARCH-M model for BRICS stock market indices.
ParametersRTSIFTSENIFTYSSEBOVESPA
Mean Equation
Constant (µ)
2.33 × 1050.0001110.000529 *2.33 × 1050.000168
Risk premium λ0.7837883.960830 ***1.8619600.4237041.735242
Variance Equation
Constant (c)
5.61 × 106 *2.02 × 106 *1.40 × 106 *1.23 × 106 *6.35 × 106 *
ARCH Term α 0.106063 *0.081463 *0.087213 *0.065318 *0.081524 *
GARCH term β0.886588 *0.903375 *0.904745 *0.929615 *0.891748 *
Persistence (α + β)0.9946510.9848380.9919580.9946330.973272
Source: E-views-12, output, author’s calculation. *, and *** represents p-value < 1%, and 10%, respectively.
Table 9. Estimates of the EGARCH model for BRICS stock market indices.
ParametersRTSIFTSENIFTYSSEBOVESPA
Mean Equation
Constant
−0.0001163.16 × 1050.000367 *3.37 × 1050.000118
Variance Equation
Constant
−0.250792 *−0.245044 *−0.257286 *−0.205928 *−0.312047 *
ARCH Term α 0.149606 *0.105574 *0.152779 *0.157227 *0.147723 *
GARCH Term β 0.982870 *0.982192 *0.984814 *0.989852 *0.976677 *
Asymmetry γ−0.092590 *−0.116614 *−0.089785 *−0.017192 *−0.076977 *
Persistence (α + β)1.1324761.0877661.1375931.1470791.1244
Source: E-views-12, output, author’s calculation. *, represents p-value < 1% respectively.
Table 10. Estimates of the TGARCH model for BRICS stock market indices.
ParametersRTSIFTSENIFTYSSEBOVESPA
Mean Equation
Constant
7.57 × 1058.47 × 100.000363 *3.08 × 1050.000179
Variance Equation
Constant
5.50 × 106 *1.84 × 106 *1.75 × 106 *1.28 × 106 *6.50 × 106 *
ARCH Term α0.022247 *−0.0020940.018759 *0.059620 *0.022128 *
GARCH term β0.906231 *0.922443 *0.905076 *0.928545 *0.898608 *
Asymmetry γ0.116489 *0.129361 *0.128014 *0.012381 *0.102213 *
Persistence (α + β + γ/2)0.98672250.98502950.9878120.99435550.9718425
Source: E-views-12, output, author’s calculation. * represents p-value < 1% respectively.
Table 11. Analysis of GARCH models to predict the best-fitted model.
ParticularsARCHGARCHGARCH-MEGARCHTGARCH
Russia
LL9881.05310,567.3410,567.9210,618.3210,619.70
AIC−4.931130−5.273262−5.273049−5.298213−5.298902
SIC−4.924844−5.265405−5.263620−5.288783−5.289473
South Africa
LL12,126.4712,589.1812,591.0612,656.8012,650.70
AIC−6.067301−6.298390−6.298831−6.331734−6.328679
SIC−6.061002−6.290516−6.289382−6.322285−6.319230
India
LL11,980.4712,523.5012,524.1812,580.8412,573.02
AIC−6.051777−6.325669−6.325510−6.354612−6.350188
SIC−6.045427−6.317731−6.315985−6.350759−6.340662
China
LL11,139.8610,756.1711,659.2111,658.3811,660.21
AIC−5.726852−5.529016−5.992909−5.992481−5.993420
SIC−5.720407−5.520960−5.983242−5.982814−5.983753
Brazil
LL10,825.2511,167.8211,168.4511,192.1011,198.07
AIC−5.465276−5.637786−5.637603−5.649547−5.652560
SIC−5.458928−5.629852−5.628082−5.640026−5.643039
Source: E-views-12, output, author’s calculation. LL—log likelihood; AIC—Akaike information criterion; and SIC—Schwardz information criterion.
Table 12. Mean equation results for return spillover of BRICS stock indices from the EGARCH model.
ParametersRussiaSouth AfricaIndiaChinaBrazil
Mean Equation Constant (µ)−0.00010.00020.0004 *1.69 × 1050.0002
Russia-------------0.00020.0004 **0.0002−7.57 × 10⁵
South Africa0.0003------------−0.00028.20 × 1060.0002
India0.0006 **−0.0004-------------2.22 × 1060.0006 *
China5.84 × 105−3.69 × 10⁶−0.0001-----------−0.0002
Brazil−6.83 × 1050.0001050.0004 **−0.0001-------------
Source: E-views-12, output, author’s calculation. * and ** represents p-value < 1% and 5% respectively.
Table 13. Variance equation results for volatility spillover of BRICS stock indices from the EGARCH model.
ParametersRussiaSouth AfricaIndiaChinaBrazil
Variance Equation
Constant (Ѡ)
−0.2562 *−0.2235 −0.2648 *−0.2264 *−0.3437 *
ARCH Term α 0.1349 * 0.0878 0.1438 *0.1530 *0.1443 *
GARCH Term β 0.9793 *0.98230.9823 *0.9858 *0.9716 *
Asymmetry γ−0.2562 *−0.2235 −0.2648 *−0.2264 *−0.3437 *
r2t-1(Russia)---------------1.13 × 10⁶ * −4.90 × 10⁷−3.89 1085.83 × 108
r2t-1(South Africa)1.63 × 10⁷--------------−2.55 × 1075.84 × 108−5.12 × 10⁷ **
r2t-1(India)−7.38 × 10⁷ * −3.20 × 10⁷ ** ---------------−6.90 × 107 * 4.36 × 107 **
r2t-1(China)−1.01 × 10⁶ * −4.73 × 10⁷ * −1.21 × 10⁶ *--------------−9.60 × 10⁷ *
r2t-1(Brazil)8.41× 10⁷ ***−7.63 × 10⁷ ***1.23 × 10⁶ ** −6.50 × 10⁷--------------
Source: E-views-12, output, author’s calculation. *, ** and *** represents p-value < 1%, 5%, and 10%, respectively.
Disclaimer/Publisher’s Note: The statements, opinions and data contained in all publications are solely those of the individual author(s) and contributor(s) and not of MDPI and/or the editor(s). MDPI and/or the editor(s) disclaim responsibility for any injury to people or property resulting from any ideas, methods, instructions or products referred to in the content.