1. Introduction
In recent years, dual active bridge (DAB) dc-dc converter is an attractive application with the advantages of bidirectional power flow, electrical isolation, high power density, and high transfer efficiency. DAB converter is suitable for the applications in the areas of renewable energy power generation and power electronics applications, such as the battery energy storage systems, and electric vehicles, solid-state transformers [
1,
2,
3,
4,
5,
6].
The traditional single-phase-shift (SPS) control method [
2] only uses one degree of freedom of DAB. As a result, SPS control is easy to implement on-chip. However, SPS control only provides high operation efficiency when the voltage conversion ratio
d is close to 1. The current stress and current rms for SPS control will increase a lot and the range of soft-switching will decrease when the voltage conversion ratio
d is far from 1. Therefore, SPS control is not highly efficient under wide voltage variation conditions.
In order to improve the performance of DAB, various optimization methods have been proposed based on the optimal objectives of current stress and current rms. In [
7,
8], the extended-phase-shift (EPS) control and the dual-phase-shift control are proposed to reduce the current stress for DAB. Two degrees of freedom are utilized for optimization in EPS and DPS control. In order to obtain the minimum current stress for DAB, the global optimal method for current stress is derived in [
9] based on the triple-phase-shift (TPS) control method. Similar to the optimized methods for current stress, a numerical method is used to find the optimal control parameters for minimum rms of transformer current in [
10]. In [
11,
12], the analytical expressions of the optimal control parameters are derived for minimum rms of transformer current. As a result, the optimal control method can be implemented by on-line and on-chip calculation. These optimal methods above all take the current as the optimal objectives for DAB.
In addition to current, many other optimal objectives also have been studied in the existing literature. Like the definition of reactive power in sinusoidal ac circuit, the reactive power is defined and minimized for a DAB converter in [
13,
14,
15]. However, it is too complex to obtain the analytical expressions of the control parameters based on the optimal objective of reactive power. Only numerical solutions can be found for the optimal objective of reactive power in [
13,
14,
15]. Furthermore, the physical significance for the reactive power in DAB is not clear enough. Therefore, this kind of optimal method has low practicability.
Minimization of backflow power is another common optimal objective for DAB. The delivery direction of backflow power is contrary to the delivery direction of average power transmission in DAB. Thus, the backflow power indeed reduces the power transmission efficiency in DAB. In [
16,
17], a novel extended-single-phase shift (ESPS) control method and an easy-to-implement control method are proposed, respectively. These two control methods can eliminate (to zero) the backflow power on both sides of the DAB converter. However, these two references do not take all operation modes of DAB into consideration and no global optimal results are derived for the whole load range. As a result, these two control methods are just local optimal results and they can only be implemented under light and medium load range conditions. Reference [
18] derives the dual-phase-shift control method to eliminate the backflow power in the input side of DAB. Reference [
19] proposes a zero circulating current (ZCC) control method to eliminate the backflow power on the output side of DAB. These two control methods only use two degrees of freedom for optimization of backflow power, leading to local optimal results rather than global optimal results. Moreover, these two control methods eliminate the backflow power just on one side of DAB and the backflow power on both sides cannot be optimized at the same time. In [
20], the sum of backflow power on both sides is minimized, so the backflow power on both sides can be reduced at the same time, however, the optimized control parameters are derived just when the voltage conversion ratio is equal to 1. Therefore, no global and complete control methods for backflow power are derived in existing research. Furthermore, the optimization performance of various optimized objectives of backflow power mentioned above (i.e., the backflow power on the primary side, the secondary side and on both sides) have not been compared to each other.
In [
21,
22], the circulating current is defined as the transformer current during the period of time when no active power is transmitted on the output side of DAB. In [
22], the circulating current is the transformer current during the period of time when backflow power and zero power (caused by
vcd = 0) are transmitted on the output side of DAB. The optimal objective in [
21,
22] is to minimize the rms value of circulating current. Only the circulating current on the output side is considered in [
21,
22]. In [
23], the concept of non-active power which is proposed in [
24] is utilized to define a new optimization objective, i.e., non-active power loss. In [
24], the non-active current is defined just for the SPS control method to be the result of backflow power transmission. However, the non-active current caused by zero power transmission is not considered in [
23,
24]. Similar to the optimized methods in [
7,
8,
9,
10,
11,
12], these optimized control methods in [
21,
22,
23,
24] are essentially still for current. In fact, the backflow power is just a portion of the non-active power transmission in DAB and the limitations of the backflow power control method are not presented. The complete non-active power transmission in DAB is supposed to be defined for the performance optimization.
Firstly, this paper proposes optimized control methods for global minimum backflow power based on triple-phase-shift (TPS) control strategy. Three global optimized methods are derived to minimize the backflow power on the primary side, on the secondary side and on both sides, respectively. Compared to the existing backflow power optimization methods in the published literature, the backflow power is minimized by the three proposed control methods. A comparative analysis is carried out to evaluate the performance differences among these three control methods and SPS control. The comparative analysis results show however that the power transmission efficiency may not be improved in some cases by the backflow power optimization methods. Therefore, the concept of maximum non-active power transmission time is proposed in this paper and it unifies the zero power transmission and the backflow power transmission together. Then, a new optimal objective is defined as the maximization of the effective power transmission time ratio in the DAB converter. The derived optimized control method achieves both the maximum effective power transmission time and minimum current stress of DAB at the same time. A comparative analysis is performed to show that the minimum non-active power optimization method has the best optimization performance and also explain the limitations of the minimum backflow power optimization method. Finally, a prototype is built to verify the effectiveness of the theoretical analysis and the proposed control methods by experimental results.
3. Global Minimum Backflow Power Control
3.1. Backflow Power Under SPS Control
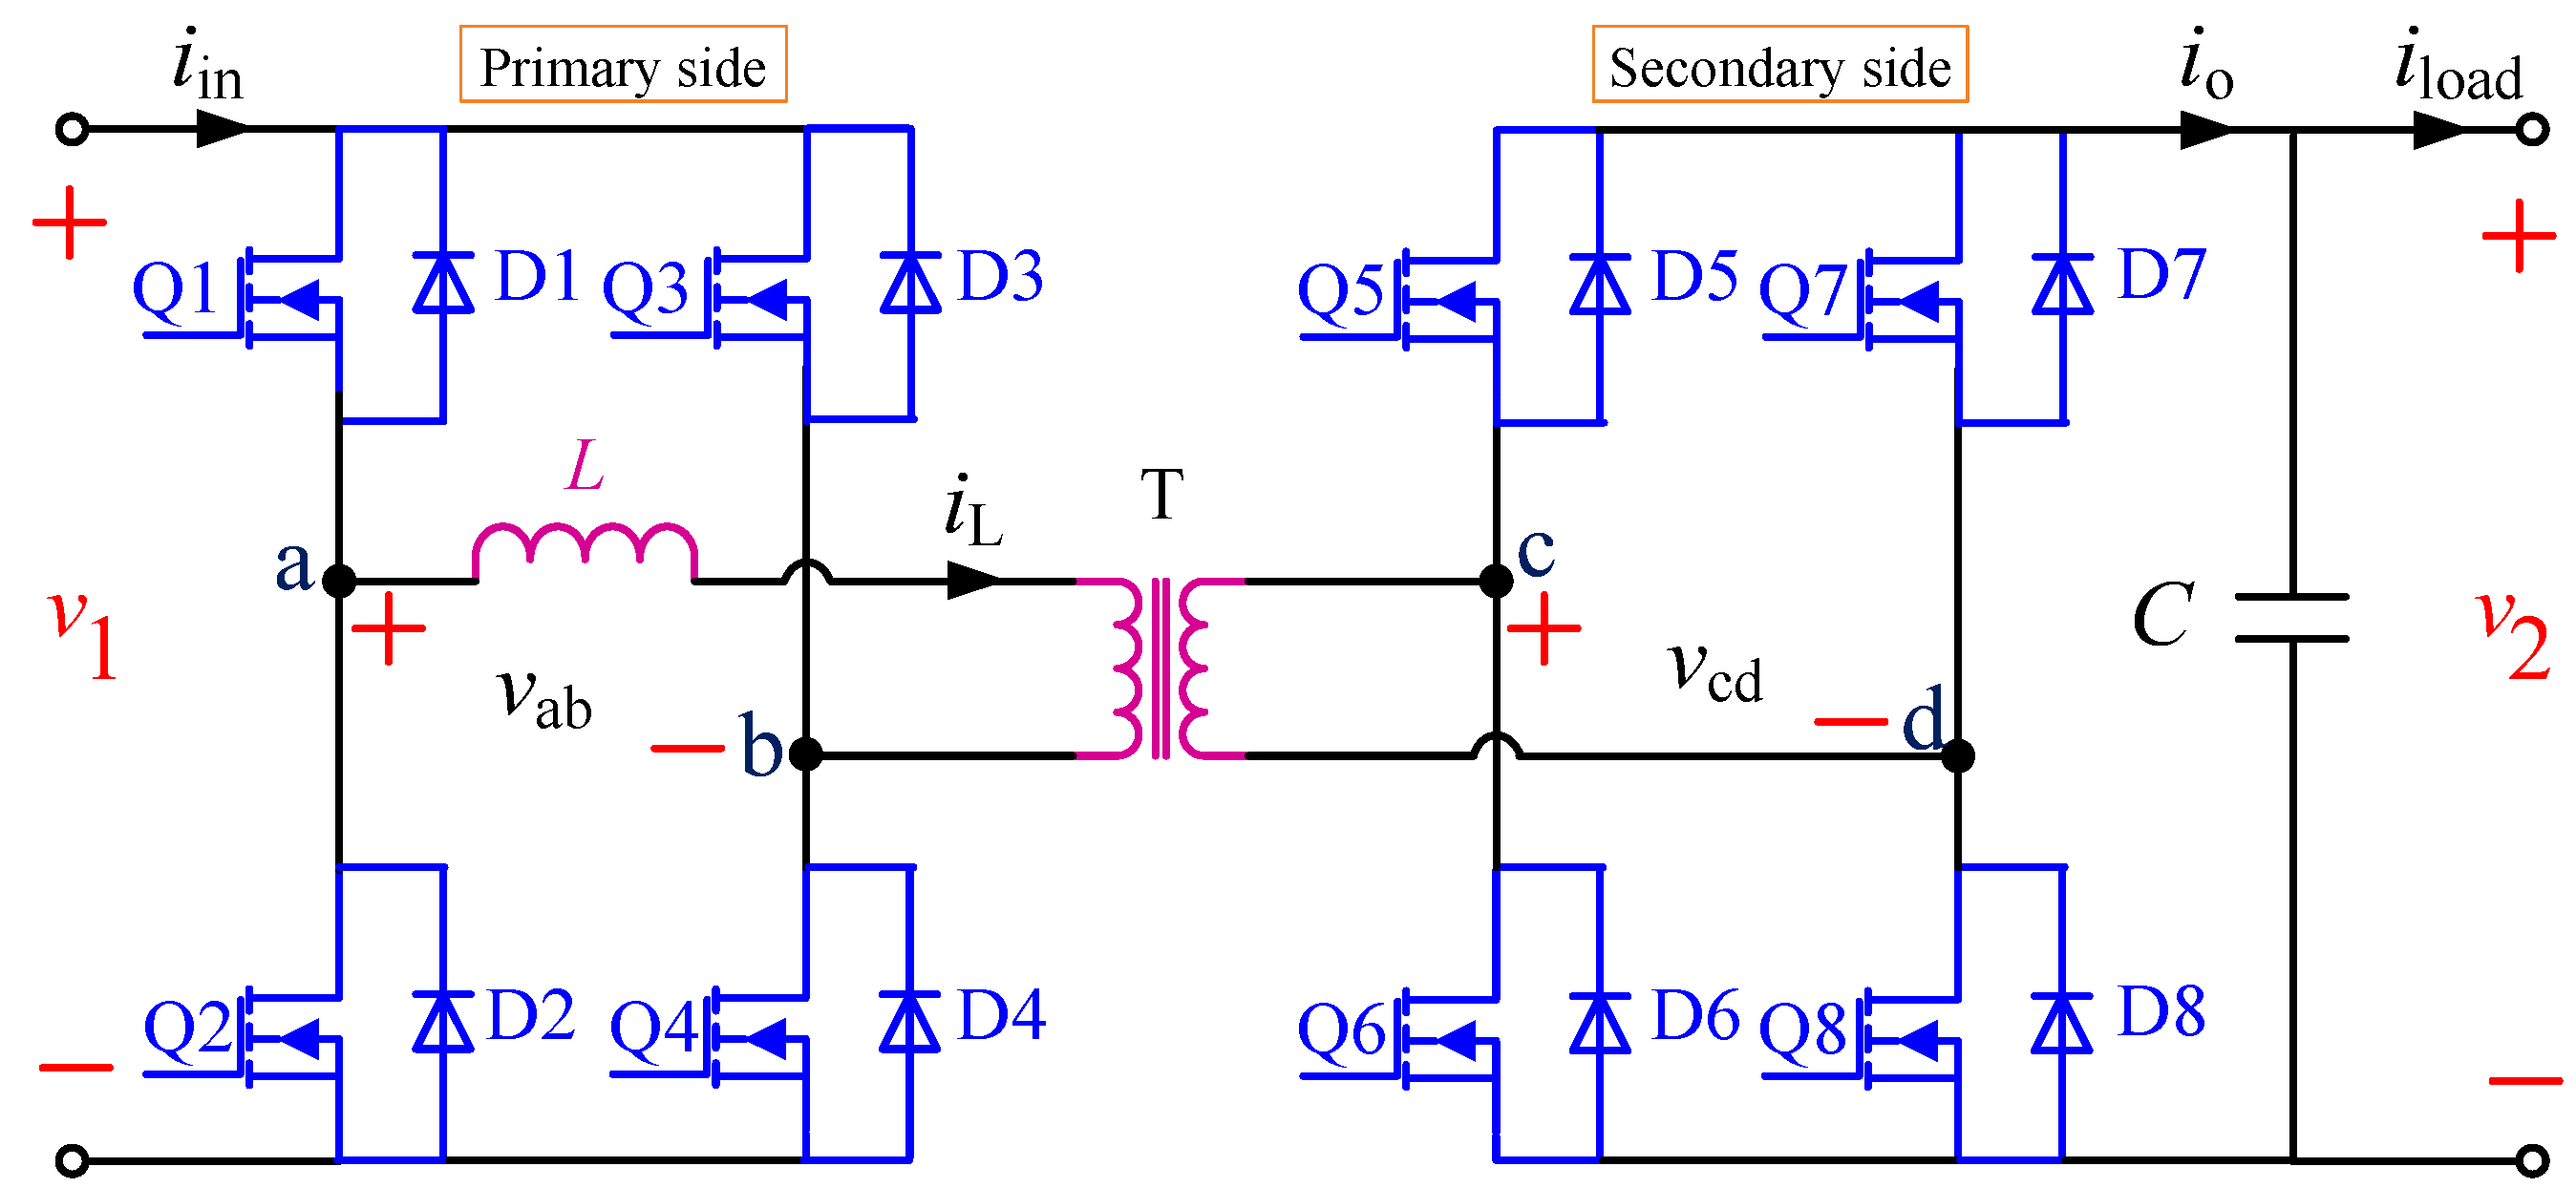
Figure 3 shows the operation waveforms of DAB under a single-phase-shift (SPS) control strategy. The phase shift time between the voltage
vab and
vcd is defined as
φ∙
Ths, where
Ths is a half switching period. The phase shift ratio between
vab and
vcd is
φ.
iin and
io are the input current on the primary side and the output current on the secondary side, respectively.
For simplification, only the positive power flow from the primary side to the secondary side is analyzed in this paper. As can be seen in
Figure 3, the transmission power of DAB flows back to the primary side (i.e., power supply) from the DAB during
t0 to
t01′ and
t2 to
t23′ while the transmission power of the DAB flows back to the DAB from the load side during
t01′ to
t1 and
t23′ to
t3. The transmission power during these periods is defined in this paper as the backflow power. Backflow power is one type of the non-active power in DAB and it will reduce the power transmission efficiency in DAB. In
Figure 3, the backflow power on the primary side and secondary side are defined by Equations (1) and (2), respectively.
where both
Qp and
Qs are positive values.
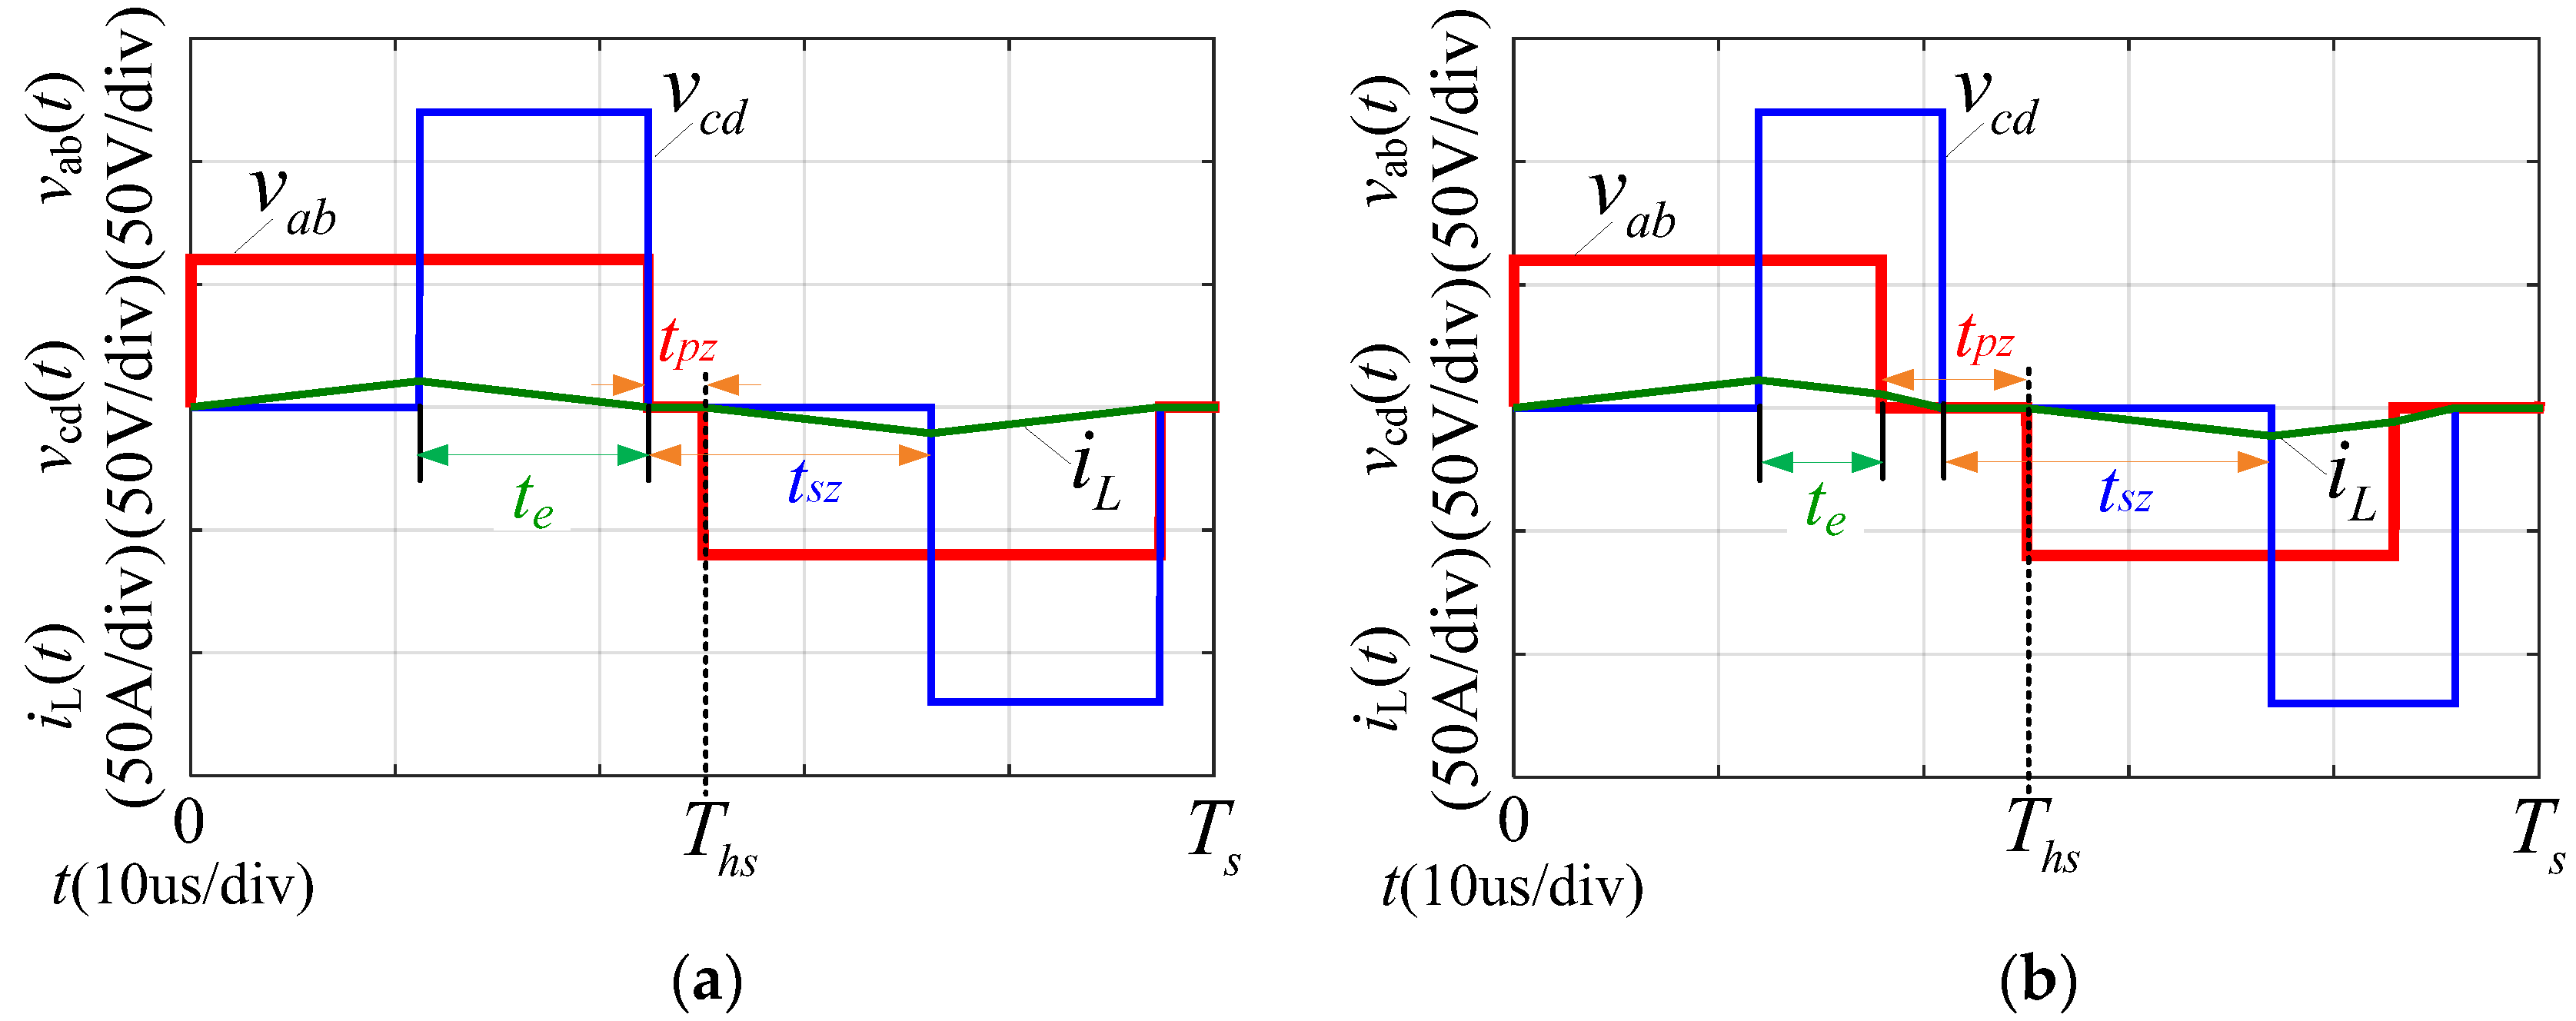
3.2. Minimum Backflow Power Conrtrol (MBPC) at Low Power Level
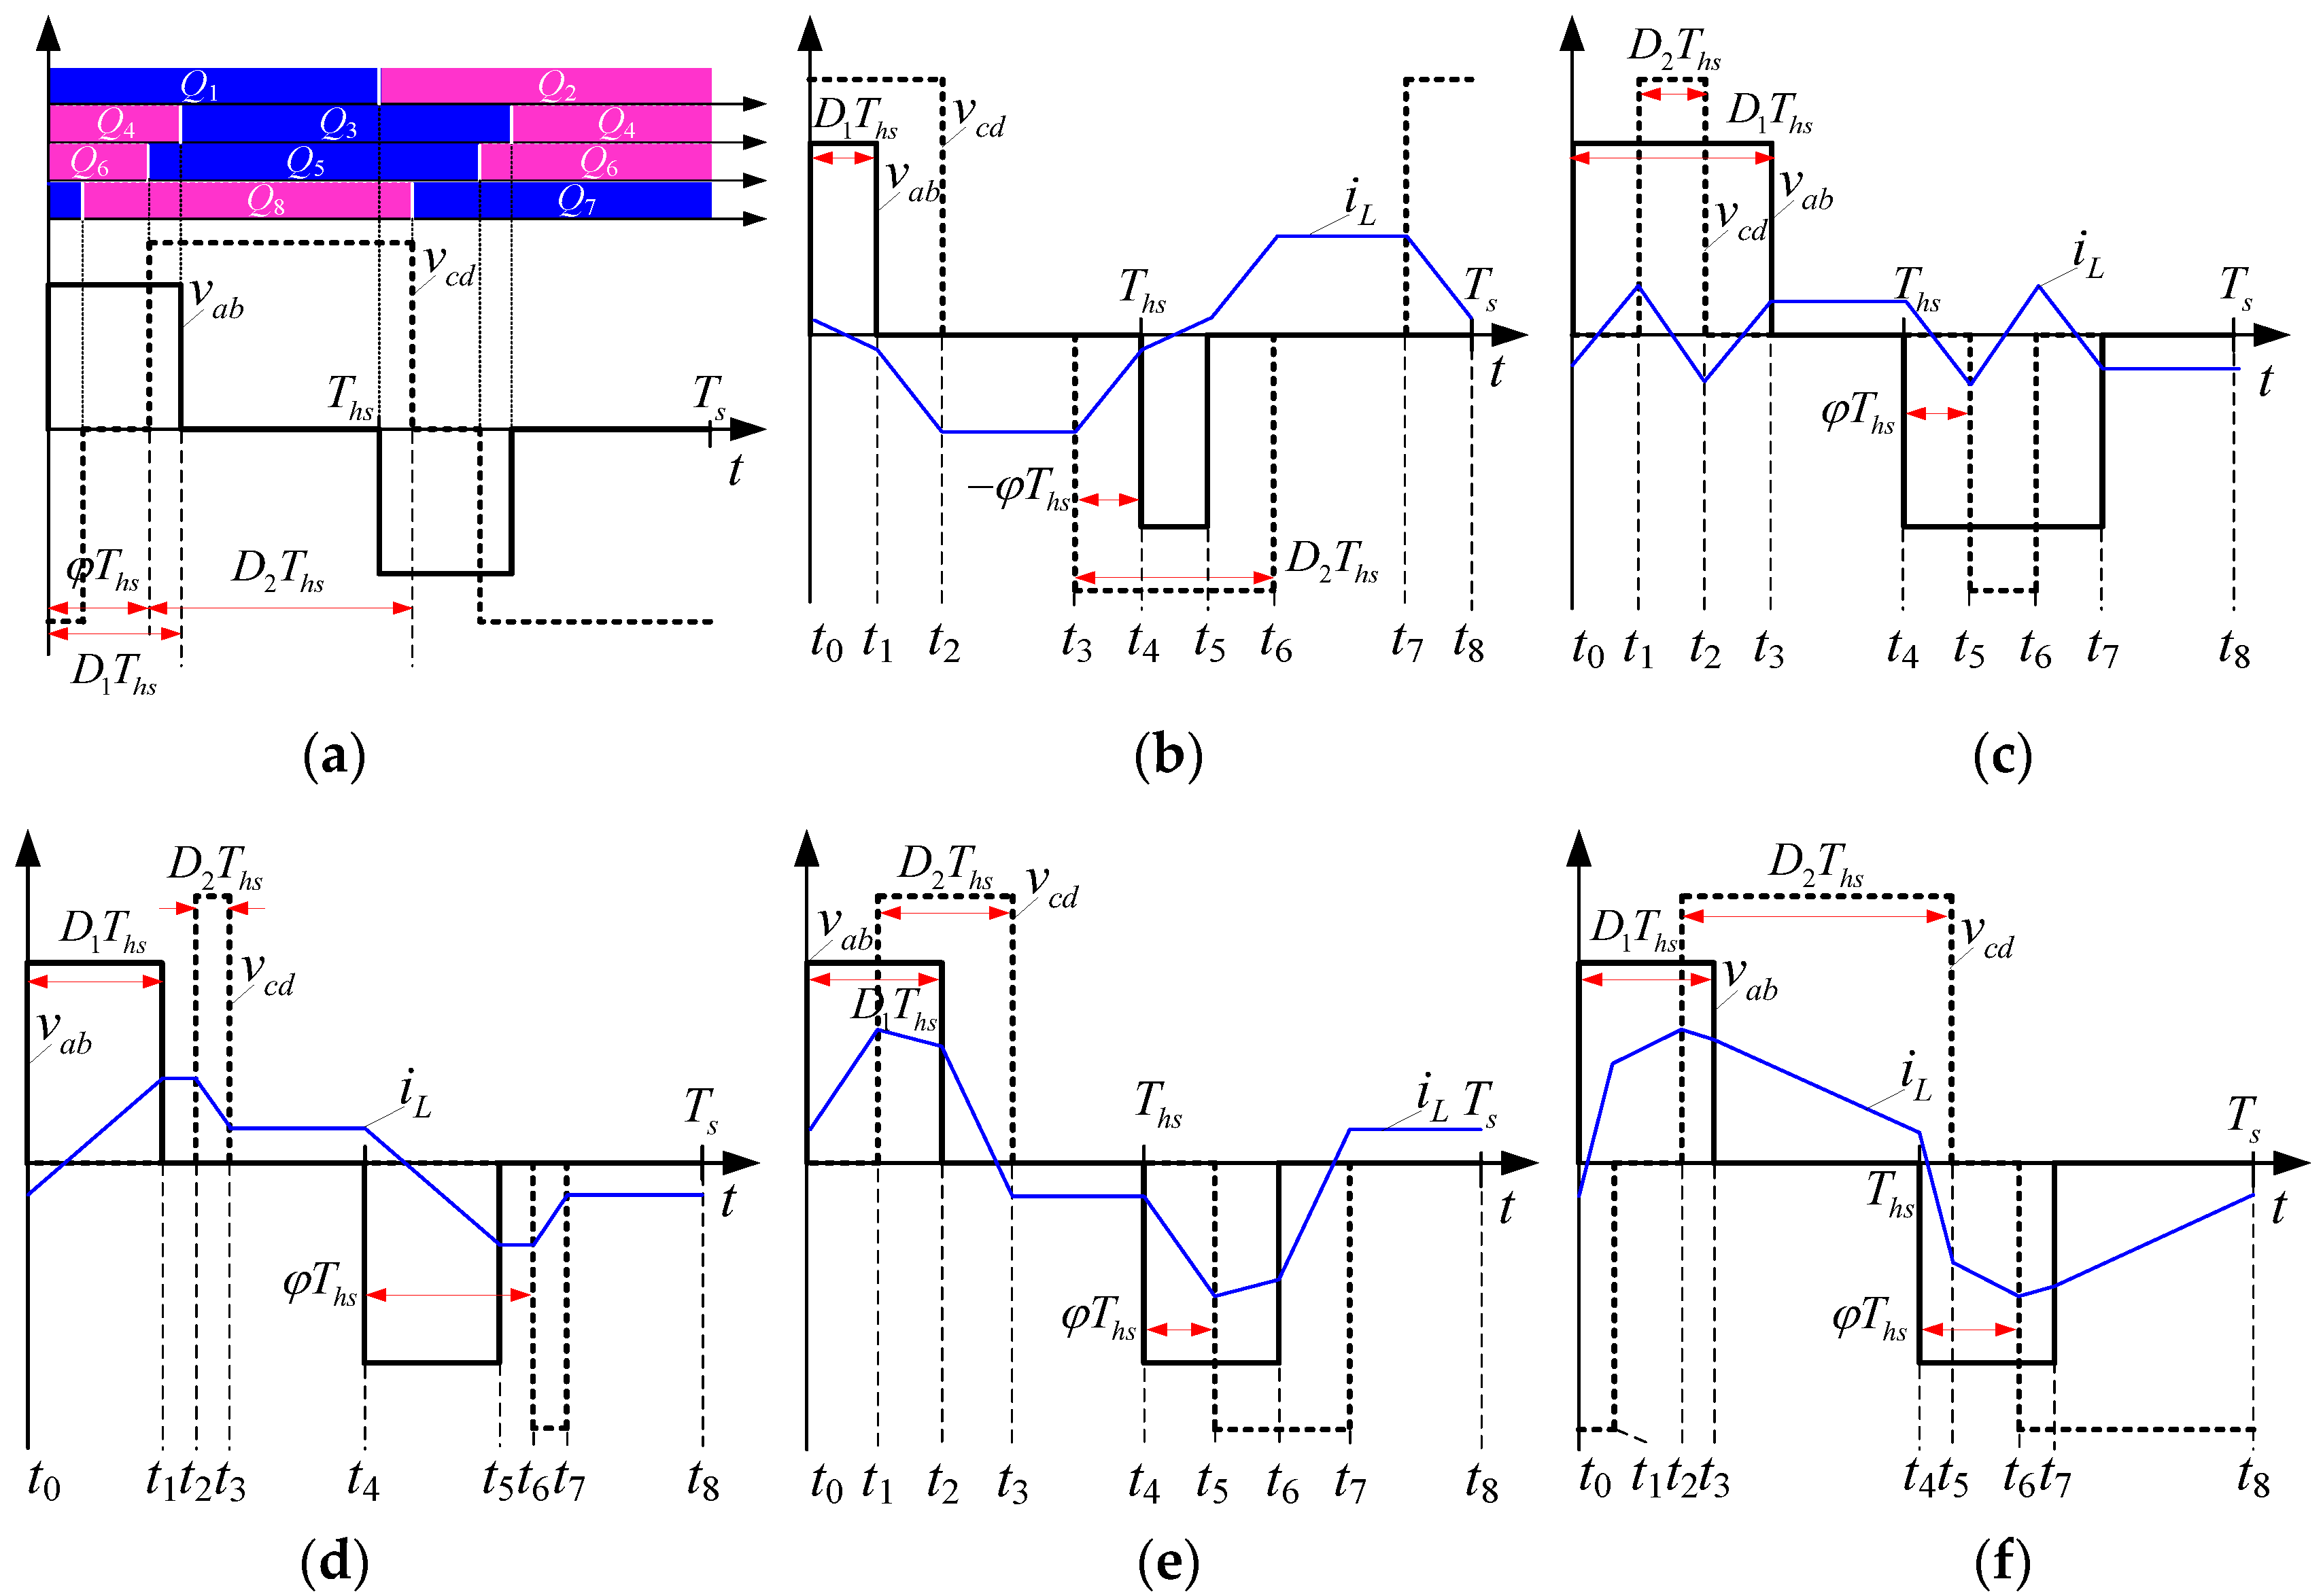
Mode 1 to mode 4 in
Figure 2 are the operating modes at low power level. Moreover, both the backflow power on the primary side (i.e.,
Qp) and these secondary side (i.e.,
Qs) can be eliminated simultaneously to zero in mode 1 to mode 4. Therefore, these modes have the minimum backflow power on both sides. Optimized control parameters in each operating mode can be derived as below based on the optimal object
Qp =
Qs = 0.
MBPC in mode 1. In order to eliminate
Qp and
Qs, the current conditions
iL(
t0) ≥ 0,
iL(
t1) ≥ 0,
iL(
t2) = 0 and
iL(
t3) = 0 should be satisfied to obtain:
Substituting Equation (3) into the expression of transmission power in
Table 1, the optimized control parameters with its constraints in mode 1 can be solved:
Based on the constraints of mode 1 in
Table 1, the maximum transmission power is:
MBPC in mode 2. Solving the current conditions
iL(
t0) = 0,
iL(
t1) ≥ 0,
iL(
t2) ≥ 0 and
iL(
t3) = 0 for the elimination of
Qp and
Qs we obtain:
Substituting Equation (6) into the expression of transmission power in
Table 1, the optimized control parameters with its constraints in mode 2 can be solved:
According to the constraints of mode 2 in
Table 1, the maximum transmission power is:
MBPC in mode 3. Solving the current conditions
iL(
t0) = 0,
iL(
t1) ≥ 0,
iL(
t2) ≥ 0 and
iL(
t3) = 0 for the elimination of
Qp and
Qs we can obtain:
This indicates that the elimination of backflow power in mode 3 is only determined by
D1 and
D2. The outer phase shift ratio
φ has no effect on it. However, in order to reduce the root-mean-square (RMS) current of
iL as much as possible,
φ is supposed to be
D1 in this mode. Therefore, the period of time
t1 to
t2 can be eliminated to zero and RMS current can be reduced, as shown in
Figure 2d.
Substituting Equation (9) into the expression of transmission power in
Table 1, the optimized control parameters of mode 3 can be calculated:
The maximum transmission power in mode 3 is:
MBPC in mode 4. Solve the current conditions
iL(
t0) = 0,
iL(
t1) ≥ 0,
iL(
t2) ≥ 0 and
iL(
t3) = 0 to eliminate
Qp and
Qs:
Substituting Equation (12) into the expression of transmission power in
Table 1 to obtain:
According to the quadratic curving relationship in Equation (13), it can be obtained that:
Therefore, the maximum transmission power in mode 4 is:
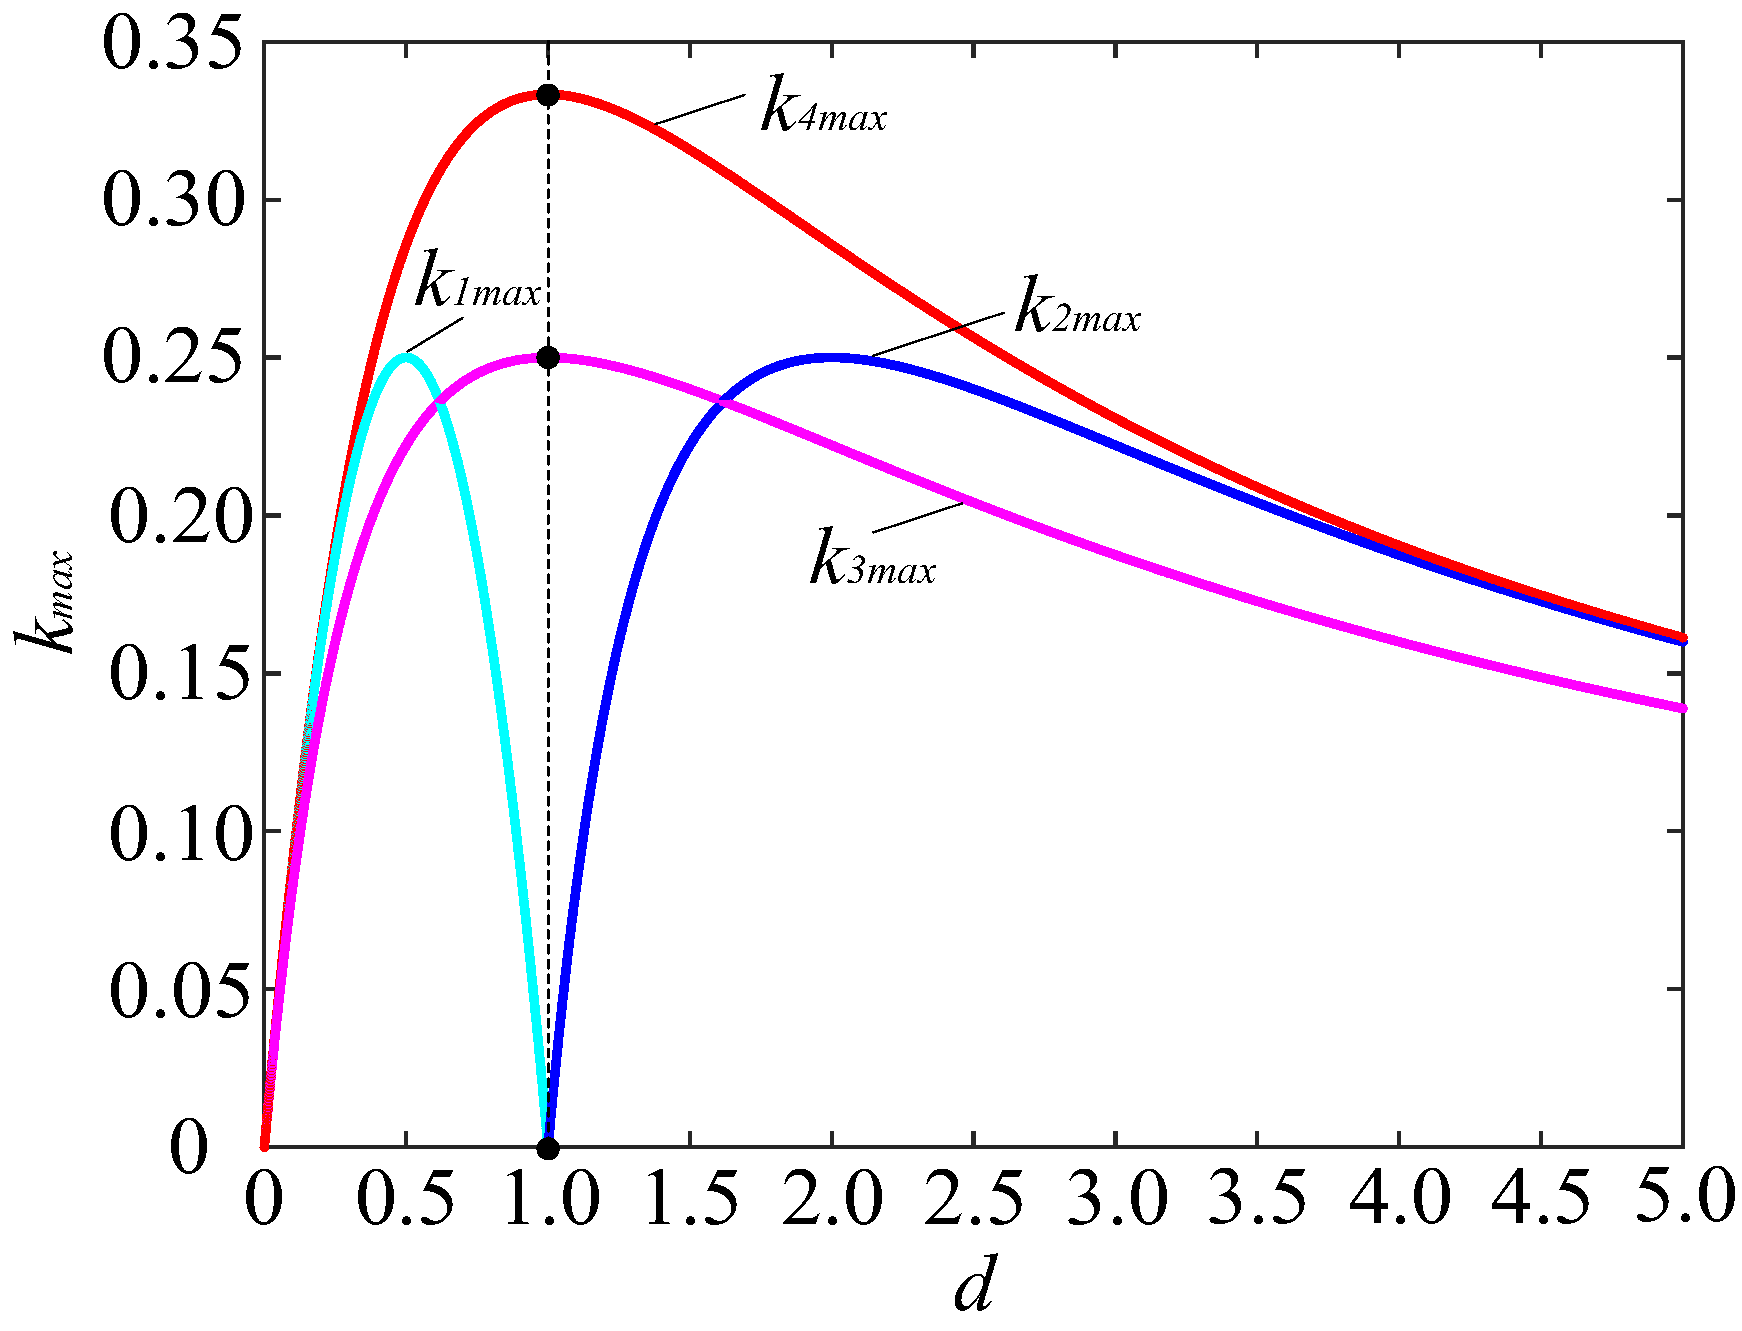
Figure 4 presents the curves of
kmax versus
d for mode 1 to mode 4 according to Equations (5), (8), (11) and (15). From
Figure 4, we can conclude that
k4max is larger than the other three modes under different
d. Especially when
d is equal to 1, mode 1 and mode 2 will not be effective anymore while
k4max reaches its maximum value. This indicates that mode 4 has the widest power range for zero backflow power on both the primary side and secondary side. As a result, mode 4 is the optimized operating mode at low power level.
Similar to the backflow power in mode 3, the elimination of backflow power in mode 4 is only dependent on
D1 and
D2. The outer phase shift ratio
φ has no effect on it. For simplicity,
φ is designed to be a linear relationship with
D1 or
D2 as shown below:
The optimized control parameters of mode 4 can be solved as:
3.3. Minimum Backflow Power Conrtrol at Medium Power Level
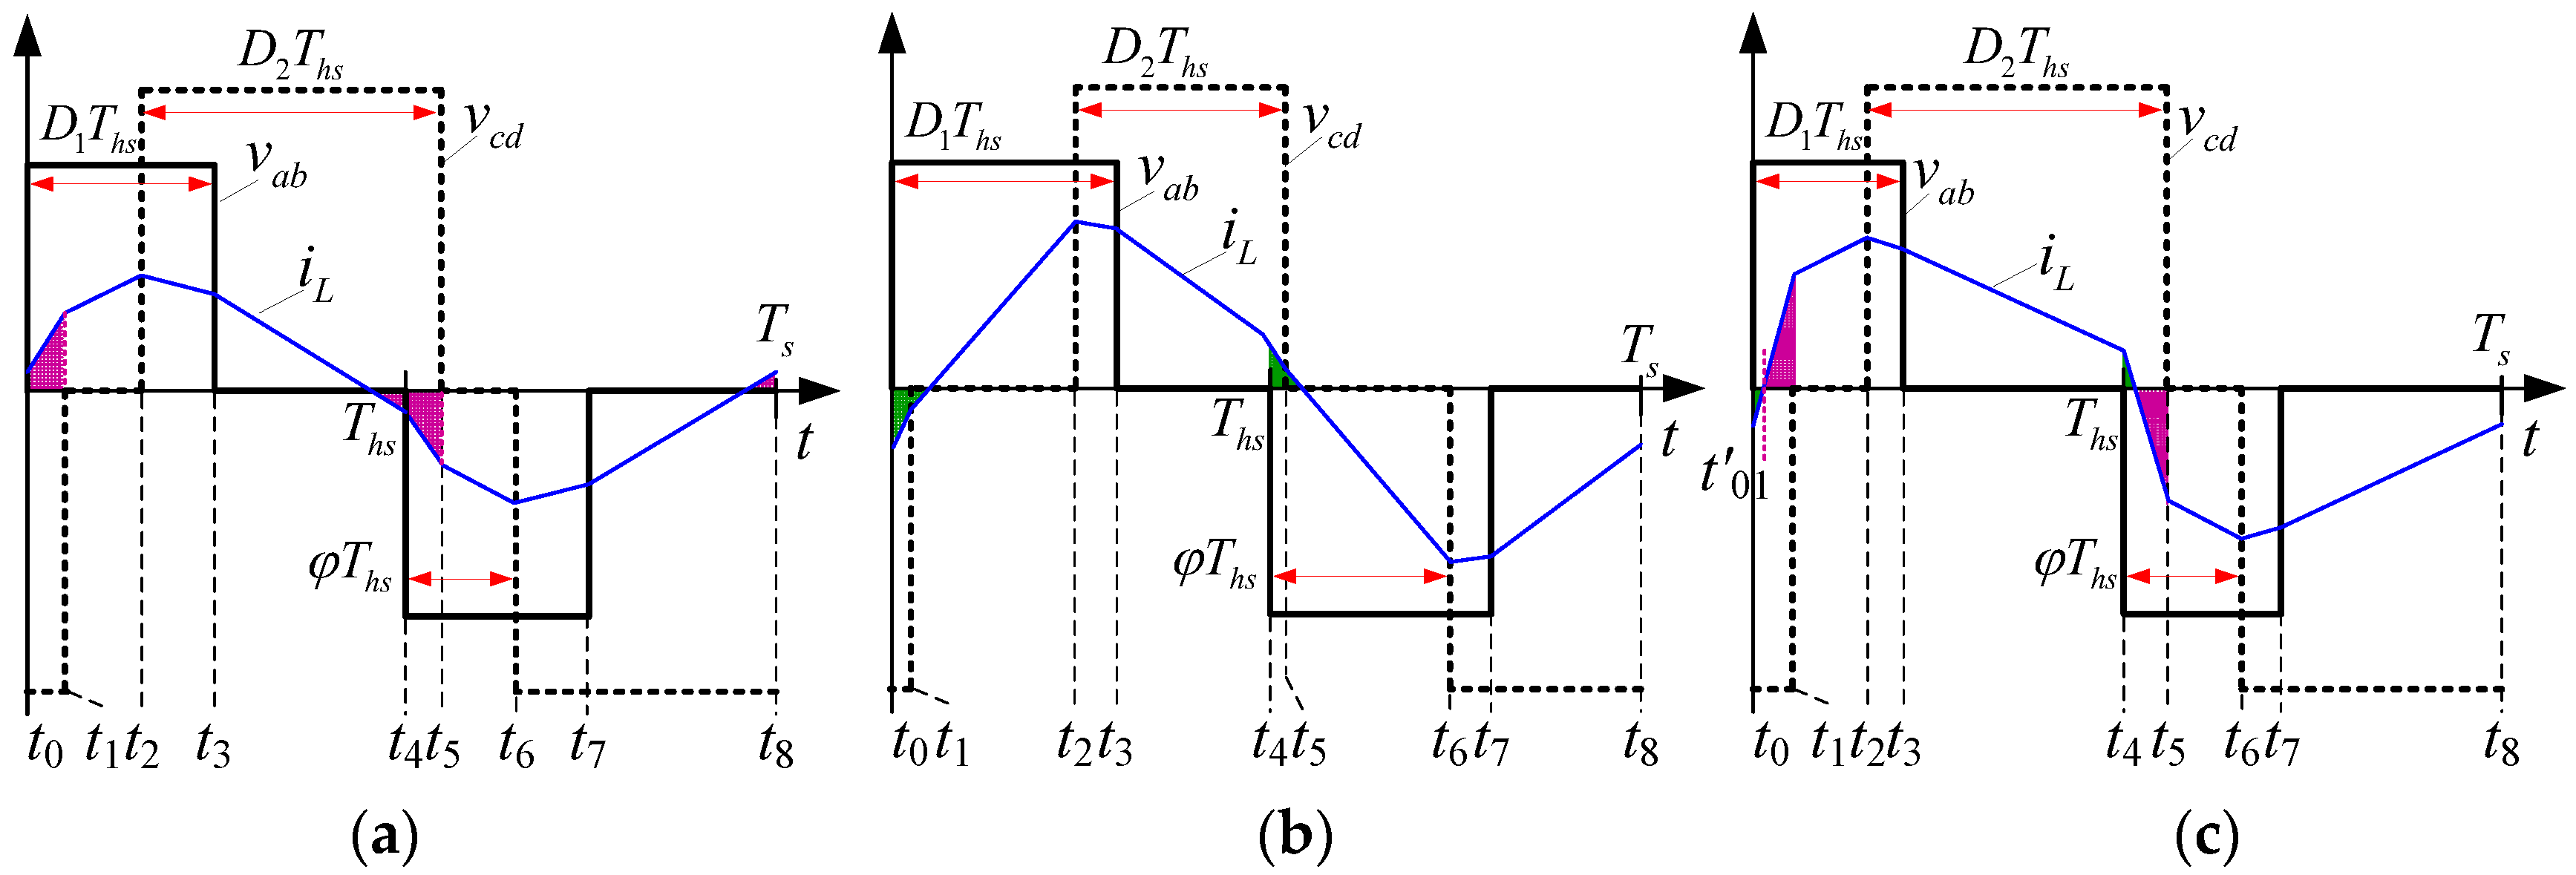
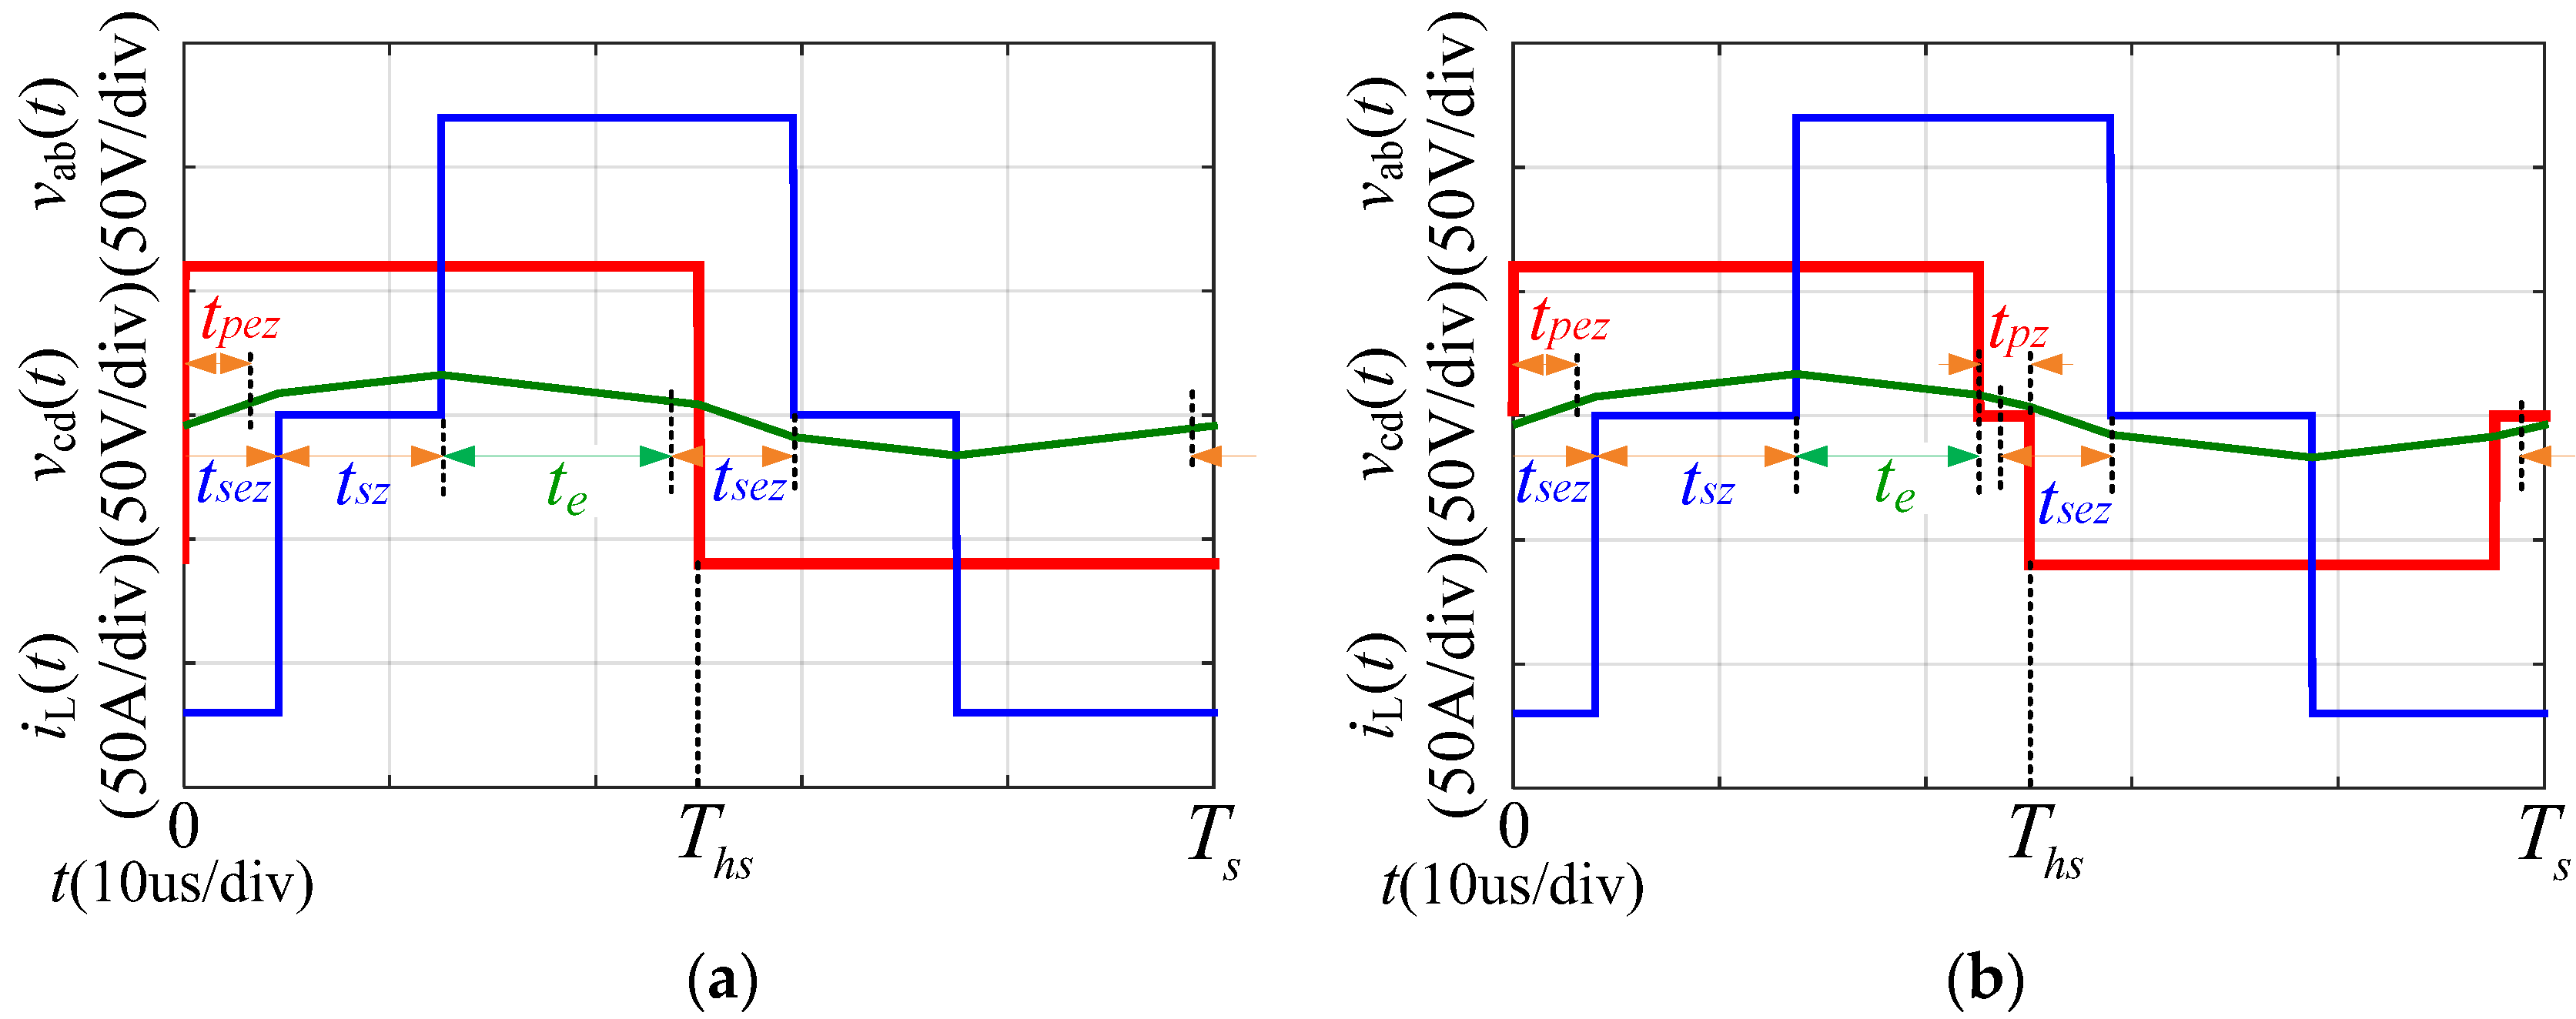
If the transmission power exceeds k4max, the DAB converter will operate in mode 5. However, Qp and Qs cannot be eliminated at the same time in mode 5 when k is larger than k4max. Mode 5 can be further subdivided into five operating modes based on the current conditions of iL. Due to the symmetry of vab, vcd and iL in the adjacent half switching period, only the current values in a half period are presented:
- (1)
Mode 5A. When
iL(
t0) ≥ 0,
iL(
t1) ≥ 0,
iL(
t2) ≥ 0, and
iL(
t3) ≥ 0,
Qp can be eliminated to zero, while
Qs cannot be eliminated, as shown in
Figure 5a.
- (2)
Mode 5B. When
iL(
t0) < 0,
iL(
t1) ≤ 0,
iL(
t2) ≥ 0, and
iL(
t3) ≥ 0,
Qs can be eliminated to zero, while
Qp cannot be eliminated, as shown in
Figure 5b.
- (3)
Mode 5C. When
iL(
t0) ≤ 0,
iL(
t1) ≥ 0,
iL(
t2) ≥ 0, both
Qp and
Qs cannot be eliminated to zero. However, it is the only operating mode to reach the maximum transmission power of DAB, i.e.,
k = 0.5 when
D1 = 1,
D2 = 1 and
φ = 0.5, as shown in
Figure 5c.
- (4)
Mode 5D. When iL(t0) ≥ 0, iL(t1) ≥ 0, iL(t2) ≥ 0, and iL(t3) ≤ 0, both Qp and Qs are larger than that in mode 5A under certain k. Therefore, this mode is not selected to be optimized below.
- (5)
Mode 5E. When iL(t0) ≤ 0, iL(t1) ≤ 0, iL(t2)≤ 0, and iL(t3) ≥ 0, both Qp and Qs are larger than that in mode 5B under certain k. Therefore, this mode is also not selected to be optimized below.
As analyzed above, only mode 5A, mode 5B and mode 5C are selected to be optimized as below. There are two common optimal objectives in mode 5, i.e.,
Qp = 0 or
Qs = 0, to eliminate the backflow power on the primary side and secondary side, respectively. Based on the two objectives, only two control degrees of freedom are considered in [
18,
19].
In this section, the two optimized objectives are modified to obtain a smaller backflow power on both sides with three control degrees of freedom. The optimized control parameters at medium power level are derived based on two modified objectives respectively as below:
Objective 1: The objective 1 at medium power level is to eliminate the primary backflow power
Qp with minimum secondary backflow power
Qs:
The optimized objective in Equation (18) not only achieves zero backflow on the primary side, but also gives consideration to the reduction of backflow power on the secondary side. Moreover, when
iL(
t0),
iL(
t1),
iL(
t2), and
iL(
t3) are not smaller than zero,
Qp can be eliminated to zero. Therefore, the optimized mode for objective 1 is mode 5A, as shown in
Figure 5a. The secondary backflow power
Qs in this case is:
where
A is the constant coefficient
Ths/(2
L).
It can be seen from Equation (19) that
Qs cannot be eliminated to zero when
Qp is zero. However, the value of
Qs can still be minimized based on appropriate control parameters. According to Equations (18), (19) and the transmission power in
Table 1, the optimized control parameters are derived in Equation (20) (the detailed derivation process is presented in
Appendix A).
The optimized results indicate that the value of
iL(
t0) is exactly equal to zero. That is to say, the optimized control parameters in Equation (20) are actually located at the boundary of mode 5A and mode 5C. The maximum transmission power is reached when
α1 in Equation (20) is equal to zero:
Objective 2: The objective 2 at medium power level is to eliminate the secondary backflow power
Qs with minimum primary backflow power
Qp As long as the current conditions
iL(
t0) ≤ 0,
iL(
t1) ≤ 0,
iL(
t2) ≥ 0, and
iL(
t3) ≥ 0 are met,
Qs can be eliminated to zero, as shown in
Figure 5b. The primary backflow power
Qp in this case is:
It can be seen from Equation (23) that
Qp cannot be eliminated to zero when
Qs is zero. However, the value of
Qs can still be minimized based on appropriate control parameters. Based on Equations (22), (23) and the transmission power in
Table 1, the optimized control parameters can be derived as below:
Under the optimized control parameters in Equation (24), the value of iL(t1) is exactly equal to zero. Therefore, the optimized control method by in Equation (24) is actually located at the boundary of mode 5B and mode 5C.
The maximum transmission power is reached when
α2 in Equation (24) is equal to zero:
3.4. Minimum Backflow Power Conrtrol at High Power Level
Along with the increase of transmission power,
k will exceed
k5Amax or
k5Bmax. In this case, the current value of
iL(
t0) is smaller than zero while the current value of
iL(
t1) is larger than zero. The DAB converter will operate in mode 5C, as shown in
Figure 5c. The backflow power on both sides needs to be recalculated by Equations (26) and (27):
Objective 1: Objective 1 at high power level is to eliminate the primary backflow power
Qp:
Substituting the expression of transmission power in
Table 1 into Equation (26) to eliminate the variable
φ, the optimized control parameters can be derived:
Objective 2: Objective 2 at high power level is to eliminate the secondary backflow power
Qs:
Similarly, the optimized control parameters can be derived as:
As can be seen in Equations (28) to (31), whether objective 1 or objective 2 is selected to be optimized, three control degrees of freedom are needed. It indicates that only single-side backflow power (i.e., Qp or Qs) can be optimized at high power level.
Equations (17), (20) and (29) constitute the “global minimum primary backflow power control method (GMPBPC)”, while the Equations (17), (24) and (31) constitute the “global minimum secondary backflow power control method (GMSBPC)”.
3.5. Comparative Analysis of Global Minimum Backflow Power Control
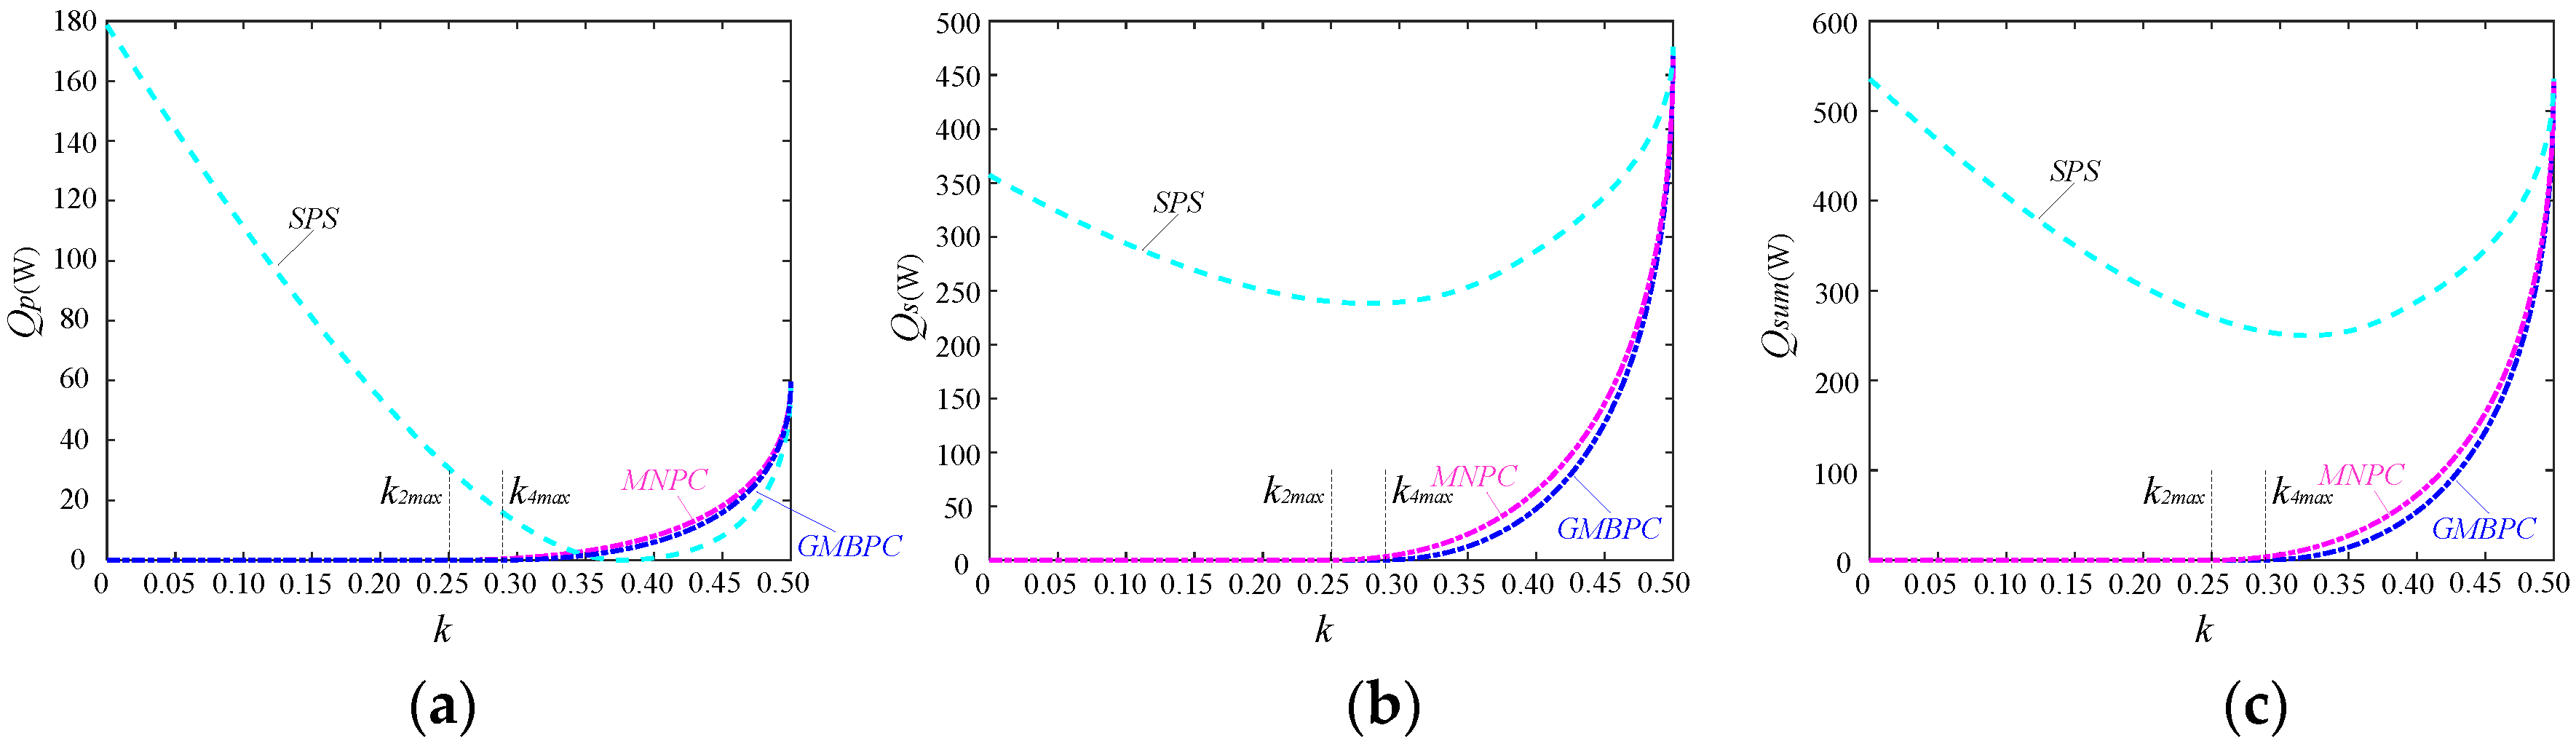
3.5.1. Backflow Power
The backflow power of GMPBPC, GMSBPC and the traditional SPS control method are depicted in
Figure 6. It can be seen in
Figure 6a,b that GMPBPC and GMSBPC achieve minimum
Qp and minimum
Qs, respectively, as expected. Compared to the SPS control method, these two optimized methods can reduce backflow power effectively, especially at lower power level. However, at higher power level, the backflow power of optimized methods may be even larger than the backflow power of the SPS control method.
Under the condition when
d = 2 (
V1 = 60 V,
V2 = 120 V),
Qs of GMPBPC is much larger than
Qs of other methods at higher power level. The maximum difference of
Qs between GMPBPC and GMSBPC is about 240 W, as shown in
Figure 6b. However, the maximum difference of
Qp between GMSBPC and GMPBPC is only about 40 W, as shown in
Figure 6a. As a result, GMPBPC has worse optimized results in comparison to GMSBPC when
d is larger than 1. Similarly, GMSBPC has worse optimized results in comparison to GMPBPC when
d is smaller than 1, as shown in
Figure 6d,e.
As analyzed above, the control method should be switched to GMPBPC when d is larger than 1 and switched to GMSBPC when d is smaller than 1, in order to ensure good optimized performance of DAB under different voltage conversion ratio d. However, the mode switching increases the complexity of the implementation in digital controller.
In order to optimize the backflow power in both sides under arbitrary voltage conversion ratio d but without mode switching, an alternative optimal objective is to minimize the sum of backflow power in both sides as below.
Objective 3: The objective 3 is to minimize the sum of primary and secondary backflow power, i.e.,
Qsum:
At low power level, the optimized control parameters has been derived in
Section 3.2, i.e., mode 4, and
Qsum is reduced to zero. At medium power level, Equations (18) and (22) are essentially equivalent to the optimal objectives “minimum
Qsum” in mode 5A and mode 5B, respectively. The optimized results are located at the boundary of mode 5C. At high power level, only mode 5C has the ability to reach the maximum power transmission of DAB. As a consequence, the global minimum
Qsum can only be derived in mode 5C when transmission power
k is larger than
k4max. The optimized control parameters are derived based on Equations (26), (27) and (32) as shown below:
The control method which consists of Equations (17) and (33), is called as “global minimum backflow power control (GMBPC)” in this paper.
As can be seen in
Figure 6a,b, the values of
Qp and
Qs in GMBPC are always between the values in GMPBPC and GMSBPC. It indicates that the optimal objective in Equation (32) is essentially a tradeoff between minimum
Qp and minimum
Qs. Moreover, as shown in
Figure 6b, the optimized results of GMBPC are closer to the optimized results of GMSBPC when
d = 2. This is because
Qs accounts for the largest portion of
Qsum (i.e.,
Qs >>
Qp) at higher power level when
d = 2, GMBPC is prone to reduce
Qs when
d is larger than 1.
Figure 6d–f show
Qp,
Qs, and
Qsum at
d = 0.5 (
V1 = 120 V,
V2 = 60 V) respectively. The optimized results in
Figure 6d–f show the symmetry with respect to the optimized results when
d = 2 (
V1 = 60 V,
V2 = 120 V) in
Figure 6a–c. Therefore, GMBPC is prone to reduce
Qp when
d is smaller than 1. As a result, the optimized performance of GMBPC is similar to the optimized performance of mode switching between GMPBPC and GMSBPC. The mode switching can be avoided.
In conclusion, GMBPC not only has nearly the same optimized performance as GMPBPC when
d is smaller than 1 or as GMSBPC when
d is larger than 1 without mode switching, but also has smaller Q
sum than other methods. Therefore, GMBPC is supposed to have better performance than other two optimized methods. The optimized control parameters and the power range of the three derived methods above are listed in
Table 2.
3.5.2. Control Parameters
According to
Table 2, the optimized control parameters
D1,
D2, and
φ versus
k are depicted in
Figure 7 when
d = 2 (
V1 = 60 V,
V2 = 120 V). As can be seen in
Figure 7, the control parameters of all these three control methods are piecewise continuous function of
k. Only two subsections (i.e., low and high power level) exist in GMBPC, while three subsections (i.e., low, medium and high power level) are in GMPBPC and GMSBPC. Moreover,
D1 and
D2 change monotonically in GMBPC. Therefore, GMBPC is easier to be implemented compared to other two methods.
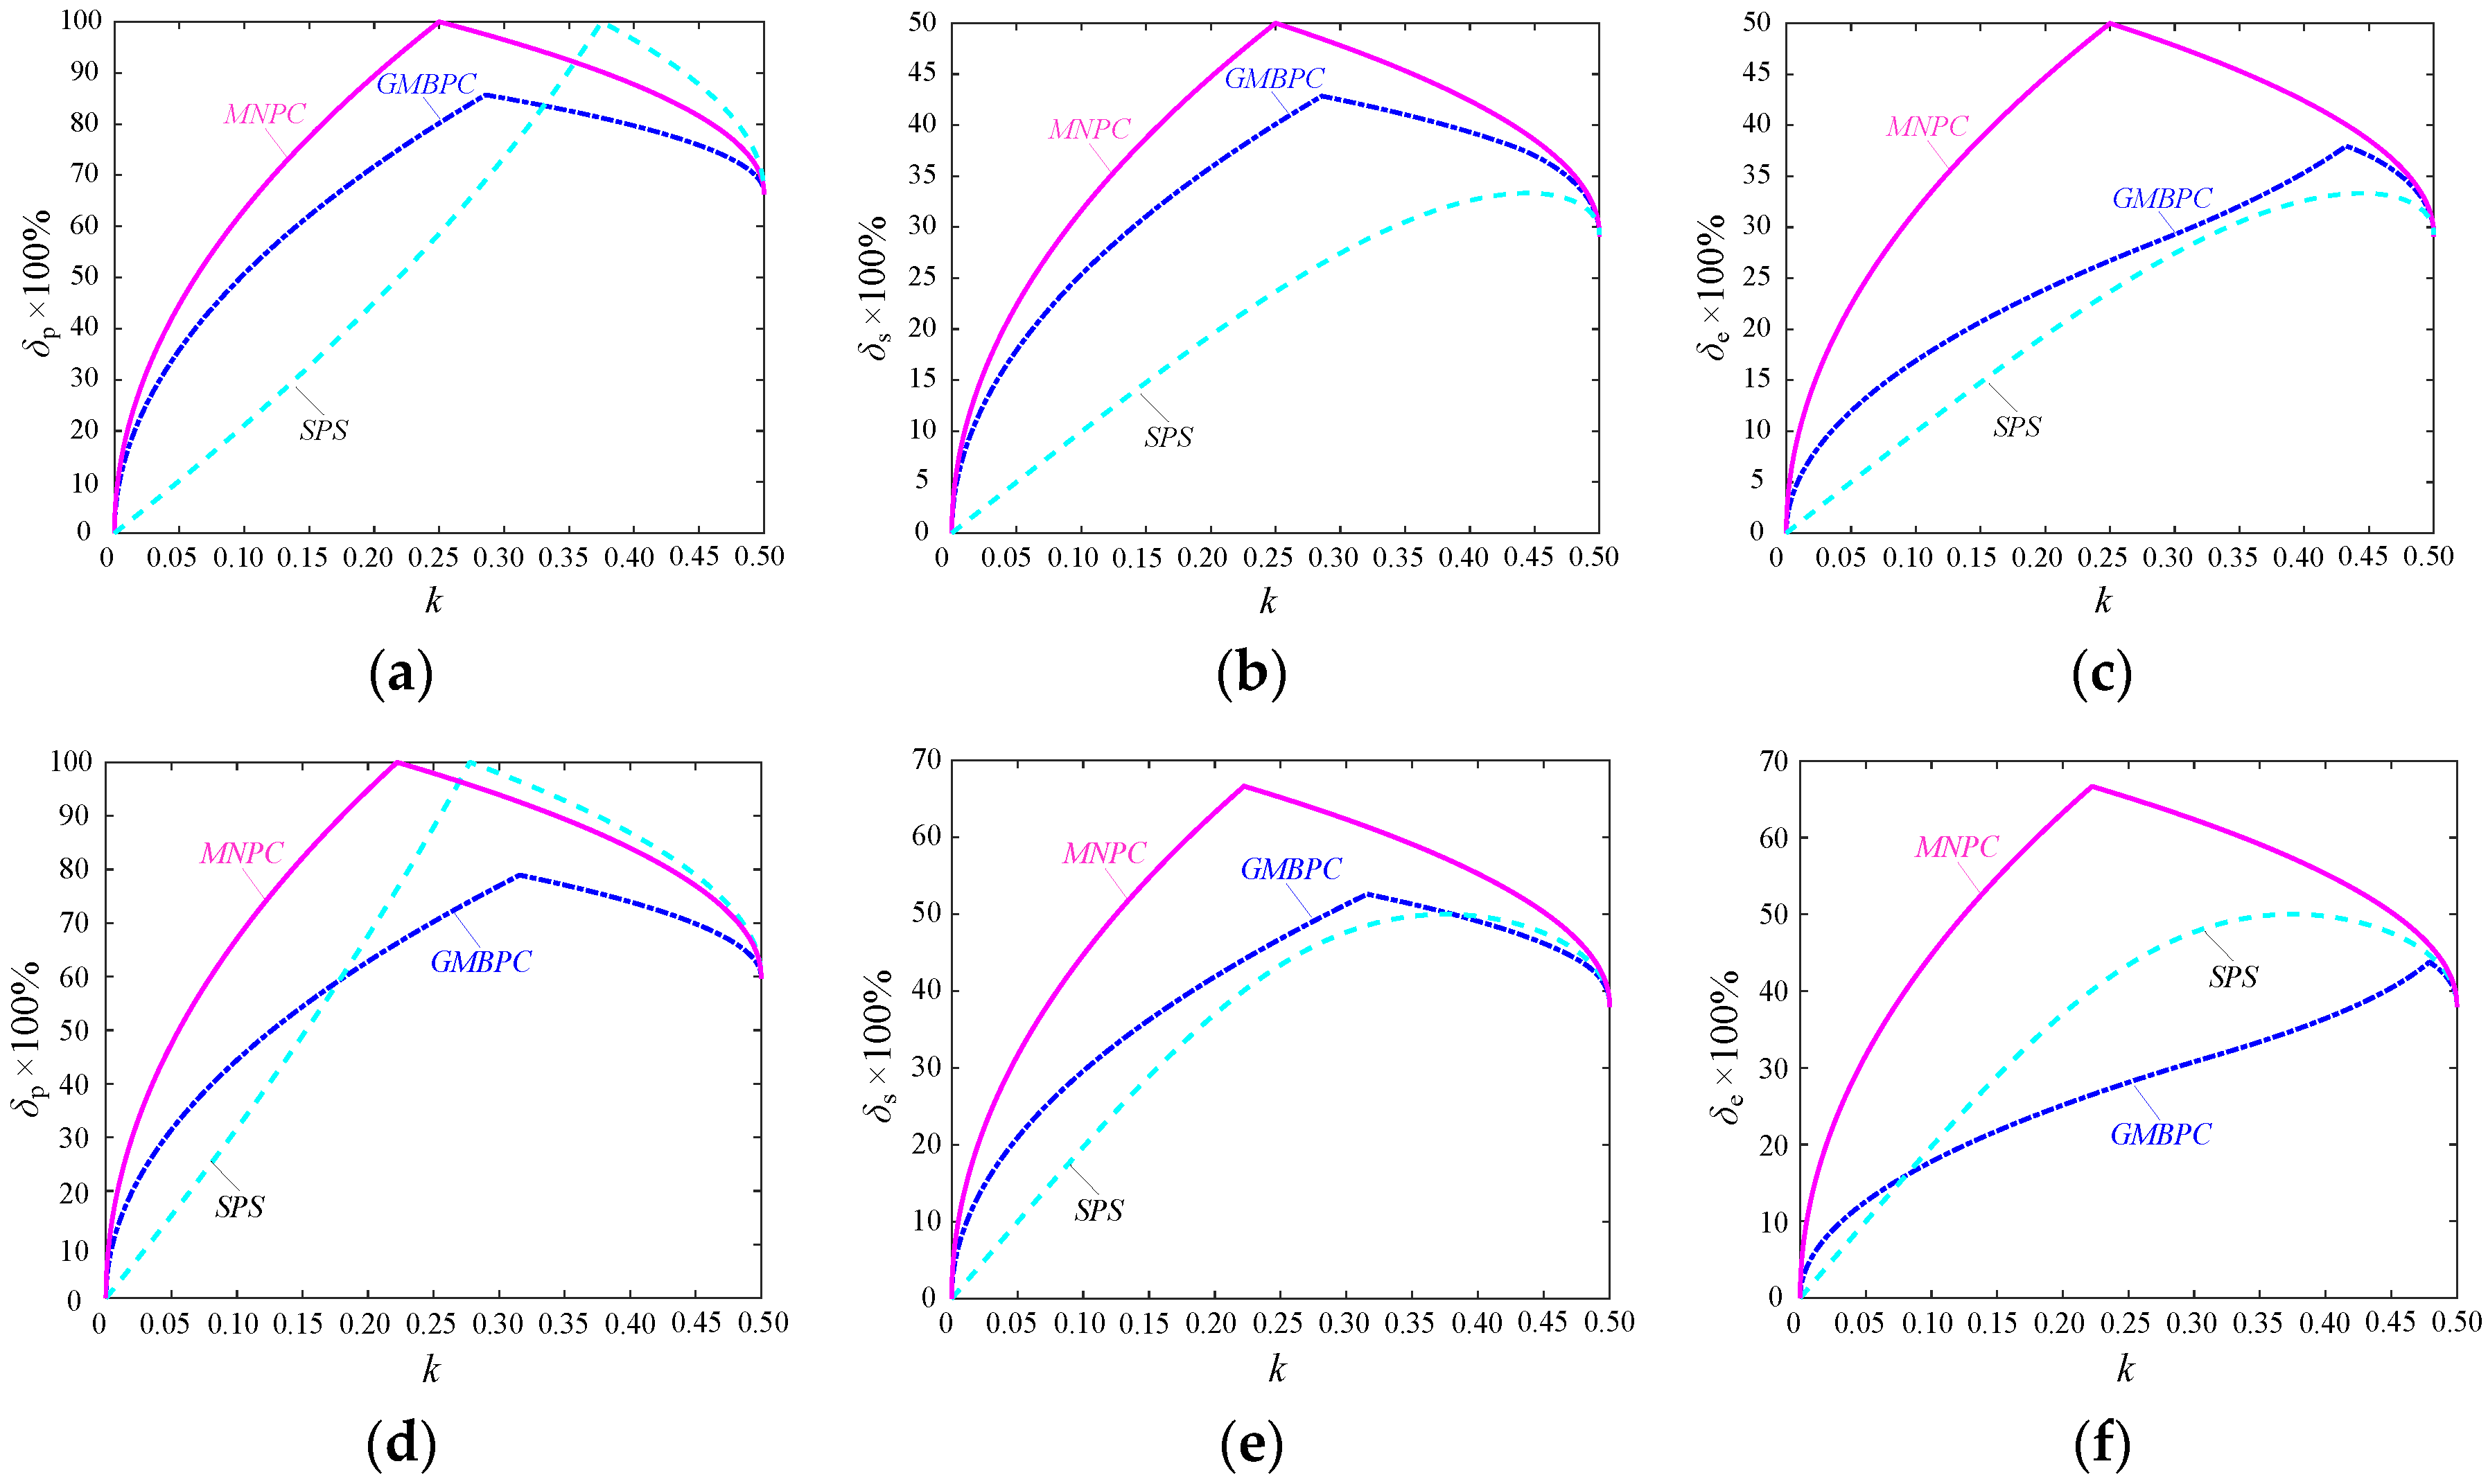
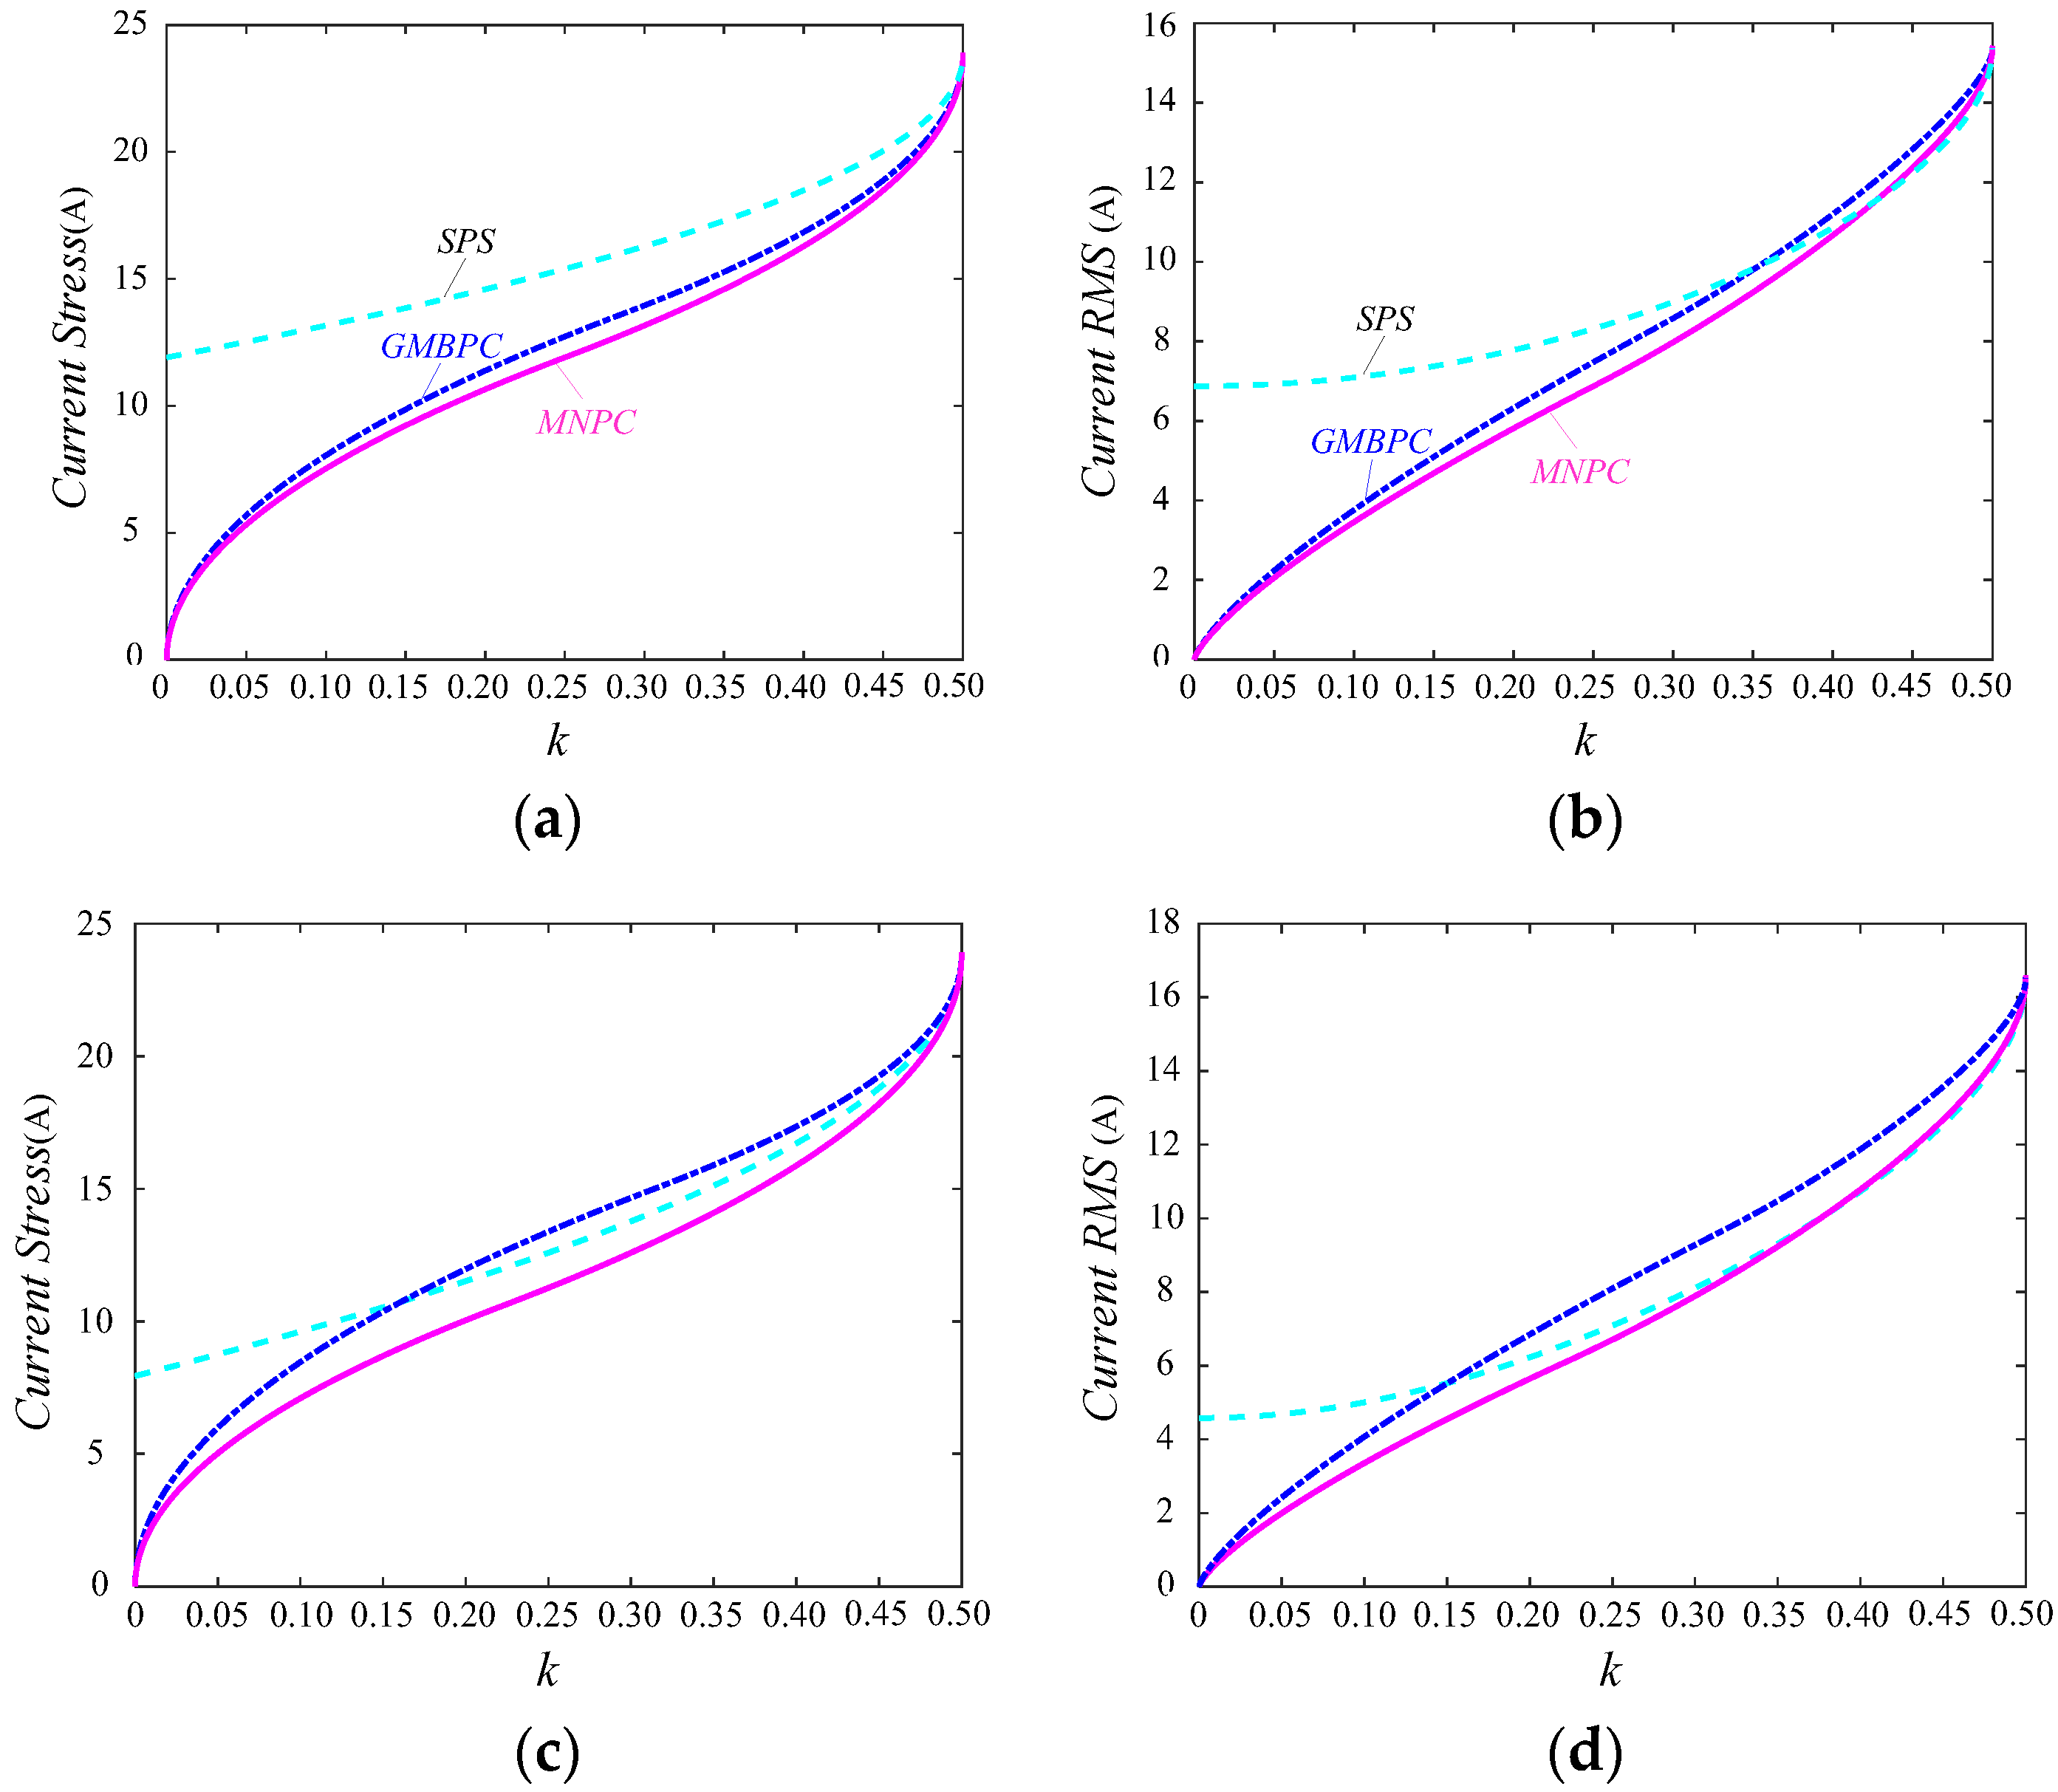
3.5.3. Current Stress and Current rms
In order to further study the performance differences of the three optimized methods, the current stress and the current rms value of
iL are compared in
Figure 8. Compared to the traditional SPS control method, the current stress and current rms can be reduced effectively by all the three optimized methods especially at lower power level. However, as shown in
Figure 8a, the current stress of GMPBPC becomes larger than with other control methods (even than SPS control method) at higher power level when
d is larger than 1. Similar situations can also be seen in
Figure 8b where the current stress of GMSBPC becomes larger than other methods when
d is smaller than 1. A similar phenomenon has been seen and analyzed in
Figure 6 in regard to backflow power
Qp and
Qs. As a result, the same conclusion can be drawn that GMPBPC has worse performance when
d is larger than 1 while GMSBPC has worse performance when
d is smaller than 1.
As shown in
Figure 8c,d, the differences of current rms are smaller than the differences of current stress among the three optimized methods. However, current rms of the three optimized methods all becomes slightly larger than with the SPS control method at higher power level, which means larger conduction losses arise in a higher power operation range by the optimized methods.
In general, GMBPC has the best current performance compared to the other two optimized control methods.
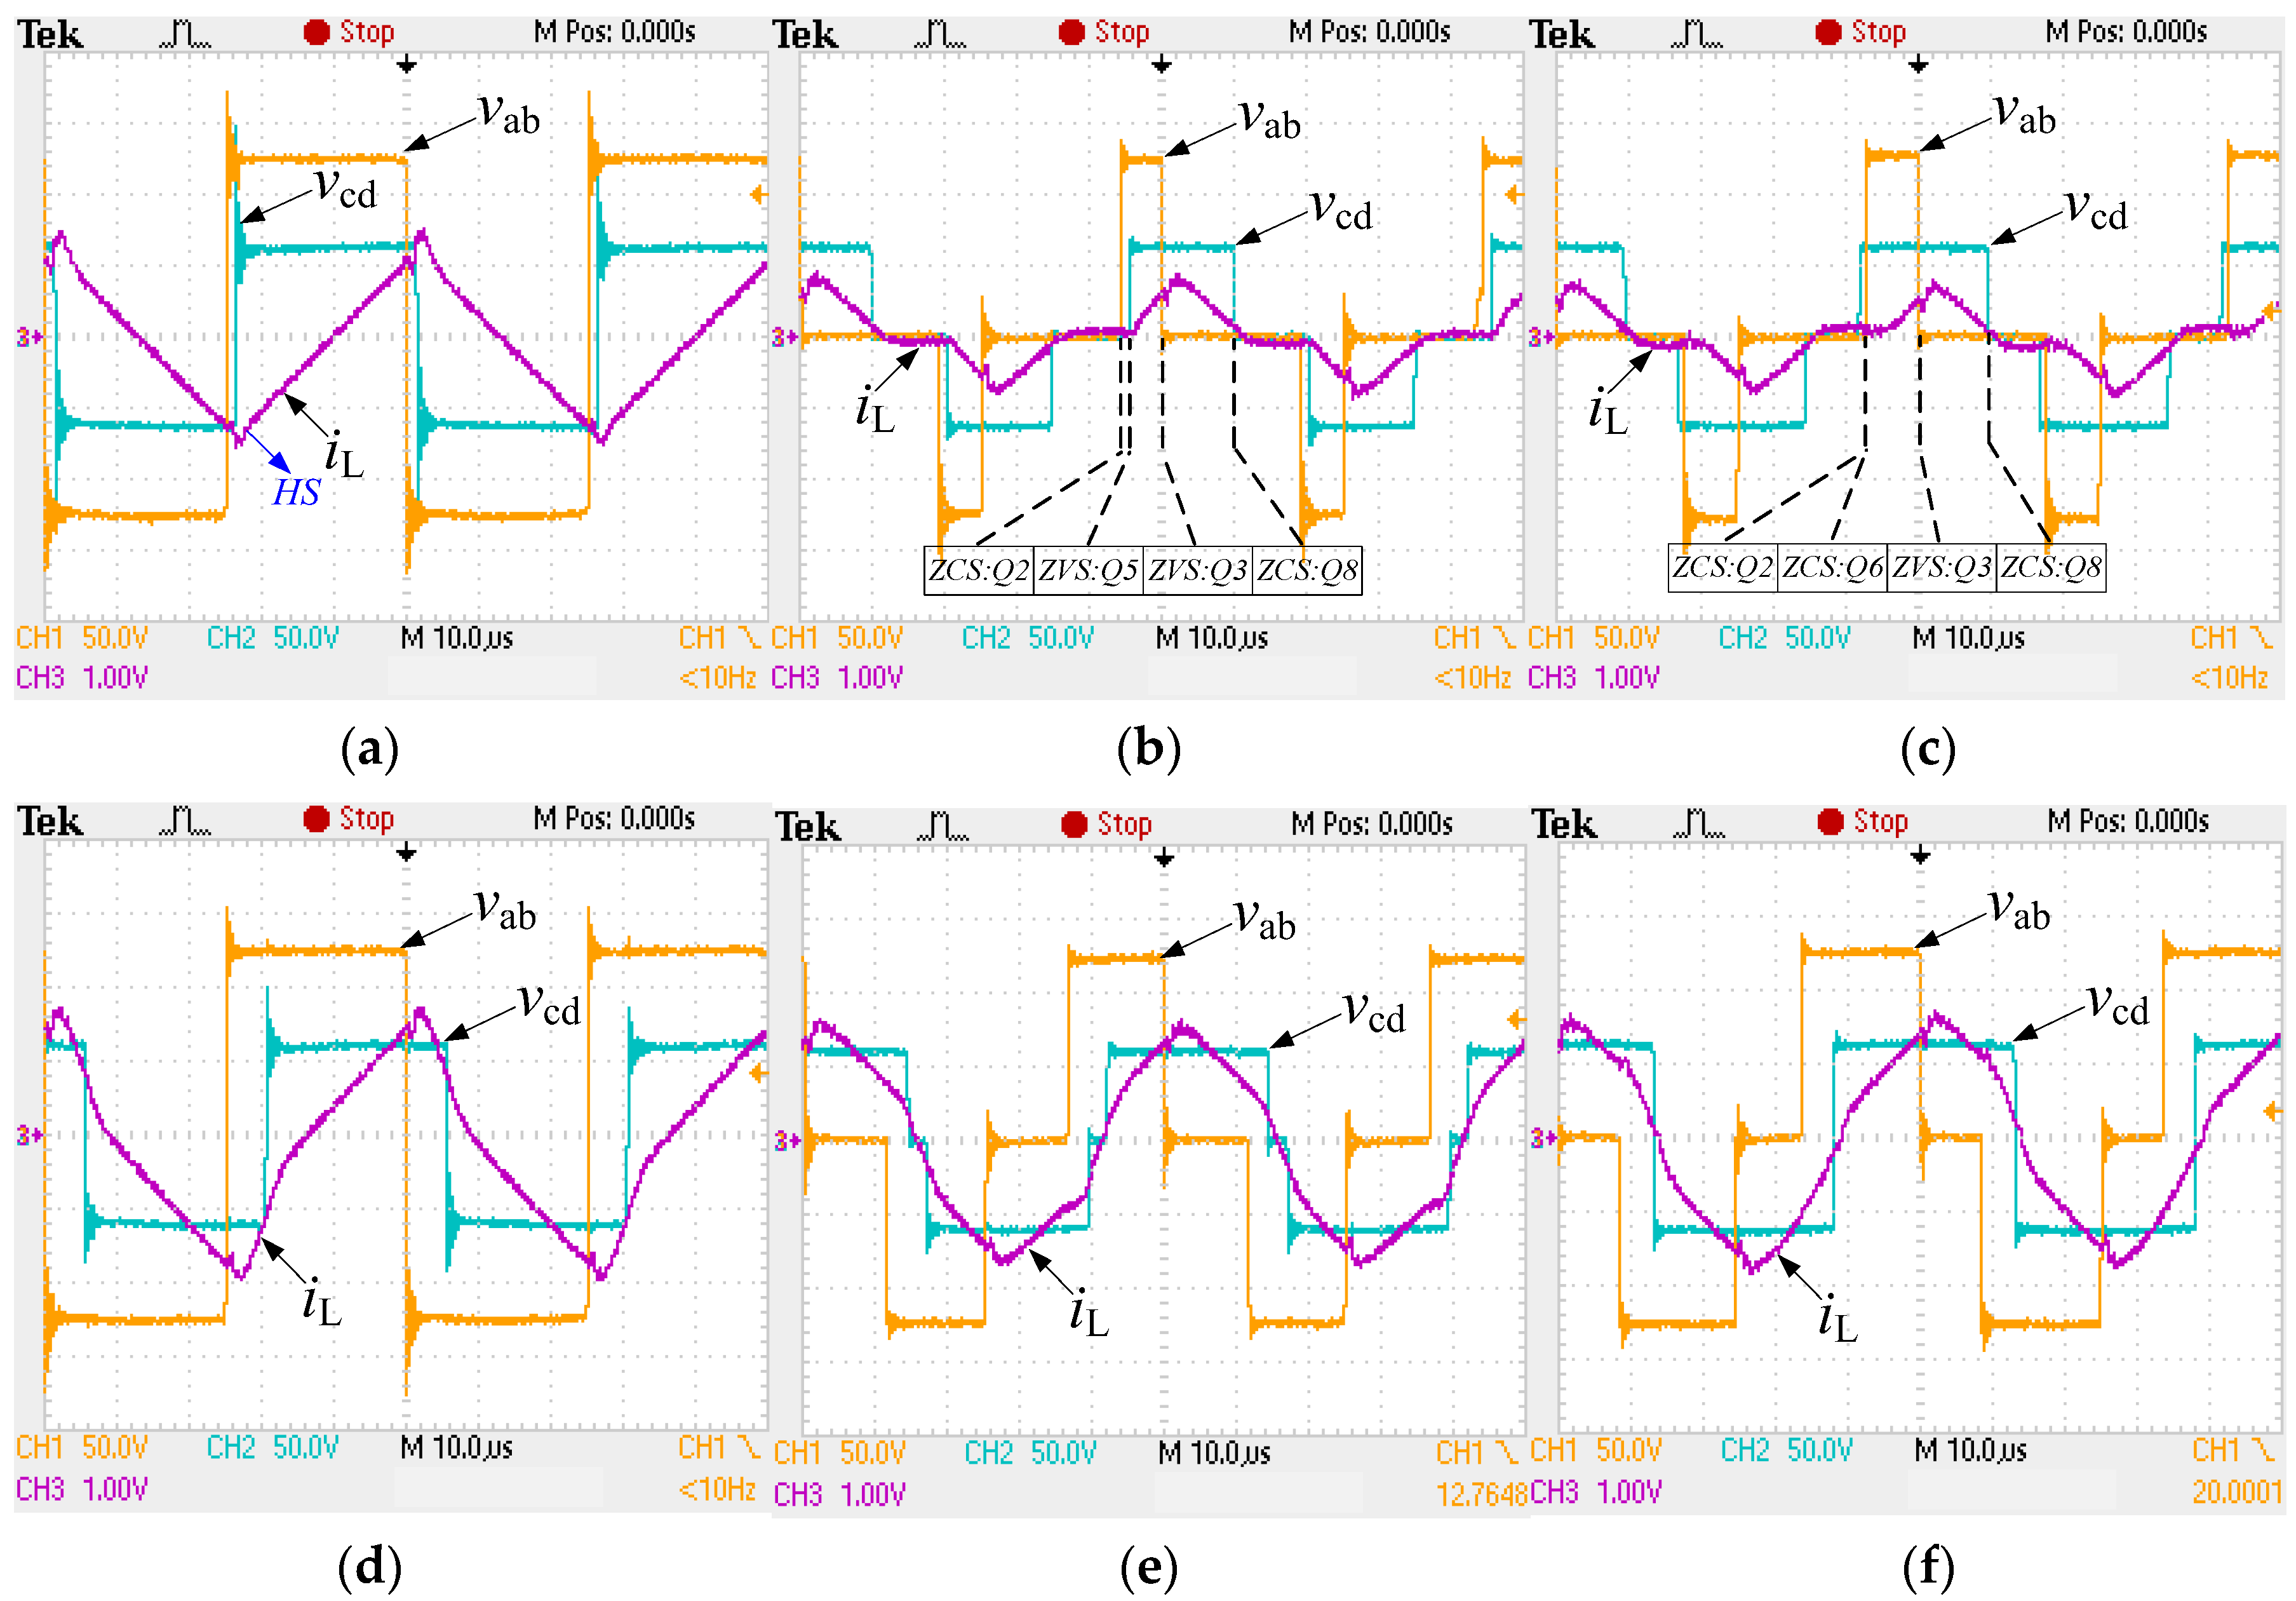
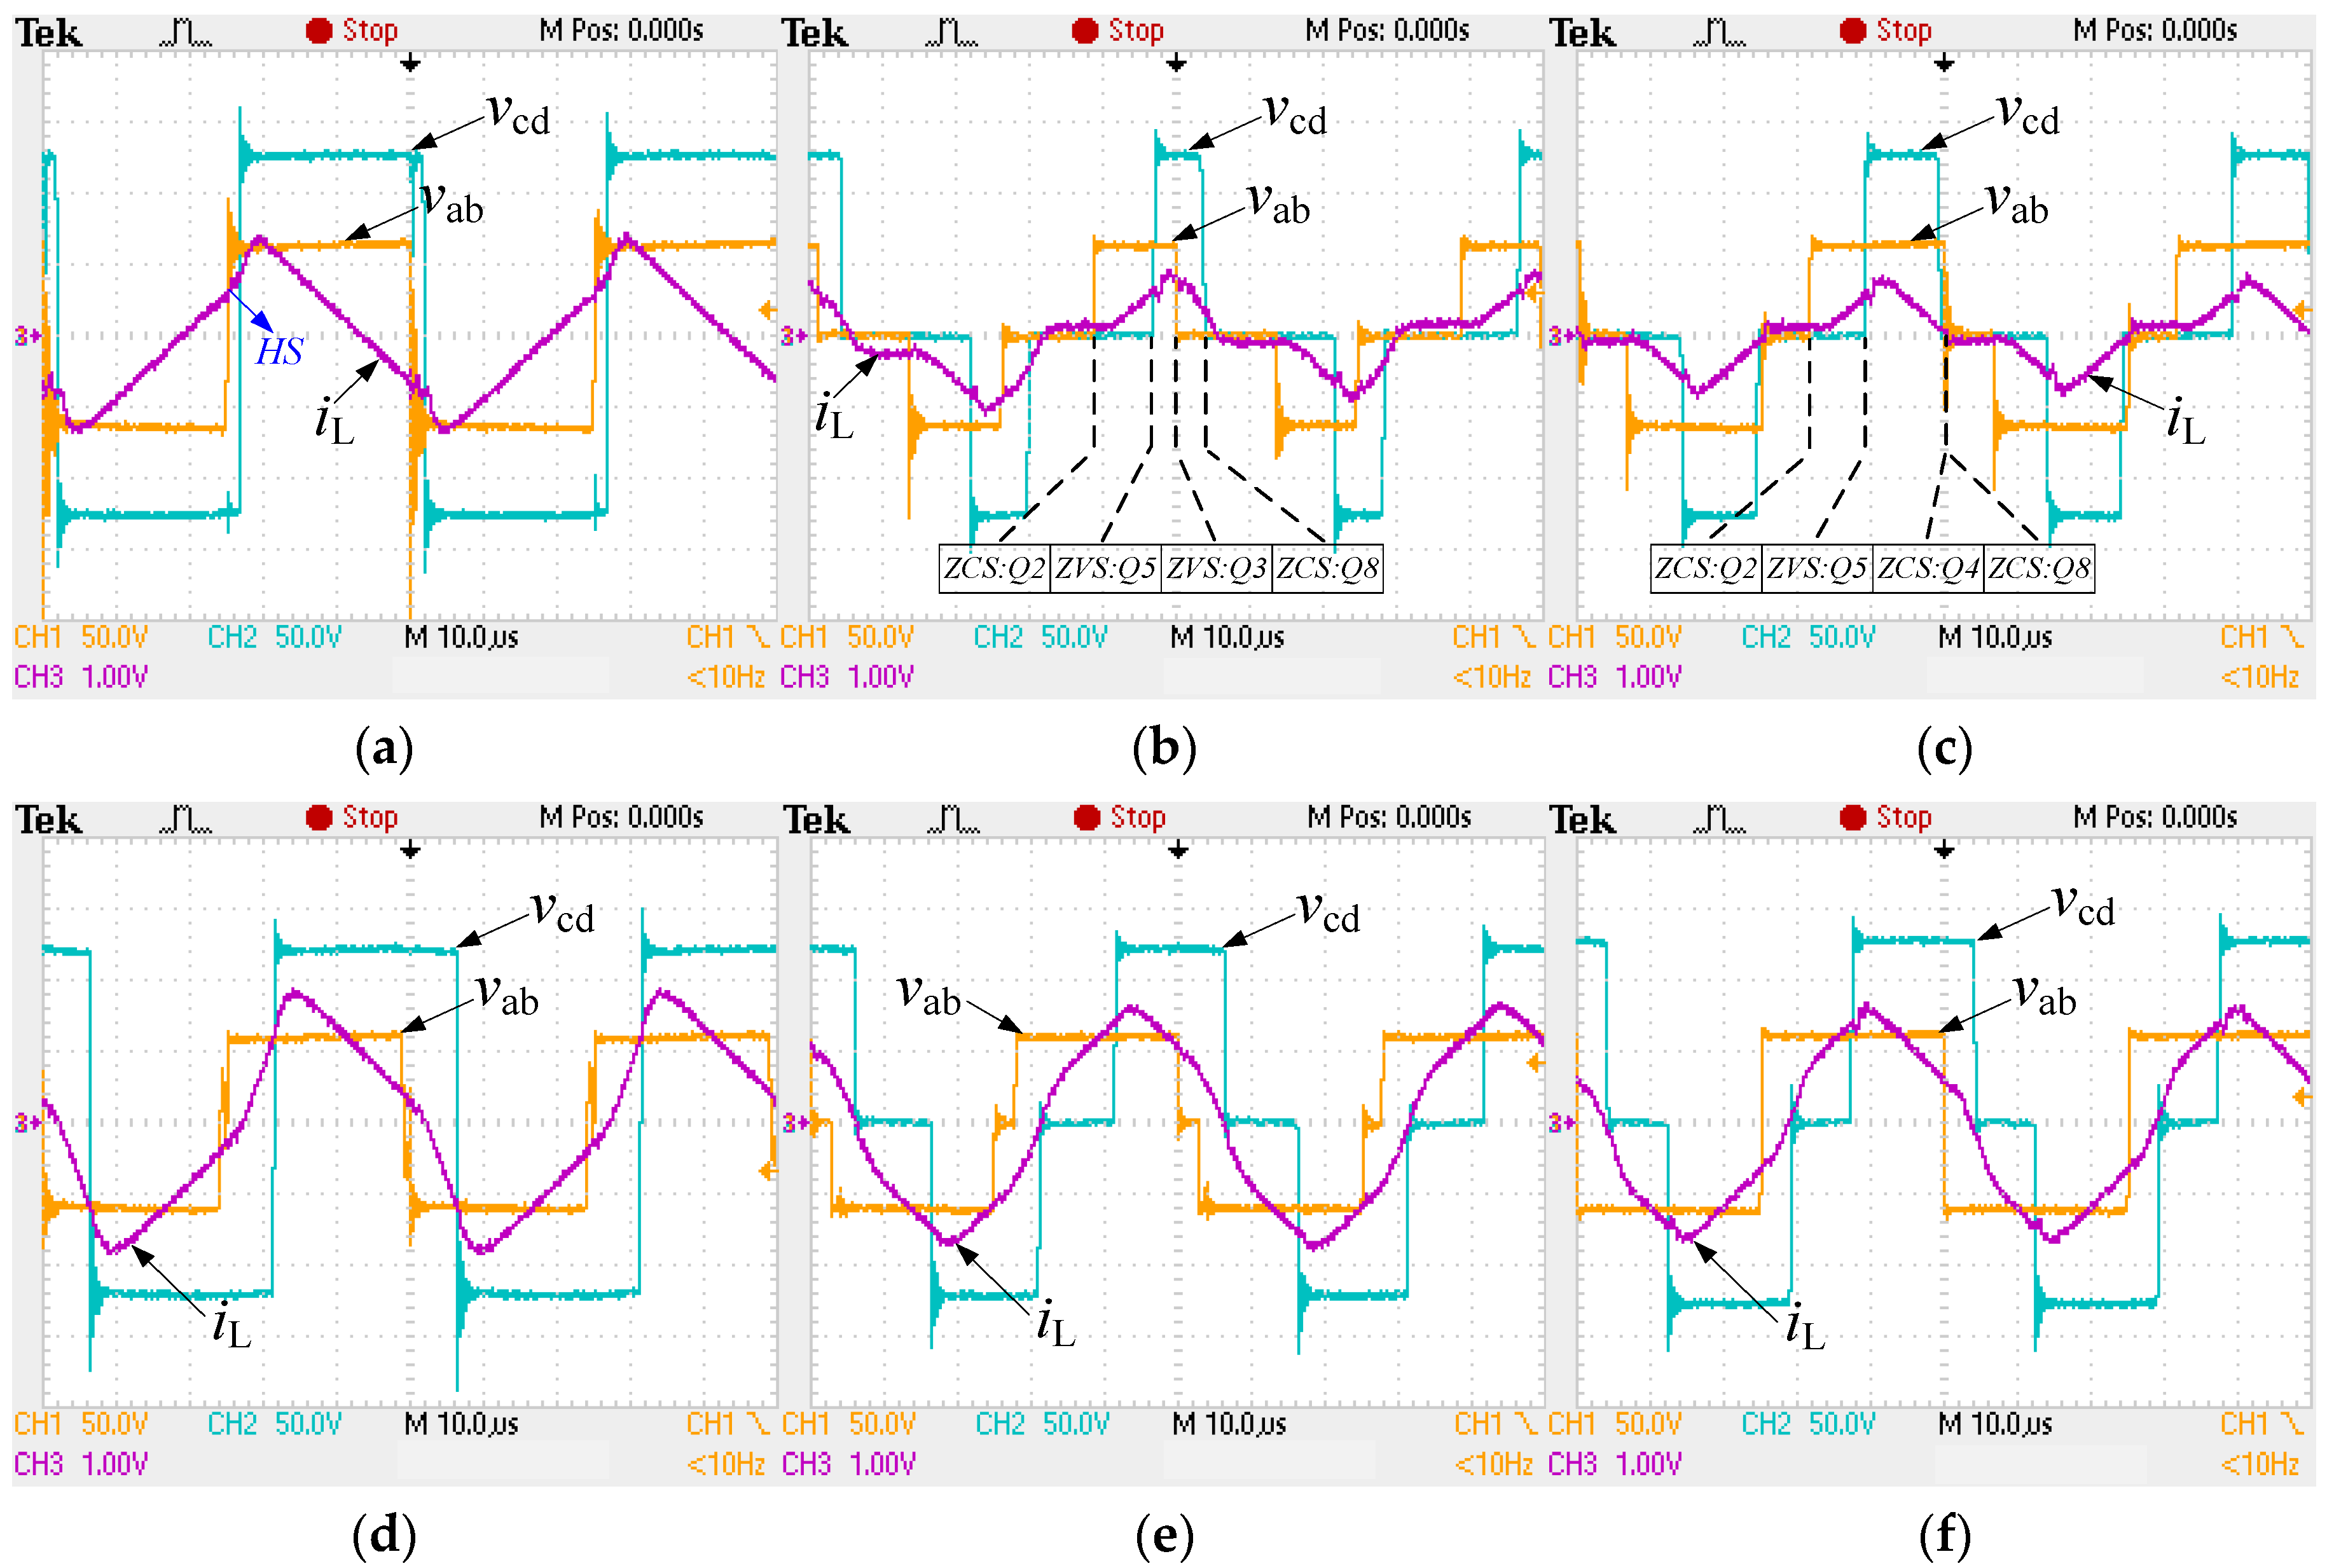
3.5.4. Switching Characteristics
Neglecting the resonance process during switching transition, the soft-switching is generally determined by the polarity of the current at the switching moment. At low power level, all the optimized methods operate in mode 4 and the current satisfies the condition when iL(t0) = 0, iL(t1) ≥ 0, iL(t2) ≥ 0 and iL(t3) = 0. Therefore, Q3, Q4, Q5 and Q6 are turned on at zero-voltage-switching (ZVS) while Q1, Q2, Q7 and Q8 are turned off at zero-current-switching (ZCS) in mode 4. All the switching devices can achieve soft-switching at low power level.
At medium power level, the GMPBPC method requires that iL(t0) = 0, iL(t1) > 0, iL(t2) > 0 and iL(t3) > 0. Therefore, Q3, Q4, Q5, Q6, Q7 and Q8 are turned on at ZVS while Q1 and Q2 are turned off at ZCS in mode 5. Similarly, Q1, Q2, Q3, Q4, Q5 and Q6 are turned on at ZVS while Q7 and Q8 are turned off at ZCS in mode 5 for the GMSBPC method. Thus, all the switching devices can achieve soft-switching at medium power level.
At high power level, all three optimized control methods operate in mode 5C under the conditions when iL(t0) < 0, iL(t1) > 0, iL(t2) > 0 and iL(t3) > 0. As a result, all the switching devices can be turned on at ZVS at high power level.
In conclusion, based on the comparative analysis above, GMBPC is a preferable choice to be a tradeoff between min Qp by GMPBPC and min Qs by GMSBPC. Compared to GMPBPC and GMSBPC, GMBPC allows smaller current stress, smaller current rms value, easier implementation method and wider ZVS range.


