Article

Comparison of NARX and Dual Polarization Models for Estimation of the VRLA Battery Charging/Discharging Dynamics in Pulse Cycle

by
Adrian Chmielewski
1,*,
Jakub Możaryn
2,*,
Piotr Piórkowski
3,* and
Krzysztof Bogdziński
1
1
Institute of Vehicles, Warsaw University of Technology, Narbutta 84 Str., 02-524 Warsaw, Poland
2
Institute of Automatic Control and Robotics, Warsaw University of Technology, Sw. A. Boboli 8, 02-525 Warsaw, Poland
3
Institute of Construction Machinery Engineering, Warsaw University of Technology, Narbutta 84 Str., 02-524 Warsaw, Poland
*
Authors to whom correspondence should be addressed.
Energies 2018, 11(11), 3160; https://doi.org/10.3390/en11113160
Submission received: 22 October 2018 / Revised: 7 November 2018 / Accepted: 11 November 2018 / Published: 14 November 2018
(This article belongs to the Section D: Energy Storage and Application)

Abstract

:
The following work presents the model-assisted research on Valve-Regulated Lead-Acid (VRLA) Absorbent Glass Mat (AGM) battery in pulse operation cycle. The experimental research was conducted for a constant value of State of Charge (SOC) of the battery, for values ranging from 0.2 to 0.8. Based on the conducted test stand research, the parameters of the battery were identified, which were later used to model the battery using the equivalent circuit based on dual polarization (DP) model with double Resistive-Capacitive (RC) loop. Simulations were performed for the identified parameters of the battery which are described by the general form of the polynomial. The second part contains the research on utilization of Nonlinear AutoRegressive eXogenous (NARX) recurrent neural network to predict SOC and a terminal voltage of the battery. Obtained validation results with the use of the identified parameters of the double RC loop and NARX model were discussed in the following work. The article also features the advantages and disadvantages of NARX model and DP model utilization for the use of in Battery Managements Systems (BMS) and micro-installations based on renewable energy sources. Furthermore, the advantages of the addition of more RC loops to describe the dynamic states of batteries in pulse states were discussed in the article.

1. Introduction

Currently more and more attention is given to distributed energy generation systems [1,2,3,4,5,6,7,8,9] and alternative routes of development for conventional, hybrid and electric vehicles [10,11,12,13,14,15,16,17,18]. The balanced development of distributed technologies and polygeneration systems with energy storages are directly related to the climate change and the energy policy [19,20,21,22], especially for members of the European Union. From the user’s perspective, the most important criteria of choice for the given type of energy storage is the price per kWh. Currently, on the Polish market, the price for 1 kWh for electrochemical batteries is within 60–150 euro/kWh [23,24,25,26] (e.g., lead-acid batteries or Valve-Regulated Lead-Acid (VRLA) Absorbent Glass Mat (AGM) batteries) and more than 300 euro/kWh (Li-ion battery) [26]. Due to this, VRLA AGM batteries have found a wide range of applications in the industry [27,28,29,30,31,32,33,34,35,36], e.g., in forklifts where VRLA batteries are used as ballast, in start-up of gas engines [27], Start and Stop systems in vehicles with conventional drivetrains [15] and cogeneration systems where the gas engines have been employed [9], as well as other distributed energy generation systems and emergency power supply systems connected with auxiliary electricity generators (e.g., in hospitals).
Battery management system (BMS) is a system that manages energy storage [37], e.g., battery, ultracapacitor or hybrid system [38,39,40,41,42,43], by monitoring its state, calculating and reporting secondary data, controlling its environment, authenticating it and balancing it. All of this is performed to protect the battery from operating outside its Safe Operating Area (SOA) defined as the voltage and current conditions over which the device can be expected to operate without self-damage. BMS ensures the optimal usage of the internal energy of the battery, achieved by monitoring and controlling the battery’s charging and discharging process [44]. To improve algorithms for prediction and control in Battery Management Systems (BMS) for distributed systems, it is crucial to know the operating characteristics of typical electrochemical batteries, which can be supported by mathematical models [45].
This approach plays an essential role in hybrid systems [46,47,48,49,50]. The research of a dynamic operation of an electrochemical battery in a specific random, pseudo-random, pulse and Hybrid Pulse Power Characterization (HPPC) cycle [51,52,53], supported by a mathematical model, e.g., physical model [43,54,55,56,57], neural network model [45], AutoRegressive–Moving-Average (ARMA) model, fuzzy model [58,59], an adaptation model based on the Kalman filter [60,61,62,63,64,65,66,67,68] can give answers to different questions regarding the operation of batteries [69,70,71,72,73] in technical facilities. It should be also emphasized that the energy storage modeling has recently had increasing interest connected with new developments in the field of hybrid, electric vehicles [74] and heavy-duty vehicles or polygeneration systems [75].
The charging and discharging processes in batteries are nonlinear as a result of activation polarization and concentration polarization [63]. In order to replicate the mentioned polarization phenomena, a correct replacement model for the battery has to be adopted. The science literature provides a number of models, such as: The Resistive-Capacitive (RC) model [63,76,77], Thevenin model [78,79], a Partnership for a New Generation of Vehicle (PNGV) model [80,81,82], dual polarization (DP) model [63,83,84,85,86,87,88,89] and many more [89,90,91,92,93,94,95,96,97,98,99,100,101,102,103,104,105,106,107,108,109]. From the mentioned models, the best results of battery parameters and SOC estimation are achieved with the DP model [63].
In the following article, authors utilized an identified DP model to simulate the battery terminal voltage in pulse for various battery SOC values, ranging from 0.2 to 0.8.
In the second part of the work, a Nonlinear AutoRegressive eXogenous model (NARX) in the form of the recurrent artificial neural network (R–ANN) was used to the estimation of the voltage on the VRLA battery terminals. Mostly, ANN models simplify the identification procedure with high accuracy [30,69]. They have distinct advantages over linear identification methods, i.e., the approximation of multivariable nonlinear functions, the simple gradient-based adaptation of model parameters and a rapid calculation of ANN equations. In contrast to energy-balance analytical models [44], the design procedure of the ANN does not demand an exact knowledge of model physical equations, and physical parameters that describe the model, but only values of model variables in the form of the cause-effect relationships.
In energy storage systems usefulness of standard ANNs for identification were proposed in the form of feed-forward models [66], recurrent models [110,111] and recently Long-Short-Term-Memory (LSTM) recurrent models [112]. In particular, interesting for our research are Recurrent Artificial Neural Networks (R–ANN) where connections between units form a directed cycle. Previous research [30] shows, that with properly chosen and pre-processed data, system parameters, and operating conditions, recurrent ANN model can be used for prediction, to some extent, for energy storage performance under a wide variety of operating conditions. Considered in this work, NARX model based on R–ANN plays a significant role because it can be used as a predictor, nonlinear filter and as a nonlinear model of the dynamical system which can be later used in model-based control algorithms [113,114] in the BMS systems. R–ANNs exhibit dynamic temporal behavior, a property that can be utilized for the prediction of the energy storage system performance parameters in subsequent recharging cycles [111].
Different research works study usability of NARX models for the State-of-Charge (SOC), terminals voltage and State-of-Health (SOH) estimation. The comparison of feed-forward ANN and recurrent ANN to model SOC of a lithium-ion (Li-ion) battery is given in Reference [115]. In Reference [116] NARX model is used to estimate of the lithium-iron-phosphate (LiFePO4) battery voltage using SOC and current load signal, for the electric vehicle. In Reference [45] there is reported SOC and SOH estimation based on dynamically driven NARX recurrent networks designed for both state of charge (SOC) and State of Health (SOH) estimation for LiFePO4 and lithium titanate (LTO) batteries. Authors of Reference [114] describe the research on SOC/SOH monitoring of Li-ion batteries with the hybrid method, combining Electrochemical Impedance Spectroscopy (EIS) models and R–ANNs. Another hybrid method is presented in Reference [117] where wavelet-neural-network-based NARX battery model combined with particle filter estimator is used for the State-Of-Energy (SOE) estimation of the LiFePO4 battery. An interesting approach is discussed in Reference [118] where dual neural network fusion model is used to estimate the relation between Open Circuit Voltage (OCV) and SOC.
The structure of this work is the following. In Section 2 the test stand of VRLA AGM battery has been presented, in Section 3 parameter estimation methods based on NARX model and DP physical model have been discussed. Section 4 presents the main simulation results from DP model (for identified parameters) and NARX model which are subsequently validated and compared against experimental results. Finally, in Section 5, the main conclusions are given.

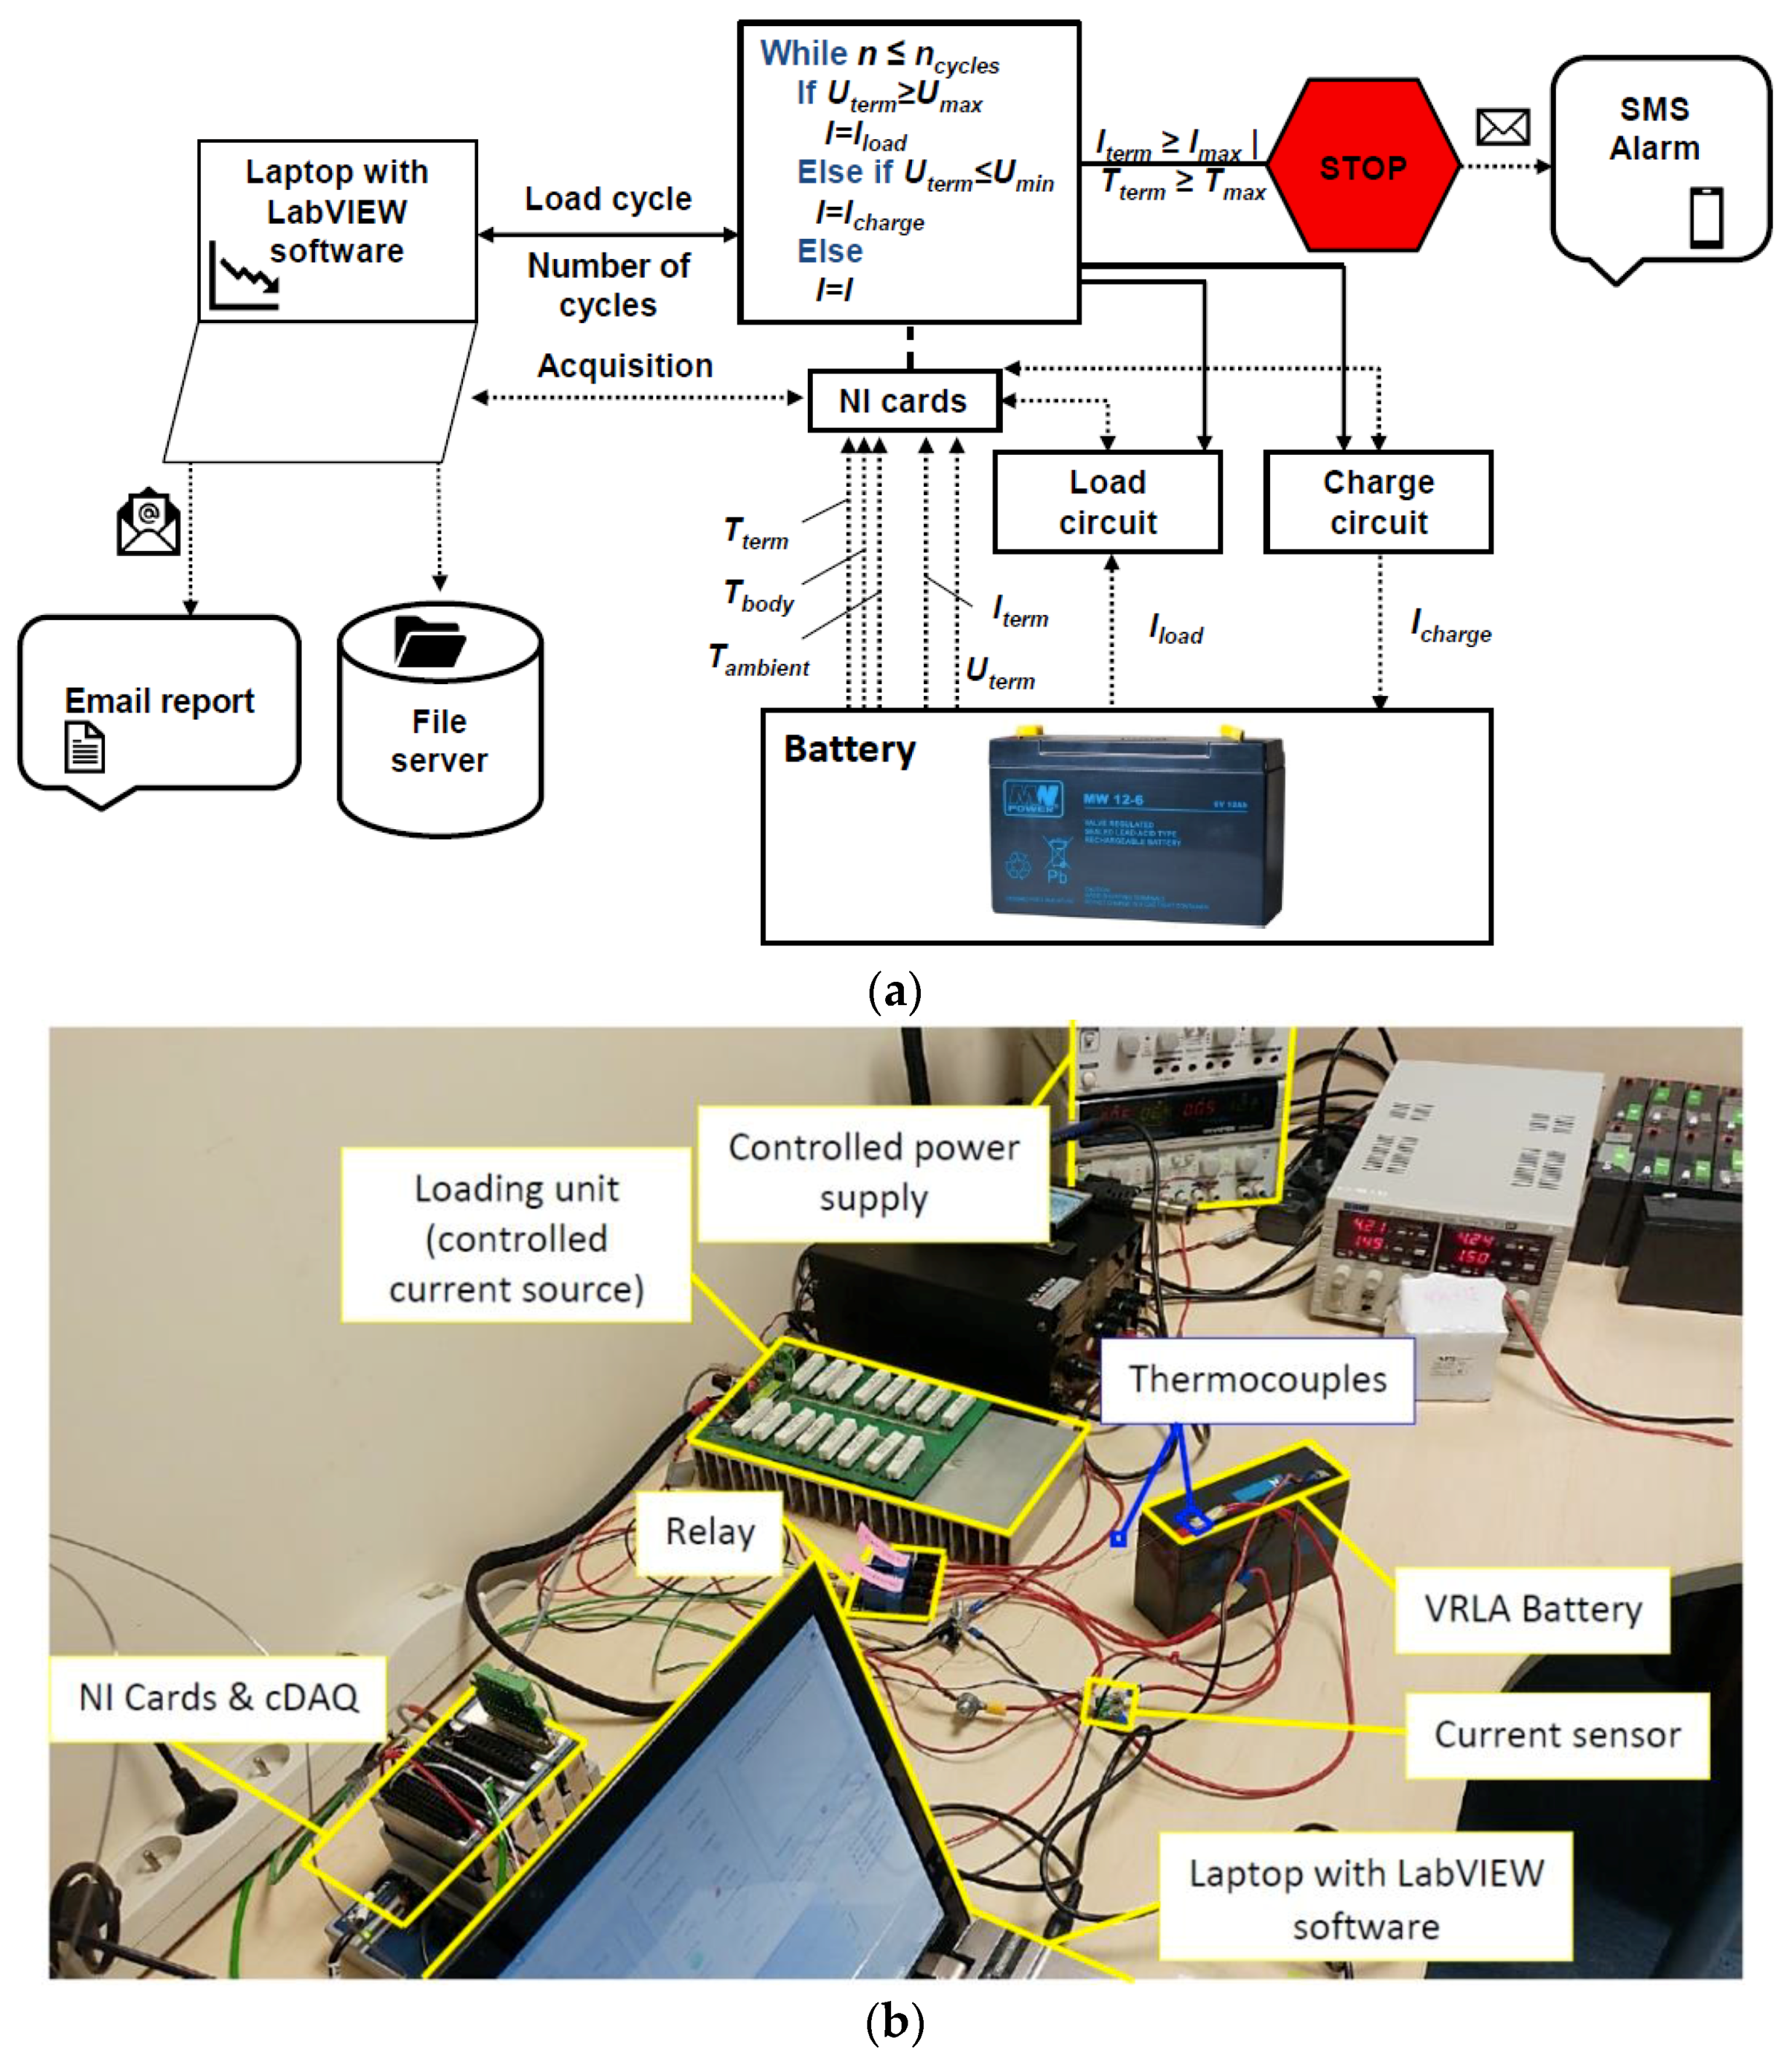
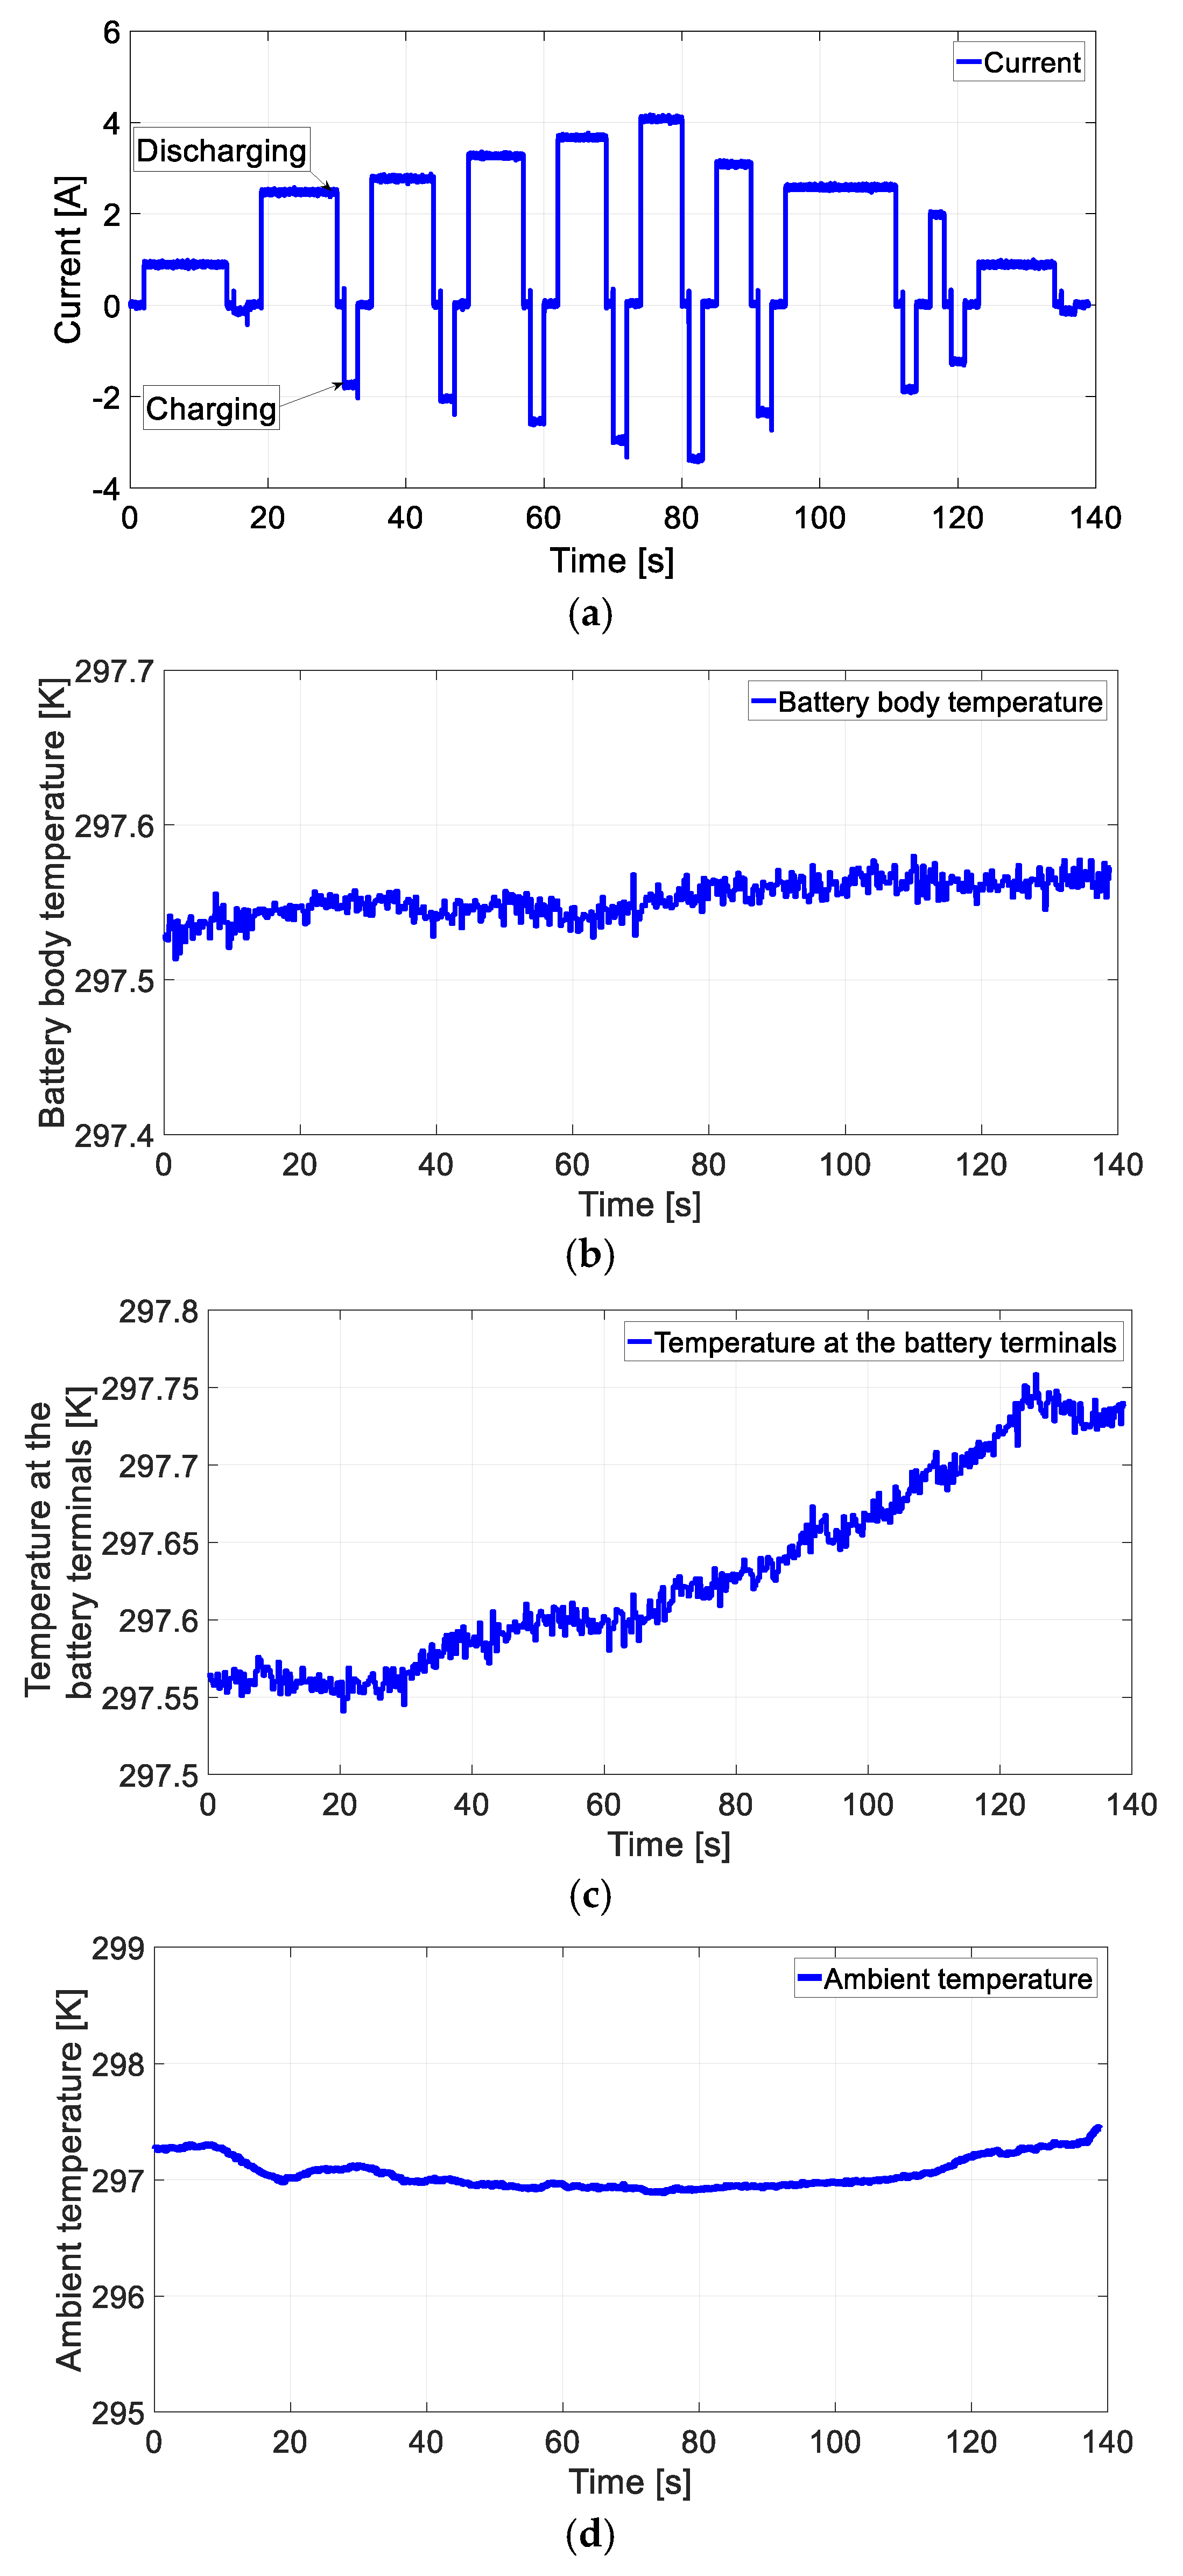
2. Test Stand Description

The following section contains the description of the test stand used to perform research on VRLA AGM battery. The technical specification of VRLA battery cell for experimental work is as follows: Nominal voltage: 6 V; nominal capacity: 7.2 Ah (1 C current was equal to 7.2 A); electrolyte trapped in a separator made of glass mat: Absorbent Glass Mat (AGM); positive electrode material: PbO2; negative electrode material: Pb.
The test stand consisted of the following elements: PC class computer with LabVIEW application for acquiring selected research data with use of National Instruments measurement modules including: NI 9206 for voltage measurement on battery posts, NI 9213 for temperature measurements of the environment, battery terminals, and battery case. Three thermocouples of type K were used to measure the temperatures (Tterm—the temperature at the terminals, Tbody—body temperature, Tambient—ambient temperature, see Figure 1a,b). The test stand also featured a NI 9263 analog output module for control over current load generating unit, which allowed for the generation of pulse load profile. Finally, a NI 9401 digital TTL input/output module was used for relay switching between charge and load circuits. Total electric power of a single load circuit reached around 1 kWe. Use of two custom load generation units allowed for the increase of total electric power to about 2 kWe. Currently, use of up to six load generation units is possible, which can operate together or independently creating independent measurement tracks. The presented test stand is currently being expanded to six independent, parallel measurement tracks for electrochemical batteries and ultracapacitors, which can be tested independently or in one of two hybrid configurations: Parallel without universal bidirectional DC-DC converter such as described in Reference [119] (without ability to control the load distribution between battery and ultracapacitor) and with two-way, universal bidirectional DC/DC converters (possible control overload distribution).
The developed test stand features several safety precautions against temperature, current and voltage exceedance—the stand automatically disconnects the power sources if any of the monitored values exceeds the set limits, which prevents the test stand from damage, which is crucial during long term operational research [29]. The measurement stand allows for email reporting over TCP/IP connection in case of warning or alarm value states, as well as SMS notifications with use of internet SMS gates.
The test stand was designed for long-term operational research measurements of electrochemical batteries, ultracapacitors, and hybrid energy storage systems containing a battery and an ultracapacitor, subjected to pulse work cycles and industrial work cycles, such as HPPC. The stand allows for conduction of wide variety of operational tests, including complete operational wear of the tested battery or ultracapacitor (operational capacity during tests is close to 0 or about several percent of the nominal capacity).
Figure 1a presents the diagram of the tests stand with parameters acquired during measurements of the battery in a pulse work cycle for SOC ranging from 0.8 to 0.2. Figure 1b presents a photograph of the test and control stand for a single controllable current load source.
The measurement cycle was set up so before each measurement, the batter was fully charged, then discharged with one-hour current value to the set SOC value. After reaching the set SOC and SOC ≈ const, the battery was subjected to pulse current values (Figure 2a). In the next stage, the battery was discharged by 10% SOC and the load cycle was repeated. The described cycle was repeated for SOC values ranging from SOC = 0.8 to SOC = 0.2. Figure 2a presents the current characteristic in the pulse cycle. Figure 2b–d show plots for: Battery body temperature (Figure 2b), the temperature at the battery terminals (Figure 2c) in pulse cycle and an ambient temperature (Figure 2d).

3. Battery Parameters Estimation Based on NARX Model and DP Physical Model

The following section contains the description of adopted models: NARX and DP used to estimate voltage values in pulse cycles.

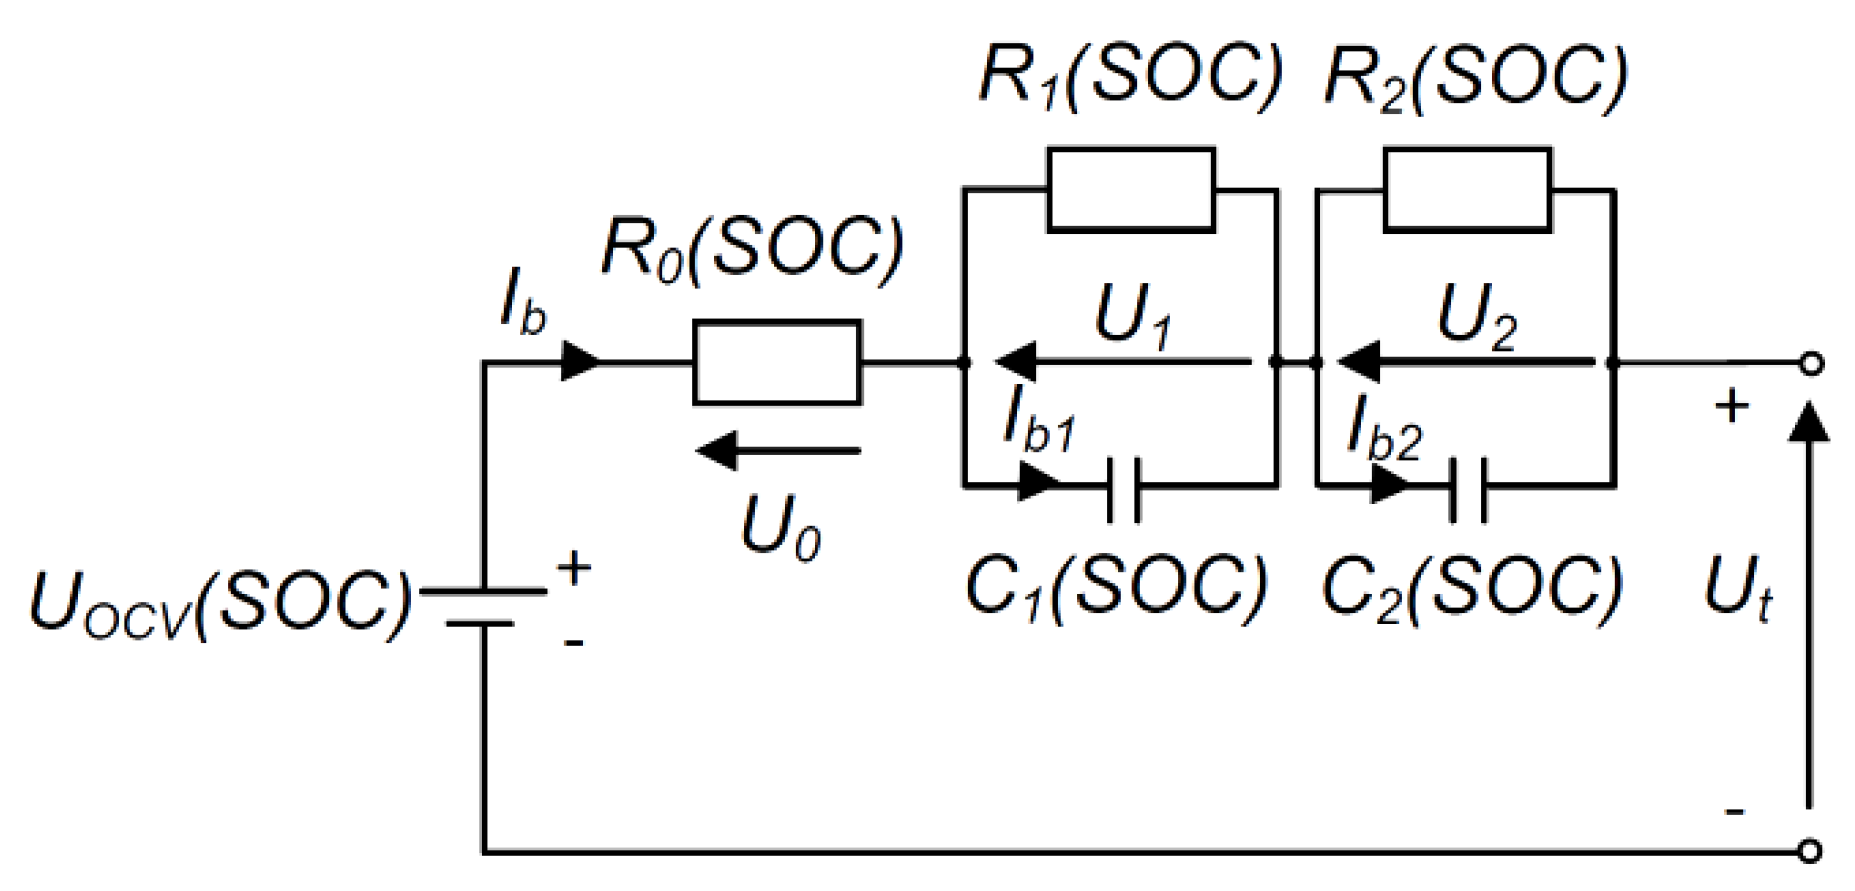
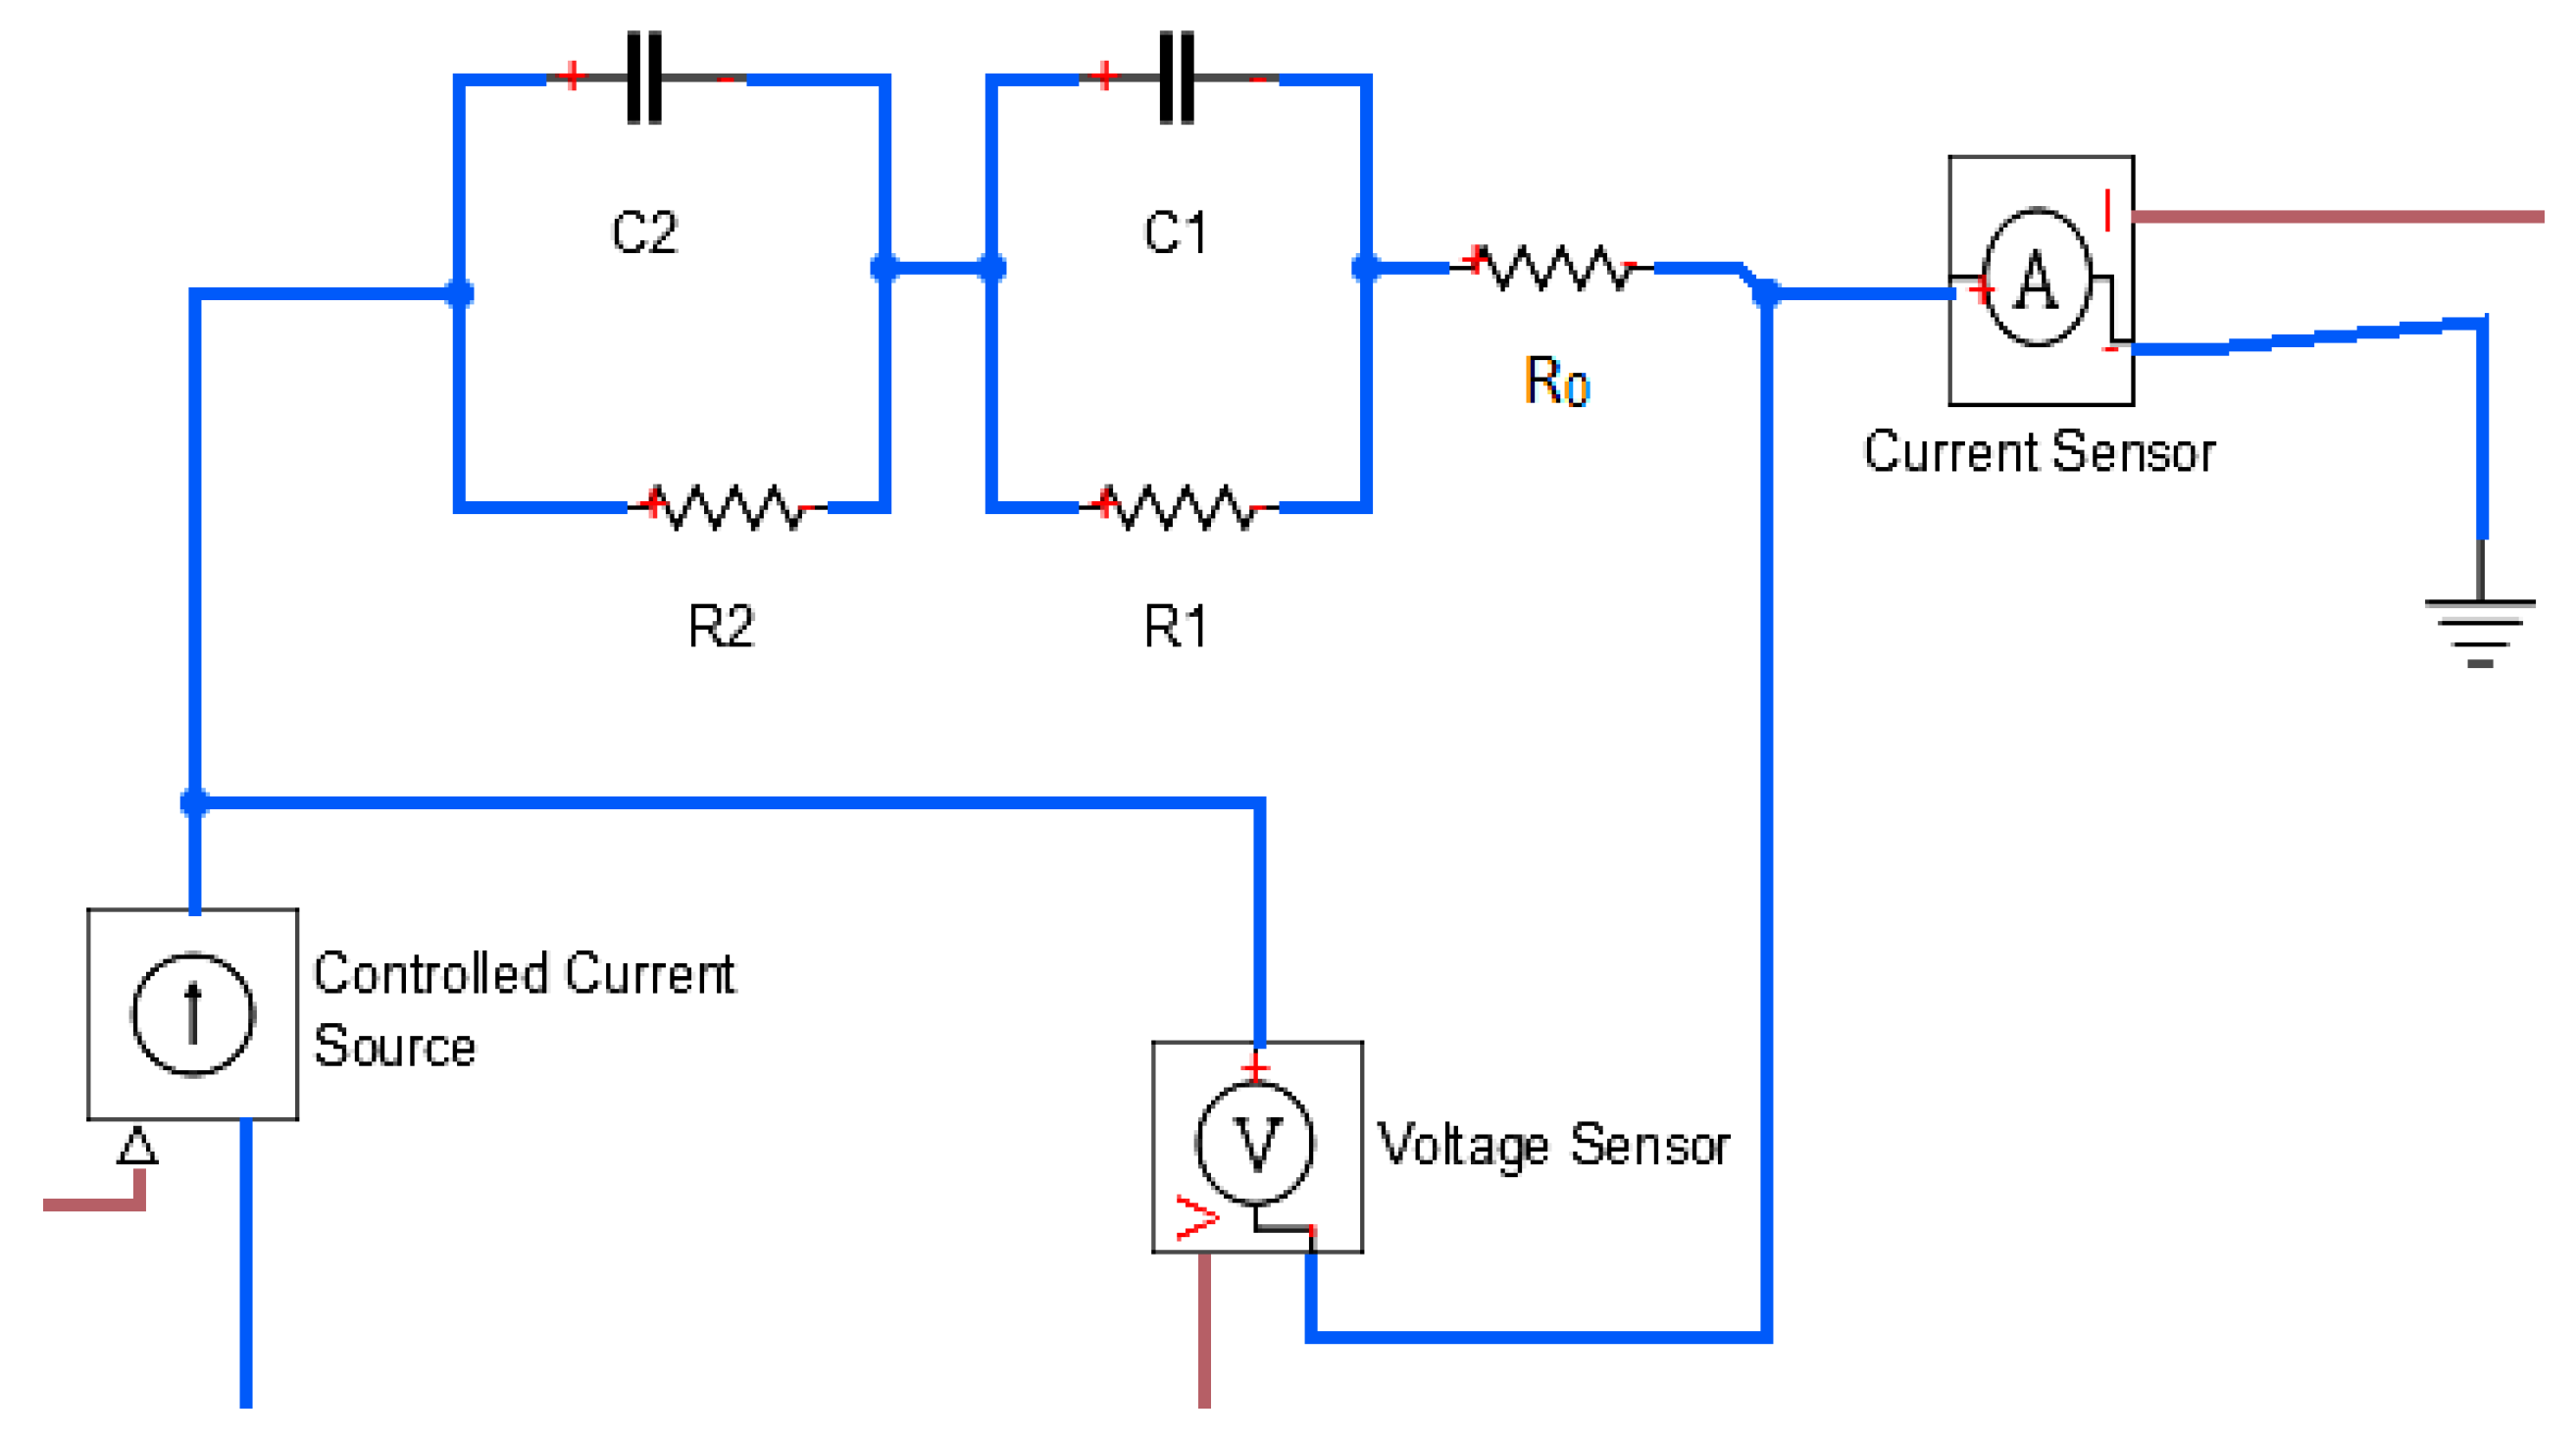
3.1. Dual Polarization (DP) Model Description and Parameters Identification

The following subsection presents the adopted equivalent circuit of VRLA AGM battery model with the internal resistance of the battery included and a model accounting for changes in the activation and concentration polarizations in pulse work cycle, featuring a double RC loop. Figure 3 presents the equivalent circuit of the battery of the adopted double polarization (DP) model with two RC loops.
The diagram presented in Figure 3 contains the following components: Open circuit voltage UOCV(SOC) (UOCV, measured in the work cycle during relaxation stage for the given SOC value when no charging/discharging occurs or is determined during identification); R0(SOC)—internal resistance (ohmic resistance); activation polarization resistance R1(SOC); R2(SOC)—density polarization resistance. The diagram also features capacitances C1(SOC) and C2(SOC), which describe the transitional states during supplying power to the battery or from the battery as well as the activation and density polarizations. Currents Ib1 and Ib2 are the electric currents flowing through C1 and C2. U1 and U2 are the voltage drops occurring in the first and second loop.
Based on analysis of Figure 3, an equation describing the behavior of the DP model can be written:
{ U ˙ 1 = ( R 1 C 1 ) 1 U 1 + C 1 1 I b U ˙ 2 = ( R 2 C 2 ) 1 U 2 + C 2 1 I b 0 = R 0 1 U 0 + I b U t = U O C V U 1 U 2 U 0
The battery’s SOC is the ratio of its effective capacity Qbat to nominal capacity Qn described as:
S O C ( t ) = S O C 0 ± Q b a t Q n 1 = S O C 0 ± Q n 1 0 t η c ( I b ) I b ( t ) d t  
where SOC0 is the initial state of charge for time t = t0, ηc is the columbic efficiency, Ib is the battery charging (–)/discharging (+) current at time t.
The open circuit voltage can be expressed as follows:
U O C V = E M F ( S O C ) = E M F min + Δ U t S O C = E M F min + ( E M F max E M F min ) S O C  
The EMFmin and EMFmax values in Equation (3) can be determined on the basis of experiments from the following equation:
U 0 = E M F ± I b R 0 E M F = U 0 I b R 0
where R0 is the internal resistance of the battery.
Based on the experimental research for I = Ich = Idch = 1 C the value of R0 can be calculated as follows:
R 0 = ( | U c h | | U d c h | ) / 2 I b
where Uch is the charging voltage and Udch is the discharging voltage.
Dependencies Equations (3)–(5) present simple, technical, rough methods for estimating battery parameters. Their advantage is simplicity and rapid calculation but the drawback is low accuracy.
For VRLA batteries, the linear EMF(SOC) relationship can be roughly assumed, in the case of lithium batteries, these characteristics will be non-linear [60,63]. In further analyses, only EMF(SOC) characteristics derived from the experimental research were considered.
An alternative to the simple estimation of the dependencies (3)–(5) are other methods, e.g., an identification by using the DP and NARX models presented in Section 3.1.1 and Section 3.2, respectively.

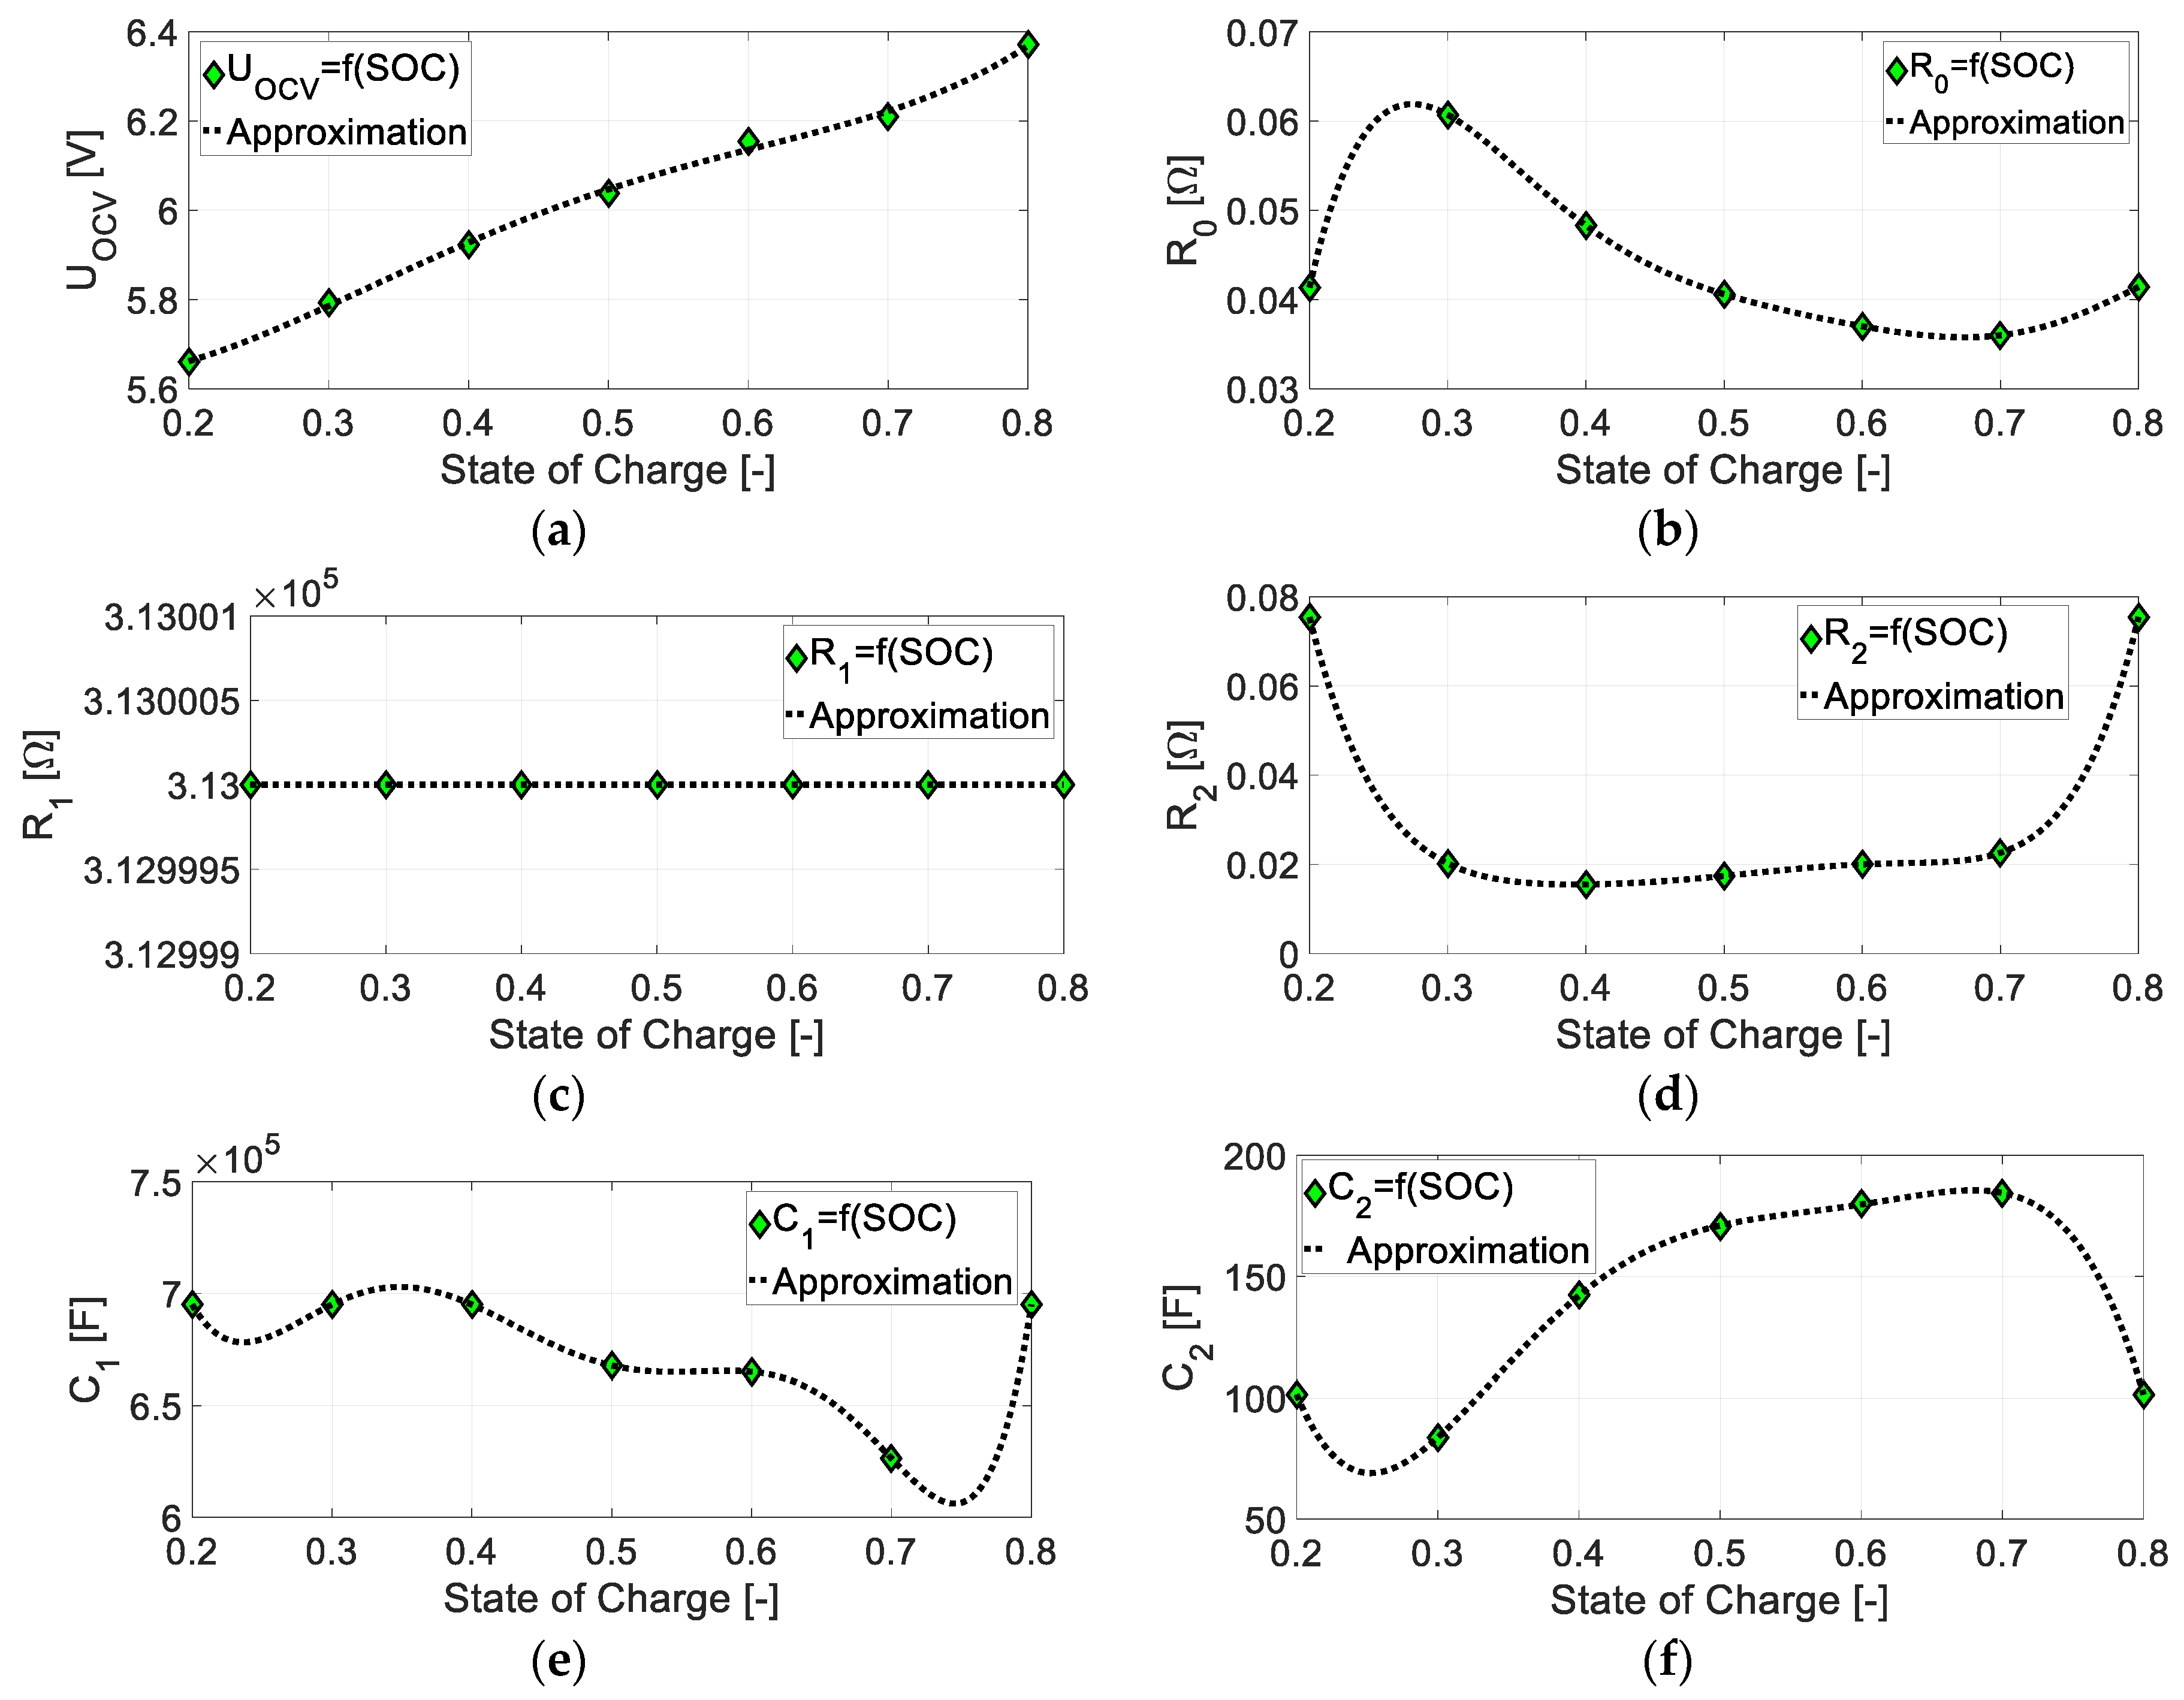
3.1.1. Parameters Identification of DP Model

In the set of differential equations representing the model structure consisting of two RC loops and resistance R0 connected in series and electromotive force source, a total of six parameters are present (R1, R2, C1, C2, R0, UOCV) that require identification. In the DP model project, the differential equations are generated automatically by Matlab Simscape software (a fragment of the project is presented in Figure 4) or they can be designated using traditional methods.
Current values acquired during measurements is used as input for the double RC loop model (DP). The voltage values at battery terminals are the result of the differential equations. Based on the assumed values of the six model parameters (R1, R2, C1, C2, R0, UOCV) the calculated voltage will differ from the voltage acquired during measurements.
The goal of identification is to find the set of the six parameters (R1, R2, C1, C2, R0, UOCV) so that the calculated voltage values differ as little as possible. The measure of identification error is the value of integral of squared error e2 = (y* − y(Θ, x, u))2 between the value of calculated function y(Θ, x, u) and obtained from measurements y*. The identification process is conducted with use of “nonlinear data-fitting” procedure, which minimizes the value of integral J, presented in dependency (6), of the squared error e2 by iterative adaptation of ΔΘ value of parameters (R1, R2, C1, C2, R0, UOCV), ΔΘ = [ΔR1, ΔR2, ΔC1, ΔC2, ΔR0, ΔUOCV] with use of J gradient and hessian H.
J = t 0 t e n d e 2 d t = t 0 t e n d ( y * y ( θ , x , u ) ) 2 d t  
Knowing that:
J θ = t 0 t e n d 2 e y ( θ , x , u ) θ d t
Function J reaches minimum when the following condition fulfilled:
J = min J ( θ + Δ θ ) J ( θ ) Δ θ = J θ Δ θ + 1 2 2 J θ 2 Δ θ 2 = 0 Δ θ = 2 J θ 2 J θ 2 = 2 J H  
To modify the values of parameters Θ = [R1, R2, C1, C2, R0, UOCV] the Levenberg–Marquardt error back propagation method was used, which uses properly weighted approximations of gradient of the minimized function J and its hessian H with use of Jacobian calculated at end of each iteration based on the obtained change of error Δe, related to vector of change of parameters ΔΘ.
Adaptation of parameter values ΔΘ is conducted iteratively until the stationarity of the integral value J of root mean squared error e2 is obtained, meaning a minimum was reached. Stationarity is reached when the change of the relative value |ΔJ/J| < ε. In the research the value assumed was ε = 1 × 10⁹.
The identification procedure also requires a correct assumption of initial parameters Θ0 = [R10, R20, C10, C20, R0, UOCV0], as in gradient methods a risk of founding a suboptimal local solution instead of the optimal solution exists. In the conducted research the assumed values were equal to order of magnitude of typical values for the given battery type Θ0 = [R10 = 1 × 101, R20 = 1 × 10⁻², C10 = 1 × 101, C20 = 1.0, R0 = 1 × 10⁻², UOCV0 = 6.0].
Furthermore, the identification procedure has a condition imposed, that all values of parameter vectors have to be positive.
The identified parameters of the DP model for SOC values ranging from 0.2 to 0.8 was described by a polynomial function in the following form:
R O ( S O C ) = A R 0 S O C 6 + B R 0 S O C 5 + C R 0 S O C 4 + D R 0 S O C 3 + E R 0 S O C 2 + F R 0 S O C 1 + G R 0 R 1 ( S O C ) = A R 1 S O C 1 + B R 1 R 2 ( S O C ) = A R 2 S O C 6 + B R 2 S O C 5 + C R 2 S O C 4 + D R 2 S O C 3 + E R 2 S O C 2 + F R 2 S O C 1 + G R 2 C 1 ( S O C ) = A C 1 S O C 6 + B C 1 S O C 5 + C C 1 S O C 4 + D C 1 S O C 3 + E C 1 S O C 2 + F C 1 S O C 1 + G C 1 C 2 ( S O C ) = A C 2 S O C 5 + B C 2 S O C 4 + C C 2 S O C 3 + D C 2 S O C 2 + E C 2 S O C 1 + F C 2 U O C V ( S O C ) = A U O C V S O C 4 + B U O C V S O C 3 + C U O C V S O C 2 + D U O C V S O C + E U O C V
A similar description of the dependency (9) of the general form of parameter polynomial in substitute diagram of the battery with the use of iteration-approximation method was presented in Reference [56]. The work [85] contains the description of DP model parameters identified with the general form of the polynomial equation.
Table 1 contains the coefficient values of the polynomial of the identified parameters: R1(SOC), R2(SOC), C1(SOC), C2(SOC), R0(SOC) and UOCV(SOC) presented in dependency (9).
Figure 5 presents graphs of the identified parameters, as follows: UOCV = f(SOC) (Figure 5a), R0 = f(SOC) (Figure 5b), R1 = f(SOC) (Figure 5c), R2 = f(SOC) (Figure 5d), C1 = f(SOC) (Figure 5e) and C2 = f(SOC) (Figure 5f).

3.2. NARX Model Description

NARX model is the nonlinear extension of the linear AutoRegressive with eXogenous input (ARX) model, which is commonly used in time-series modeling [120]. The NARX model is an input-output recursive model where the current output is described with a nonlinear functional expansion of lagged input and output signals, plus additive noise. Several classes of models have been used for NARX identification, e.g., radial basis functions [121], multilayer perceptrons (MLP) [122], or polynomial models [123].
In the case considered in this paper, there is given an electrochemical energy storage system in the form of a VRLA AGM battery, that can be recharged in pulse cycles at the laboratory stand. Measured are: The voltage at the terminals Uterm(t), current load Iload(t), ambient temperature Tambient(t), the battery body temperature Tbody(t) and the temperature at battery terminals Tterm(t).
The voltage signal can be predicted using the delayed voltage signal, current load signal, and measured temperature signals. As it was described in References [116,117], the addition of measurements of the temperature of the battery terminals, and battery body to the identified model can improve its prediction properties. Therefore, the defining equation of the nonlinear part of the NARX model of the considered VRLA battery can be written as follows:
U t e r m   N N ( k ) = f ( U t e r m N N ( k 1 ) , , U t e r m N N ( k n U ) , I l a o d ( k ) , . , I l a o d ( k n I )      T a m b i e n t ( k ) , , T a m b i e n t ( k n a ) , T b o d y ( k ) , , T b o d y ( k n b ) ,      T t e r m ( k ) , , T t e r m ( k n t ) )
where: UtermNN(k) is the NARX estimated output (voltage) signal at step k, nu is the number of delayed steps of output (poles) signal, nI, na, nb, nt are the number of delayed steps of input signals (current load, ambient temperature, battery body temperature, temperature at battery terminals, respectively).

3.2.1. NARX-ANN Architecture

In the considered case, the voltage signal estimation of a VRLA AGM battery can be defined as follows: Under given assumptions, the problem is to predict changes of the voltage at the terminals in pulse cycles with NARX model using the recurrent artificial neural network, based on performed measurements.
In the research there were used Recurrent Artificial Neural Networks (R–ANN) where connections between units form a directed cycle. Due to the internal feedback loops, such networks exhibit dynamic temporal behavior, a property that can be utilized for the prediction of the voltage signal of the energy storage system in pulse cycles. With properly chosen battery data, system parameters and operating conditions, R–ANN model can be used in prediction to some extent a battery performance under a variety of operating conditions.
Therefore, taking into consideration the NARX model Equation (10), the recurrent neural network inputs were chosen as follows:
  • UtermNN(k − 1), ..., UtermNN(knu): Previous values of outputs on which the actual output depends. These inputs are generated in the recurrent loop with tapped delay lines.
  • Iload(k), ..., Iload(knI): Previous and delayed values of the current load signal.
  • Tambient(k), ..., Tambient(kna): Previous, delayed values of the ambient temperature.
  • Tbody(k), ..., Tbody(knb): Previous, delayed values of the battery body temperature.
  • Tterm(k), ..., Tterm(knt): Previous, delayed temperature at battery terminals.
Figure 6 presents a recurrent architecture of the considered NARX artificial neural network (NARX-ANN), with parameters of Equation (10) chosen as nu = 1, nI = 1, na = 1, nb = 1, nt = 1.
Presented NARX-ANN has one nonlinear hidden layer (Figure 6) with nonlinear neurons described by a sigmoidal activation function:
y ( 1 ) ( j ) N L ( k ) = f ( 1 ) ( j ) N L ( x ( 1 ) ( j ) N L , k ) = tan s i g ( x ( 1 ) ( j ) N L , k ) , f ( 1 ) ( j ) N L [ 1 , 1 ]  
where y ( 1 ) ( j ) N L ( k ) is the output signal of the j-th neuron in the 1st layer, and x ( 1 ) ( j ) N L ( k ) is the input signal to the j-th neuron in 1st layer, defined as
x ( 1 ) ( n ) N L ( k ) = b ( 1 ) ( n ) + w ( 1 ) p + 1 , n y ( 2 ) L ( k 1 ) + i = 1 p w ( 1 ) i , n x i ( k )  
and n is the number of neurons in nonlinear layer, p is the number of neuron inputs in nonlinear hidden layer, w ( 1 ) i , j is the weight of the i-th input to j-th neuron in the 1st layer, xi is the i-th input to the network (with delayed inputs), b ( 1 ) ( n ) is the threshold offset of the n-th neuron in the 1st layer. The second term of Equation (12) describes the recurrent feedback loop with tapped delay line from output to input, in case when nu = 1.
The output of the network is y ( 2 ) L ( k ) and it is also the output signal from 2nd layer, which is a linear output layer (Figure 6), with one neuron described by a linear activation function as follows
y ( 2 ) L ( k ) = f ( 2 ) L ( x ( 2 ) L , k ) = x ( 2 ) L ( k ) , f ( 2 ) L R
where x ( 2 ) L ( k ) is the input signal to the neuron in 2nd layer, defined as
x ( 2 ) L ( k ) = b ( 2 ) + i = 1 n w ( 2 ) i , 1 y ( 1 ) ( i ) N L ( k )  
and, w ( 2 ) i , 1 is the weight of the i-th input to neuron in 2nd layer, b ( 2 ) is the threshold offset of the neuron in 2nd layer.

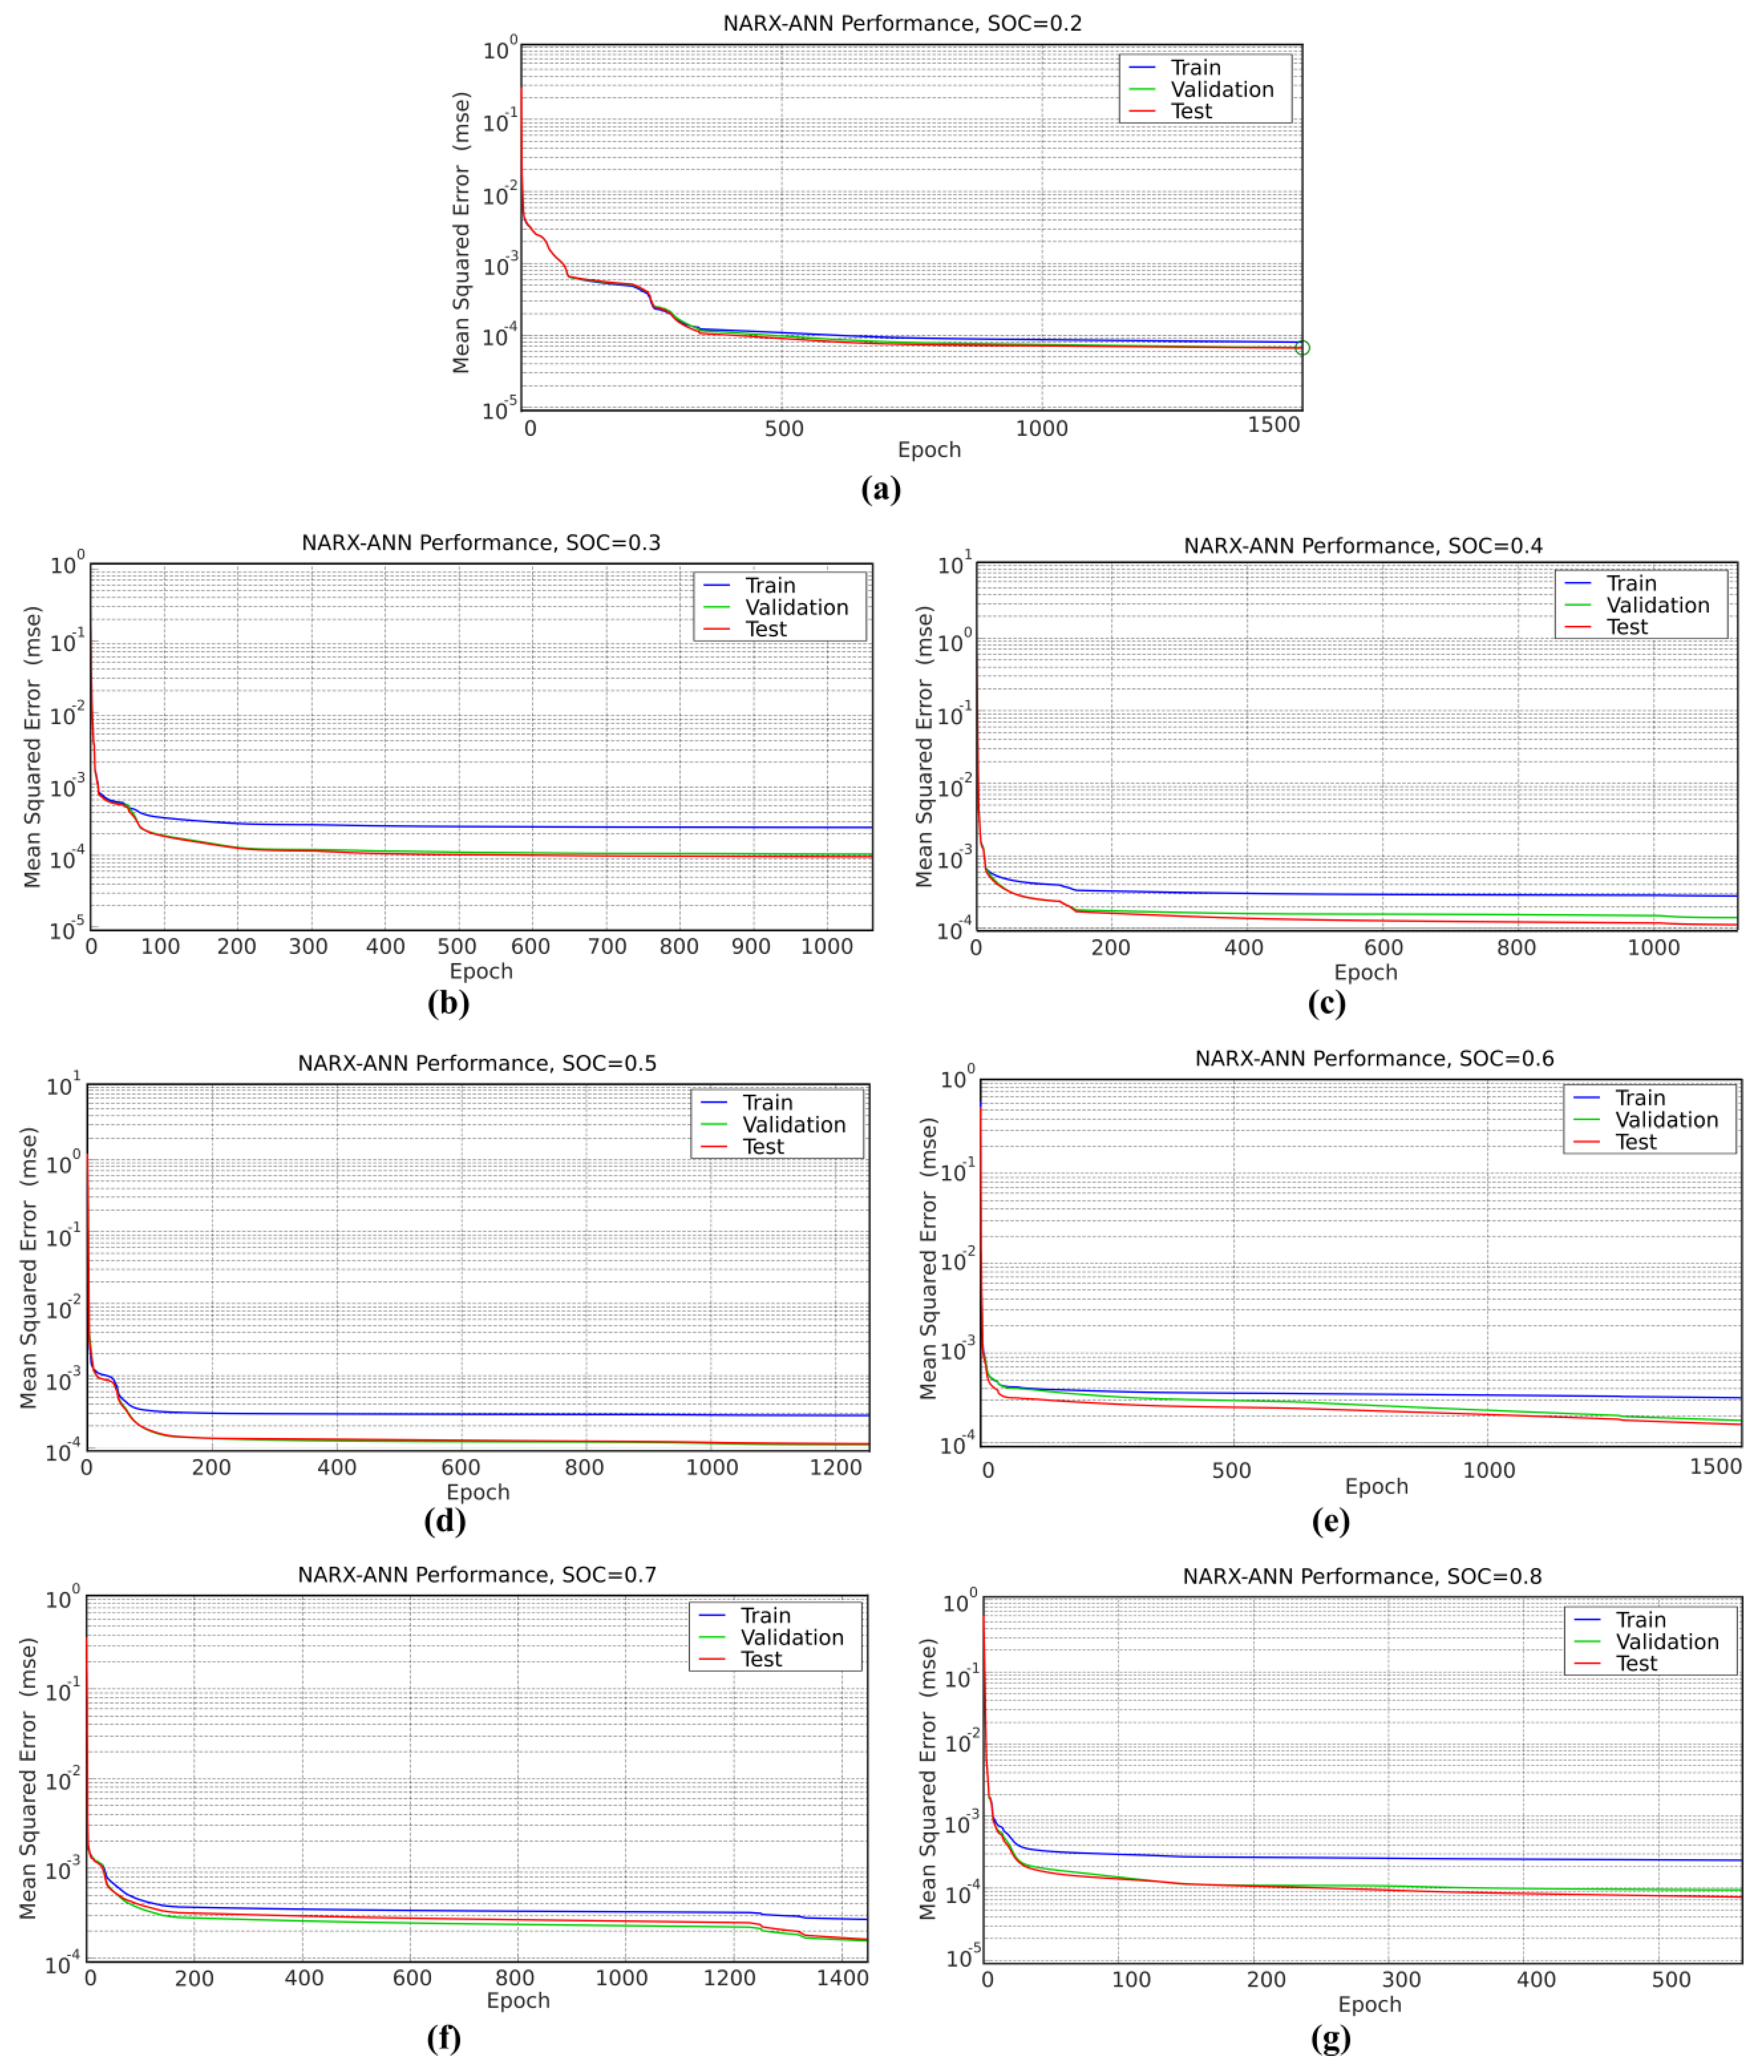
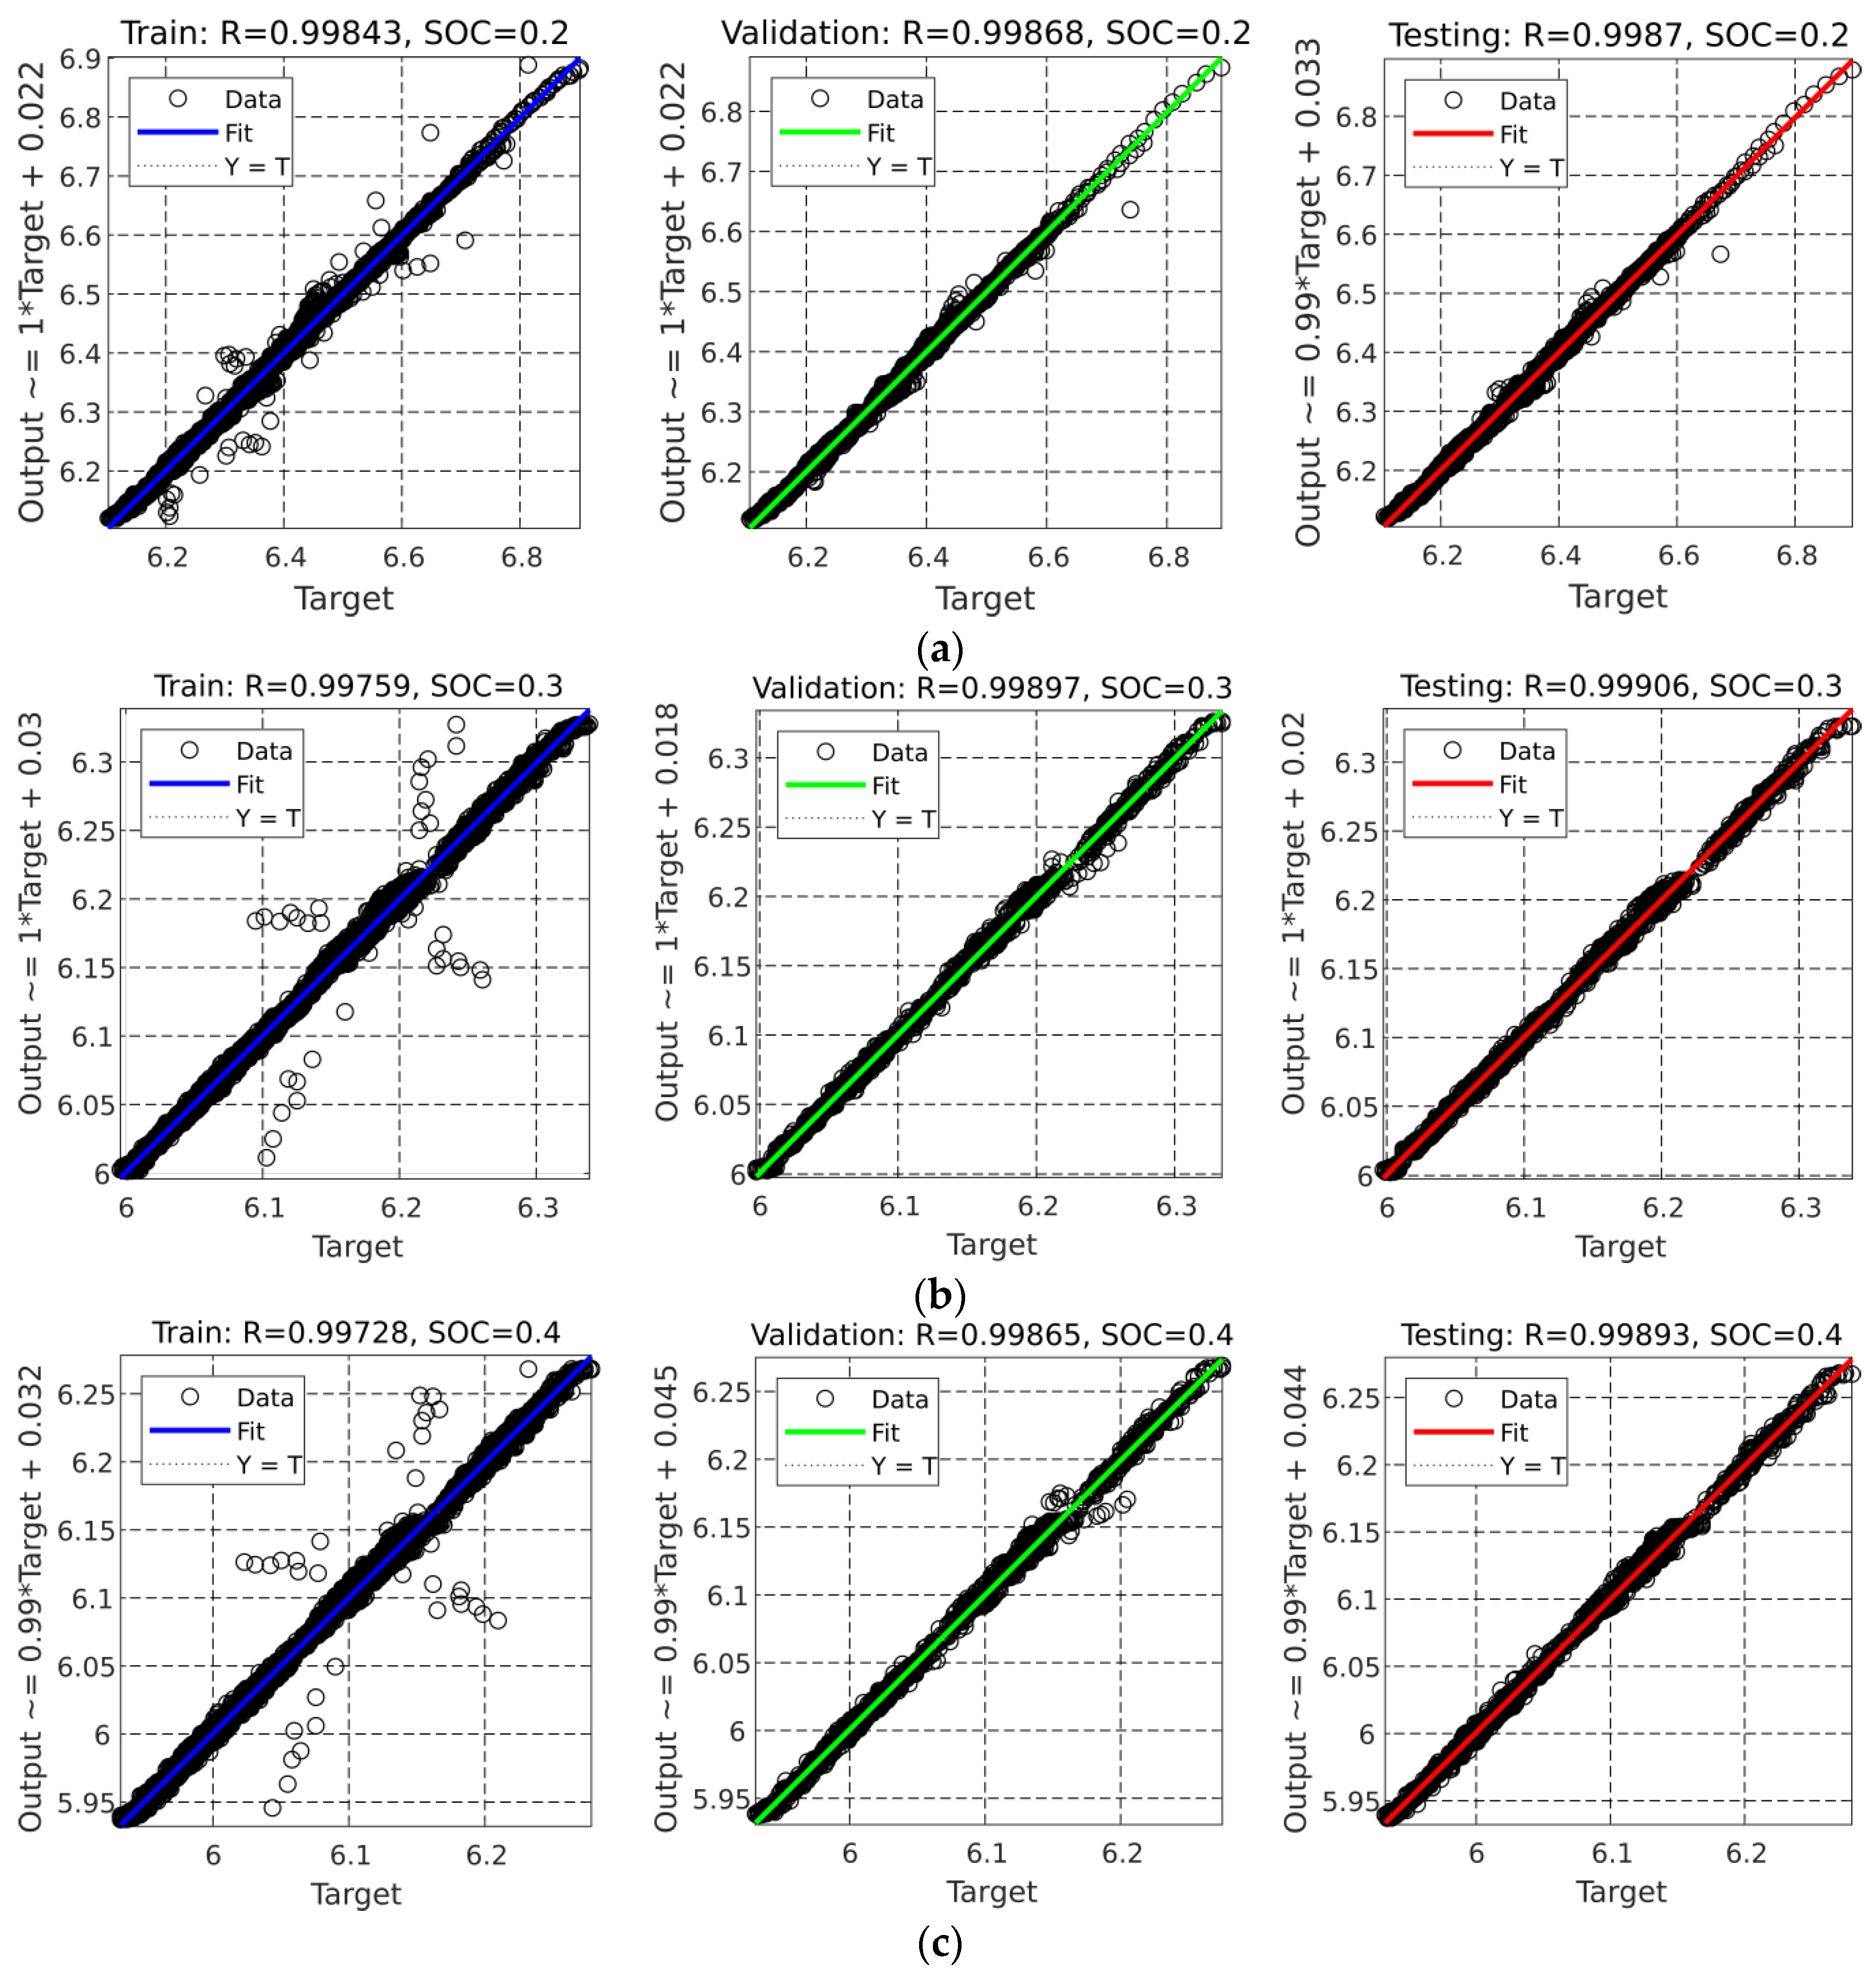
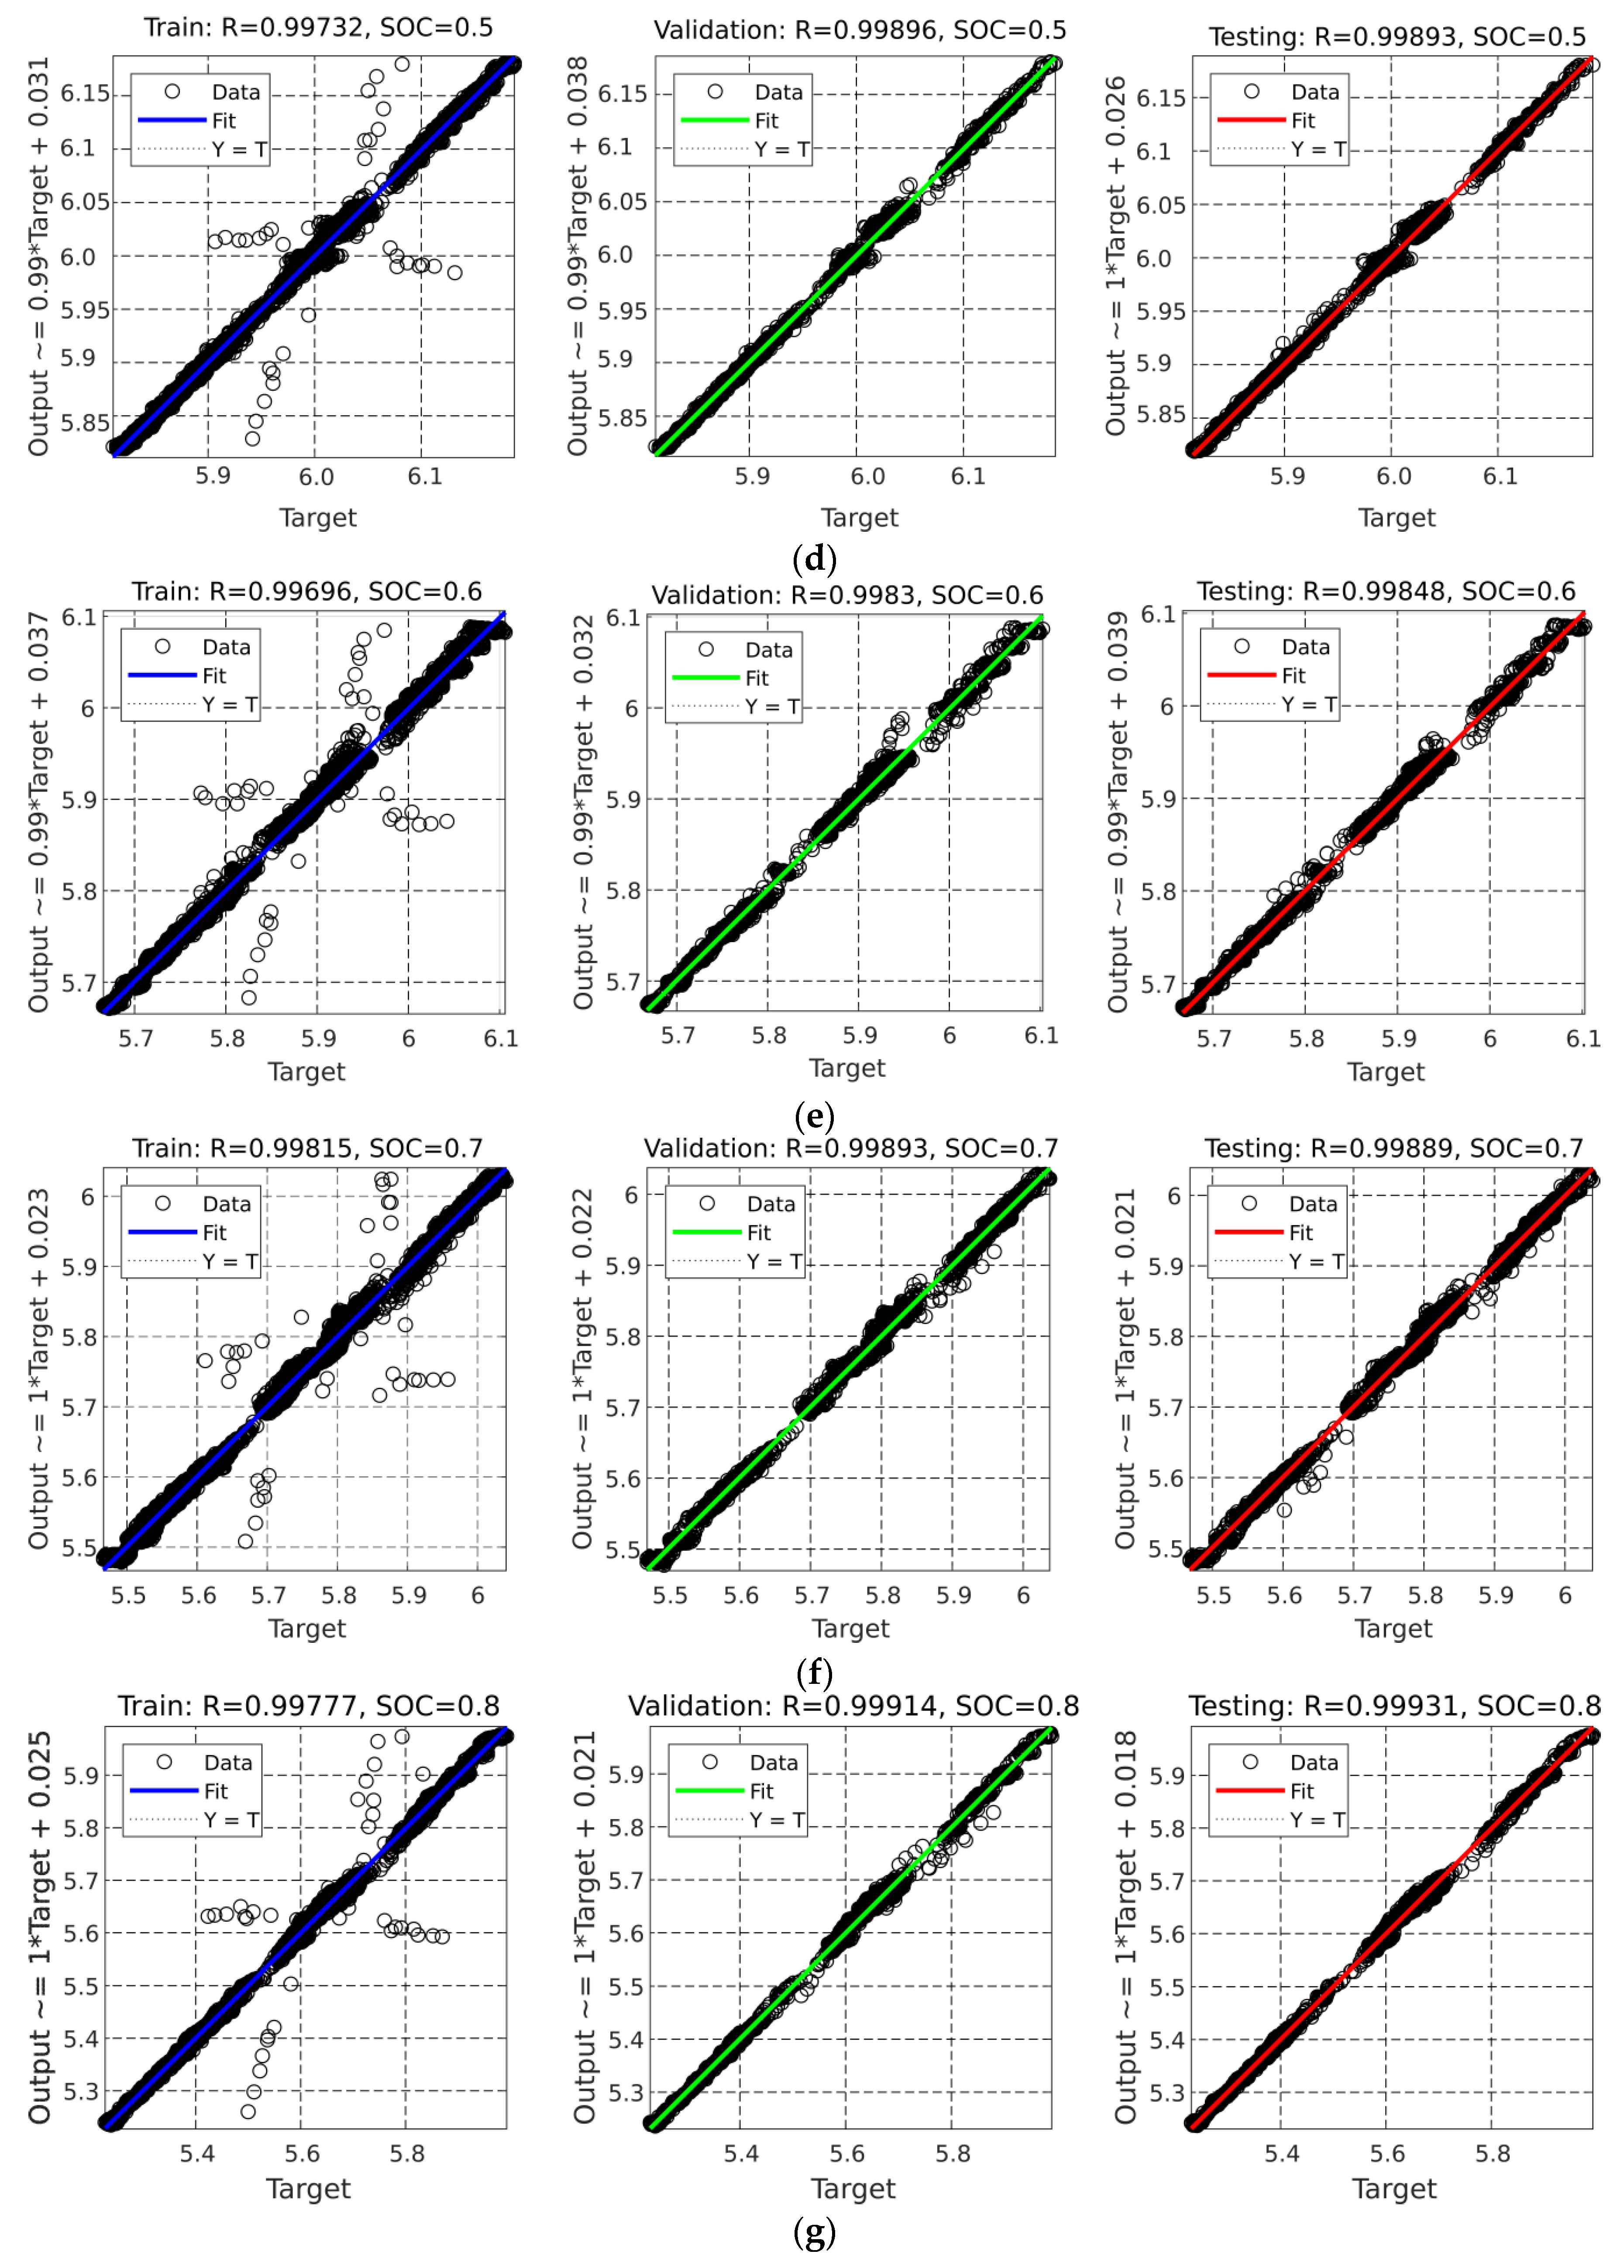
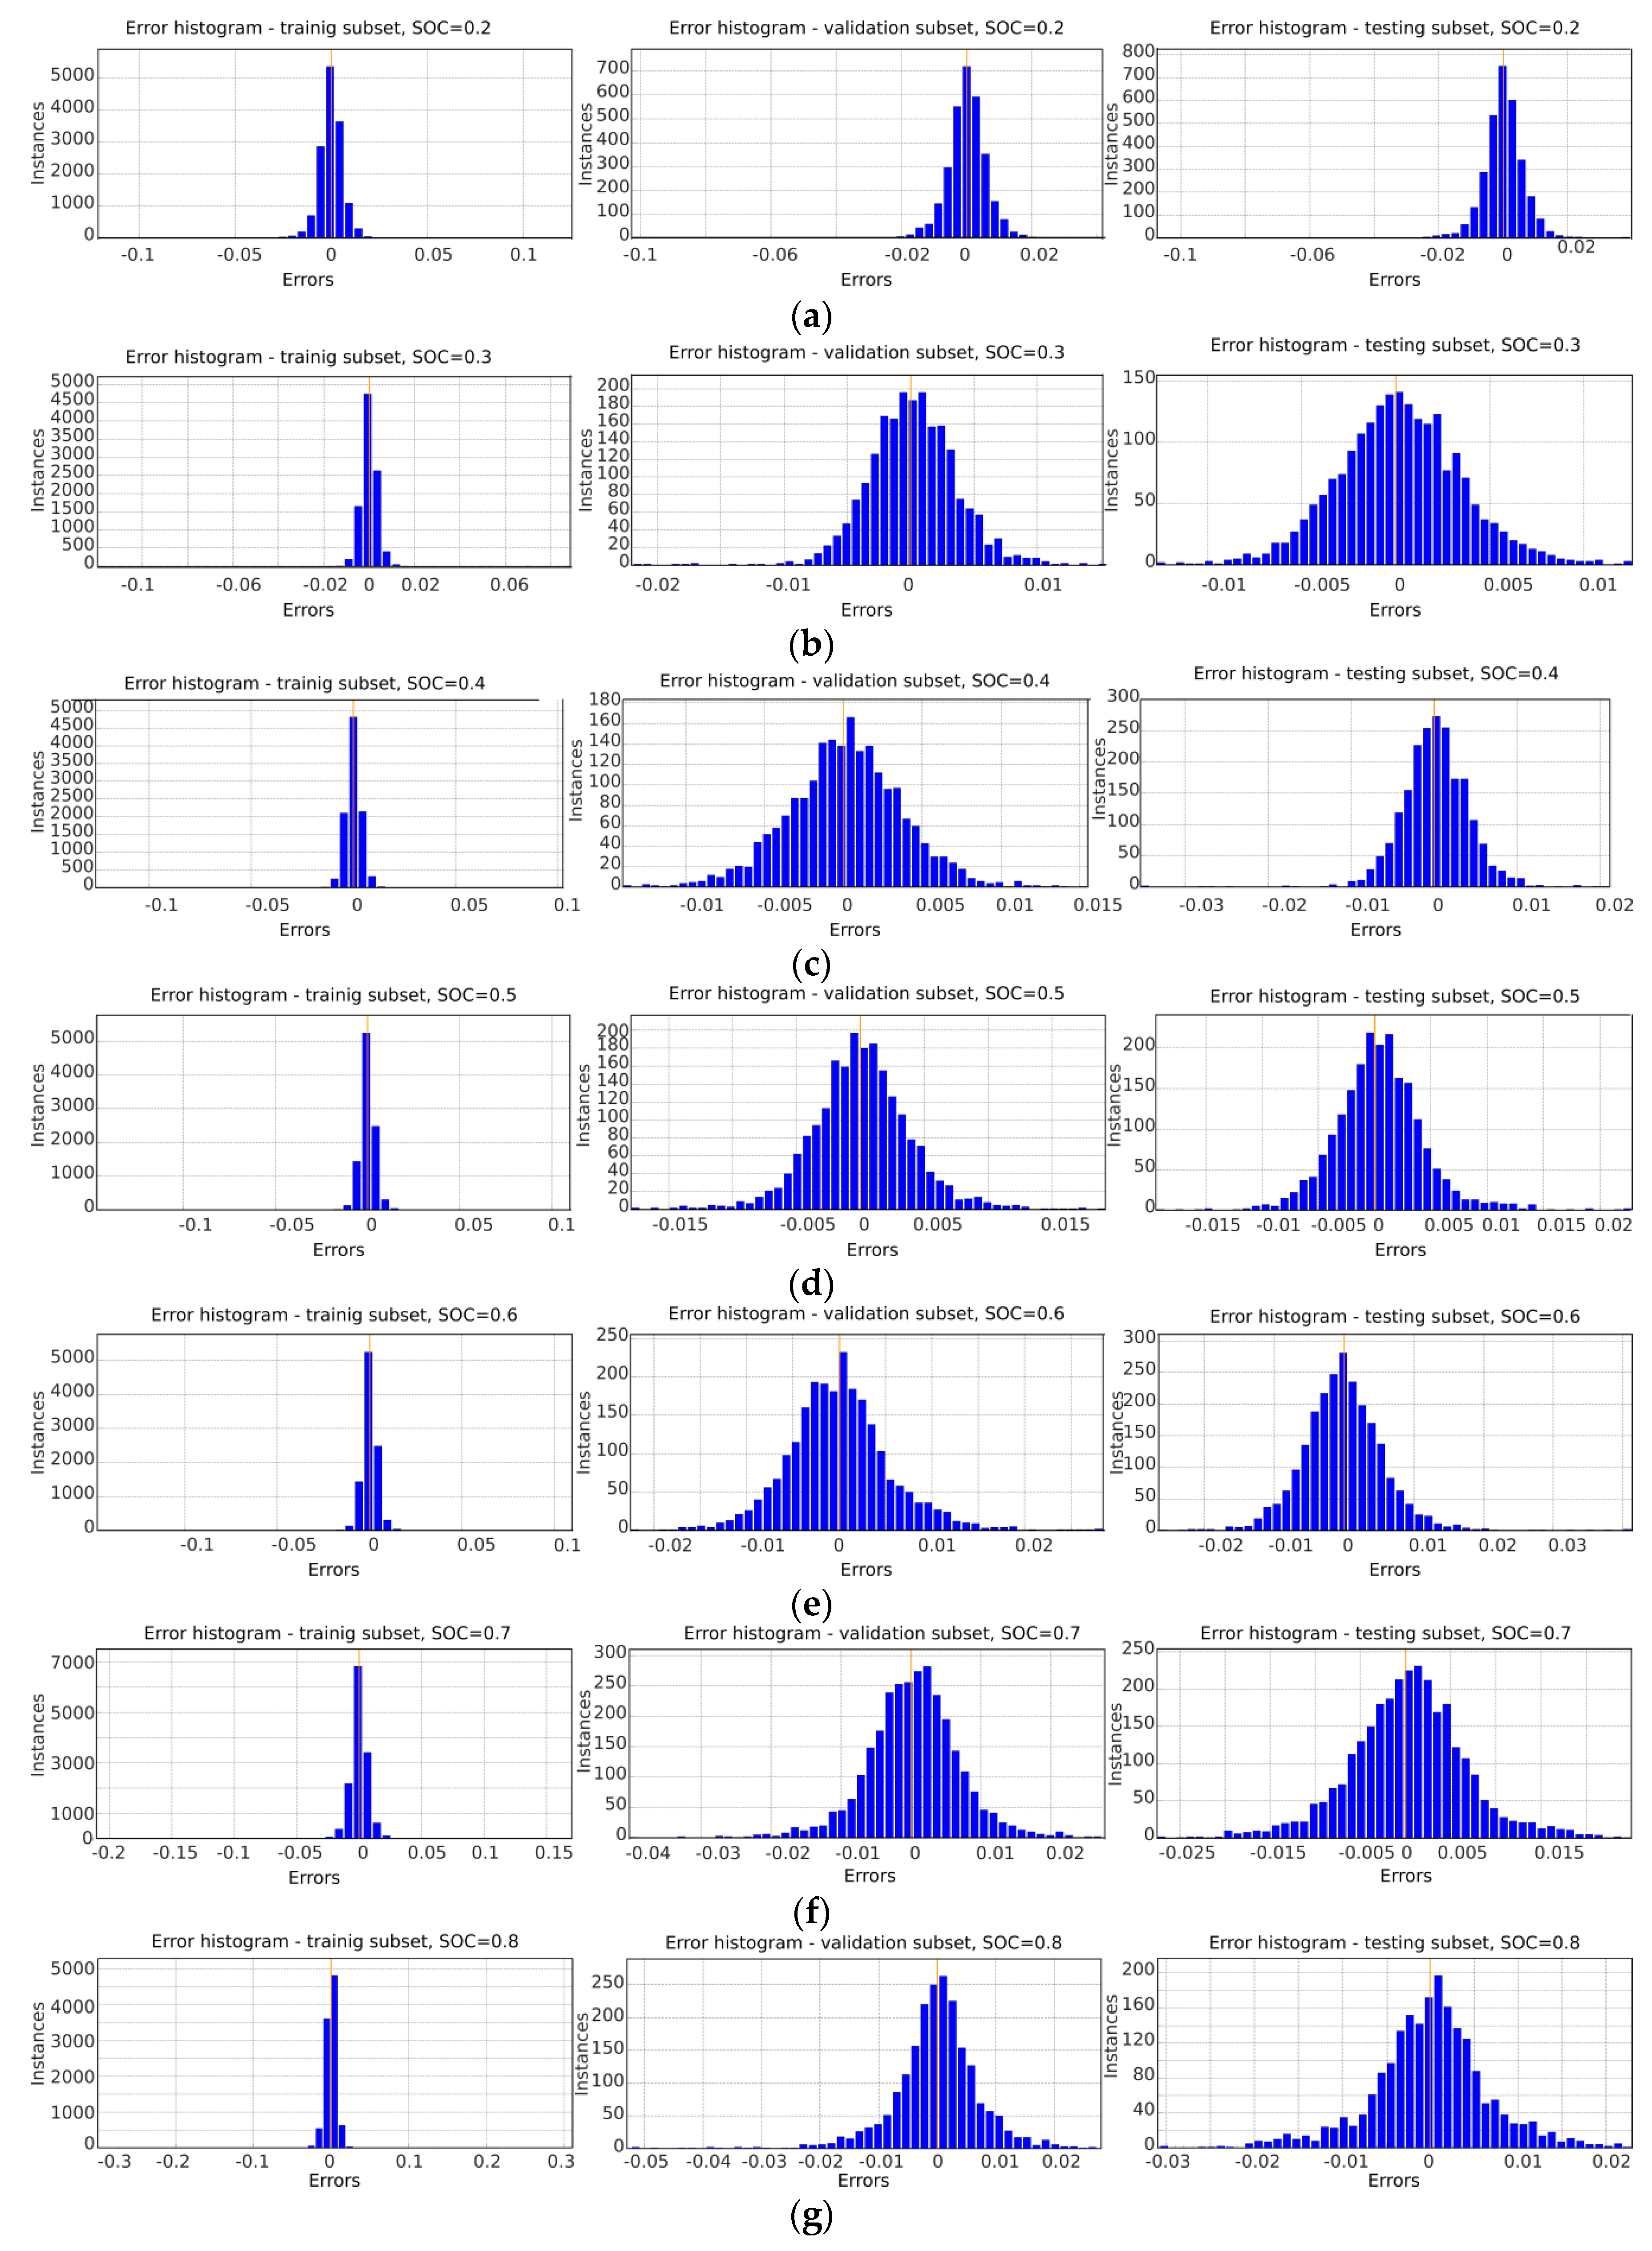
3.2.2. NARX-ANN Training

For the purpose of training and evaluating of NARX-ANN models, the error of VRLA battery voltage estimation was calculated as follows
e ( k ) = y N N ( k ) y ( k )  
where: y(k) = Uterm(k), yNN(k) = UtermNN(k), k is the sample number.
During training, the performance function of NARX-ANN model was chosen as a Mean Squared Error (MSE), calculated as:
E N N = M S E = 1 N k = 1 N [ e ( k ) ] 2  
where: N is the number of data samples.
During the evaluation, there was investigated the efficiency of the NARX-ANN models trained using the Levenberg–Marquardt algorithm [124,125], that is based on the first three terms of Taylor’s series approximation of the performance function. In the Levenberg–Marquardt method, the direction of improvement and the step coefficient are not determined, as in the case of the steepest descent or conjugate gradients algorithms. The Levenberg–Marquardt method is a special case of the variable metrics method [125] where changes in weights in the i-th training iteration are determined according to the equation
W ( i + 1 ) = W ( i ) H ( W ( i ) ) 1 E N N ( W ( i ) )  
where the weight vector is in the form of following vector W = [ w 1 , , w n W ] T , and n W is the number of neural network weights.
The Levenberg–Marquardt algorithm, used for the selection of weights in the NARX-ANN during training, required knowledge of the gradient values of the objective function relative to each of the network weights. To determine it in a multi-layer network, the backpropagation algorithm [126] was used, where the values of the elements of the gradient vector E N N ( W ( i ) ) in (17) are calculated in the direction from the output layer to the input layer of the NARX-ANN model.
As a result of using the backpropagation algorithm, the vector of the first derivatives of the performance function with respect to weight changes is determined as follows:
E N N ( W ( i ) ) = [ E N N ( W ( i ) ) w 1 E N N ( W ( i ) ) w n W ] T  
Moreover, the Levenberg–Marquardt algorithm requires the knowledge of Hessian matrix H ( W ( i ) ) calculated as
H ( W ( i ) ) = 2 E ( W ) W 2 = [ 2 E ( W ) w 1 w 1 2 E ( W ) w 1 w n W 2 E ( W ) w n W w 1 2 E ( W ) w n W w n W ]  
In the Levenberg–Marquardt method, a positive definite Hessian matrix (19) is approximated numerically [124,125].
The NARX-ANN models were trained iteratively in the batch mode, in which in every training iteration, weights and biases were updated after all the network inputs and outputs from chosen dataset were presented [124]. For each NARX-ANN, all weights and biases were initialized using the Nguyen–Widrow initialization procedure [127]. The network architecture was based on the previous research [30,110] for energy storage systems and preliminary tests, showing that 10 neurons in the hidden layer, with input delays chosen as nu = 1, nI = na = nb = nt = 2 shall give satisfactory estimation results. In each NARX-ANN model there was one nonlinear hidden layer, and one linear output layer (see Figure 6).
As the number of training iterations can be very large, the conditions of stopping the training were determined. Usually, the basic values taken into account are the assumed minimum value of the NARX-ANN performance function and the assumed maximum number of training iterations. The following training stop conditions were chosen: Epochs = 1500, or E ≤ 10−6.
Furthermore, the early stopping methodology was used, to train the NARX-ANN model in a supervised way. The dataset for each SOC was divided into three subsets:
  • Training dataset: Subset used updating the NARX-ANN weights and biases during network training.
  • Validation dataset: Subset used to validate the NARX-ANN in every iteration during training. The performance function value on the validation set was monitored during the training. The rise of the error on the validation subset was an indication that the network begins to overfit the data. When the performance function for validation error increased for a specified number of iterations, the training stopped, and the weights and biases at the minimum of the validation error were chosen for the network.
  • Testing dataset: Subset not used in the training, used to compare different models during evaluation.
There were between 12,000–14,000 data samples in each dataset (depending on SOC). The datasets used for training were divided into three parts using interleaved indices [124], namely: Training dataset (70% of the full dataset), testing dataset (15% of the full dataset), and validation dataset (15% of the full dataset).
The performance of the NARX-ANN model training, for all data subsets, and for different SOC is given in Figure 7a–g. During training, the performance function decreased for each dataset, while early stopping methodology allowed to create the model with best generalization properties. The average time of the training did not exceed 10 min.
In Figure 8a–g there are given linear regression plots for trained NARX-ANN models. Values of relationship coefficient (R) are close to 1, that indicates that there is an exact linear relationship between real values of voltage and estimated values with each NARX-ANN model. However, there were few samples in training data that visibly diverge from the linear approximation in the regression plot. This indicates the possible outliers during voltage estimation, that are further described in Section 4.
For every trained model, and dataset there were calculated errors, presented in Figure 9a–g in the form of histograms (with 50-bin grouping) for each subset. Every error distribution was tested using the Pearson’s chi-squared test [128], which returns a test decision for the null hypothesis that the data in the error vector comes from a normal distribution with a mean and a variance estimated from error vector. The test proved, that the null hypothesis at the 5% significance level for all datasets and subsets used for training, validation, and testing. All trained NARX models had a mean value close to zero, with a very small variance that proves their good approximation and generalization properties.

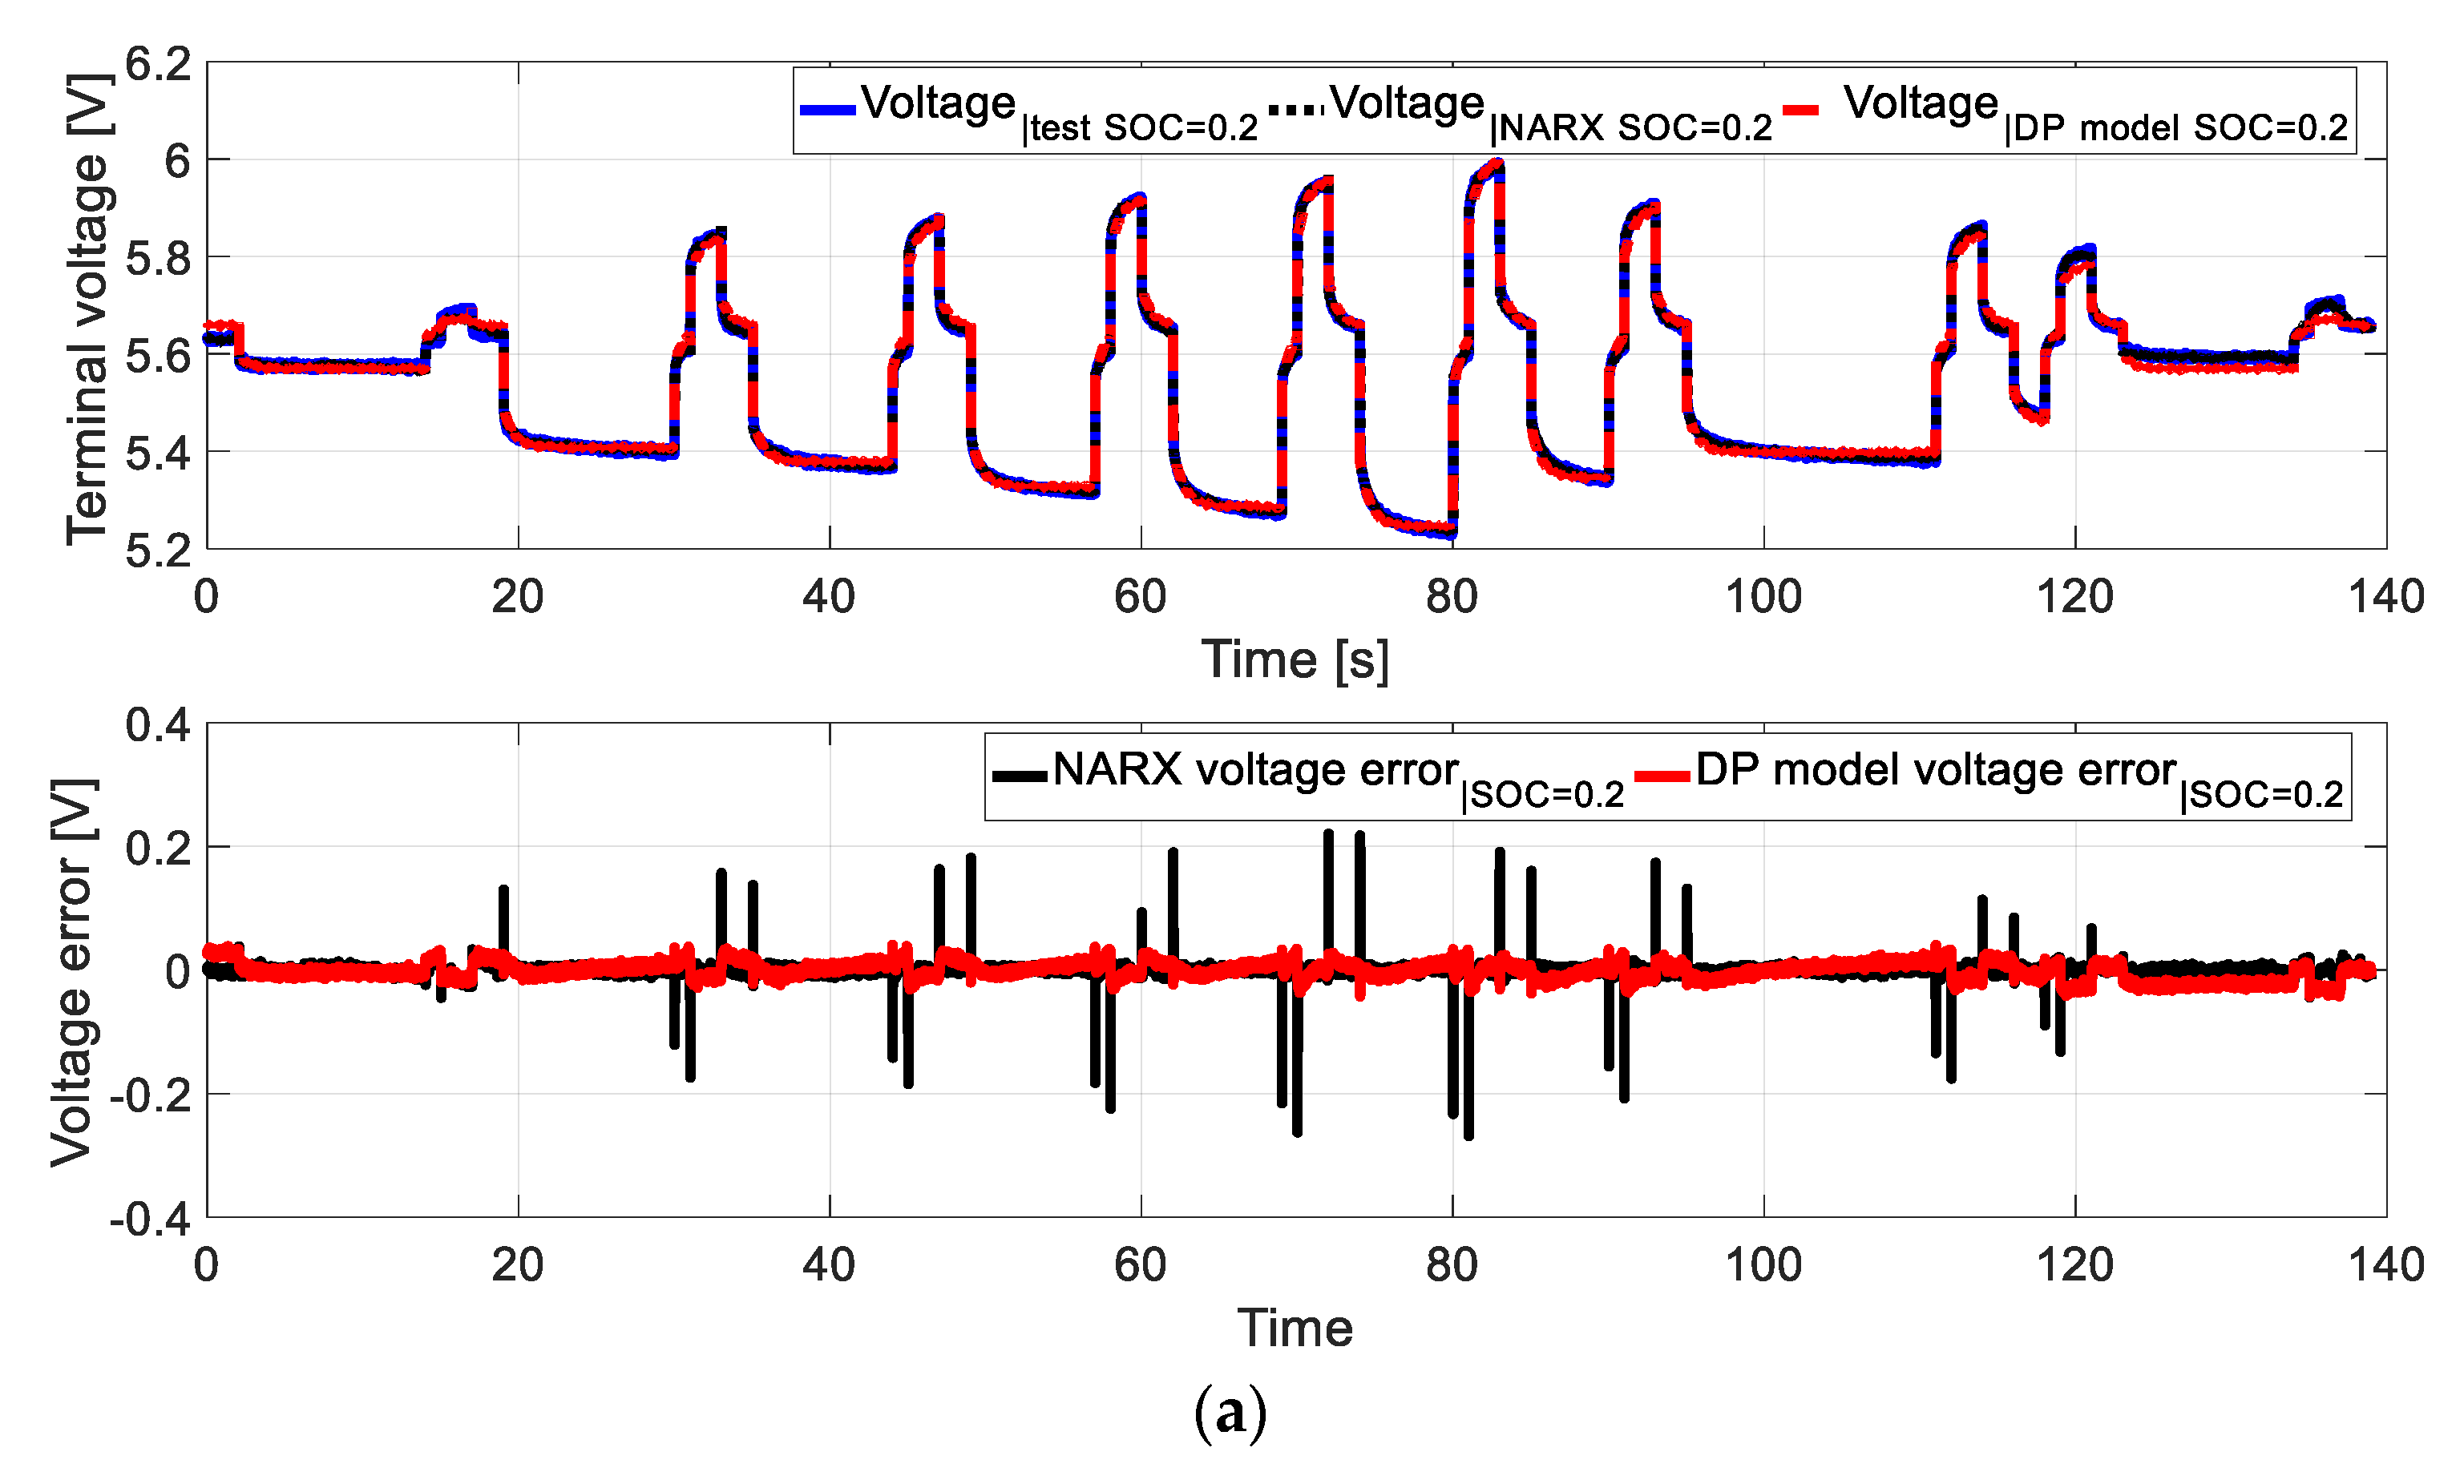
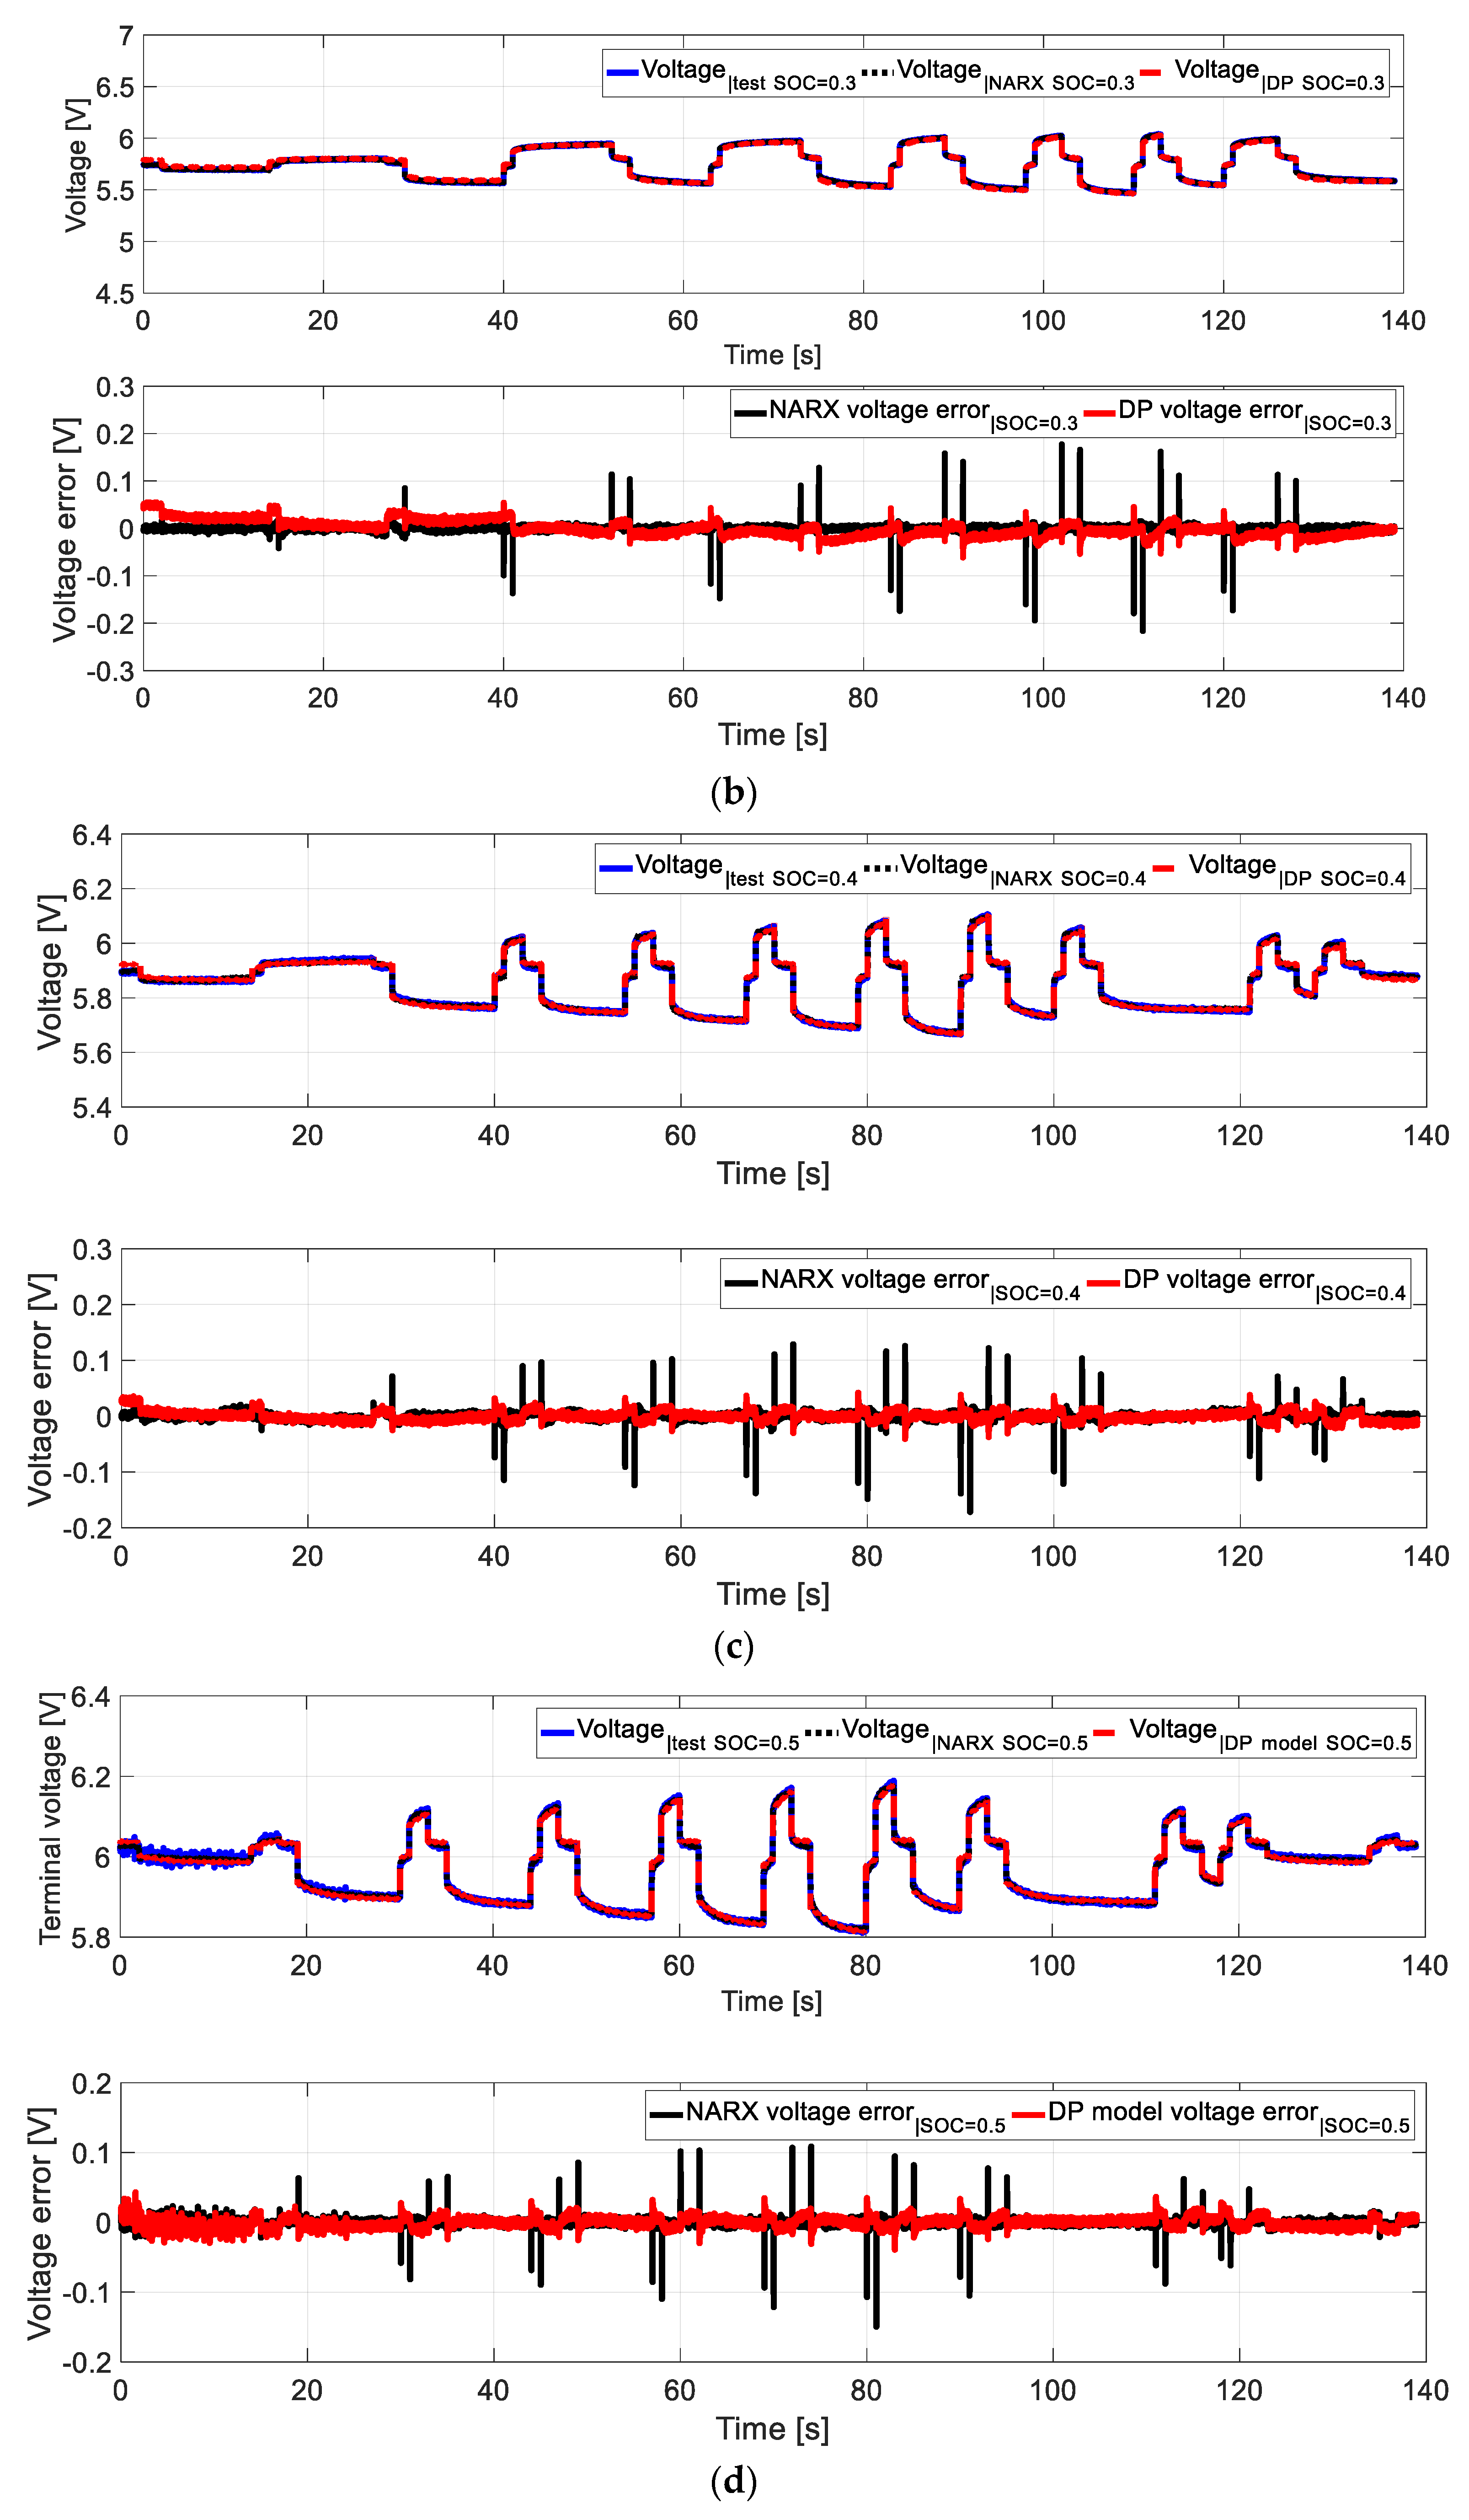
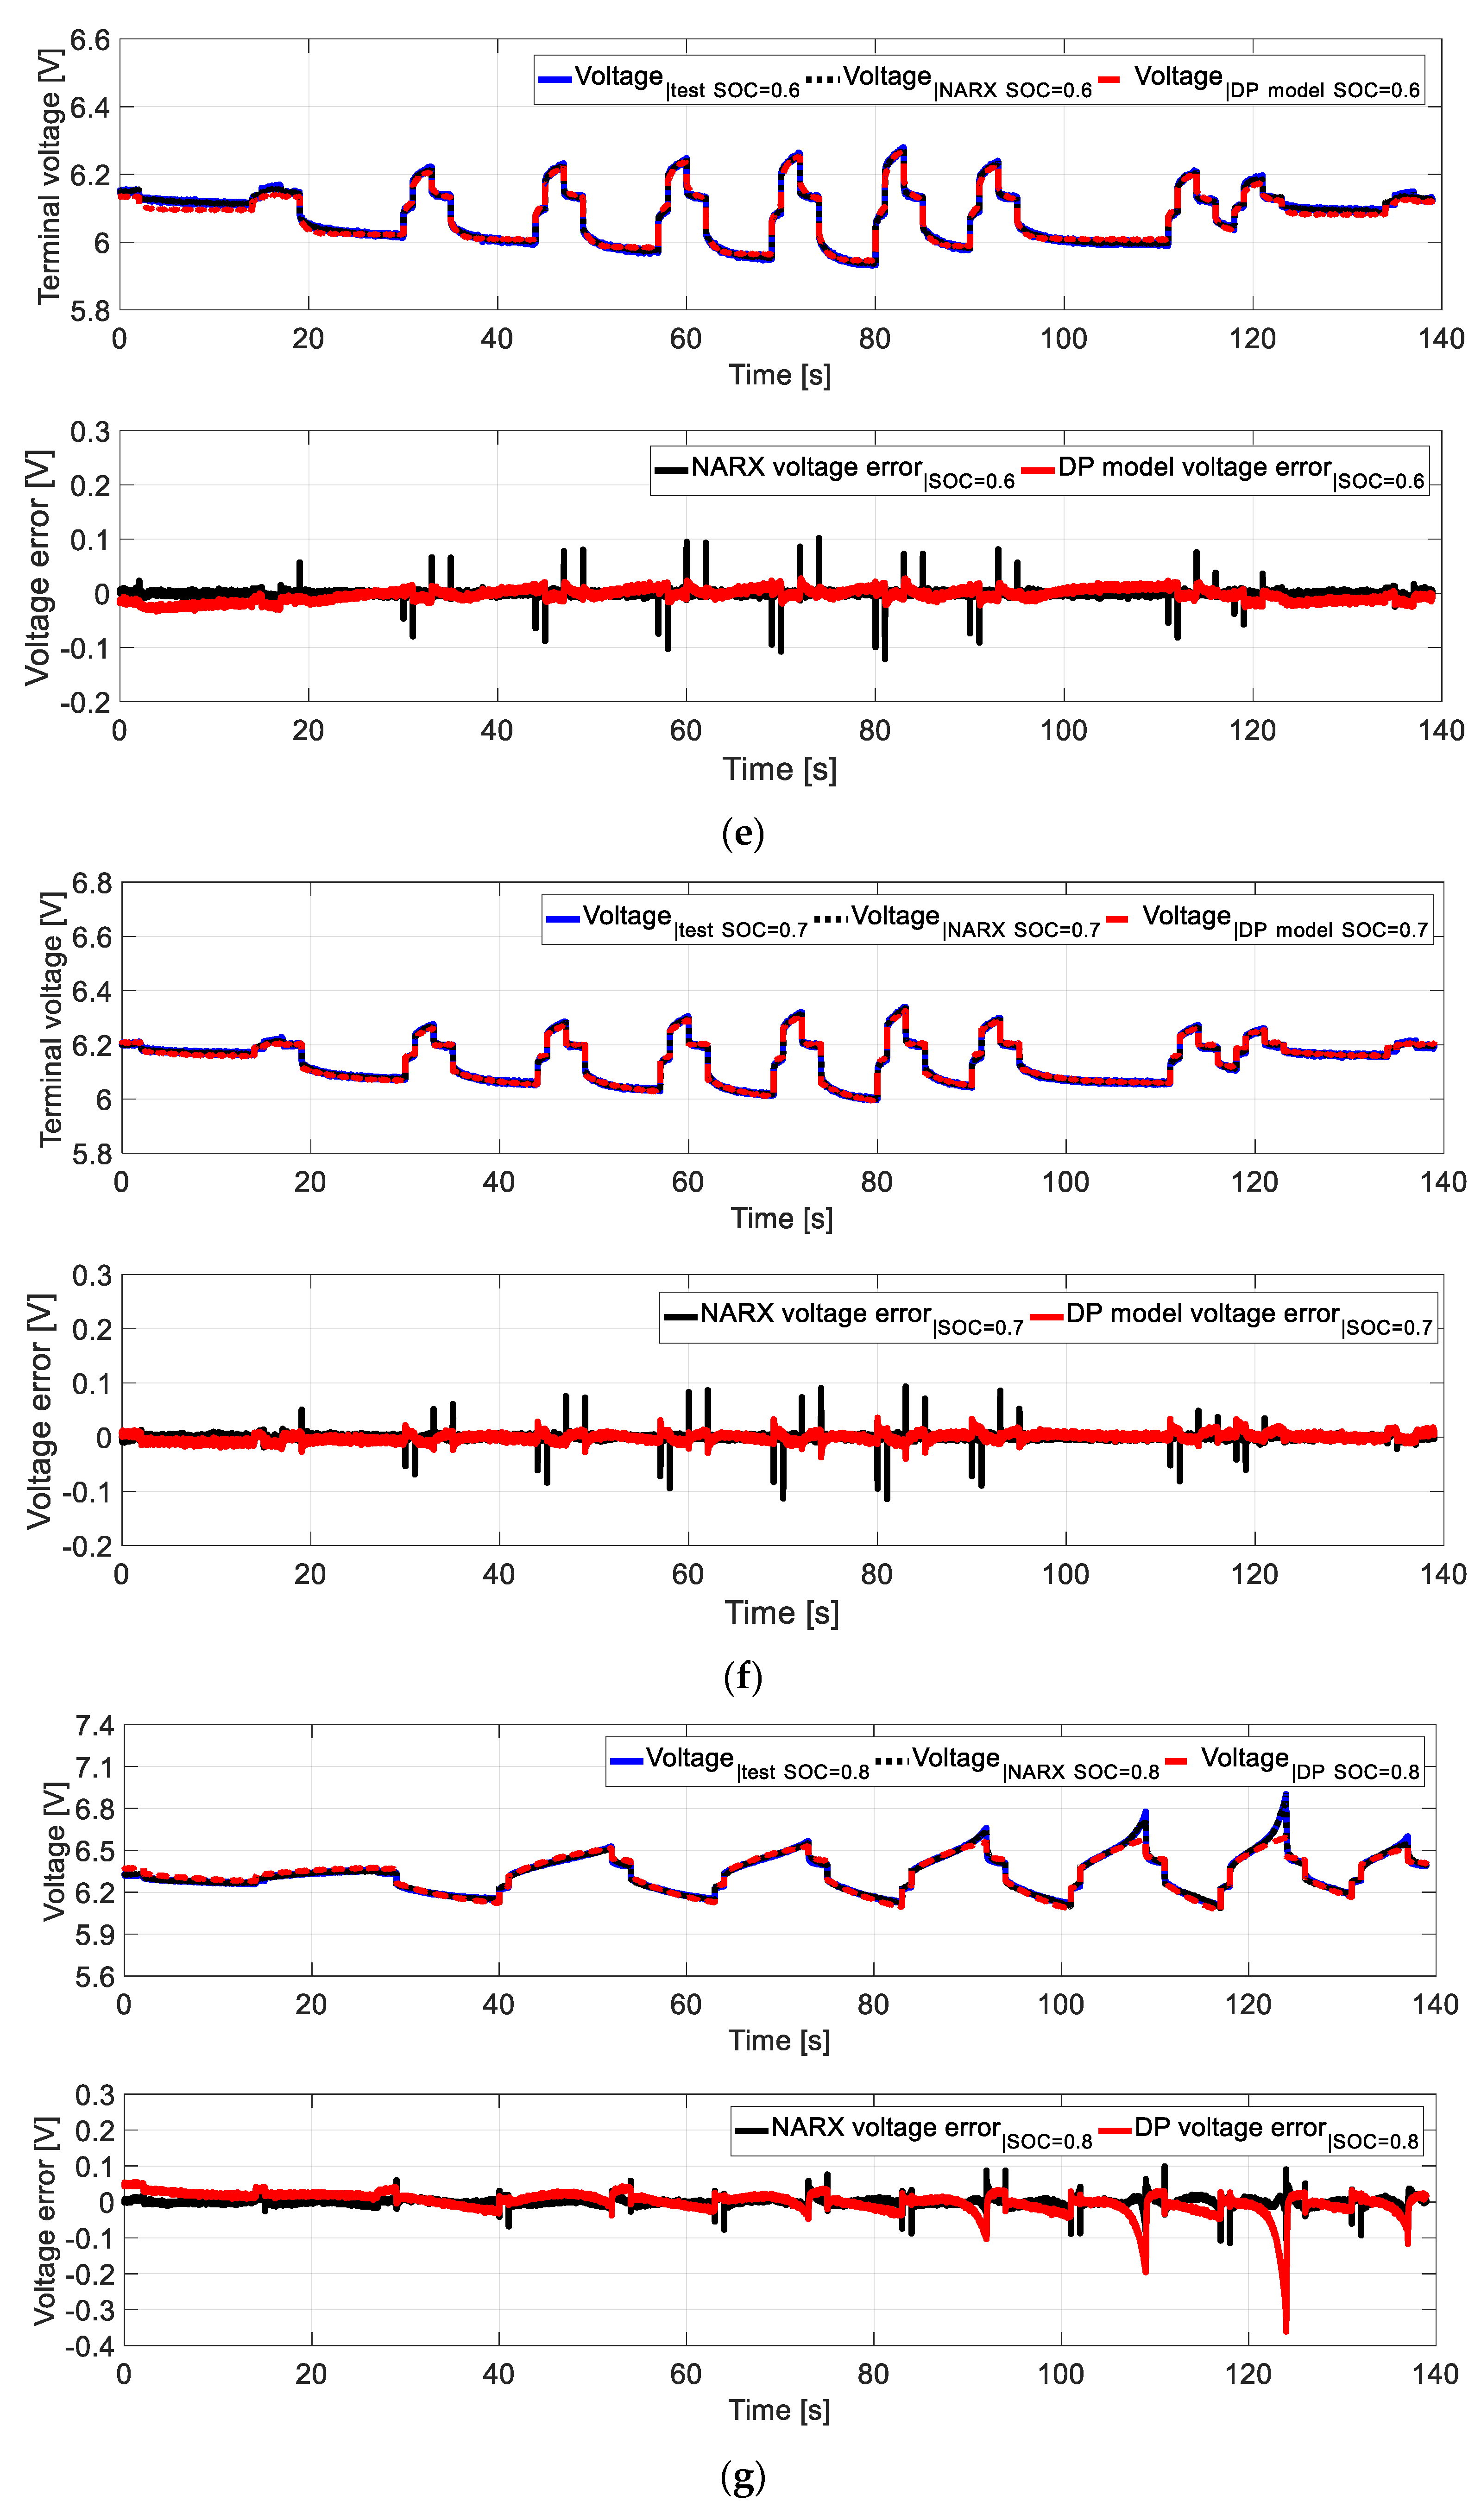
4. Validation of Results Acquired from Measurements, DP and NARX Models

The following section contains the validation results for voltage values obtained during measurements and from NARX and DP models, for SOC ranging from 0.2 to 0.8, respectively: Figure 10a for SOC = 0.2, Figure 10b for SOC = 0.3, Figure 10c for SOC = 0.4, Figure 10d for SOC = 0.5, Figure 10e for SOC = 0.6, Figure 10f for SOC = 0.7 and Figure 10g for SOC = 0.8. For SOC from 0.2 to 0.7 the voltage error obtained from NARX network was higher than for DP model. However, it did not exceed 0.27 V (Figure 10a for SOC = 0.2) while for DP model the error did not exceed 0.045 V (for SOC = 0.7). In the case of SOC = 0.8 (Figure 10g) the NARX model was more precise, the error did not exceed 0.1 V. For the DP model the maximum error was 0.36 V. The DP model presents worse results when the battery is charged to at least SOC = 0.8. During charging, nonlinear phenomena occurred related to activation and concentration polarization of reagents on the electrodes. In order to model the electrochemical processes in the range above SOC = 0.8 more precisely, additional RC loops can be added [72], which would increase the description accuracy of nonlinear processes during charging/discharging of the battery, especially in the pulse cycle. In Reference [89] it was concluded that with the increase of RC loop the accuracy of the model increases, but the time needed to identify the model parameters increases as well.
It can be seen (Figure 10) that the NARX-ANN model has good voltage generalization properties throughout the considered SOC range. However, there are some higher errors visible in the moments of sudden changes in the current load. This behavior can be connected with the small number of samples covering the vicinity of this points, comparing to the amount of data in the periods where the transitions were smooth. We can infer, that the NARX-ANN model generalizes better the periods with a higher amount of data. This indicates the sensitivity of the NARX-ANN model to such sudden changes resulting in large error range, that can be connected with the generalization properties of the neural networks [129]. In comparison, the presented DP model is more robust sudden changes of the current load.
The quality of the single NARX-ANN and DP model of the VRLA battery was evaluated using Mean Square Error (MSE) performance function (16) and the goodness of fit between estimated data and reference data calculated as Normalized Root Mean Square Error (NRMSE) [130]:
N R M S E ( k ) = 1 e ( k ) y ( k ) y ¯
where: y ¯ mean value of the modeled signal. The value of NRSME varies between −∞ (bad fit) to 1 (perfect fit).
Table 2 presents the values of MSE and NRMSE for SOC values ranging from 0.2 to 0.8. MSE values are low and do not exceed 0.93 × 10⁻³ (DP model for SOC = 0.8) and 1 × 10⁻⁴ (NARX model for SOC = 0.2). The NRSME value for NARX model in SOC range from 0.2 to 0.8 is above 0.93 (the lowest for SOC = 0.5, NRSENARX = 0.9371), which indicates a well-identified model.
In the case of the DP model, the value of NRMSEDP is above 0.77 (with the lowest value NRMSEDP = 0.7737 for SOC = 0.8), the model was identified correctly. The lowest value of NRMSEDP for SOC = 0.8 is mainly a result of the battery temporarily exceeding the maximum voltage of 6.8 V (the hyperbolic character of voltage increase at battery terminals).

5. Conclusions

The work presents model-aided research of VRLA AGM batteries in pulse work cycle. Two model approaches were presented, based on two RC loop model (known as DP model) and type NARX neural network model. Using the identified parameters, simulations were conducted and validated against results of experimental measurement results.
In this paper, it was shown that the DP model gives good results of voltage estimation for the considered SOC range. An advantage of the presented DP model is the possibility to estimate unidentified parameter values for a given SOC interval (e.g., SOC = 0.65).
Considering the NARX-ANN model, it has good estimation abilities for the voltage prediction. Results presented in Table 2 show that it has good repeatability, with small dispersion with changing SOC. For different datasets, it had slightly better, stable performance comparing with the DP model. However, there are a few drawbacks of such solution. First, it is a black-box model, with the structure that does not reflect the physical properties of the VRLA battery, so its usability is limited to prediction, rather than control. Secondly, it is sensitive to sudden changes in the current load, while the DP model is more robust. The possible solution can be a proper design of the current load signal [131], and research on the NARX-ANN generalization and sensitivity interconnection [129].
A well identified DP model can be used to simulate the operation of the battery during any work cycle, particularly in conjunction with a BMS system, e.g., for estimating SOC, remaining travel range, and SOH status [132]. The DP model presented in this work will be expanded in the future with the following points considered:
  • Self-discharge over time, which for batteries ranges from 5 to 30% per month [133] depending on type of battery and storage conditions (it is planned to add R component to the equivalent battery circuit (Figure 3) in parallel with UOCV).
  • Changes in State of Health of the battery and its prediction with aid of operational research [29,134]. The authors of Reference [29] are currently working on expanding the functionality of the DP model.
  • Increase in the accuracy of identified parameters with the use of models with additional RC loops (three and four RC loop pairs), which will greatly increase accuracy particularly for SOC >0.8 and SOC <0.2. Another approach, instead of increasing the number of RC loop pairs and also a compromise between the number of estimated parameters and the accuracy, is to use constant phase elements (CPE) [135,136,137,138].
  • Kalman filter [57,58,59,60], which in quasi-only mode will allow to identify parameters that cannot be measured directly, such as: UOCV, R0 etc.
  • Fusion of presented DP and NARX-ANN models using tailored Extendend Kamlan Filtering [139]. Such solution shall allow combining the structural and robustness properties of the DP model with the NARX-ANN model accuracy [140], and repeatability for different working conditions.

Author Contributions

Conceptualization, A.C., P.P., J.M. and K.B.; Data curation, A.C. and K.B.; Formal analysis, A.C., P.P. and J.M.; Investigation, A.C. and K.B.; Methodology, A.C., P.P. and J.M.; Software, A.C. and K.B.; Supervision, A.C., P.P. and J.M.; Visualization, A.C., P.P. and J.M.; Writing—original draft, A.C., P.P., J.M. and K.B.; Writing—review & editing, A.C., P.P., J.M and K.B.

Funding

“This research has not received any specific grant from funding agencies in the public, commercial, or not-for-profit sectors, but it has been performed as part of the employment of the authors at the Institute of Construction Machinery Engineering, Institute of Vehicles and Institute of Automatic Control and Robotics, Warsaw University of Technology”. The APC was co-funded by Institute of Construction Machinery Engineering, Institute of Vehicles and Institute of Automatic Control and Robotics, Warsaw University of Technology.

Conflicts of Interest

The authors declare no conflict of interest.

Nomenclature

Acronyms
AGMAbsorbent Glass Mat
BMSBattery management system
CPEConstant Phase Elements
DTapped Delay Line
DPDual polarization
HPPCHybrid Pulse Power Characterization
MSEMean Squared Error [–]
NARXNonlinear AutoRegressive eXogenous
NRMSENormalized Root Mean Square Error
OCVOpen Circuit Voltage
RANN–Recurrent Artificial Neural Network
SOASafe Operating Area
SOCState of Charge
SOEState of Energy
SOHState of Health
VRLAValve Regulated Lead Acid
Greek symbols, subscripts, superscripts and abbreviations
b ( m ) ( n ) The threshold offset of the n-th neuron in layer m [–]
C1, C2Capacitances [F]
eError
EMFElectromotive force [V]
HHessian
IloadLoading current from control unit [A]
Ich/IdchCharging/discharging current [A]
Ib1, Ib2Currents flowing through C1 and C2 [A]
JJacobian
kSample number [–]
NThe number of data samples [–]
nThe number of neurons in nonlinear layer [–]
nI, na, nb, ntNumber of delayed steps of inputs [–]
nuNumber of delayed steps of output (poles) [–]
n W Number of neural network weights [–]
pThe number of neuron inputs in nonlinear hidden layer [–]
R0Ohmic resistance [Ω]
R1Activation polarization resistance [Ω]
R2Density polarization resistance [Ω]
SOC0The initial State of Charge for time t = t0 [–]
QbatEffective capacity [Ah]
QnNominal capacity [Ah]
TambientAmbient temperature [K]
TbodyBody temperature [K]
TtermTemperature at terminals [K]
U1, U2The voltage drops occurring in the first and second loop [V]
UchThe charging voltage [V]
UdchThe discharging voltage [V]
UOCVOpen Circuit Voltage [V]
UtermNNNARX model output at step k [V]
W = [ w 1 , , w n W ] T The weight vector [–]
w ( m ) i j The weight of the i-th input to j-th neuron in layer m [–]
J Gradient
E N N ( W ( i ) ) The gradient vector
ηcThe columbic efficiency [–]

References

  1. Ismael, S.M.; Abdel Aleem, S.H.E.; Abdelaziz, A.Y.; Zobaa, A.F. State-of-the-art of hosting capacity in modern power systems with distributed generation. Renew. Energy 2019, 130, 1002–1020. [Google Scholar] [CrossRef]
  2. Fuentes-Cortés, L.F.; Flores-Tlacuahuac, A. Integration of distributed generation technologies on sustainable buildings. Appl. Energy 2018, 224, 582–601. [Google Scholar] [CrossRef]
  3. Wang, Y.; Huang, Y.; Wang, Y.; Zeng, M.; Li, F.; Wang, Y.; Zhang, Y. Energy management of smart micro-grid with response loads and distributed generation considering demand response. J. Clean. Prod. 2018, 197, 1069–1083. [Google Scholar] [CrossRef]
  4. Nguyen, S.; Peng, W.; Sokolowski, P.; Alahakoon, D.; Yu, X. Optimizing rooftop photovoltaic distributed generation with battery storage for peer-to-peer energy trading. Appl. Energy 2018, 228, 2567–2580. [Google Scholar] [CrossRef]
  5. Zhang, X.; Chen, H.; Xu, Y.; Li, W.; Huang, Y. Distributed generation with energy storage systems: A case study. Appl. Energy 2017, 204, 1251–1263. [Google Scholar] [CrossRef]
  6. Del Granado, P.C.; Pang, Z.; Wallace, S.W. Synergy of smart grids and hybrid distributed generation on the value of energy storage. Appl. Energy 2016, 170, 476–488. [Google Scholar] [CrossRef] [Green Version]
  7. Mills, G.; MacGill, I. Assessing Electric Vehicle storage, flexibility, and Distributed Energy Resource potential. J. Energy Storage 2018, 17, 357–366. [Google Scholar] [CrossRef]
  8. Szabłowski, Ł.; Milewski, J.; Badyda, K.; Kupecki, J. ANN-supported control strategy for a solid oxide fuel cell working on demand for a public utility building. Int. J. Hydrogen Energy 2018, 43, 3555–3565. [Google Scholar] [CrossRef]
  9. Milewski, J.; Szabłowski, Ł.; Kuta, J. Control strategy for an Internal Combustion engine fuelled by Natural Gas operating in Distributed Generation. Energy Procedia 2012, 14, 1478–1483. [Google Scholar] [CrossRef]
  10. Huang, Y.; Wang, H.; Khajepour, A.; Li, B.; Ji, J.; Zhao, K.; Hu, C. A review of power management strategies and component sizing methods for hybrid vehicles. Renew. Sustain. Energy Rev. 2018, 96, 132–144. [Google Scholar] [CrossRef]
  11. Hiermann, G.; Hartl, R.F.; Puchinger, J.; Vidal, T. Routing a mix of conventional, plug-in hybrid, and electric vehicles. Eur. J. Oper. Res. 2019, 272, 235–248. [Google Scholar] [CrossRef] [Green Version]
  12. Iwata, K.; Matsumoto, S. Use of hybrid vehicles in Japan: An analysis of used car market data. Transp. Res. Part D 2016, 46, 200–206. [Google Scholar] [CrossRef]
  13. Chen, S.Y.; Wu, C.H.; Hung, Y.H.; Chung, C.T. Optimal strategies of energy management integrated with transmission control for a hybrid electric vehicle using dynamic particle swarm optimization. Energy 2018, 160, 154–170. [Google Scholar] [CrossRef]
  14. Fathabadi, H. Novel battery/photovoltaic hybrid power source for plug-in hybrid electric vehicles. Sol. Energy 2018, 159, 243–250. [Google Scholar] [CrossRef]
  15. Breetz, H.L.; Salon, D. Do electric vehicles need subsidies? Ownership costs for conventional, hybrid, and electric vehicles in 14 U.S. cities. Energy Policy 2018, 120, 238–249. [Google Scholar] [CrossRef]
  16. Song, Z.; Zhang, X.; Li, J.; Hofmann, H.; Ouyang, M.; Du, J. Component sizing optimization of plug-in hybrid electric vehicles with the hybrid energy storage system. Energy 2018, 144, 393–403. [Google Scholar] [CrossRef]
  17. de Souza, L.L.P.; Lora, E.E.S.; Palacio, J.C.E.; Rocha, M.H.; Renó, M.L.G.; Venturini, O.J. Comparative environmental life cycle assessment of conventional vehicles with different fuel options, plug-in hybrid and electric vehicles for a sustainable transportation system in Brazil. J. Clean. Prod. 2018, 203, 444–468. [Google Scholar] [CrossRef]
  18. Chmielewski, A.; Szulim, P.; Gregorczyk, M.; Gumiński, R.; Mydłowski, T.; Mączak, J. Model of an electric vehicle powered by a PV cell—A case study. In Proceedings of the 22nd International Conference on Methods and Models in Automation and Robotics (MMAR), Miedzyzdroje, Poland, 28–31 August 2017; pp. 1009–1014. [Google Scholar]
  19. Rosenow, J.; Cowart, R.; Bayer, E.; Fabbri, M. Assessing the European Union’s energy efficiency policy: Will the winter package deliver on ‘Efficiency First’? Energy Res. Soc. Sci. 2017, 26, 72–79. [Google Scholar] [CrossRef]
  20. Haas, T. Struggles in European Union energy politics: A gramscian perspective on power in energy transitions. Energy Res. Soc. Sci. 2019, 48, 66–74. [Google Scholar] [CrossRef]
  21. Irsyad, M.I.; Halog, A.; Nepal, R. Renewable energy projections for climate change mitigation: An analysis of uncertainty and errors. Renew. Energy 2019, 130, 536–546. [Google Scholar] [CrossRef]
  22. Capros, P.; Kannavou, M.; Evangelopoulou, S.; Petropoulos, A.; Siskos, P.; Tasios, N.; Zazias, G.; DeVita, A. Outlook of the EU energy system up to 2050: The case of scenarios prepared for European Commission’s “clean energy for all Europeans”package using the PRIMES model. Energy Strategy Rev. 2018, 22, 255–263. [Google Scholar] [CrossRef]
  23. VRLA Battery Distributor—AKBA Website. Available online: http://akba.pl/EN/ (accessed on 15 October 2018).
  24. VRLA Battery Producer—MW Power Website. Available online: https://mwpower.pl/batteries/en/agm/ (accessed on 15 October 2018).
  25. VRLA Battery Distributor—MPL Energy Sp. Z.O.O Website. Available online: https://mplenergy.pl/en/about–us/ (accessed on 15 October 2018).
  26. VRLA Battery Distributor—Battery Trade Office BTO Website. Available online: https://www.bto.pl/en/kat/59/120v (accessed on 15 October 2018).
  27. Piórkowski, P.; Chmielewski, A.; Bogdziński, K.; Możaryn, J.; Mydłowski, T. Research on Ultracapacitors in Hybrid systems: Case Study. Energies 2018, 11, 2551. [Google Scholar] [CrossRef]
  28. Stienecker, A.W.; Stuart, T.; Ashtiani, C. A Combined ultracapacitor-lead acid battery energy storage system for mild hybrid electric vehicles. In Proceedings of the 2005 IEEE Vehicle Power and Propulsion Conference, Chicago, IL, USA, 7–9 September 2005; pp. 350–355. [Google Scholar]
  29. Chmielewski, A.; Bogdziński, K.; Gumiński, R.; Szulim, P.; Piórkowski, P.; Możaryn, J.; Mączak, J. Operational Research of VRLA Battery. In Automation 2018: Advances in Intelligent Systems and Computing; Szewczyk, R., Zieliński, C., Kaliczyńska, M., Eds.; Springer: Cham, Switzerland, 2018; Volume 743, pp. 783–791. [Google Scholar]
  30. Możaryn, J.; Chmielewski, A. Selected parameters prediction of energy storage system using recurrent neural networks. In Proceedings of the 10th IFAC Symposium on Fault Detection, Supervision and Safety for Technical Processes—SAFEPROCESS, Warsaw, Poland, 29–31 August 2018. [Google Scholar]
  31. Jankowska, E.; Kopciuch, K.; Błażejczyk, M.; Majchrzycki, W.; Piórkowski, P.; Chmielewski, A.; Bogdziński, K. Hybrid energy storage based on ultracapacitor and lead acid battery: Case study. In Automation 2018: Advances in Intelligent Systems and Computing; Szewczyk, R., Zieliński, C., Kaliczyńska, M., Eds.; Springer: Cham, Switzerland, 2018; Volume 743, pp. 339–349. [Google Scholar]
  32. He, Q.; Zha, Y.; Sun, Q.; Pan, Z.; Liu, T. Capacity Fast Prediction and Residual Useful Life Estimation of Valve Regulated Lead Acid Battery. Math. Probl. Eng. 2017, 2017, 7835049. [Google Scholar] [CrossRef]
  33. Pascoe, P.E.; Anbuky, A.H. A VRLA battery simulation model. Energy Convers. Manag. 2004, 45, 1015–1041. [Google Scholar] [CrossRef]
  34. Kujundzic, G.; Ileš, Š.; Matuško, J.; Vašak, M. Optimal charging of valve-regulated lead-acid batteries based on model predictive control. Appl. Energy 2017, 187, 189–202. [Google Scholar] [CrossRef]
  35. Fairweather, A.J.; Foster, M.P.; Stone, D.A. Modelling of VRLA batteries over operational temperature range using Pseudo Random Binary Sequences. J. Power Sources 2012, 207, 56–59. [Google Scholar] [CrossRef]
  36. Kularatna, N. Dynamics, models, and management of rechargeable batteries. In Energy Storage Devices for Electronic Systems, Rechargeable Batteries and Supercapacitors; Hillcrest: Hamilton, New Zealand, 2015; pp. 63–135. [Google Scholar]
  37. Luo, X.; Wang, J.; Dooner, M.; Clarke, J. Overview of Current Development in Electrical Energy Storage Technologies and the Application Potential in Power System Operation. Appl. Energy 2015, 137, 511–536. [Google Scholar] [CrossRef]
  38. Michalczuk, M.; Grzesiak, L.M.; Ufnalski, B. Experimental parameter identification of battery-ultracapacitor energy storage system. In Proceedings of the 2015 IEEE 24th International Symposium on Industrial Electronics (ISIE), Buzios, Brazil, 3–5 June 2015; pp. 1260–1265. [Google Scholar]
  39. Mandla, E.; Mandic, G.; Nasiri, A. Development of an electrical model for lithium-ion ultracapacitors. IEEE J. Emerg. Sel. Top. Power Electron. 2015, 3, 395–404. [Google Scholar] [CrossRef]
  40. Chmielewski, A.; Piórkowski, P.; Bogdziński, K.; Szulim, P.; Gumiński, R. Test bench and model research of hybrid energy storage. J. Power Technol. 2017, 97, 406–415. [Google Scholar]
  41. Zhang, L.; Hu, X.; Wang, Z.; Sun, F.; Dorrell, D.G. A review of supercapacitor modeling, estimation, and applications: A control/management perspective. Renew. Sustain. Energy Rev. 2018, 81, 1868–1878. [Google Scholar] [CrossRef]
  42. Ferg, E.; Rossouw, C.; Loyson, P. The testing of batteries linked to supercapacitors with electrochemical impedance spectroscopy: A comparison between Li-ion and valve regulated lead acid batteries. J. Power Sources 2013, 226, 299–305. [Google Scholar] [CrossRef]
  43. Szumanowski, A.; Piórkowski, P.; Chang, Y. Batteries and ultracapacitors set in hybrid propulsion system. In Proceedings of the 2007 International Conference on Power Engineering, Energy and Electrical Drives, Setubal, Portugal, 12–14 April 2007. [Google Scholar]
  44. Pop, V.; Bergveld, H.J.; Danilov, D.; Regtien, P.P.L.; Notten, P.H.L. Battery Management Systems: Accurate State-of-Charge Indication for Battery-Powered Applications; Springer Netherlands Science + Business Media B.V: Eindhoven, The Netherlands, 2008. [Google Scholar]
  45. Chaoui, H.; Ibe-Ekeocha, C.C. State of Charge and State of Health Estimation for Lithium Batteries Using Recurrent Neural Networks. IEEE Trans. Veh. Technol. 2017, 66, 8773–8783. [Google Scholar] [CrossRef]
  46. Soteris, A.; Mellit, A. Artificial Intelligence Techniques for Photovoltaic Applications: A Review. Prog. Energy Combust. Sci. 2008, 34, 574–632. [Google Scholar]
  47. Micallef, A.; Apap, M.; Spiteri-Staines, C.; Guerrero, J. Mitigation of Harmonics in Grid-Connected and Islanded Microgrids Via Virtual Admittances and Impedances. IEEE Trans. Smart Grid 2015, 8, 651–661. [Google Scholar] [CrossRef]
  48. Chia, Y.; Lee, L.; Shafiabady, N.; Isa, D. A Load Predictive Energy Management System for Supercapacitor-Battery Hybrid Energy Storage System in Solar Application Using the Support Vector Machine. Appl. Energy 2015, 137, 588–602. [Google Scholar] [CrossRef]
  49. Koohi-Kamali, S.; Rahim, N.; Mokhlis, H.; Tyagi, V. Photovoltaic Electricity Generator Dynamic Modeling Methods for Smart Grid Applications: A Review. Renew. Sustain. Energy Rev. 2016, 57, 131–172. [Google Scholar] [CrossRef]
  50. Kopczyński, A.; Piórkowski, P.; Roszczyk, P. Parameters selection of extended-range electric vehicle powered from supercapacitor pack based on laboratory and simulation tests. IOP Conf. Ser. Mater. Sci. Eng. 2018, 421, 022016. [Google Scholar] [CrossRef]
  51. Zhu, W.H.; Tatarchuk, B.J. Characterization of asymmetric ultracapacitors as hybrid pulse power devices for efficient energy storage and power delivery applications. Appl. Energy 2016, 169, 460–468. [Google Scholar] [CrossRef]
  52. Castano-Solis, S.; Serrano-Jimenez, D.; Fraile-Ardanuy, J.; Sanz-Feito, J. Hybrid characterization procedure of Li-ion battery packs for wide frequency range dynamics applications. Electr. Power Syst. Res. 2019, 166, 9–17. [Google Scholar] [CrossRef]
  53. Panchal, S.; Mcgrory, J.; Kong, J.; Fraser, R.; Fowler, M.; Dincer, I.; Agelin-Chaab, M. Cycling degradation testing and analysis of a LiFePO4 battery at actual conditions. Int. J. Energy Res. 2017, 41, 2565–2575. [Google Scholar] [CrossRef]
  54. Panchal, S.; Mathew, M.; Fraser, R.; Fowler, M. Electrochemical thermal modeling and experimental measurements of 18650 cylindrical lithium-ion battery during discharge cycle for an EV. Appl. Therm. Eng. 2018, 135, 123–132. [Google Scholar] [CrossRef]
  55. Chmielewski, A.; Możaryn, J.; Bogdziński, K.; Piórkowski, P.; Mydłowski, T.; Gumiński, R.; Mączak, J. Selected properties of the hybrid micro-installation model based on electrochemical battery and PV module. Int. J. Struc. Stab. Dyn. 2018, in press. [Google Scholar]
  56. Szumanowski, A.; Chang, Y. Battery Management System Based on Battery Nonlinear Dynamics Modeling. IEEE Trans. Veh. Technol. 2008, 57, 1425–1432. [Google Scholar] [CrossRef]
  57. Grzesiak, L.; Ufnalski, B.; Kaszewski, A.; Gąbka, G.; Roszczyk, P. Power management in series hybrid drive. Przegląd Elektrotechniczny 2012, 88, 304–308. [Google Scholar]
  58. Farmann, A.; Sauer, D. A comprehensive review of on-board State-of-Available-Power prediction techniques for lithium-ion batteries in electric vehicles. J. Power Sources 2016, 329, 123–137. [Google Scholar] [CrossRef]
  59. Hannan, M.A.; Lipu, M.S.H.; Hussain, A.; Mohamed, A. A review of lithium-ion battery state of charge estimation and management system in electric vehicle applications: Challenges and recommendations. Renew. Sustain. Energy Rev. 2017, 78, 834–854. [Google Scholar] [CrossRef]
  60. Ramadan, H.S.; Becherif, M.; Claude, F. Extended Kalman filter for accurate state of charge estimation of lithium-based batteries: A comparative analysis. Int. J. Hydrogen Energy 2017, 42, 29033–29046. [Google Scholar] [CrossRef]
  61. He, H.; Xiong, R.; Zhang, X.; Sun, F.; Fan, J.X. State-of-Charge estimation of the lithium-ion, battery using an adaptive extended Kalman filter based on an improved Thevenin model. IEEE Trans. Veh. Technol. 2011, 60, 1461–1469. [Google Scholar]
  62. Mu, H.; Xiong, R.; Zheng, H.; Chang, Y.; Chen, Z. A novel fractional order model based state-of-charge estimation method for lithium-ion battery. Appl. Energy 2017, 207, 384–393. [Google Scholar] [CrossRef]
  63. He, H.; Xiong, R.; Fan, J. Evaluation of Lithium-Ion Battery Equivalent Circuit Models for State of Charge Estimation by an Experimental Approach. Energies 2011, 4, 582–598. [Google Scholar] [CrossRef] [Green Version]
  64. Ting, T.O.; Man, K.L.; Lim, E.G.; Leach, M. Tuning of Kalman Filter Parameters via Genetic Algorithm for State-of-Charge Estimation in Battery Management System. Math. Probl. Eng. 2014, 2014, 176052. [Google Scholar] [CrossRef] [PubMed]
  65. Xavier, M.A.; Trimboli, M.S. Lithium-ion battery cell-level control using constrained model predictive control and equivalent circuit models. J. Power Sources 2015, 285, 374–384. [Google Scholar] [CrossRef] [Green Version]
  66. Zheng, Y.; Gao, W.; Ouyang, M.; Lu, L.; Zhoua, L.; Han, X. State-of-charge inconsistency estimation of lithium-ion battery pack using mean-difference model and extended Kalman filter. J. Power Sources 2018, 383, 50–58. [Google Scholar] [CrossRef]
  67. Afshar, S.; Morris, K.; Khajepour, A. State of Charge estimation via extended Kalman filter designed for electrochemical equations. IFAC-PapersOnLine 2017, 50, 2152–2157. [Google Scholar] [CrossRef]
  68. Chmielewski, A.; Piórkowski, P.; Gumiński, R.; Bogdziński, K.; Możaryn, J. Model-based Research on Ultracapacitors. In Automation 2018: Advances in Intelligent Systems and Computing; Szewczyk, R., Zieliński, C., Kaliczyńska, M., Eds.; Springer: Cham, Switzerland, 2018; Volume 743, pp. 254–264. [Google Scholar]
  69. Gu, W.; Wang, C. Thermal-Electrochemical Modeling of Battery Systems. J. Electrochem. Soc. 2000, 147, 2910–2922. [Google Scholar] [CrossRef]
  70. Saito, Y.; Shikano, M.; Kobayashi, H. Heat Generation Behavior During Charging and Discharging of Lithium-Ion Batteries After Long-Time Storage. J. Power Sources 2013, 244, 294–299. [Google Scholar] [CrossRef]
  71. Li, J.; Cheng, Y.; Jia, M.; Tang, Y.; Lin, Y.; Zhian, Z.; Liu, Y. An Electrochemical-Thermal Model Based on Dynamic Responses for Lithium-Iron-Phosphate Battery. J. Power Sources 2014, 225, 130–143. [Google Scholar] [CrossRef]
  72. Lai, Y.; Du, S.; Ai, L.; Cheng, Y.; Tang, Y.; Jia, M. Insight into Heat Generation of Lithium-Ion Batteries Based on the Electrochemical-Thermal Model at High Discharge Rates. Int. J. Hydrogen Energy 2015, 40, 13039–13049. [Google Scholar] [CrossRef]
  73. Li, J.; Wang, L.; Lyu, C.; Wang, H.; Liu, X. New Method for Parameter Estimation of an Electrochemical-Thermal Coupling Model for Li-Co-O2 Battery. J. Power Sources 2016, 307, 220–230. [Google Scholar] [CrossRef]
  74. Fotouhi, A.; Auger, D.; Propp, K.; Longo, S.; Wild, M. A Review on Electric Vehicle Battery Modelling: From Lithium-Ion Toward Lithium-Sulphur. Renew. Sustain. Energy Rev. 2016, 56, 1008–1021. [Google Scholar] [CrossRef]
  75. Collazos, A.; Maréchal, F.; Gähler, C. Predictive Optimal Management Method for the Control of Polygeneration Systems. Comput. Chem. Eng. 2009, 33, 1584–1592. [Google Scholar] [CrossRef]
  76. Yao, L.W.; Aziz, J.A.; Ramli, N. Detail analysis of RC parallel network-based model for high capacity lithium ferro phosphates battery. In Proceedings of the 6th IET International Conference on Power Electronics, Machines and Drives (PEMD 2012), Bristol, UK, 27–29 March 2012; pp. 1–6. [Google Scholar]
  77. Li, S.; Cheng, X. A comparative study on RC models of lithium-ion battery. In Proceedings of the 2014 IEEE Conference and Expo Transportation Electrification Asia-Pacific (ITEC Asia-Pacific), Beijing, China, 31 August–3 September 2014; pp. 1–4. [Google Scholar]
  78. Piao, C.; Yang, X. An improved model based on artificial neural networks and Thevenin model for nickel metal hydride power battery. In Proceedings of the International Conference on Optics, Photonics and Energy Engineering (OPEE), Wuhan, China, 10–11 May 2010; pp. 115–118. [Google Scholar]
  79. Putra, W.S.; Dewangga, B.R.; Cahyadi, A.; Wahyunggoro, O. Current Estimation Using Thevenin Battery Model. In Proceedings of the Joint International Conference on Electric Vehicular Technology and Industrial, Mechanical, Electrical and Chemical Engineering (ICEVT & IMECE), Surakarta, Indonesia, 4–5 November 2015; pp. 5–9. [Google Scholar]
  80. Gao, W.; Jiang, M. Research on PNGV Model Parameter Identification of LiFePO4 Li-ion Battery Based on FMRLS. In Proceedings of the 6th IEEE Conference on Industrial Electronics and Applications, Beijing, China, 21–23 June 2011; pp. 2294–2297. [Google Scholar]
  81. Han, Y.; Wang, X. WPT Charging System for Lithium Battery Based on PNGV Model. In Proceedings of the 2017 IEEE Transportation Electrification Conference and Expo, Asia-Pacific (ITEC Asia-Pacific), Harbin, China, 7–10 August 2017; pp. 1–5. [Google Scholar]
  82. Liu, X.; Li, W.; Zhou, A. PNGV Equivalent Circuit Model and SOC Estimation Algorithm for Lithium Battery Pack Adopted in AGV Vehicle. IEEE Access 2018, 6, 23639–23647. [Google Scholar] [CrossRef]
  83. Bottinger, M.; Paulitschke, M.; Bocklisch, T. Systematic Experimental Pulse Test Investigation for Parameter Identification of an Equivalent Circuit Based Lithium-Ion Battery Model. Energy Procedia 2017, 135, 337–346. [Google Scholar] [CrossRef]
  84. Cheng, P.; Zhou, Y.; Song, Z.; Ou, Y. Modeling and SOC Estimation of LiFePO4 Battery. In Proceedings of the IEEE International Conference on Robotics and Biomimetics, Qingdao, China, 3–7 December 2016; pp. 2140–2144. [Google Scholar]
  85. Sepasi, S.; Ghorbani, R.; Liaw, B.Y. Inline State of Health Estimation of Lithium-Ion Batteries Using State of Charge Calculation. J. Power Sources 2015, 299, 246–254. [Google Scholar] [CrossRef]
  86. Zhang, C.; Allafi, W.; Dinh, Q.; Ascencio, P.; Marco, J. Online Estimation of Battery Equivalent Circuit Model Parameters and State of Charge Using Decoupled Least Squares Technique. Energy 2018, 142, 678–688. [Google Scholar] [CrossRef]
  87. Ke, M.Y.; Chiu, Y.H.; Wu, C.Y. Battery Modelling and SOC Estimation of a LiFePO4 Battery. In Proceedings of the 2016 International Symposium on Computer, Consumer and Control, Xi’an, China, 4–6 July 2016; pp. 208–211. [Google Scholar]
  88. Pattipati, B.; Balasingam, B.; Avvari, G.V.; Pattipati, K.R.; Bar-Shalom, Y. Open circuit voltage characterization of lithium-ion batteries. J. Power Sources 2014, 269, 317–333. [Google Scholar] [CrossRef]
  89. Jackey, R.; Saginaw, M.; Sanghvi, P.; Gazzarri, J.; Huria, T.; Ceraolo, M. Battery Model Parameter Estimation Using a Layered Technique: An Example Using a Lithium Iron Phosphate Cell; SAE Technical Paper 2013-01-1547; Detroit: Michigan, MI, USA, 2013; pp. 1–14. [Google Scholar]
  90. Wang, A.; Jin, X.; Li, Y.; Li, N. LiFePO4 Battery Modeling and SOC Estimation Algorithm. In Proceedings of the 29th Chinese Control and Decision Conference (CCDC), Chongqing, China, 28–30 May 2017; pp. 7574–7578. [Google Scholar]
  91. Lai, X.; Zheng, Y.; Sun, T. A Comparative Study of Different Equivalent Circuit Models for Estimating State-of-Charge of Lithium-Ion Batteries. Electrochim. Acta 2018, 259, 566–577. [Google Scholar] [CrossRef]
  92. Liu, G.; Lu, L.; Fu, H.; Hua, J.; Li, J.; Ouyang, M.; Wang, Y.; Xue, S.; Chen, P. A comparative study of equivalent circuit models and enhanced equivalent circuit models of lithium-ion batteries with different model structures. In Proceedings of the 2014 IEEE Conference and Expo Transportation Electrification Asia-Pacific (ITEC Asia-Pacific), Beijing, China, 31 August–3 September 2014; pp. 1–6. [Google Scholar]
  93. Chen, Z.; Xia, B.; Mi, C.C.; Xiong, R. Loss Minimization-Based Charging Strategy for Lithium-ion Battery. IEEE Trans. Ind. Appl. 2015, 51, 4121–4129. [Google Scholar] [CrossRef]
  94. Xiong, R.; Li, L.; Li, Z.; Yu, Q.; Mu, H. An electrochemical model based degradation state identification method of Lithium-ion battery for all-climate electric vehicles application. Appl. Energy 2018, 219, 264–275. [Google Scholar] [CrossRef]
  95. Yang, D.; Wang, Y.; Pan, R.; Chen, R.; Chen, Z. A neural network based state-of-health estimation of lithium-ion battery in electric vehicles. Energy Procedia 2017, 105, 2059–2064. [Google Scholar] [CrossRef]
  96. Tong, S.; Lacap, J.H.; Park, J.W. Battery State of Charge Estimation Using a Load-Classifying Neural Network. J. Energy Storage 2016, 7, 236–243. [Google Scholar] [CrossRef]
  97. Gallien, T.; Brasseur, G. State of Charge Estimation of a LiFePO4 Battery: A Dual Estimation Approach Incorporating Open Circuit Voltage Hysteresis. In Proceedings of the 2016 IEEE International Instrumentation and Measurement Technology Conference, Taipei, Taiwan, 23–26 May 2016; pp. 1–6. [Google Scholar]
  98. Feng, T.; Yang, L.; Zhao, X.; Zhang, H.; Qiang, J. Online identification of lithium-ion battery parameters based on an improved equivalent-circuit model and its implementation on battery state-of-power prediction. J. Power Sources 2015, 281, 192–203. [Google Scholar] [CrossRef]
  99. Li, Z.; Xiong, R.; He, H. An improved battery on-line parameter identification and state-of-charge determining method. Energy Procedia 2016, 103, 381–386. [Google Scholar] [CrossRef]
  100. Xiong, R.; Yu, Q.; Wang, L.Y. Open circuit voltage and state of charge online estimation for lithium ion batteries. Energy Procedia 2017, 142, 1902–1907. [Google Scholar] [CrossRef]
  101. Nikolian, A.; Firouz, Y.; Gopalakrishnan, R.; Timmermans, J.M.; Omar, N.; Bossche, P.; Mierlo, J. Lithium Ion Batteries-Development of Advanced Electrical Equivalent Circuit Models for Nickel Manganese Cobalt Lithium-Ion. Energies 2016, 9, 360. [Google Scholar] [CrossRef]
  102. Xing, Y.; He, W.; Pecht, M.; Tsui, K.L. State of charge estimation of lithium-ion batteries using the open-circuit voltage at various ambient temperatures. Appl. Energy 2014, 113, 106–115. [Google Scholar] [CrossRef]
  103. Zhou, D.; Yin, H.; Fu, P.; Song, X.; Lu, W.; Yuan, L.; Fu, Z. Prognostics for State of Health of Lithium-Ion Batteries Based on Gaussian Process Regression. Math. Probl. Eng. 2018, 2018, 8358025. [Google Scholar] [CrossRef]
  104. Kim, J.; Cho, B.H. State-of-Charge Estimation and State-of-Health Prediction of a Li-Ion Degraded Battery Based on an EKF Combined with a Per-Unit System. IEEE Trans. Veh. Technol. 2011, 60, 4249–4260. [Google Scholar] [CrossRef]
  105. Jiang, J.; Liang, Y.; Ju, Q.; Zhang, L.; Zhang, W.; Zhang, C. An Equivalent Circuit Model for Lithium-Sulfur Batteries. Energy Procedia 2017, 105, 3533–3538. [Google Scholar] [CrossRef]
  106. Wang, Q.K.; He, Y.J.; Shen, J.N.; Ma, Z.F.; Zhong, G.B. A unified modeling framework for lithium-ion batteries: An artificial neural network based thermal coupled equivalent circuit model approach. Energy 2017, 138, 118–132. [Google Scholar] [CrossRef]
  107. Zhang, J.; Wei, Y.; Qi, H. State of charge estimation of LiFePO4 batteries based on online parameter identification. Appl. Math. Model. 2016, 40, 6040–6050. [Google Scholar] [CrossRef]
  108. Wang, Y.; Tian, J.; Chen, Z.; Liu, X. Model based insulation fault diagnosis for lithium-ion battery pack in electric vehicles. Measurement 2019, 131, 443–451. [Google Scholar] [CrossRef]
  109. Farmanna, A.; Sauer, D.U. Comparative study of reduced order equivalent circuit models for on-board state-of-available-power prediction of lithium-ion batteries in electric vehicles. Appl. Energy 2018, 225, 1102–1122. [Google Scholar] [CrossRef]
  110. Chmielewski, A.; Możaryn, J.; Piórkowski, P.; Gumiński, R.; Bogdziński, K. Modelling of Ultracapacitors using Recurrent Artificial Neural Network. In Advances in Intelligent Systems and Computing, Proceedings of the Automation, Warsaw, Poland, 21–23 March 2018; Springer: Cham, Switzerland, 2018; Volume 743, pp. 713–723. [Google Scholar]
  111. Chmielewski, A.; Możaryn, J.; Gumiński, R.; Szulim, P.; Bogdziński, K. Experimental Evaluation of Mathematical and Artificial Neural Network Modeling of Energy Storage System. In Dynamical Systems in Applications; Awrejcewicz, J., Ed.; Springer International Publishing: Cham, Switzerland, 2018; Volume 249, pp. 49–62. [Google Scholar]
  112. Chemali, E.; Kollmeyer, P.J.; Preindl, M.; Ahmed, R.; Emadi, A. Long Short-Term Memory Networks for Accurate State-of-Charge Estimation of Li-ion Batteries. IEEE Trans. Ind. Electron. 2018, 65, 6730–6739. [Google Scholar] [CrossRef]
  113. Palma, F.D.; Magni, L. A Multi-model Structure for Model Predictive Control. Annu. Rev. Control 2004, 28, 47–52. [Google Scholar] [CrossRef]
  114. Eddahech, A.; Briat, O.; Bertrand, N.; Delétage, J.Y.; Vinassa, J.M. Behavior and State-of-Health Monitoring of Li-ion Batteries Using Impedance Spectroscopy and Recurrent Neural Networks. Int. J. Electr. Power Energy Syst. 2012, 42, 487–494. [Google Scholar] [CrossRef]
  115. Hussein, A.A. Derivation and Comparison of Open-loop and Closed-loop Neural Network Battery State-of-Charge Estimators. In Proceedings of the Energy Procedia: The 7th International Conference on Applied Energy—ICAE 2015, Abu Dhabi, UAE, 28–31 March 2015; Volume 75, pp. 1856–1861. [Google Scholar]
  116. Hu, X.S.; Sun, F.C.; Li, S.B.; Yang, Y.L. NARX Modelling of a Lithium Iron Phosphate Battery Used for Electrified Vehicle Simulation. Int. J. Model. Identif. Control 2013, 20, 181–189. [Google Scholar] [CrossRef]
  117. Dong, G.; Zhang, X.; Zhang, C.; Chen, Z. A Method for State of Energy Estimation of Lithium-ion Batteries Based on Neural Network Model. Energy 2015, 90, 879–888. [Google Scholar] [CrossRef]
  118. Dang, X.; Yan, L.; Xu, K.; Wu, X.; Jiang, H.; Sun, H. Open-Circuit Voltage-Based State of Charge Estimation of Lithium-ion Battery Using Dual Neural Network Fusion Battery Model. Electrochim. Acta 2016, 188, 356–366. [Google Scholar] [CrossRef]
  119. Liu, K.B.; Liu, C.Y.; Liu, Y.H.; Chien, Y.C.; Wang, B.S.; Wong, Y.S. Analysis and Controller Design of a Universal Bidirectional DC–DC Converter. Energies 2016, 9, 501. [Google Scholar] [CrossRef]
  120. Box, G.E.P.; Jenkins, G.M.; Reinsel, G.C.; Ljung, G.M. Time Series Analysis: Forecasting and Control; Series in Probability and Statistics; Wiley: Hoboken, NJ, USA, 2015. [Google Scholar]
  121. Chen, S.; Billings, S.A.; Cowan, C.F.N.; Grant, P.M. Practical identification of NARMAX models using radial basis functions. Int. J. Control 1990, 52, 1327–1350. [Google Scholar] [CrossRef] [Green Version]
  122. Sjoberg, J.; Zhang, Q.; Ljung, L.; Benveniste, A.; Delyon, B.; Glorennec, P.Y.; Hjalmarsson, H.; Juditsky, A. Nonlinear black-box modeling in system identification: A unified overview. Automatica 1995, 31, 1691–1724. [Google Scholar] [CrossRef]
  123. Piroddi, L.; Spinelli, W. An identification algorithm for polynomial NARX models based on simulation error minimization. Int. J. Control 2003, 76, 1767–1781. [Google Scholar] [CrossRef]
  124. Hagan, M.; Demuth, H.; Beale, M.; Orlando, D. Neural Network Design; Martin Hagan: Stillwater, OK, USA, 2014. [Google Scholar]
  125. Kelley, C.T. Iterative Methods for Optimization. In SIAM Frontiers in Applied Mathematics; North Carolina State University Raleigh: North Carolina, CA, USA, 1999. [Google Scholar]
  126. Rumelhart, D.E.; Hinton, G.E.; Williams, R.J. Learning internal representation by error propagation. In Parallel Distributed Processing: Explorations in the Microstructures of Cognition; Rumelhart, David, E., McClelland, J.L., Eds.; MIT Press: Cambridge, MA, USA, 1986; Volume 1, pp. 318–362. [Google Scholar]
  127. Nguyen, D.; Widrow, B. Improving the Learning Speed of 2–Layer Neural Networks by Choosing Initial Values of the Adaptive Weights. In Proceedings of the International Joint Conference on Neural Networks, San Diego, CA, USA, 17–21 June 1990; Volume 3, pp. 21–26. [Google Scholar]
  128. Greenwood, P.E.; Nikulin, M.S. A Guide to Chi-Squared Testing; Wiley: New York, NY, USA, 1996; ISBN 0-471-55779-X. [Google Scholar]
  129. Chen, P.C.Y.; Mills, J.K. Neural network generalization and system sensitivity in feedback control systems. In Proceedings of the 12th IEEE International Symposium on Intelligent Control, Istanbul, Turkey, 16–18 July 1997; pp. 233–238. [Google Scholar]
  130. Hyndman, R.J.; Koehler, A.B. Another Look at Measures of Forecast Accuracy. Int. J. Forecast. 2006, 22, 679–688. [Google Scholar] [CrossRef]
  131. Söderström, T.; Stoica, P. System Identification; Prentice Hall International: Hemel Hempstead, UK, 1994. [Google Scholar]
  132. Kumar, B.; Khare, N.; Chaturvedi, P.K. FPGA-based design of advanced BMS implementing SoC/SoH estimators. Microelectron. Reliab. 2018, 84, 66–74. [Google Scholar] [CrossRef]
  133. Deutschena, T.; Gassera, S.; Schallera, M.; Siehr, J. Modeling the self-discharge by voltage decay of a NMC/graphite lithium-ion cell. J. Energy Storage 2018, 19, 113–119. [Google Scholar] [CrossRef]
  134. Lucua, M.; Martinez-Laserna, E.; Gandiaga, I.; Camblong, H. A critical review on self-adaptive Li-ion battery ageing models. J. Power Sources 2018, 401, 85–101. [Google Scholar] [CrossRef]
  135. Hu, M.; Li, Y.; Li, S.; Fu, C.; Qin, D.; Li, Z. Lithium-ion battery modeling and parameter identification based on fractional theory. Energy 2018, 165, 153–163. [Google Scholar] [CrossRef]
  136. Zou, C.; Zhang, L.; Hu, X.; Wang, Z.; Wik, T.; Pecht, M. A review of fractional-order techniques applied to lithium-ion batteries, lead-acid batteries, and supercapacitors. J. Power Sources 2018, 390, 286–296. [Google Scholar] [CrossRef]
  137. Yang, R.; Xiong, R.; He, H.; Chen, Z. A fractional-order model-based battery external short circuit fault diagnosis approach for all-climate electric vehicles application. J. Clean. Prod. 2018, 187, 950–959. [Google Scholar] [CrossRef]
  138. Wang, B.; Li, S.E.; Peng, H.; Liu, Z. Fractional-order modeling and parameter identification for lithium-ion batteries. J. Power Sources 2015, 293, 151–161. [Google Scholar] [CrossRef] [Green Version]
  139. Wawrzynski, P. Robot’s velocity and tilt estimation through computationally efficient fusion of proprioceptive sensors readouts. In Proceedings of the 20th International Conference on Methods and Models in Automation and Robotics, Międzyzdroje, Poland, 24–27 August 2015; pp. 738–743. [Google Scholar]
  140. Narendra, K.S.; Parthasarathy, K. Learning Automata Approach to Hierarchical Multiobjective Analysis. IEEE Trans. Syst. Man Cybern. 1991, 20, 263–272. [Google Scholar] [CrossRef]
Figure 1. The test stand: (a) General scheme; (b) photograph [29].
Energies 11 03160 g001
Figure 2. Plots of the: (a) Current in pulse cycle; (b) battery body temperature in pulse cycle; (c) temperature at the battery terminals in pulse cycle; (d) ambient temperature.
Energies 11 03160 g002
Figure 3. Substitute diagram of the double polarization (DP) model.
Energies 11 03160 g003
Figure 4. Equivalent diagram of the battery for the DP model in Matlab Simscape.
Energies 11 03160 g004
Figure 5. Graphs of the identified parameters of DP model: (a) UOCV; (b) R0; (c); R1; (d) R2; (e) C1; (f) C2 for State of Charge (SOC) ranging from 0.2 to 0.8 in pulse work cycle.
Energies 11 03160 g005
Figure 6. The parallel (recurrent) structure Nonlinear AutoRegressive eXogenous Arificial Neural Network (NARX-ANN) model with two neurons in hidden layer, and one neuron in the output layer (D-Tapped Delay Line).
Energies 11 03160 g006
Figure 7. The performance of NARX-ANN models during training, respectively for: (a) SOC = 0.2; (b) SOC = 0.3; (c) SOC = 0.4; (d) SOC = 0.5; (e) SOC = 0.6; (f) SOC = 0.7 and (g) SOC = 0.8 in pulse work cycle.
Energies 11 03160 g007
Figure 8. The linear regression plots of NARX-ANN model for training, validation and testing subsets, (a) SOC = 0.2; (b) SOC = 0.3; (c) SOC = 0.4; (d) SOC = 0.5; (e) SOC = 0.6; (f) SOC = 0.7 and (g) SOC = 0.8 in pulse work cycle.
Energies 11 03160 g008aEnergies 11 03160 g008b
Figure 9. Error histograms of NARX-ANN models after training, respectively for: (a) SOC = 0.2; (b) SOC = 0.3; (c) SOC = 0.4; (d) SOC = 0.5; (e) SOC = 0.6; (f) SOC = 0.7 and (g) SOC = 0.8 in pulse work cycle.
Energies 11 03160 g009
Figure 10. Graphs of voltage at battery terminals. Comparison between NARX and DP models and measurement results, with presented error values, respectively for: (a) SOC = 0.2; (b) SOC = 0.3; (c) SOC = 0.4; (d) SOC = 0.5; (e) SOC = 0.6; (f) SOC = 0.7 and (g) SOC = 0.8 in pulse work cycle.
Energies 11 03160 g010aEnergies 11 03160 g010bEnergies 11 03160 g010c
Table 1. Values of polynomial coefficients from dependency (9) for DP model.
Coefficient NameR0R1R2C1C2UOCV
A−42−3.9 × 10−51106 × 108−8.9 × 10414
B1403.1 × 105−320−1.4 × 1092.3 × 105−27
C−2003901 × 109−2.2 × 10517
D140−2503.6 × 1081.1 × 105−3.3
E−57921.8 × 108−2.3 × 1045.8
F11−18–3.8 × 1072 × 103
G−0.851.43.5 × 106
Table 2. Quality indices for NARX and DP models of the Valve-Regulated Lead-Acid (VRLA) battery.
State of Charge (SOC) Data Set ValueNARX ModelDP Model
MSENARXNRMSENARXMSEDPNRMSEDP
0.29.6263 × 10−50.94530.2009 × 10−30.9210
0.34.9337 × 10−50.95460.2673 × 10−30.8986
0.43.3201 × 10−50.94270.0695 × 10−50.9192
0.52.9521 × 10−50.93710.0542 × 10−30.9147
0.62.4470 × 10−50.93760.1323 × 10−30.8549
0.72.1085 × 10−50.94070.0528 × 10−30.9062
0.84.2477 × 10−50.94890.9224 × 10−30.7737

