1. Introduction
With the signing of the United Nations Paris Agreement on 12 December 2015, 195 states or associations of states [
1] committed themselves to limiting global warming to well below 2° C when compared to the pre-industrial level [
2]. To implement this goal, the European Commission (EC) presented its 2050 long-term strategy on 28 November 2018 [
3]. In this document, the goal of a climate-neutral European economy for the year 2050 is outlined. In order to achieve this goal, a significant expansion of renewable energies especially in the electricity sector must be achieved [
4]. For the electricity sector, most scenarios assume that a focus will be on the expansion of technologies providing electricity from renewable energy sources (RES-E) such as solar and wind [
5,
6,
7]. Several studies have shown that an improved spatial distribution of RES-E capacities within Europe is helpful to balance the fluctuations of wind flow and solar radiation [
8,
9,
10].
In 2017, the European Commission agreed to implement the European Energy Union [
11]. This strategy consists of five dimensions: energy security, a fully-integrated internal energy market, energy efficiency, decarbonization, and research. An important component for achieving the Energy Union is the expansion of European electricity transmission capacities [
12]. In Reference [
13], the European Commission already reported in detail on the state of the internal energy market and pointed out that sufficient cross-border transmission capacities are a necessary requirement for achieving the energy policy goals. The advantages resulting from the expansion of the European transmission grid are also described in a large number of studies. Expansion of the transmission grid is being described as a "no regret" strategy [
14], an efficient flexibility option [
15], a requirement for a cost-efficient RES-E extension and integration [
16,
17], and as “needed to achieve the European targets cost-efficiently” [
18].
However, the EU Commission has also pointed out the stalling of the expansion of interconnector capacities. This hampers the continued development of the internal energy market. On behalf of the EU Commission, Roland Berger Strategy Consultants [
19] identified the regulatory framework as a major obstacle to the expansion of cross-border transmission capacity. In addition to regulatory issues, Battaglini et al. [
20] also indicate a lack of public acceptance as a cause for the delay in grid expansion. In 2014, the EU Commission launched a package of measures called "Connecting Europe Facility" to improve investment conditions. These measures notably aim at improving and harmonizing approval procedures and adapting regulatory regimes with particular emphasis on dealing with risks in network expansion. The Agency for the Cooperation of Energy Regulators (ACER) has identified significant delays in the projects of common interest (PCI). ACER [
21] has shown that 75% of PCIs in the phase of “permitting” are delayed or have been rescheduled.
Many studies compare different levels of grid expansion while maintaining CO
2 reduction [
8,
14] or RES-E targets [
17,
22,
23], to determine the cost-optimal mix through a variation in the expansion of RES-E technologies, back-up capacities, or storage units. As part of the Ten-Year Network Development Plan (TYNDP) 2018, a "no grid" scenario was conducted for the year 2040, in which no further grid expansion is assumed after 2020. All other input data, such as power plant fleet or electricity demand, were kept corresponding to the reference scenario. The authors conclude that “No Grid is incompatible with the achievements of European emission targets” [
24]. An additional 156 TWh of RES-E is curtailed per year on average across the scenarios considered and “the grid built between 2020 and 2040 allows a further 10% decrease in power sector CO
2 emissions as compared to the 1990 levels” [
24].
The present paper focuses on the delay of interconnector expansion and analyzes what impact a persistence of current delays in the expansion of interconnector capacities would have in a high RES-E scenario. The focus is on quantifying the effects of delay of interconnector expansion on the indicators’ CO2 emissions, generation mix, electricity exchange, and variable costs of electricity generation. Scenario years 2030, 2040, and 2050 are being considered with RES-E shares in electricity demand of 62% to 99%. Results show that both CO2 emissions and variable costs of electricity generation increase in case of delayed interconnector expansion. This effect is most significant in scenario year 2050, where lower connectivity roughly leads to a doubling of both CO2 emissions and variable costs of electricity generation. Those effects arise from lower levels of European electricity trading, higher RES curtailment, and corresponding higher conventional electricity generation. With regard to the latter, the analysis indicates a more extensive use of natural gas power plants, especially in Southern and Central Europe, since less renewable electricity from Northern Europe can be integrated.
Section 2 describes methodology and data, including the electricity market model PowerFlex EU, which was used for this analysis. This also includes a review of existing scenarios regarding electricity demand, generation capacities, and net transfer capacities (NTC). The section also explains how the delays in NTC expansion have been derived. The modeling results can be found in
Section 3. In
Section 4, the results are being discussed and compared with other studies. Lastly,
Section 5 concludes.
2. Methodology and Data
This paper examines in a what-if analysis what impact the persistence of current delays in the expansion of interconnector capacities would have in a high RES-E scenario. Electricity market scenarios from various literature sources were evaluated to determine future generation capacities and electricity demand. An ambitious energy transition scenario was derived from these data (cf.
Section 2.2). To determine the effects of delayed interconnector expansion, the electricity market scenario was modelled with two different interconnector capacity expansion levels. The high connectivity (HiCon) scenario, with strong interconnector expansion, is based on literature values. The lower connectivity (LowCon) scenario was derived by extrapolating the current interconnector expansion delay (cf.
Section 2.3).
For this study, scenario years 2030, 2040, and 2050 were considered. The data described was used as input for the electricity market model PowerFlex EU (see
Section 2.1). The effect of a delayed expansion was determined with a delta analysis in which the scenarios high connectivity and lower connectivity were compared.
The following indicators were analyzed:
CO2 emissions.
Electricity generation mix.
Import, export, and transit flows.
Variable costs of electricity generation.
2.1. General Model Description-PowerFlex EU
PowerFlex EU is a bottom-up partial model of the European power sector that has been applied in a range of consultancy and research projects on a German and European level, such as analysis on flexibility options [
25,
26] or scenario development [
27,
28]. It calculates the dispatch of thermal power plants, feed-in from renewable energy sources, and utilization of flexibility and storage options at minimal costs to meet electricity demand and reserve capacity requirements.
The model covers all ENTSO-E member states except Iceland and Cyprus. A transport model approach is used to represent electricity exchange between countries. For each individual country, a homogeneous market area without grid constraints is assumed. Exchange between countries is limited by net transfer capacities (see
Section 2.3).
For Germany, thermal power plants with capacities exceeding 100 MW are represented as individual units. For other countries, the thermal power plant fleet is represented as aggregated vintage classes concerning age, fuel type, and technology of the individual plants.
The available electricity produced from run-of-river, offshore wind, onshore wind, and photovoltaic systems is represented by generic feed-in patterns in hourly resolution. The actual quantity of feed-in is determined endogenously, with the result that the available yield of fluctuating electricity can also be curtailed (e.g., in the case of negative residual load and insufficient storage capacity).
The model considers reservoir hydro plants, pumped hydro storage, battery storage, and power-to-gas (PtG) as flexibility options. The flexibility of reservoir hydro plants is modeled with an inflow profile of hydro in hourly resolution, a storage capacity of the reservoir, a given level of the reservoir for the first and the last time step, and an electrical capacity of the turbine. All other flexibility options mentioned are modeled with the following parameter’s set: pumping or charging capacity, storage capacity, electrical capacity of the turbine or discharging, and the overall efficiency rate. Power–to-gas is modeled as an electricity to electricity storage option to keep the system boundary closed to the electricity system.
The available battery capacities scale with the installed photovoltaic (PV) capacities, and the available capacities of the electrolysers for Power-to-Gas (PtG) generation scale with variable RES-E capacities installed (for details, see
Appendix B).
Heat sector coupling is modelled as a further flexibility option only for Germany and not for other ENTSO-E countries. It is represented by combined heat and power plants (CHP) that can shift their power-to-heat ratio within certain technological limitations. Additional generation and flexibility options in the heat sector include heat storage, electrical heating rods, and gas fired boilers.
Electricity demand is assumed to be inelastic. To derive demand profiles in hourly resolution, a standardized demand profile of the base year 2016 is scaled up using scenario-specific annual demand data (see
Section 2.2.1). It is assumed that the load profile shape does not change over time (e.g., by increasing demand of new consumers and sector coupling).
Generation, transmission, and storage capacities are determined exogenously, i.e., the model does not endogenously calculate cost efficient investment or divestment pathways. The model assumes perfect foresight and calculates the cost-minimizing dispatch of given capacities in hourly resolution across a single year (8760 hours). In technical terms, it is formulated as a linear optimization problem, implemented in GAMS, and solved using the CPLEX solver.
2.2. Electricity Market Scenarios
In the following sections, the data used is described. All data used has been published (cf.
Appendix A). The input data for Germany is based on the scenario Klimaschutzszenario 95 (KS 95) from Reference [
28] and is described in
Section 2.2.2. To derive the European input data, a scenario analysis based on a literature review was carried out (cf.
Section 2.2.1). In
Appendix D, the generation capacities per country, used as model input for the year 2050 are given.
2.2.1. European Scenario
The European scenario was determined by means of a scenario analysis of literature data, including TYNDP 2018 [
5], the study eHighway 2050 [
29], EU Vision Scenario 2017 [
30], and EU Reference Scenario 2016 [
31]. In the project Model-Based Scenario Analysis of Developments in the German Electricity System, which takes into account the European context up to 2050 in which this study was carried out. Two European electricity market scenarios were derived: an ambitious scenario in which a strong expansion of RES and a significant decline in conventional power plants are assumed, and an unambitious scenario with much slower progress in European energy transition. The unambitious scenario is based on the EU Reference Scenario 2016 [
31]. Non EU28 countries are not covered in the scenario and were taken from TYNDP 2018 scenario Sustainable Transition [
5].
The years 2040 and 2050 of the ambitious scenario are based on eHighway 2050 scenario 100% RES [
29]. Hydro power and biomass generation capacities increase very strongly in the scenario, which does not seem comprehensible from the perspective of natural restrictions, respectively, and competing land use. Therefore, values of the eHighway 2050 Big & Market scenario [
29] were used for these technologies. For hydro power generation capacities, it was further assumed that the installed capacities per country will not fall below the current level. In order to ensure that sufficient secure services are available, the size of natural gas capacities, which decrease significantly in the 100% RES scenario, was also taken from eHighway 2050 scenario Big & Market. The data for the scenario year 2030 was generated on the basis of an interpolation between TYNDP 2018 scenario Best Estimate 2020 [
5] and the values of the ambitious scenario for the year 2040. In the following, the ambitious and the unambitious scenario are compared with the spread of the considered scenarios. In
Appendix C, the scenarios considered are presented in more detail.
Since the European grid expansion will play an important role especially for a high RES-E scenario with large shares of wind and solar, this paper focuses on the ambitious scenario. Further results from this project, such as the effects obtained in the variation of European scenarios while maintaining the German scenario, will be published as a working paper on
www.oeko.de by the end of 2019.
The following scenario presentation focuses on EU28 countries, since some of the scenarios only cover these countries. All ENTSO-E member states, except Iceland and Cyprus, were taken into account in the modeling work.
Electricity Demand
Figure 1 shows the development of electricity demand in the unambitious and the ambitious scenario when compared to the scenario spread that results from the scenarios TYNDP 2018 [
5], the study eHighway 2050 [
29], EU Vision Scenario 2017 [
30], and the EU Reference Scenario 2016 [
31]. During the period up to 2050, most of the scenarios show a significant increase in demand, which can be attributed to an overcompensation of efficiency measures by an increase of new electricity consumers, such as electric mobility or heat pumps. The unambitious and ambitious scenarios show a relatively similar trend for electricity demand and are in the midfield of the scenarios considered. Compared to 2016, the electricity demand increases by 28% in the unambitious scenario and by 31% in the ambitious one.
Renewable Generation Capacities
Figure 2 shows the development of generation capacities for wind, solar, biomass, and hydro power in the unambitious and the ambitious scenario compared to the scenario spread that results from the scenarios TYNDP 2018 [
5], the study eHighway 2050 [
29], EU Vision Scenario 2017 [
30], and EU Reference Scenario 2016 [
31].
Wind and solar capacities increase significantly in all scenarios. The ambitious scenario is located at the top and the unambitious scenario is located at the bottom of the scenario funnel. In the ambitious scenario, wind capacities are more than five times higher than in 2016, and solar capacities are more than six times higher. In the unambitious scenario, wind capacities more than double compared to 2016 and solar capacities almost triple compared to 2016. In the unambitious and the ambitious scenario, both biomass capacities roughly double when compared to 2016. Compared to the scenario spread, this is a moderate increase. Hydro power capacities increase compared to 2016 by approximately 50% in the ambitious scenario and by approximately 10% in the unambitious scenario.
Conventional Generation Capacities
Figure 3 shows the development of the conventional generation technologies natural gas, coal, and nuclear power in the unambitious and the ambitious scenario when compared to the scenario spread that results from the scenarios TYNDP 2018 [
5], the study eHighway 2050 [
29], EU Vision Scenario 2017 [
30], and the EU Reference Scenario 2016 [
31]. In most scenarios, natural gas capacities show a slight decline over the next few years, which is followed by an increase until 2050 to provide for sufficient secured capacity. In the ambitious scenario, natural gas capacities in 2050 are approximately 15% above today’s level. In the unambitious scenario, natural gas capacities increase by approximately 25% compared to today’s level.
In all scenarios, coal capacities decline significantly from the current level, even though levels reached in the scenario year 2050 differ significantly. While the ambitious scenario assumes a European-wide phase-out of coal by 2050, the unambitious scenario assumes that coal capacities will decline to approximately 35% by 2040 compared to 2016 and to approximately 33% by 2050.
The scenarios differ even more in the assumptions on nuclear power development. While some scenarios assume an increase in nuclear power, most scenarios assume at least a slight decline. In the unambitious scenario, nuclear power capacities decline to approximately 77% for today’s level. In the ambitious scenario, a European-wide nuclear phase-out is assumed.
2.2.2. German Scenario
The assumptions on the development of the German electricity market are based on scenario Klimaschutzszenario 95 (KS 95) from Reference [
28].
Figure 4 shows the development of installed capacities and electricity demand for Germany. In order to end up with a more ambitious scenario in our analysis, we decided to further reduce the coal capacity for 2050 from 2.7 GW to 0 GW compared to the original scenario values. The nuclear phase-out [
34] will be completed before 2030. By the year 2050, the installed wind capacity is expected to increase by a factor of 4 compared to the 2016 level and the solar capacity is expected to triple during this period. While biomass in the electricity sector will be of less importance, it is assumed that the installed capacities of hydro power (run-of-river and pumped storage) will double by 2050. Efficiency measures will dominate the development of electricity demand until 2030. After that, the demand for electricity will rise again due to new consumers such as heat consumers and electric mobility and will be about a quarter above the current level in 2050.
2.3. Interconnector Scenarios
The integration of the European electricity system strongly depends on whether interconnector capacities develop, according to investment plans or whether investment hurdles slow down the process. Forecasts of net transfer capacities (NTCs) usually assume idealized developments of interconnection based on economic or technical needs, and do not explicitly take practical investment hurdles into account.
The Agency for the Cooperation of Energy Regulators (ACER) has identified significant delays for the projects of common interest (PCI). ACER [
21] has shown that 75% of PCIs in the phase of “permitting” are delayed or rescheduled. Bureaucracy and a lack of social acceptance seem to be the main reasons for delays. Given high investment risks for large-scale cross-border projects, Roland Berger [
19,
36] has further argued that regulatory flaws and uncertainty about cost approval may present investment hurdles. A counter effect may result from economies of scale, especially learning curve effects both for investors and administration.
All these determinants of the net transfer capacities (NTC) development are more or less strongly related to the political ambitions of promoting a continued integration of the European electricity system. Accordingly, we distinguish between two integration scenarios. The high connectivity scenario reflects an ideal development of NTCs and draws on the original forecast data of eHighway 2050 scenario 100% RES [
6]. Hence, in this scenario, we implicitly assume that potential investment barriers can be overcome. The lower connectivity scenario may be interpreted as a “business-as-usual” case, where issues of investment delays are not resolved. For this scenario, the original forecasts are adjusted downward to reflect slower NTC development (the methodology of how these adjustments are derived are given in
Appendix B) Our adjustments lead to a regressive increase of the investment spread between the high and lower connectivity scenario (denoted ΔInv), which results in the downward-sloping curve for ΔInv, as shown in
Figure 5.
Figure 6 shows cumulated NTCs for the ENTSO-E area assumed in TYNDP 2018 [
5] and eHighway 2050 [
29]. In the period up to 2050, a significant increase in NTCs of up to six times of their current value is assumed. In addition to the expansion of cross-border lines, this also takes into account a higher availability of transmission lines for transnational electricity trading. According to Reference [
38], the average NTC to thermal grid capacity ratio was 31% in 2016. This means that, on average, only 31% of physical cross-border transmission capacity was made available for transnational electricity trading. According to the EC’s Communication on strengthening Europe’s energy networks [
39], at least 70% of thermal capacity must be made available to the cross-border market by 2025. If this adjustment was applied to the 2016 NTCs, the exchange capacities could be increased from approximately 57 GW to approximately 128 GW (see
Figure 6).
The high connectivity scenario is based on the values of eHighway 2050. For the scenario year 2030, there is no differentiation of NTC assumptions in this source. The extended scenario in eHighway 2050 and, thus, the scenario with the stronger NTC expansion is used for the year 2040. In the scenario year 2050, there is a clear spread between the eHighway scenarios. In this case, according to the electricity market scenario, the values of the 100% RES scenario were used. For the lower connectivity scenario, as described above, delays in the expansion of coupling capacities were transferred in accordance with the changes from TYNDP 2018 to TYNDP 2016 for the year 2020. Comparing these values with the data of TYNDP 2018, it can be seen that, in the high connectivity scenario, significantly higher values are applied, while, in the lower connectivity scenario, values are approximately at the level of TYNDP.
Figure 7 shows NTCs between the countries considered and their sum of export capacities in the high connectivity scenario for the year 2050. The cumulative increase in coupling capacities shown in
Figure 3 is illustrated at country level. Germany, France, and the United Kingdom, in particular, have very strong networks with their neighboring countries, with cumulative export capacities of between approximately 70 and 120 GW.
4. Discussion
This paper examines the effects of a delayed expansion of interconnector capacities between European countries. In the framework of this analysis, other input parameters, such as generation capacities and electricity demand, are not varied. In the following, approaches to compensate for a delayed grid expansion are discussed. This is followed by a detailed comparison of the results with the TYNDP 2018 "no grid" scenario.
Other studies discuss mainly two approaches as alternatives to grid expansion. More flexibility can be added to the system, or the geographical deployment of RES-E capacities can be oriented toward the distribution of electricity demand. Therefore, the question arises whether our results are due to a lack of these alternatives in our assumptions. If there is insufficient flexibility and RES-E is concentrated in specific areas, then the value of the grid expansion that we have shown could be largely driven by the assumptions.
First, with regard to the flexibility approach, METIS Study S1: Optimal flexibility portfolios for a high-RES 2050 scenario [
42] provides a good benchmark. This study examined the need for flexibility in Europe with 80% RES share. Comparing the results of this study with our flexibility assumptions for the year 2040, in which an RES share of approximately 80% is achieved, it can be seen that the expansion of interconnectors is assumed to be roughly the same as in our lower connectivity scenario and that the pumped storage capacities are on a similar level. In order to avoid any restrictions resulting from a lack of flexibility, our assumptions regarding the electrolyser and battery capacities are significantly higher. In Reference [
42], the demand response was considered another flexibility option, which is more than compensated for by our higher assumptions for battery capacities. The comparison of the considered flexibility options with the METIS Study indicates that flexibility options that compete with the flexibility of the grid have sufficiently been taken into account in our scenario analysis and that the effects of a lower grid expansion are not a result of a lack of such flexibility. Rather, the observed effects of a delayed expansion of interconnectors would increase further if fewer alternative flexibility options were considered. Second, a demand-driven distribution of RES-E can, to some extent, reduce the expansion needs of the European transmission grid (cf. [
16]). If RES-E technologies are not distributed to the most favorable sites, this increases their levelized cost of electricity. According to Fuersch et al. [
18], the higher costs for RES-E generation are not compensated for by the savings made in grid expansion, while DNV GL [
16] argues that, with “decreasing costs of renewable electricity, the cost of grid expansion increasingly becomes a relevant factor, which may offset higher generation costs of RES-E that are deployed at less optimal geographical locations” (cf. [
16] page 4). In the eHighway 100% RES scenario, renewables were distributed in Europe using distribution keys, which reflects both capacity factors and demand (cf. [
6]). Thus, renewables were not distributed exclusively according to their generation costs, and our analysis already includes the mitigating effect on grid expansion, to a certain extent.
Our results can best be compared with the "no grid" scenario of TYNDP 2018 [
24]. In this approach, for the scenario year 2040, no further grid expansion is assumed from 2020 onwards, while all other input data, such as power plant fleet or electricity demand, is correspond to the reference scenarios.
Table 5 shows a comparison of the RES-E share in electricity demand and the NTC reduction between TYNDP 2018 and this study. It can be seen that, in this study, the RES-E share is comparatively high, while the relative NTC reduction is lower than in the TYNDP analysis. As has been shown in
Figure 6, the planned expansion of interconnector capacity for 2040 in TYNDP 2018 is roughly at the level of the lower connectivity scenario. Therefore, in the high connectivity scenario, a significantly stronger expansion of interconnector capacities is assumed.
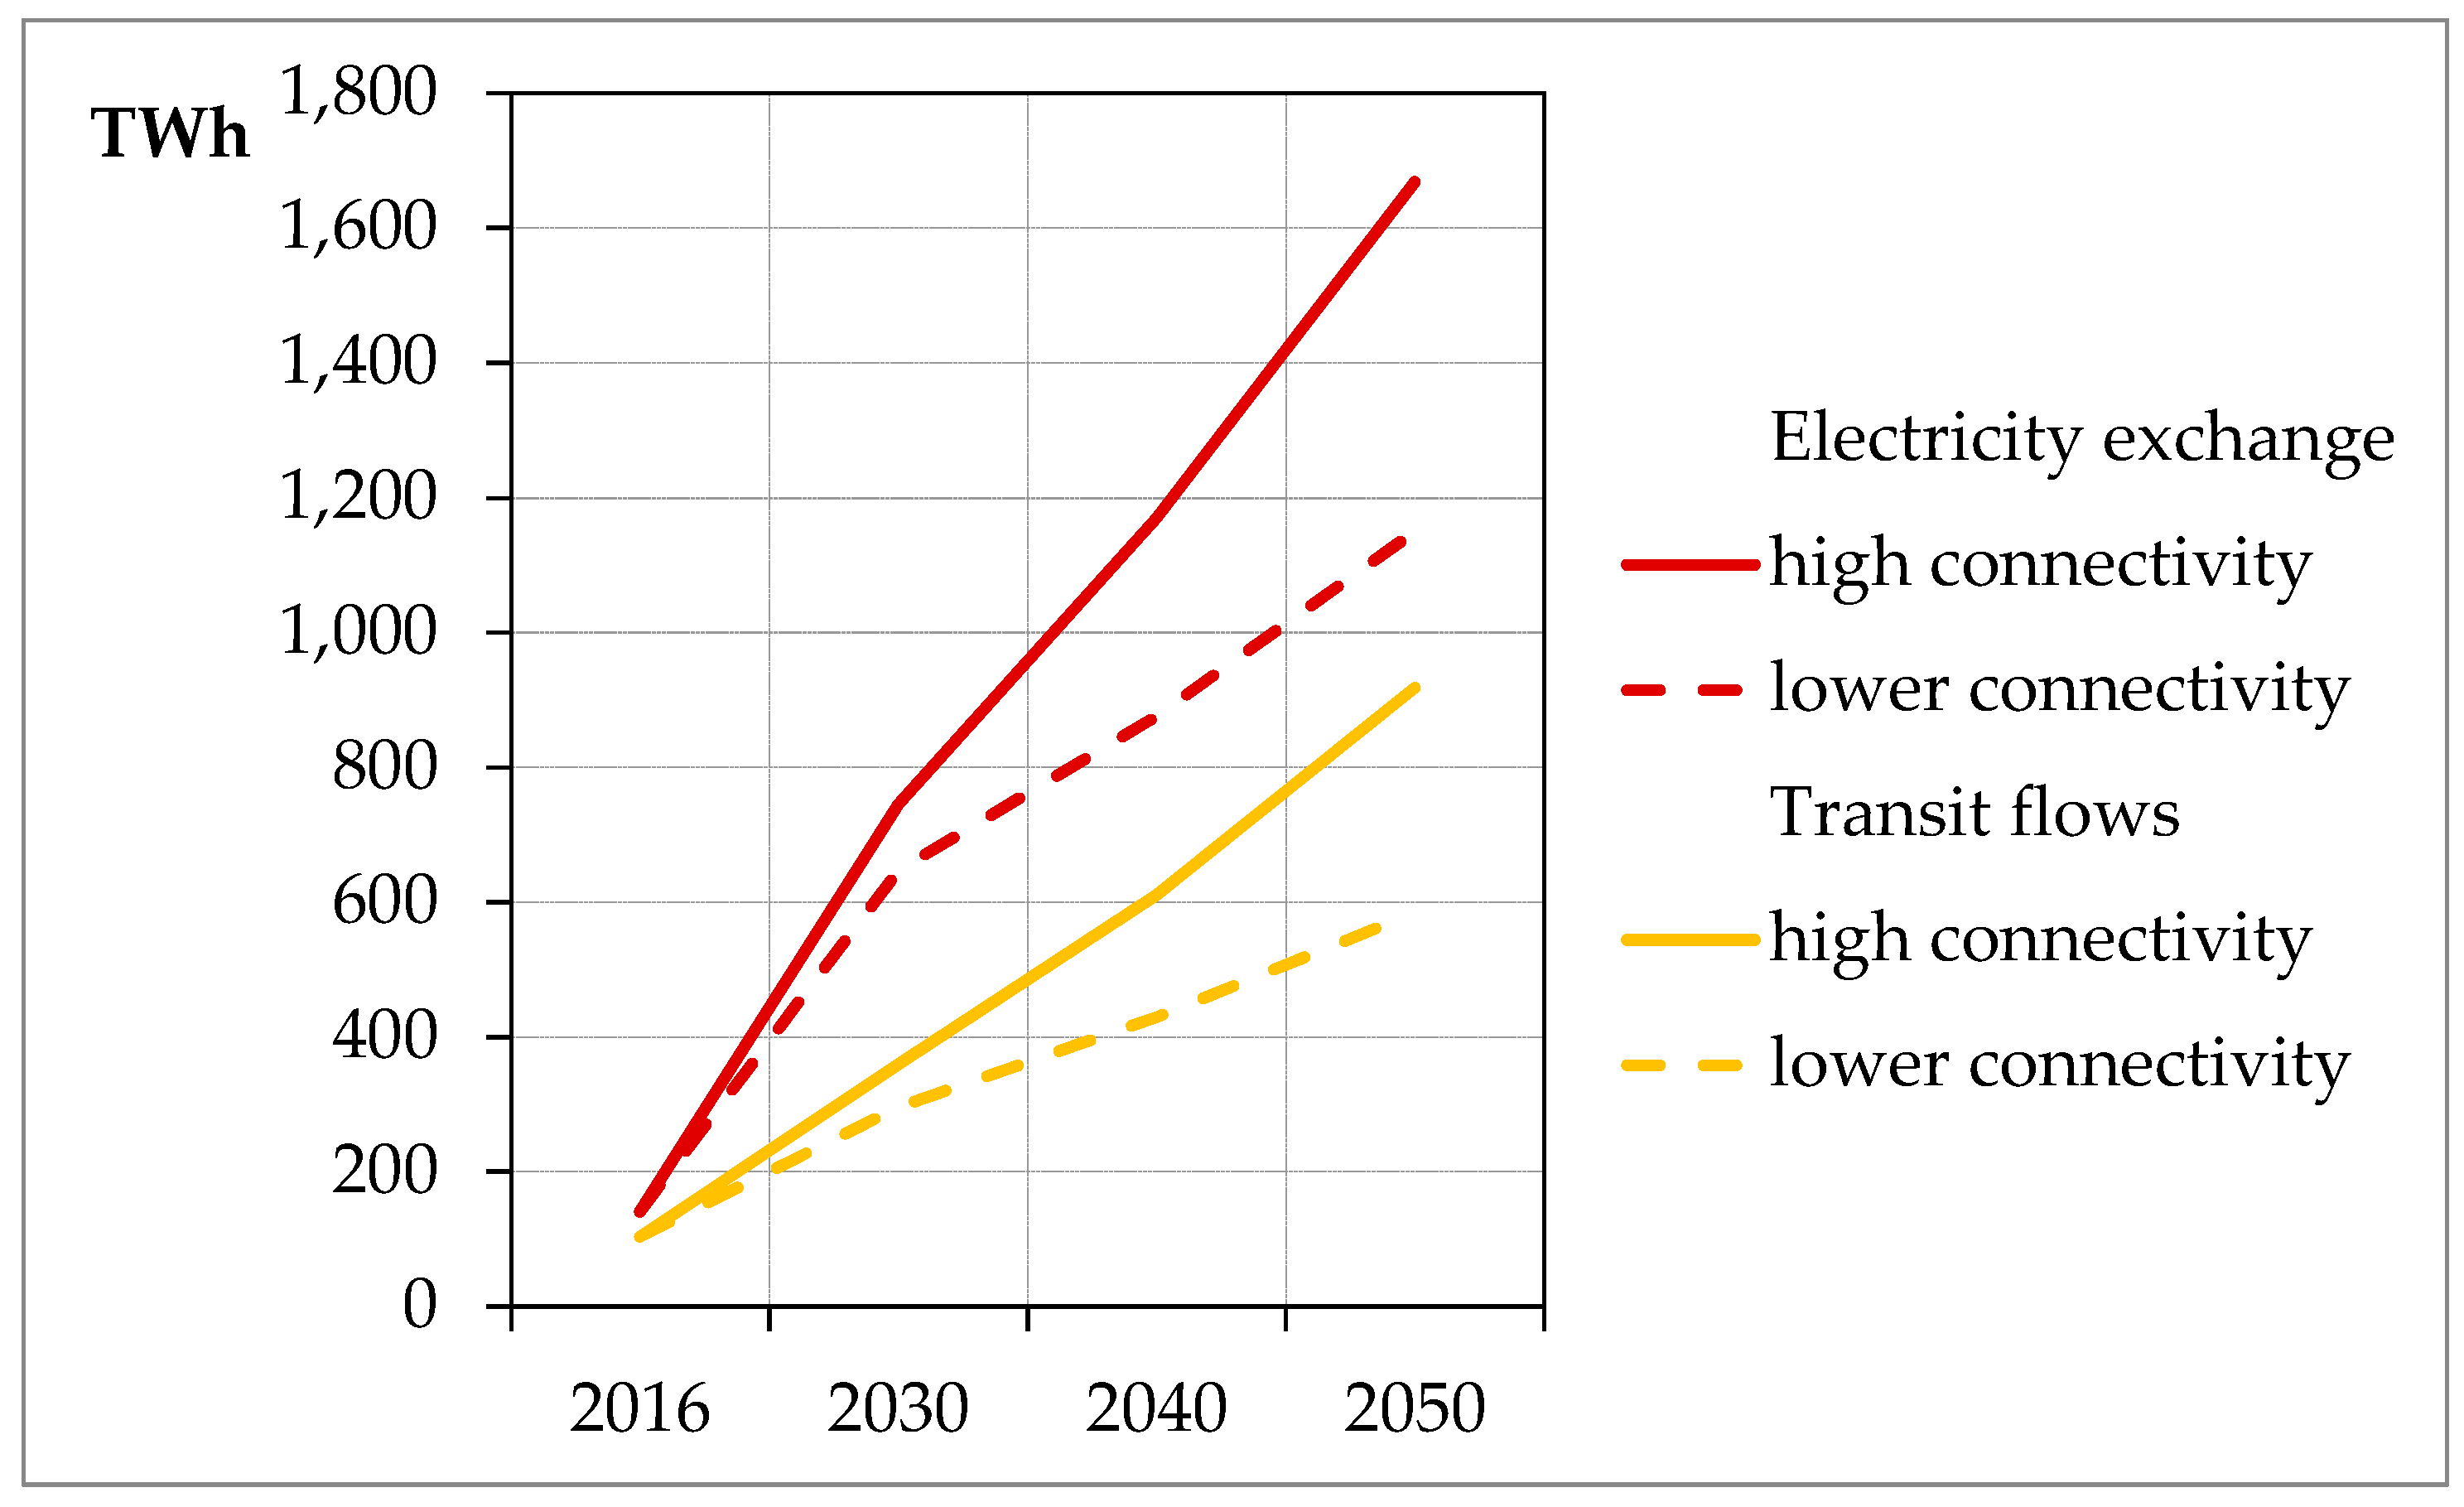
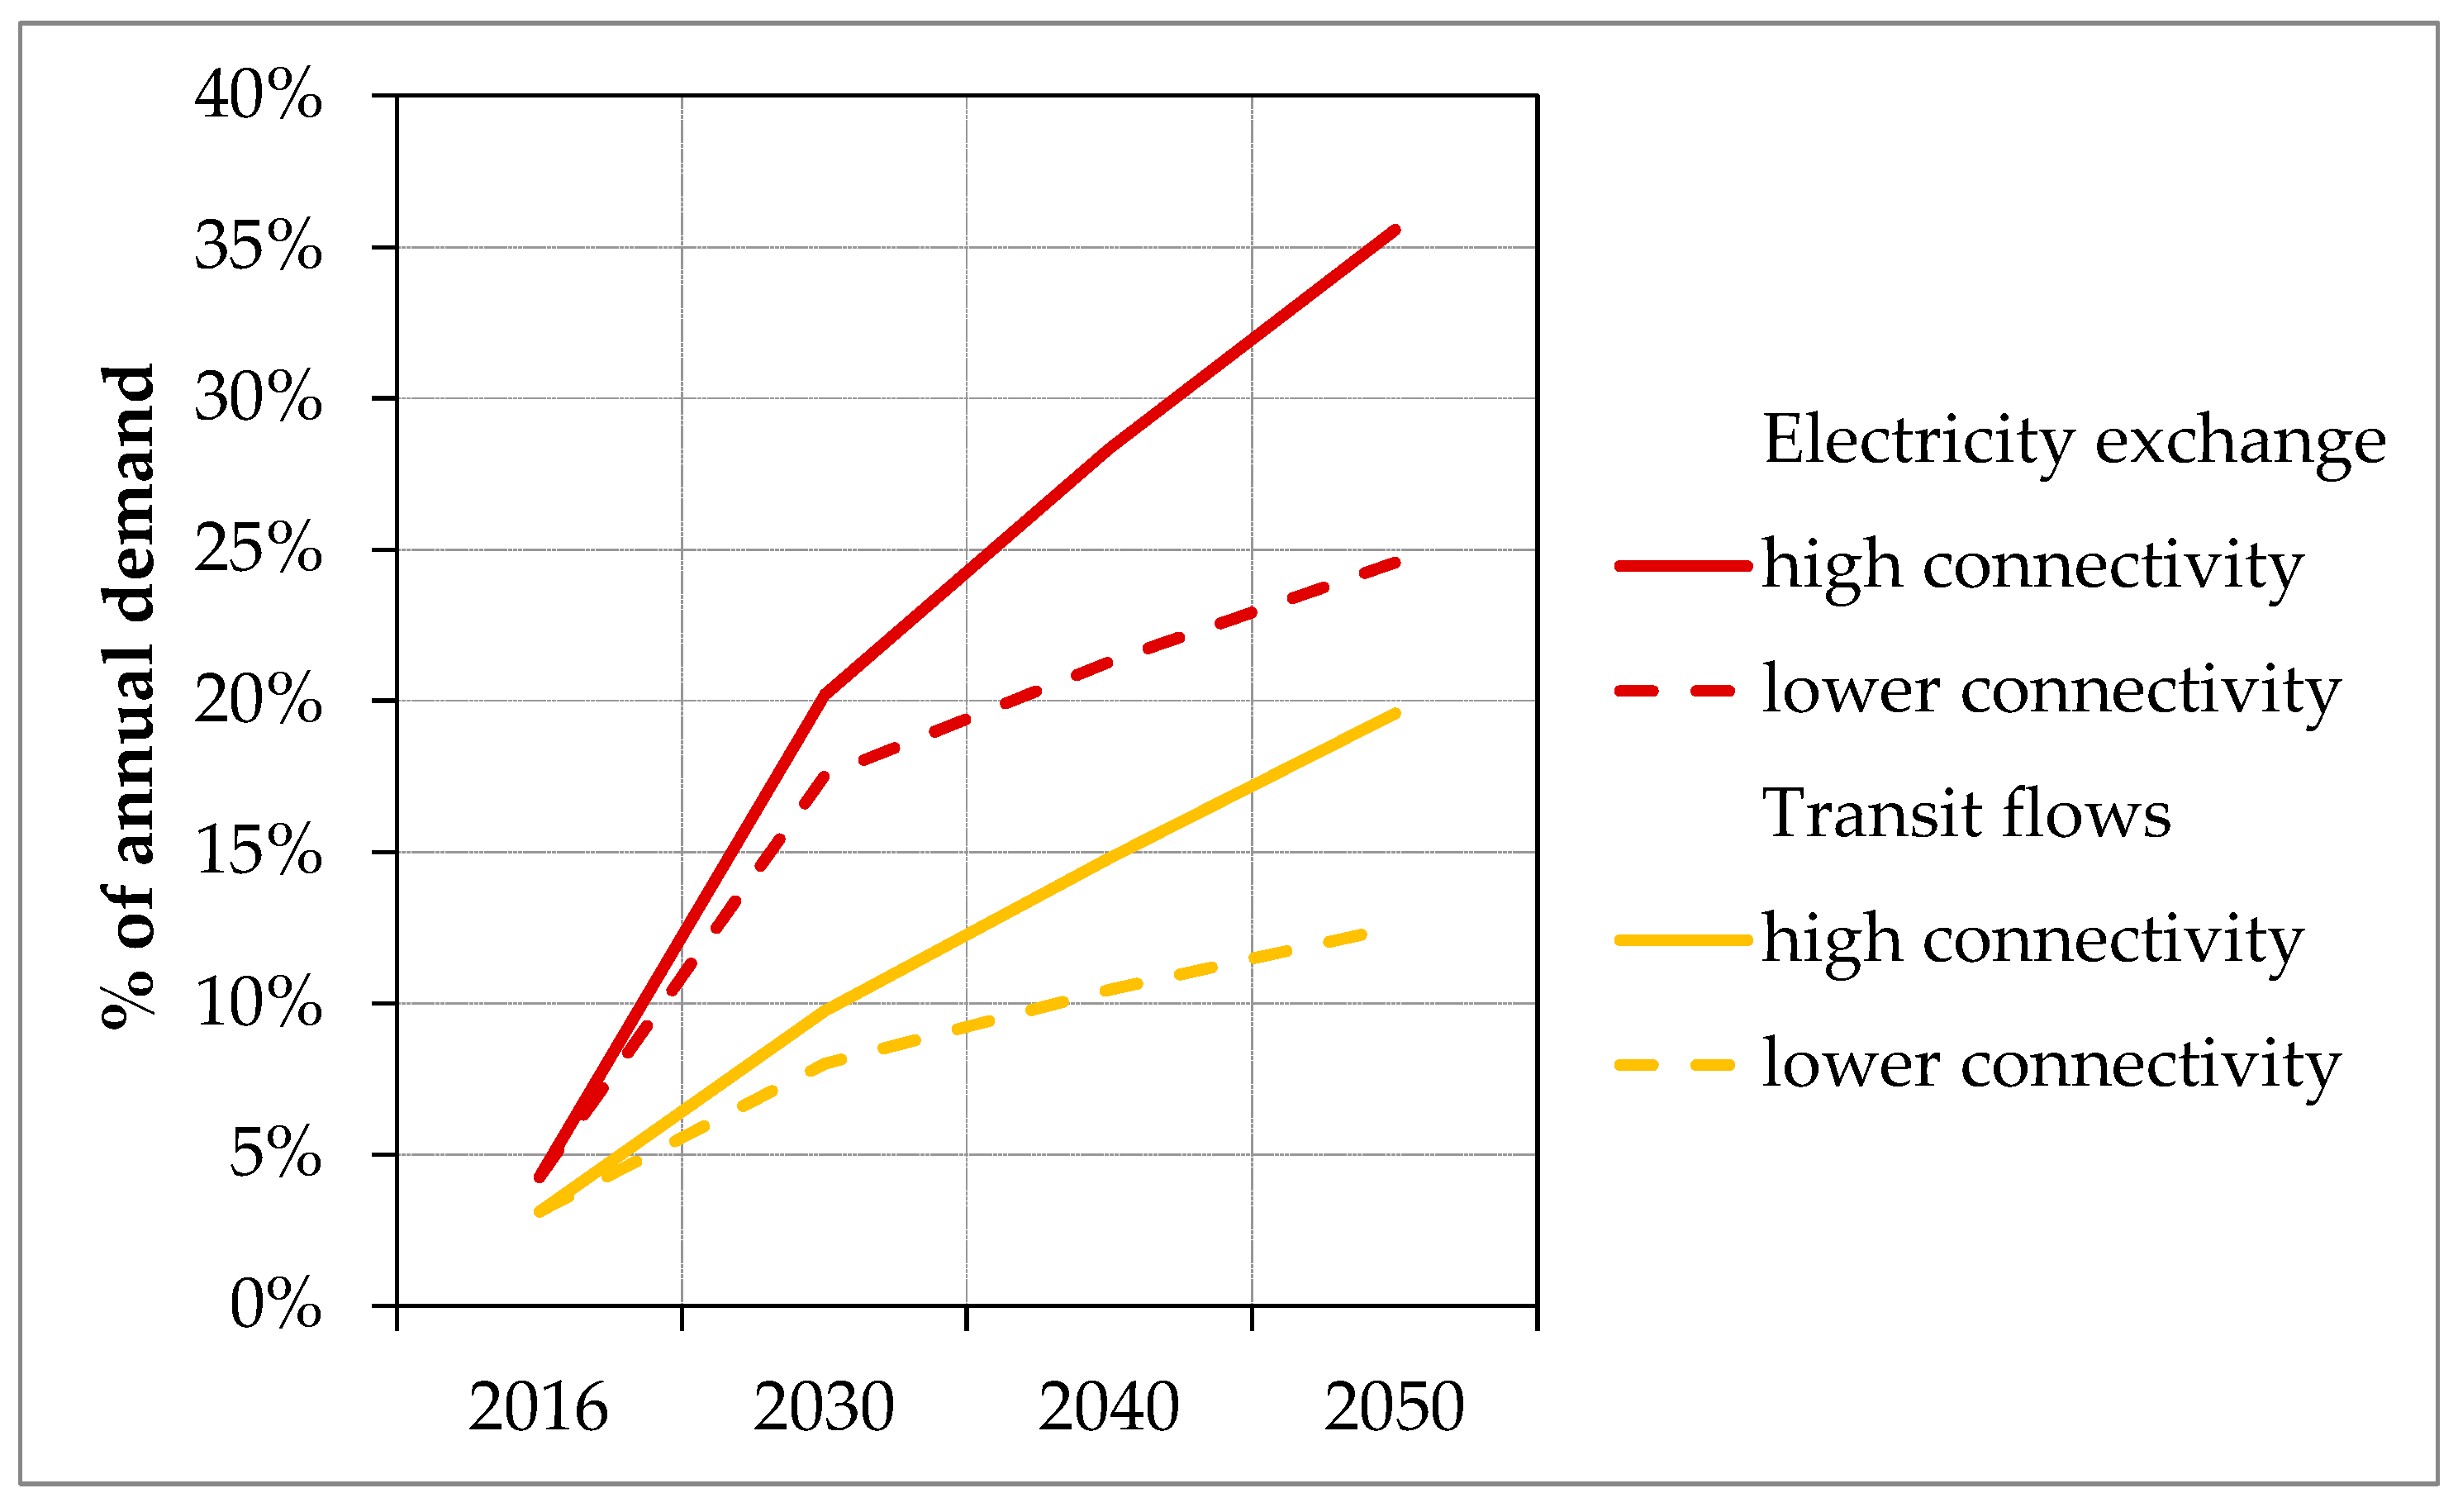
In the following, we compare our results for electricity exchange, electricity generation mix, CO2 emissions, and variable costs of electricity generation with the TYNDP 2018 “no grid” scenario.
Our analysis shows that a reduced expansion of interconnector capacities limits European electricity trading. It reduces electricity exchange between 13% in 2030 and 31% in 2050. In the TYNDP 2018 “no grid” scenario, this analysis is given as net annual balance per region and can, therefore, not be directly compared. However, the “no grid” view also comes to the conclusion that “the enhanced grid leads to a much greater level of power transfer between countries” (cf. [
24] page 19).
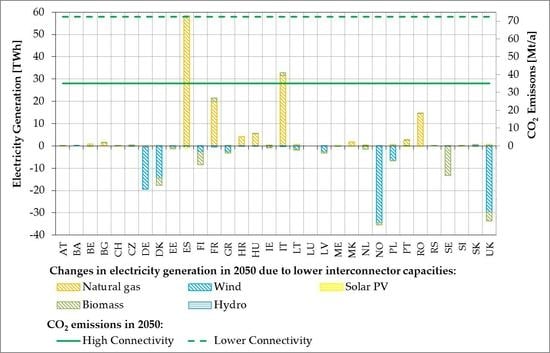
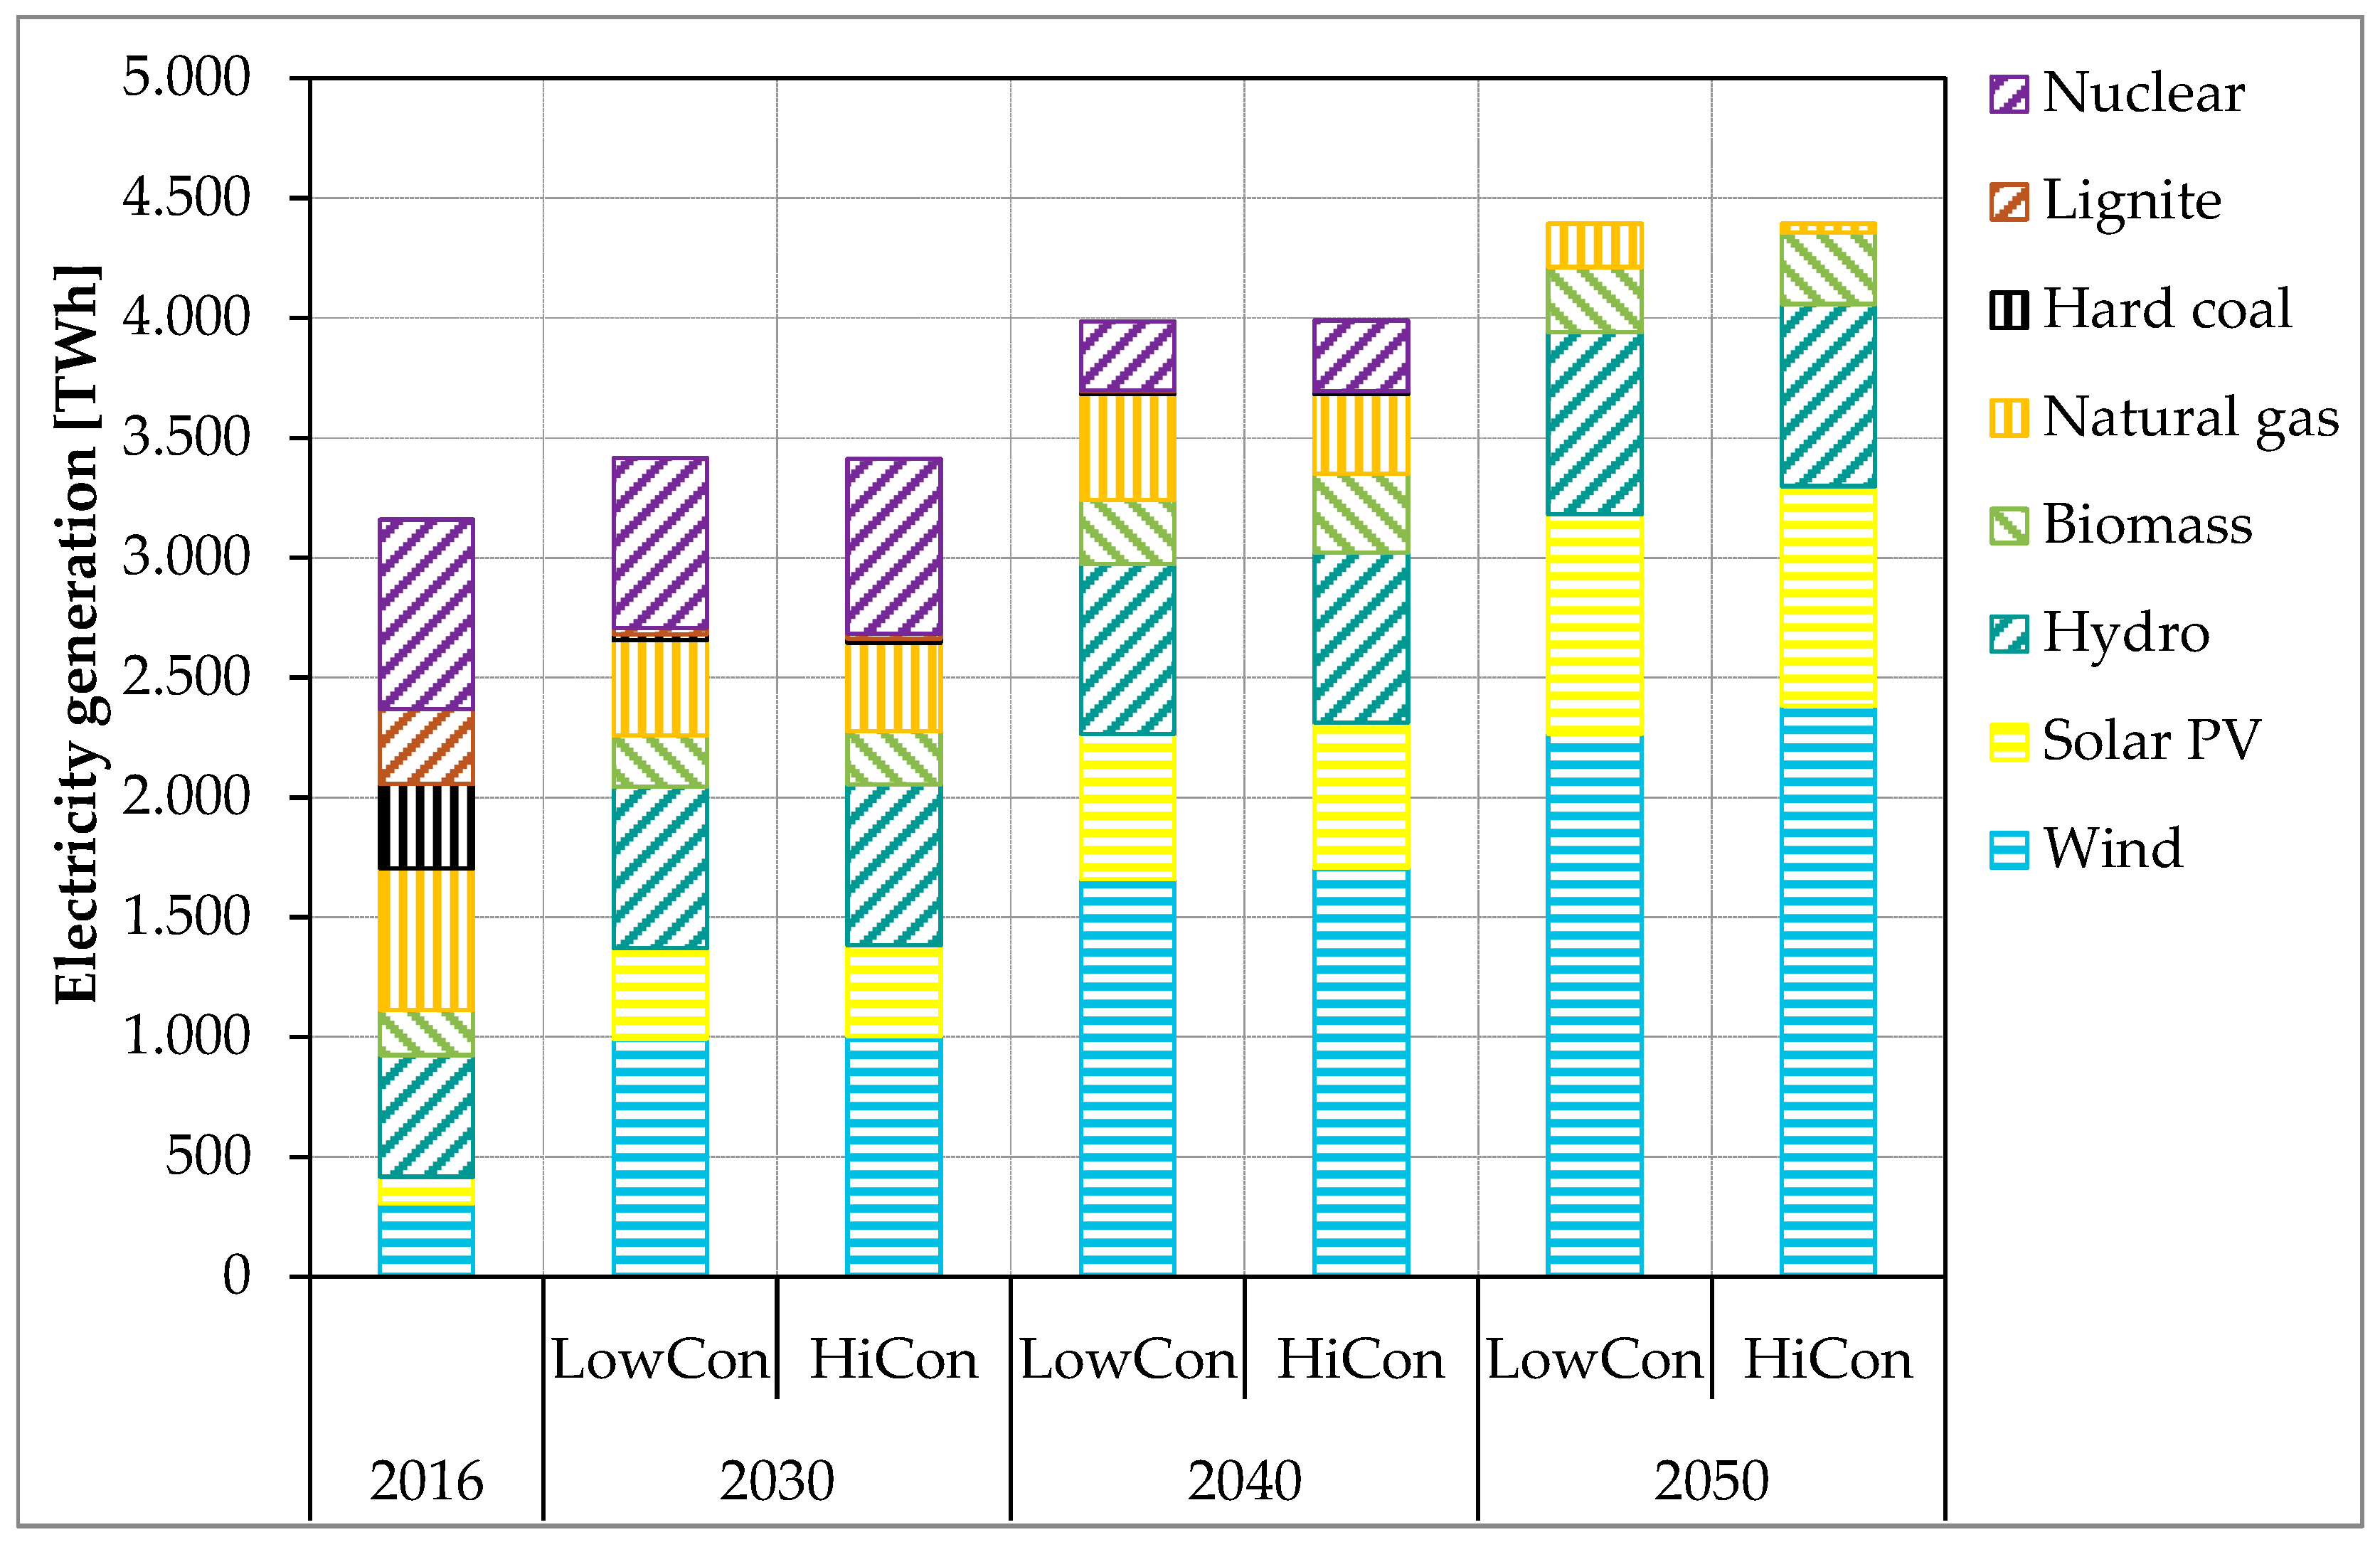
The electricity generation mix shifts toward technologies with higher generation costs due to the lower level of grid expansion. In our analysis, this effect is still relatively small in 2030, but increases by 2050, which is in line with the increasing RES-E expansion. This leads to an additional 47 TWh of RES-E curtailment in 2040 and 117 TWh in 2050. Gas-fired power plants compensate for the curtailed RES-E generation within Europe. In the TYNDP 2018 “no grid” analysis, the reduced grid expansion leads to approximately 156 TWh RES-E curtailment (cf. [
24] page 22 f.). This stronger effect can be explained by the significantly stronger NTC reduction in the “no grid” scenario (cf.
Table 5).
The changes in electricity generation lead to an increase in CO
2 emissions. Due to the small changes in the generation mix in 2030, the effect on emissions is still relatively small in this year. In our analysis, in both 2040 and 2050, the additional emissions caused by the delayed expansion of the grid amount to approximately 37 million tons. For the year 2050, this would mean a doubling of CO
2 emissions in the electricity sector. The stronger expansion of the grid can, thus, make a significant contribution toward reducing CO
2 emissions. As a result of the greater grid reduction, the TYNDP 2018 “no grid” analysis also shows a stronger increase in CO
2 emissions (+100 Mt) (cf. [
24] page 23).
Due to the less efficient use of the European power plant fleet, the variable costs of electricity generation increase in the lower connectivity scenario. In our analysis, this increase amounts to 5% higher costs in 2030, 20% higher costs in 2040, and almost a doubling of costs in 2050. In addition to the overall stronger change in the electricity generation mix, this increase can be explained by two further elements. First, fuel and CO2 prices rise over the years, so that the additional use of natural gas power plants has a greater impact on electricity generation costs. Second, the higher share of renewable energy reduces generation costs, so that the relative changes in costs are more pronounced.
If there is no grid expansion, there would be higher electricity generation costs, but, at the same time, there would also be cost savings due to lower grid expansion costs. These grid-related cost savings were not taken into account in this analysis since our focus was on the effects of grid expansion in high RES-E scenarios. It was also assumed that there would be a delay in the expansion and that the grid would, therefore, be expanded at a later date. In the TYNDP 2018 “no grid” analysis, the reduced expansion of the grid resulted in electricity prices that would lead to consumer costs about three times the cost for the additional expansion of the grid, as calculated in the baseline scenario (cf. [
24] page 17).
5. Conclusions
This paper concludes that the expansion of interconnector capacities can not only ensure a more efficient use of the European power plant fleet in the European internal market and associated cost savings but can also make an important contribution toward greenhouse neutrality. These effects increase over the years. On the one hand, this is due to the assumption that the absolute capacities of delayed projects will increase over the years with increasing grid expansion, which leads, over time, to a growing difference between the high connectivity and lower connectivity scenarios. On the other hand, due to the expansion of renewables, the spatial balance made possible by the European electricity grid becomes increasingly important. This observation is also shown in the TYNDP 2018 “no grid” analysis where the strongest effects are determined for the scenario with the highest RES-E share (cf. [
24] page 17). This means that grid expansions that are planned today and that may be motivated to a large extent by cost savings achievable in the internal European market, are still relevant in a future high RES-E world with ambitious CO
2 targets.
The identified effects of the delayed grid expansion can be interpreted as a conservative estimation. They would increase further with a lower level of alternative flexibilities such as batteries or power-to-gas. Compared to the assumptions in TYNDP 2018, a very strong expansion of interconnector capacities was assumed in the high connectivity scenario. As a result, the values of the lower connectivity scenario for 2030 and 2040 are approximately at the level of the TYNDP 2018 values. It can be assumed that, if the planned expansion of the grid was less pronounced, the restrictions on electricity exchange would become even more severe, and stronger effects would already become visible in the scenario year 2030.
Since both this paper as well as the TYNDP 2018 “no grid” analysis have shown the negative effects of a delayed expansion of interconnector capacities, the barriers for this expansion should be addressed. As described in Reference [
20], the main obstacles are regulatory issues and acceptance problems. This is why a “simplified and standardized regulation” as well as a “strong and transparent consultation process in all stages” are proposed [
20]. Bovet [
43] additionally elaborates that the enforcement power of the two European legal instruments Projects of Common Interest and Ten-Year Network Development Plan should be strengthened, so that delays in the expansion of the European transmission grid can be addressed more effectively. In Reference [
44], ENTSO-E and the Renewables Grid Initiative (RGI) describe how a lack of acceptance can be counteracted by "better projects." These "better projects" are characterized by “locally tailored, transparent, and participatory planning processes” [
44].

 ,
, 


