2.1. Energy and Motor Vehicle Crashes
Research in energy and vehicle crashes can be broadly categorized into two levels: the vehicle level (and its subcomponents) and the traffic-flow level. In the event of a motor vehicle crash, the kinetic energy of the collision is in part transferred to vehicle occupants and passengers, who may suffer from injury if the energy exceeds a certain threshold [
8,
9], and the injury severity increases as the transferred kinetic energy increases [
10], assuming other factors remain constant. The deformation and damage of the vehicle body to absorb kinetic energy have been crucial aspects of the passive safety of a vehicle [
11]. The energy absorption has been achieved from the perspective of vehicle design (engine hood hinges [
12]), geometric profile (circular tubes [
13]), and material science (e.g., epoxy-based composite [
14], magnesium alloy [
15]).
Besides the vehicle-level analysis, another perspective is to study the wasted fuel at a traffic-flow level due to the congestion induced by the motor vehicle crashes, such as lane closures and the rubbernecking effect [
16]. The “Urban Mobility Report” [
17] uses traffic volume, speed, and the U.S. Environmental Protection Agency (EPA)’s Multi-scale mOtor Vehicle and equipment Emission System (MOVES) model [
18] to estimate the CO
2 emission and fuel consumption during congested conditions. Besides MOVES, other energy models that use second-by-second vehicle trajectory data (i.e., speed and acceleration) have been adopted, such as VT-Micro [
19] and Future Automotive Systems Technology Simulator (FASTSim) [
20]. A few studies have investigated traffic flow-level congestion impacts in the United States, where 5.5 billion hours are wasted annually because of both regular traffic congestion and induced congestion, translating to about USD 121 billion in 2012 [
21]. In 2015, U.S. national congestion accounted for an additional 6.9 billion hours of driving and the equivalent of 3.1 billion gallons of fuel [
17].
Apart from these national-level impacts of induced congestion from crashes, the research teams’ literature review did not uncover any direct linkage between per crash occurrence and resulting energy impacts, as is common for economic analyses. Using the national-level estimation of the energy consequences of induced congestion of 3.1 billion gallons of gasoline [
17], and assuming 6.3 million crashes per year that cover fatal, injury, and property damage only (PDO) [
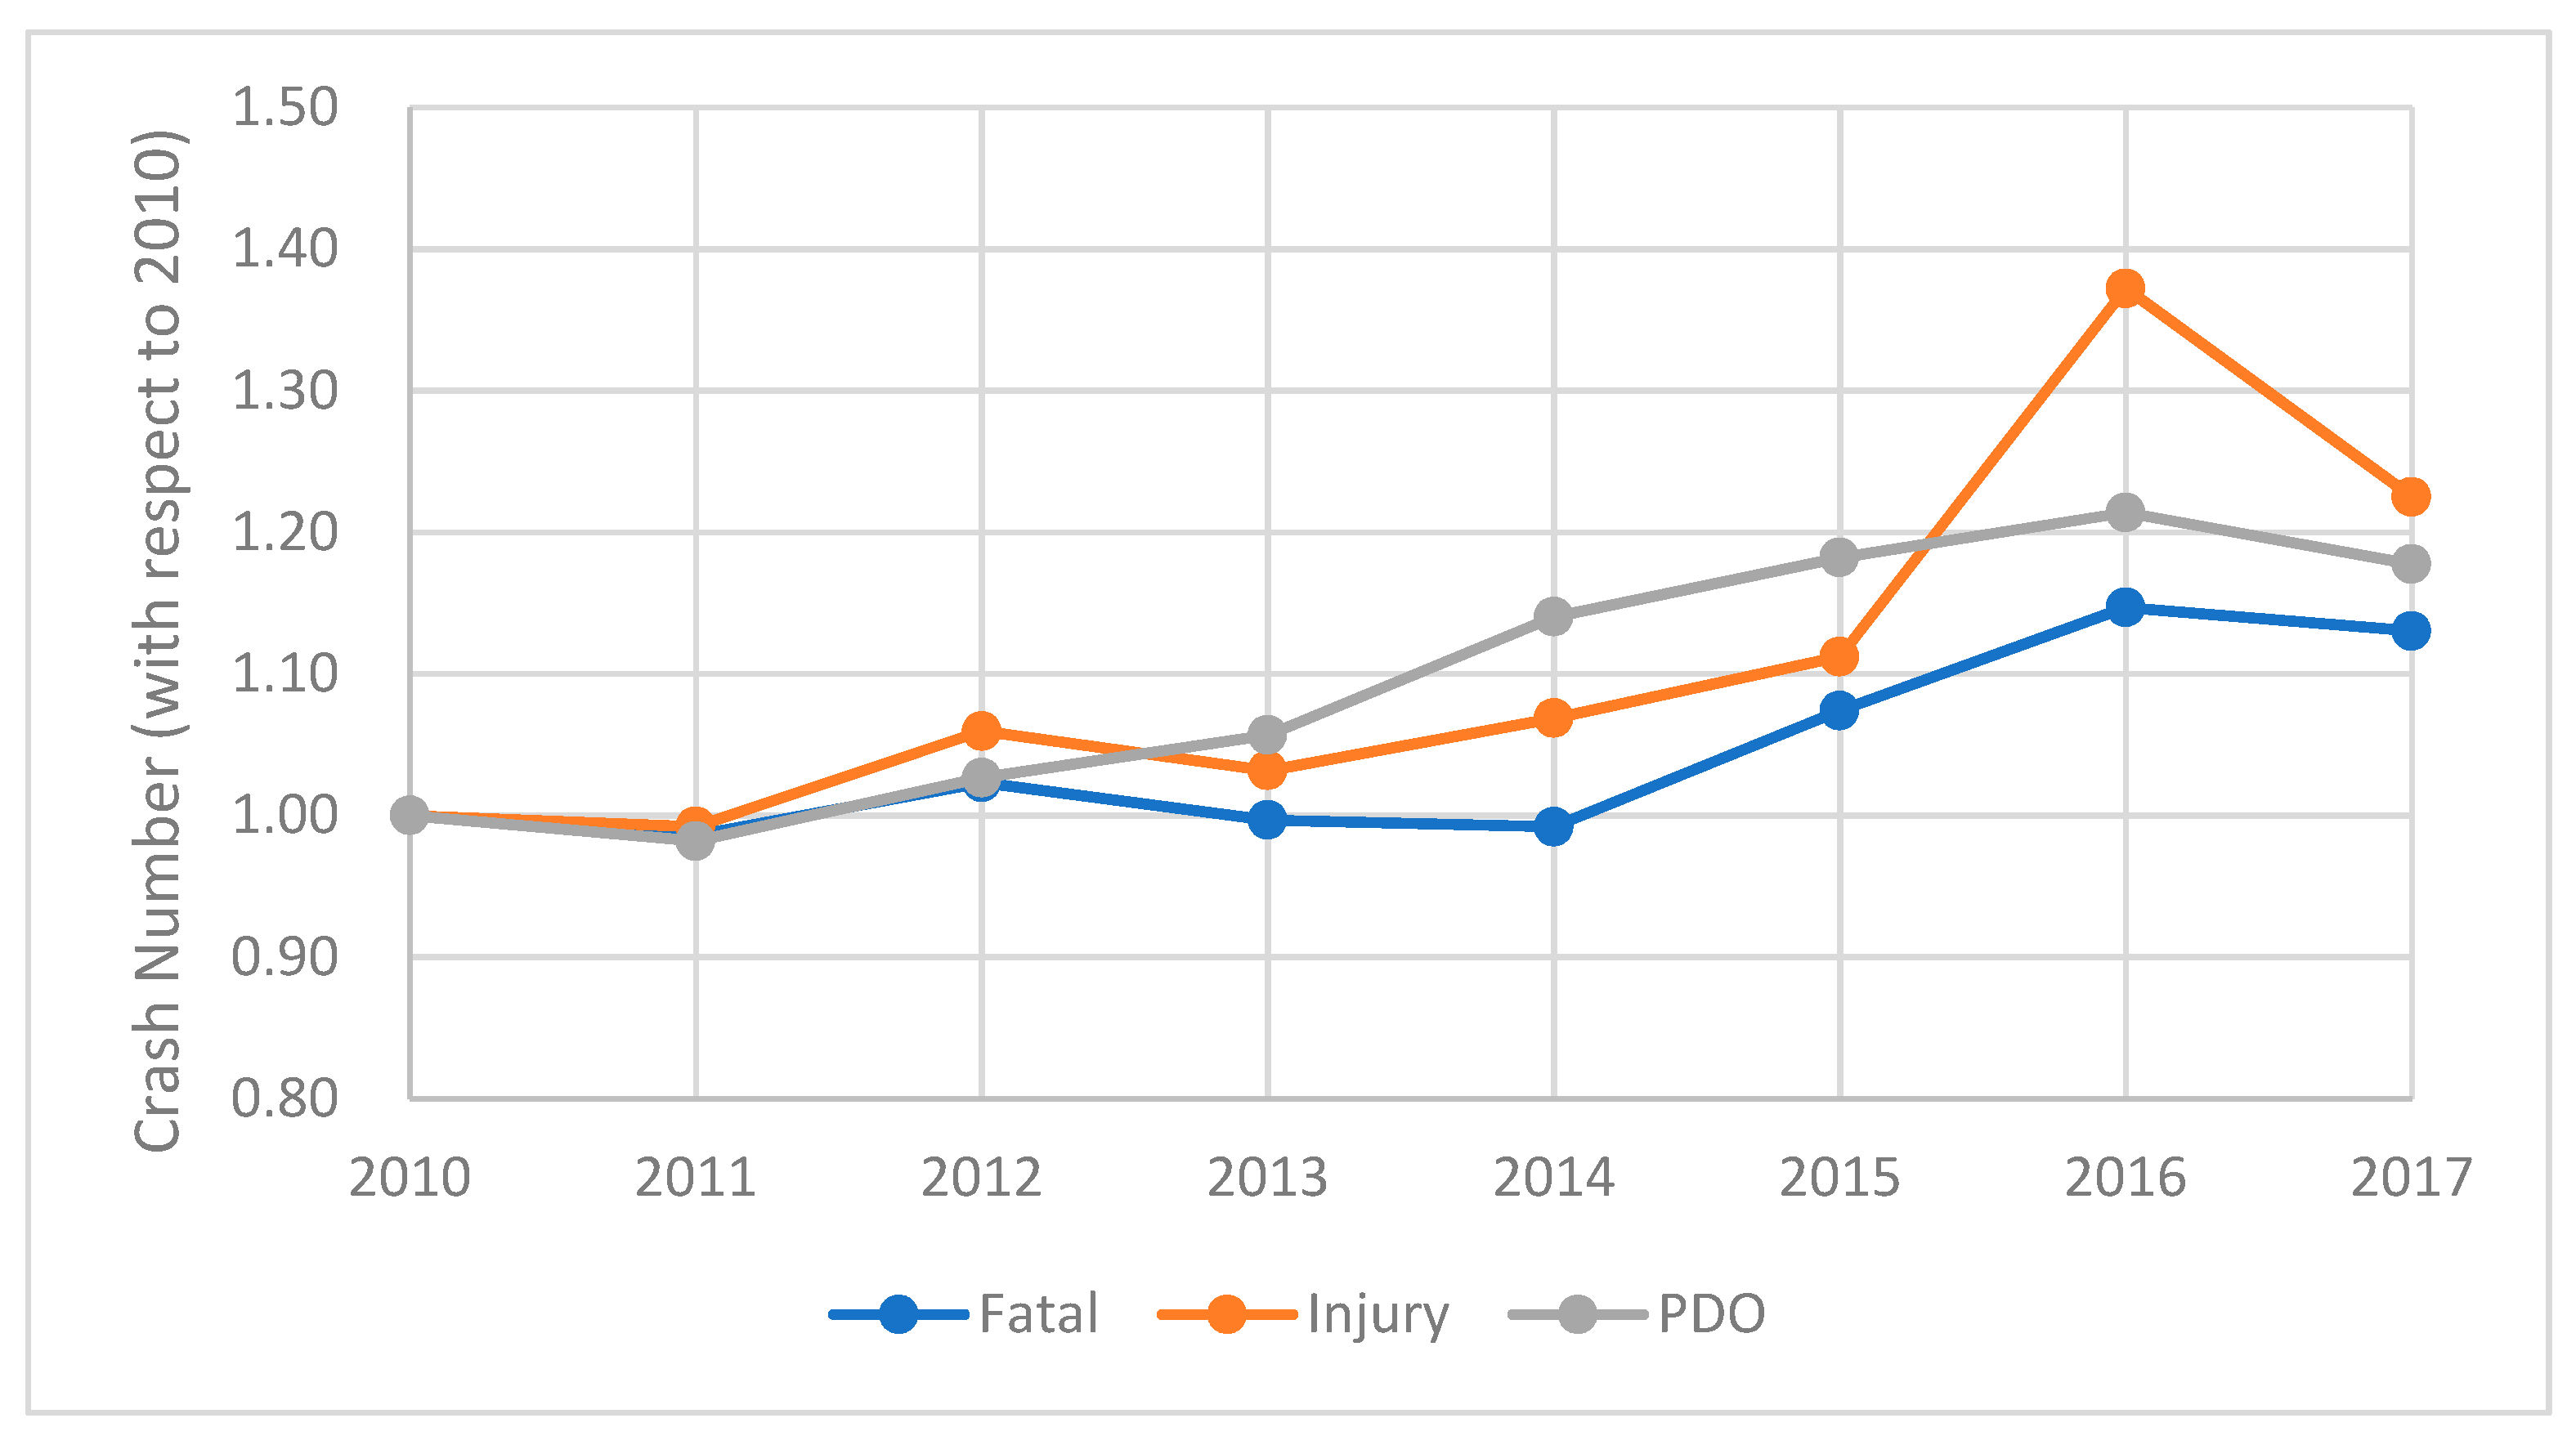
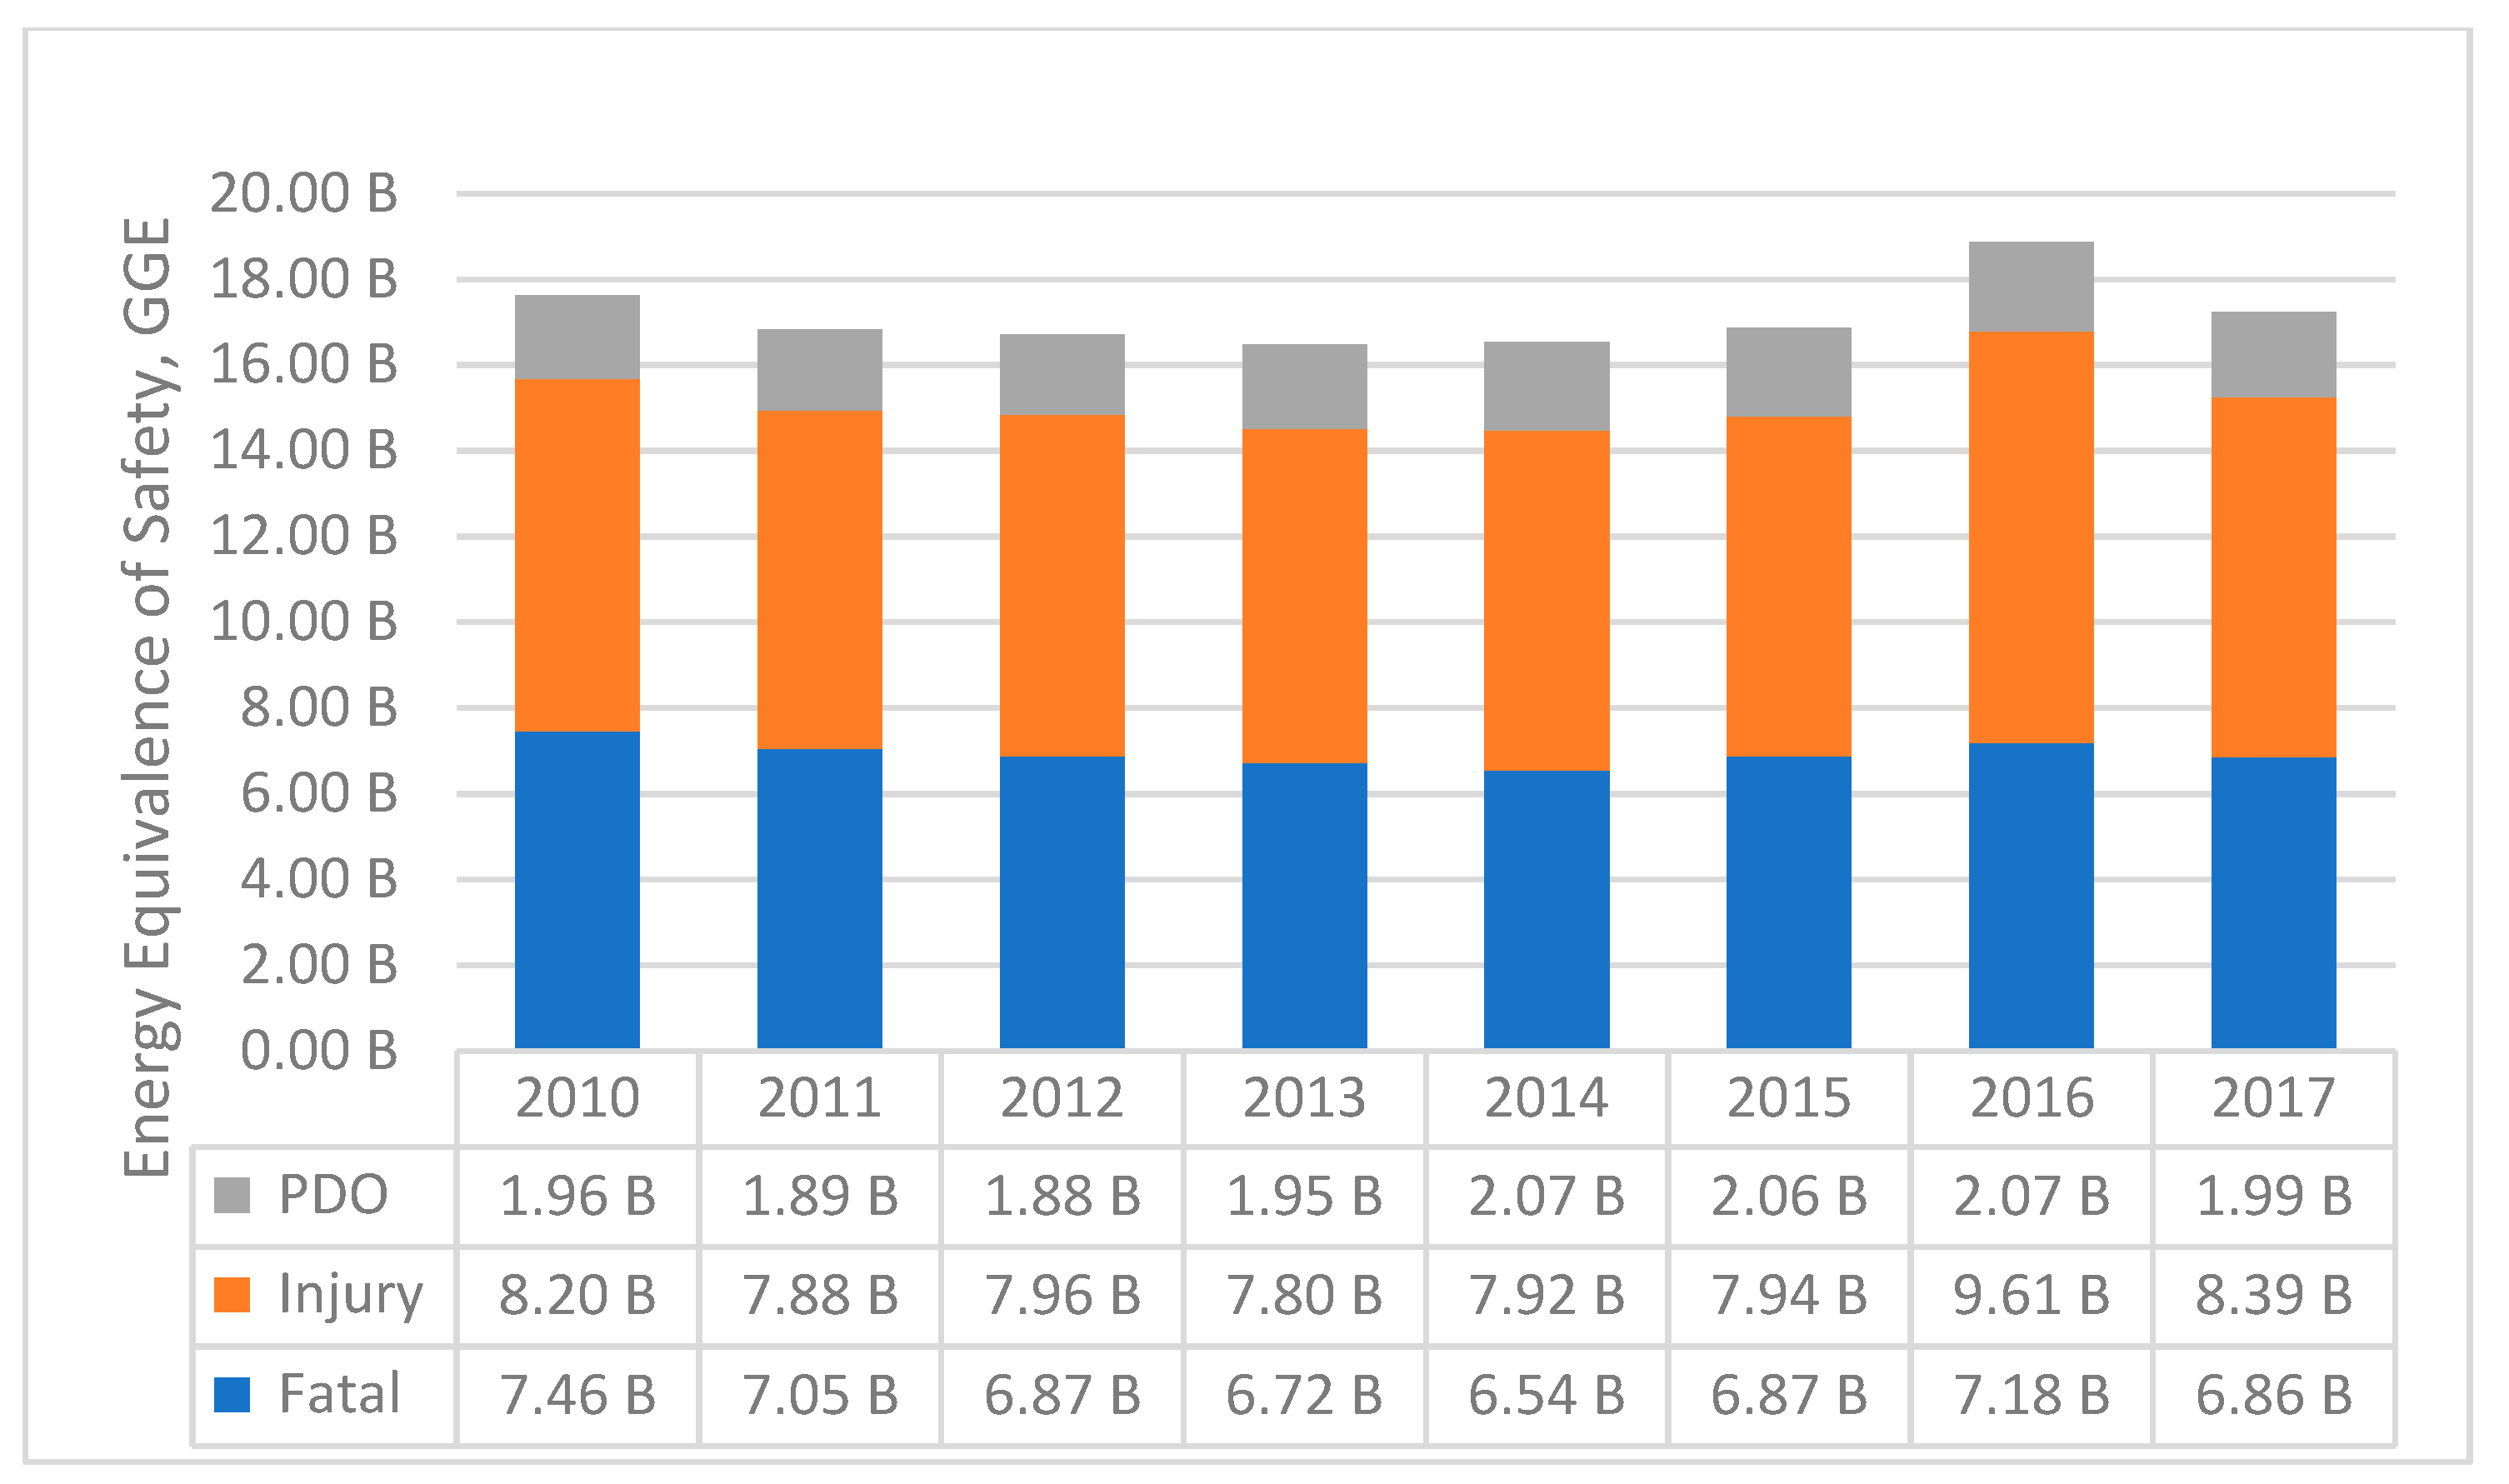
5], the average per crash energy impact is estimated at 492 gallons of fuel per crash. Our framework indicates a much larger impact when all factors are taken into account. In terms of gasoline gallon equivalent (GGE), the fatal, injury, and PDO accidents account for 200,259, 4442, and 439 GGE in 2017, respectively.
2.2. Crash and Cost Composition
NHTSA has been documenting the details of motor crashes for decades. The National Automotive Sampling System (NASS) [
22], established by NHTSA in 1979, comprised a General Estimate System (GES) [
23] and a Crashworthiness Database System (CDS) [
24]. GES and CDS were then replaced by the Crash Report Sampling System (CRSS) [
25] and the Crash Investigation Sampling System (CISS) [
26] in 2014 and 2016, respectively, as documented in “NHTSA’s Data Modernization Project” [
27]. CRSS expands the police-reported accident report strata to pedestrian, motorcycle, and late-model vehicles. For CISS, the target population is all police-reported motor vehicle crashes on trafficways involving a passenger vehicle and in which a passenger vehicle is towed. Such requirements are different from CDS—its predecessor—which required damage as the reason for the towing.
Using the aforementioned data sets, NHTSA has published traffic safety facts since 1988 [
5], which provide the annual crash numbers in three crash severity levels: fatal, injury, and PDO. Two crash severity measurement systems are commonly used in most studies: (1) AASHTO’s Highway Safety Manual (HSM) method, based on the KABCO scale, and (2) NHTSA’s method based on MAIS (Maximum Abbreviated Injury Scale) [
21]. The KABCO scale is the most prevalent method used in police crash reports for assessing crash and injury severity. The coding in the KABCO scale assigns letter to each type of injury severity. In descending order in severity [
28]:
Note that the descriptions in the KABCO scale entail uncertainty because the responding police officer generally does not have the requisite skill to medically determine the injury severity with great precision. The Abbreviated Injury Scale (AIS), on the other hand, was developed by the Association for the Advancement of Automotive Medicine to classify the injury severity for an individual. AIS provides an internationally accepted, anatomically based tool for measuring injury severity. MAIS is a score representing the most severe injury (using the AIS scale) on a single person in a crash [
29]. As shown below, MAIS6 is the highest level, which represents unsurvivable injury, whereas MAIS1 represents minor injury.
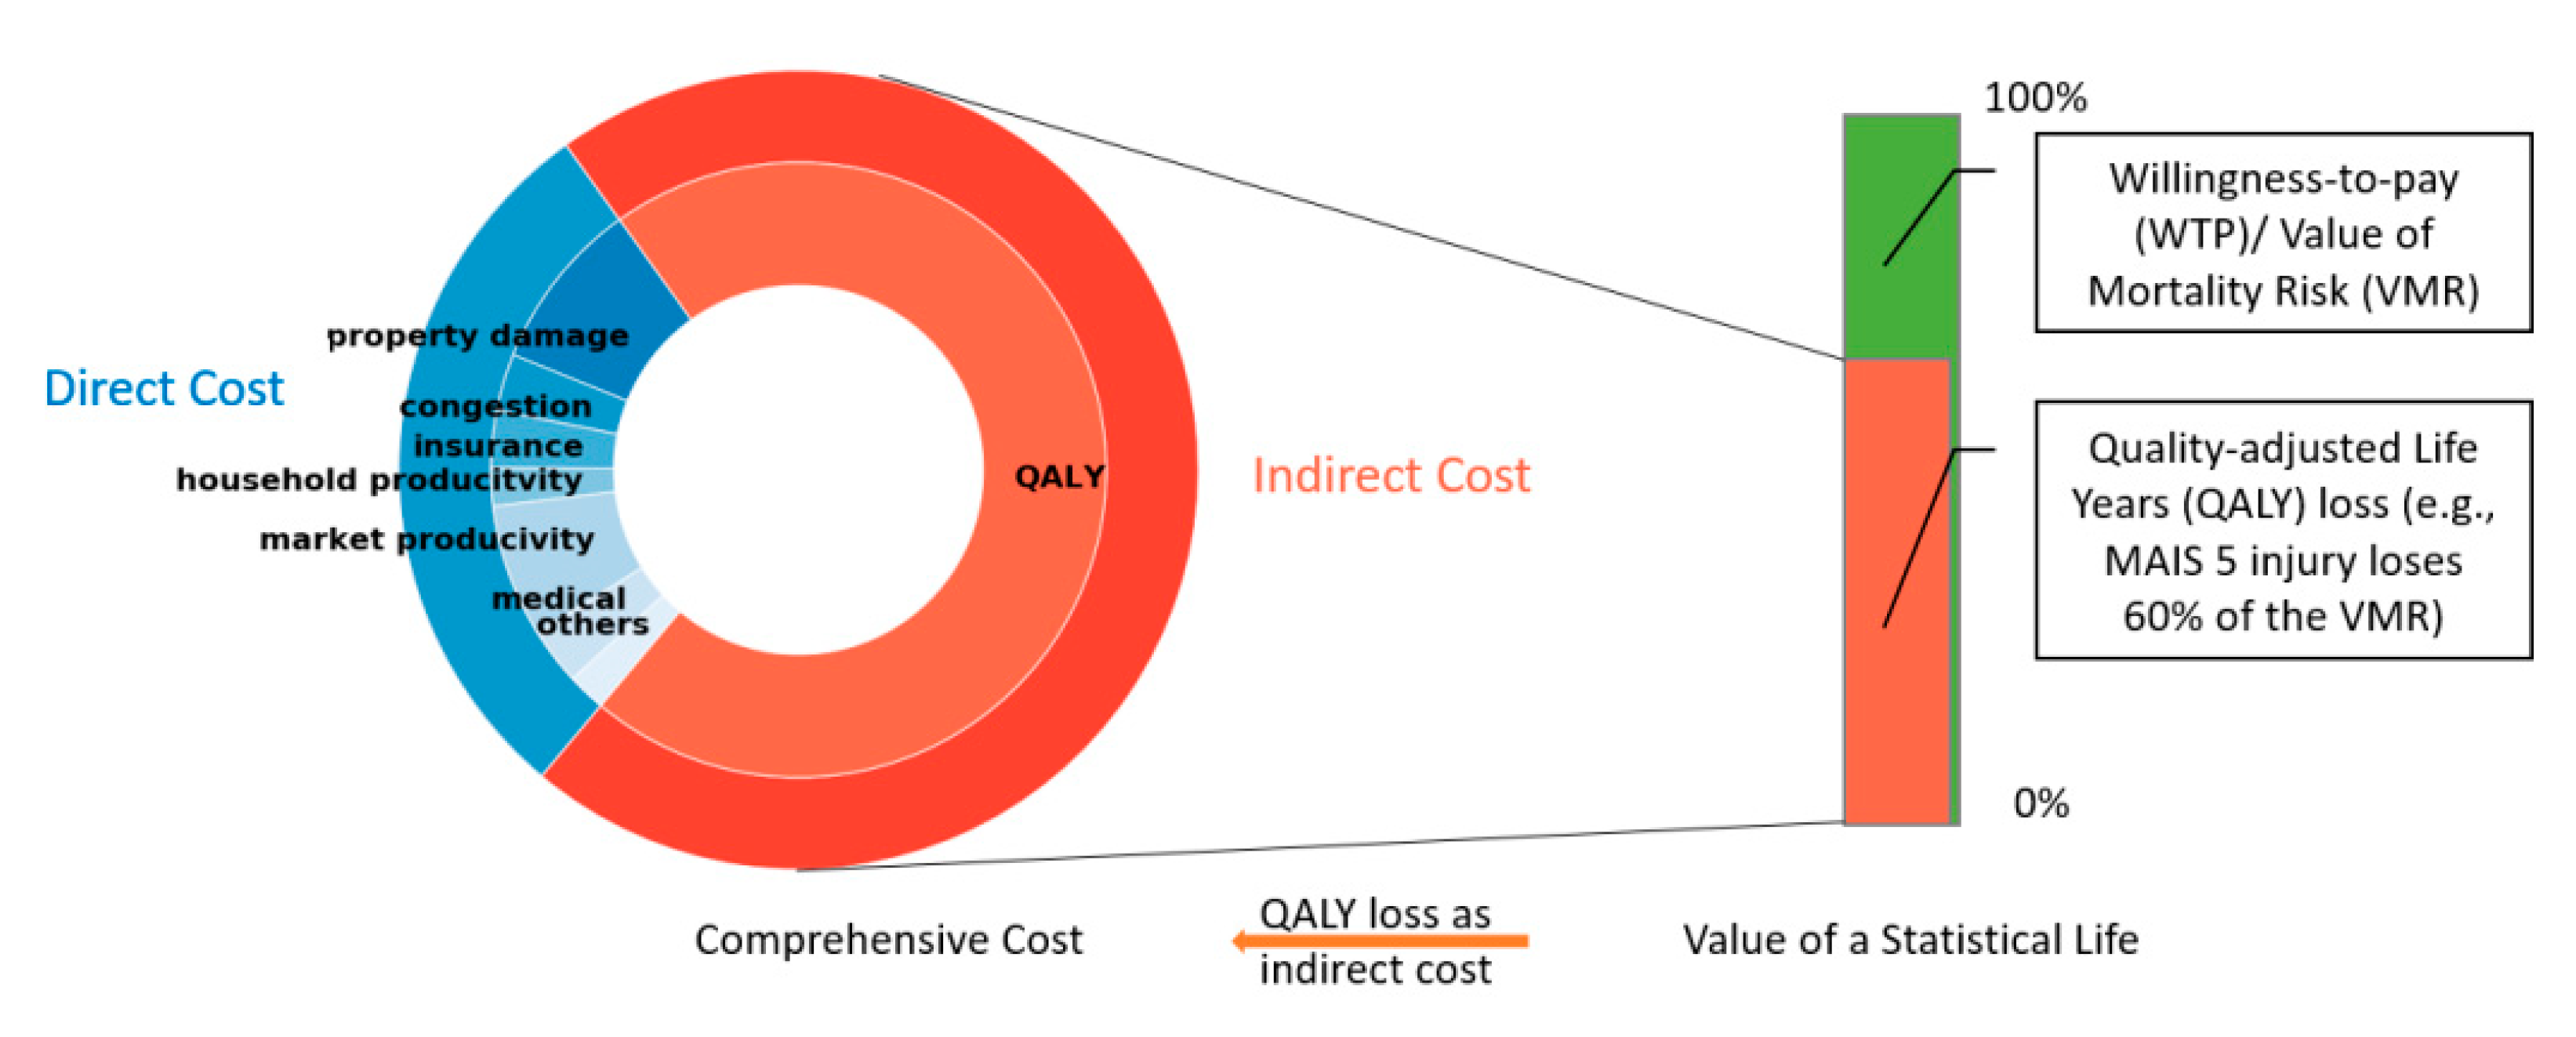
Motor vehicle crash analysis is a crucial part of highway safety analysis in various countries. An international guideline distinguishes five components of crash cost: medical cost, production loss, human cost, property damage, and administrative costs [
30]. In the United States, the HSM classifies crash costs into two types: direct costs and indirect costs [
31] as shown in
Table 1. The direct costs refer to the monetary costs that are directly attributable to crashes, such as property damage, human capital costs, medical costs, and induced congestion, all of which are relatively straightforward to estimate. The human capital cost measures a person’s contribution to the society through labor [
6]. The indirect costs are measured in quality-adjusted life years (QALYs), which is a fraction of the value of a statistical life (VSL). VSL is the price that people are willing to pay to avoid the risk of death or injury [
32]. In another words, QALY is a portion of the full VSL lost due to the crash. Additional discussion of VSL and its derivation and meaning are provided later. QALY is determined by the duration and severity of the health problem. For instance, the QALY value for the most serious injuries (with MAIS5 severity) is roughly 60% of a full remaining life. In comparison, minor injury (MAIS1) only accounts for 1% of a full remaining life. The relationships among the above concepts are illustrated in
Figure 1.
It has been the standard practice for government agencies over the past three decades to use value of a statistical life to value risk [
33]. VSL is often misinterpreted as referring to the “value of a life” rather than the value of small changes in one’s own mortality risks [
34]. As such, “value of mortality risk” or “value of risk reduction” were proposed by some researchers to avoid misinterpretation [
35]. The authors use “value of mortality risk” (VMR) henceforth to avoid such confusion. The Office of Management and Budget (OMB) provides recommendations for estimating VMR. Typically, the reduction of the mortality risk benefits account for the largest component of all new regulation benefits, especially for EPA and the U.S. Department of Transportation.
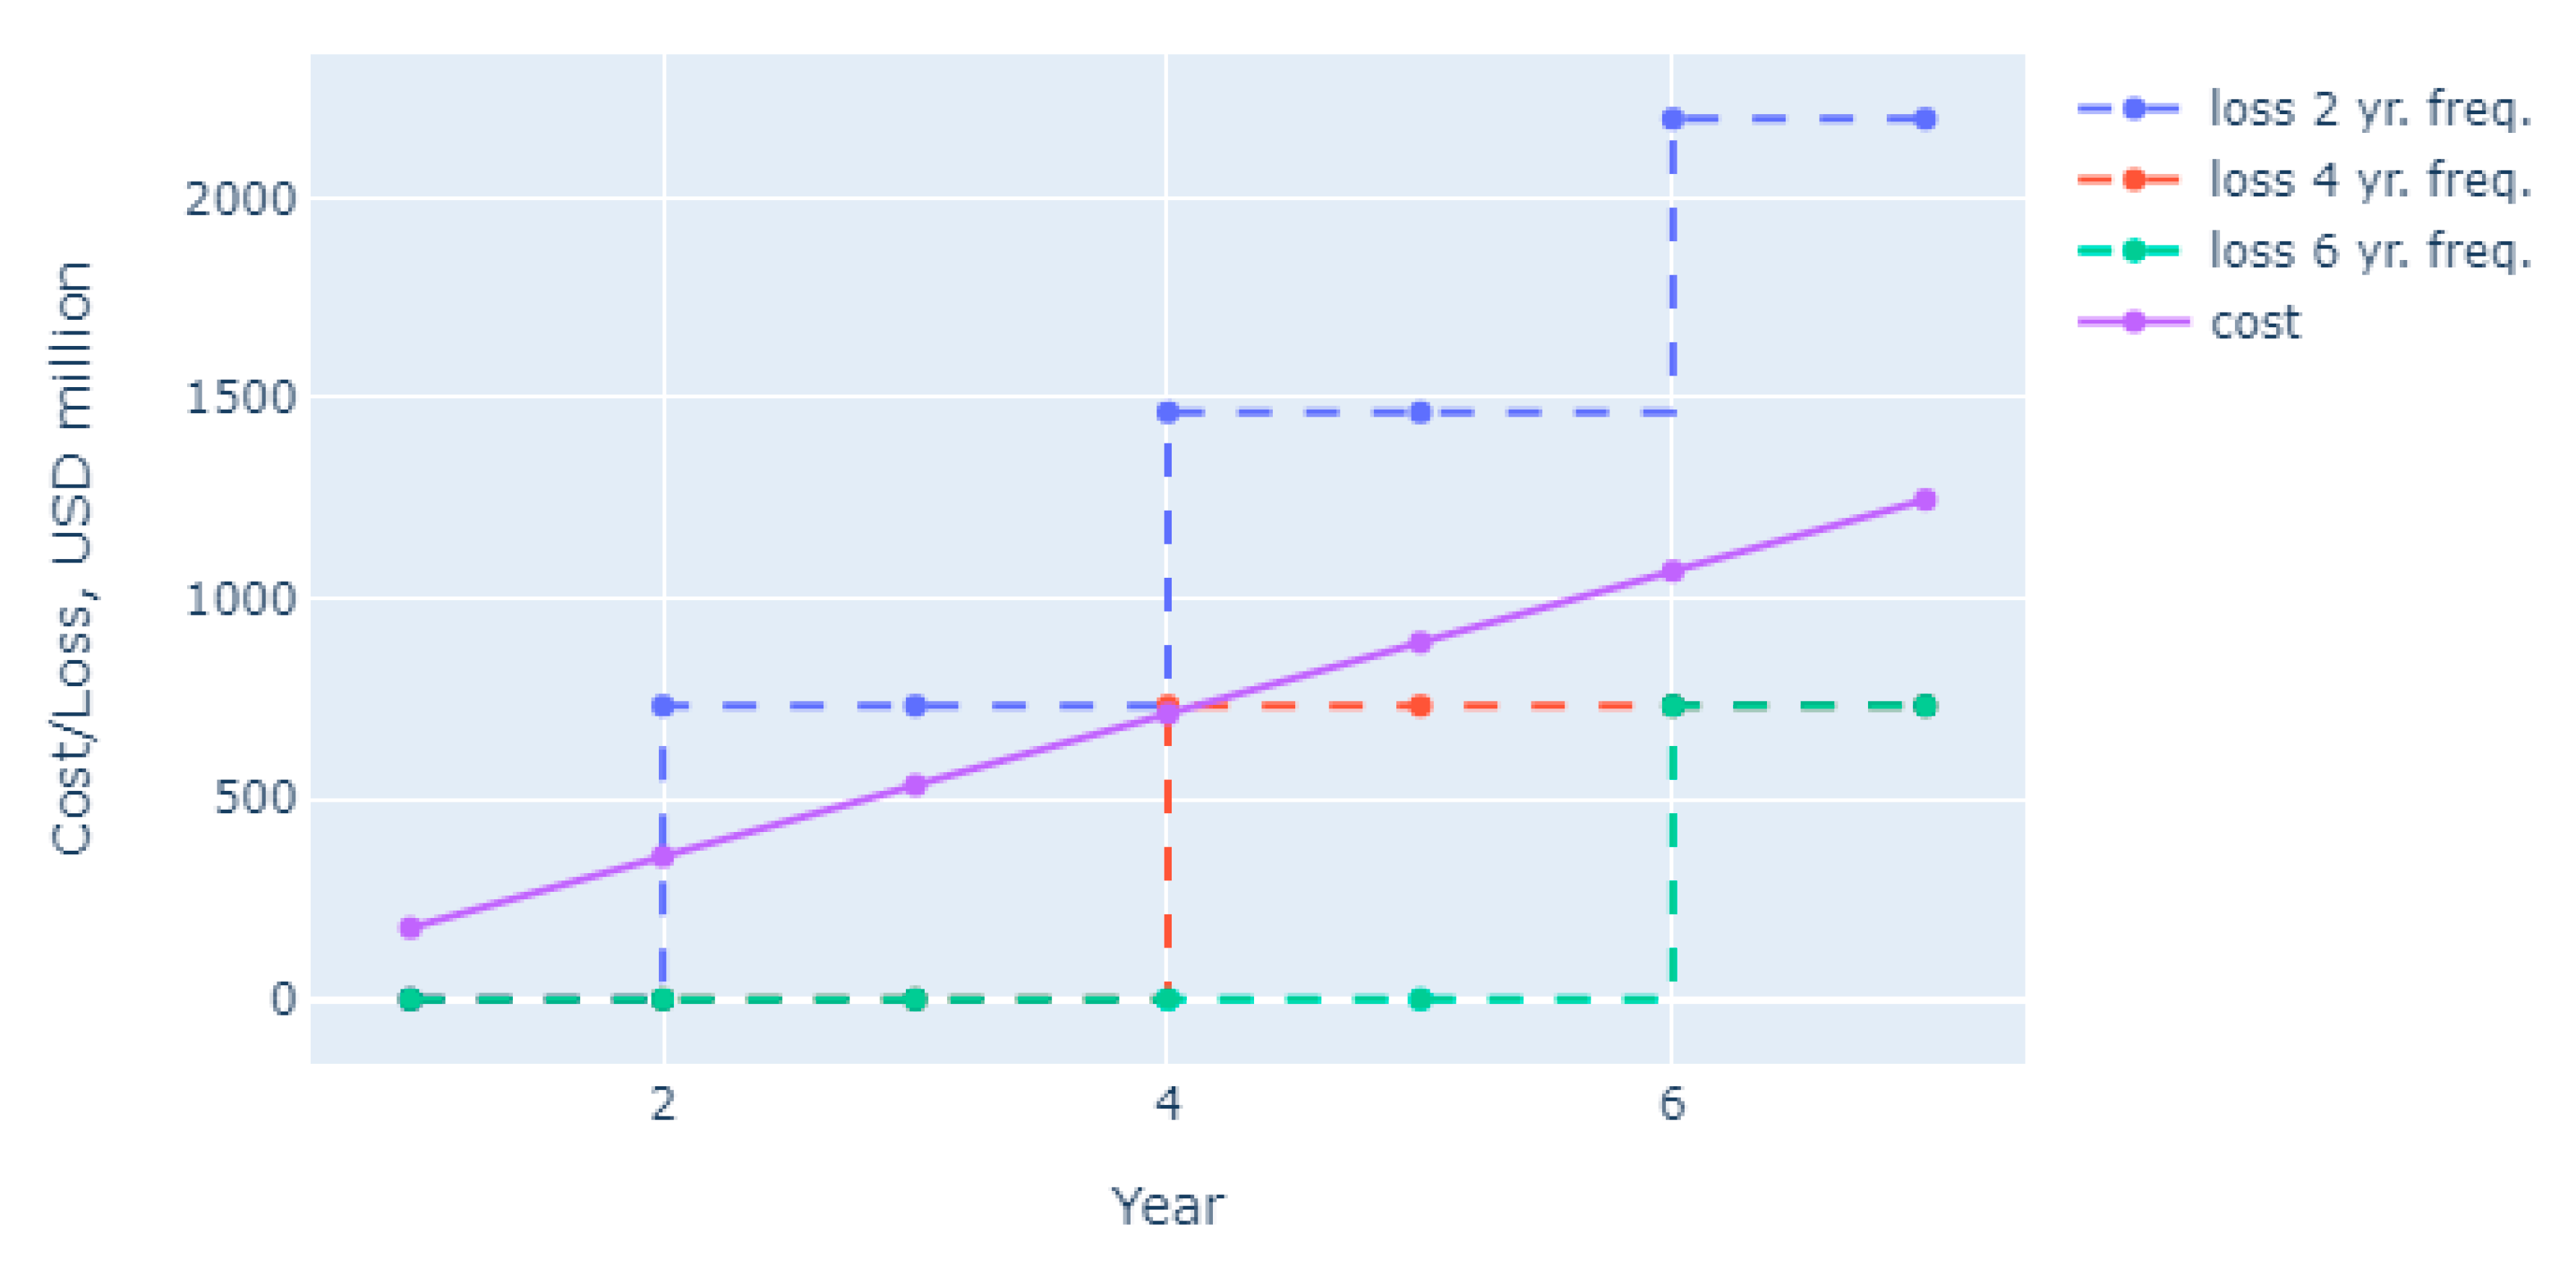
We included the example used in the final rule for Air Cargo Screening [
36] from the Transportation Safety Agency to further illustrate the usage of VMR in government rule making. In the hypothetical and tragic scenario where an explosive device placed in cargo shipped on a standard narrow body passenger airplane during flight, the loss is assumed to be lives of all passengers and crewmembers on board, along with the destruction of the aircraft. For a plane with 114 passengers (average capacity 142 passenger and with a load factor of 80%) and 5 crewmembers, the estimated total VMR is approximately USD 714 million according to the VMR (USD 6 million per person) set forth by the USDOT. The total cost including the cost of the aircraft increases to USD 732.5 million. Note that the cost does not factor in any macroeconomic consequences caused by the attack.
Figure 2 illustrates the trade-off analysis in this rule making. The expected losses are based on the frequency of the attack, which are shown in dash lines. The cumulative cost of the annualized rule cost is shown in solid line. The comparison between the cost of loss and the cumulative cost of rule (discounted at 7%) indicates the break-even point for the rule, which is frequency of one attack every 4.1 year (
$732.5/
$178.1 = 4.1) [
37]. When the proposed measure brings the frequency lower (e.g., 8 yr.), then the trade-off is justified from a pure risk analysis standpoint.
There are numerous examples that the VMR is used in policy making. The Federal Aviation Administration evaluated the value of various safety regulations over the years, all based on fundamental assumptions on VMR: protective breathing equipment in 1985 (assume VMR at USD 1.3 million), radar service area regulation in 1990 (VMR at USD 2.7 million), aircraft flight simulator in 1996 (VMR at USD 4.0 million), flight crew member rest requirements in 2010 (VMR at USD 9.3 million, in 2015 dollars), and air cargo screening in 2011 (VMR at USD 6.1 million). Note the consistent increase in VMR with respect to time, as would with expected due to economic forces related to inflation and economic growth. For surface transportation, the tire pressure monitoring systems regulation in 2000 by NHTSA used a VMR ranging from USD 4.2 million to USD 6.6 million. Other examples include the 2011 Railroad Workplace Safety by the Federal Railroad Administration (VMR at USD 6.3 million) and Hours of Service of Drivers by the Federal Motor Carrier Safety Administration in 2011 (VMR at USD 6.3 million) [
33]. The EPA used a VMR of USD 9.7 million in 2015 dollars [
38] and the Occupational Safety and Health Administration within the Department of Labor used a value of USD 8.7 million in 2009 dollars in their Hazard Communication Final Rule in 2010 [
39]. This extensive review of VMR (more commonly referred to as VSL) is to establish viability of the methodology approach. All the monetary values mentioned in the following are in 2012-dollar value unless stated otherwise. The initial EES study used a similar concept, which was received with reticence and skepticism within the sustainability community and is reviewed here at length to establish the credibility of approach (though authors invite critical review at all times).
Due to the considerable value of VMR (and by extension, QALY), the indirect cost of severe and fatal crashes is much higher than the direct cost. For instance, the National Center for Statistics and Analysis (NCSA) estimated USD 242 billion of direct cost in the United States in 2010 due to crashes. When factoring in the indirect cost, the comprehensive cost totaled USD 836 billion for the same year [
21]. The comprehensive societal crash cost from the HSM was estimated by the police-reported injury severity within the selected crash geometries. The unit cost for each crash type (available in the HSM [
31]) is shown in
Table 2. The indirect fatal crash cost was more than twice the direct cost. The magnitude of the comprehensive crash unit cost can also be expressed in “equivalent property damage only” (EPDO). For fatal crash and injury crashes, the EPDOs are 542 and 11, respectively.
The unit cost for each crash are available in the Highway Safety Manual in 2001 dollar value, and the manual also provides adjustment method for subsequent years [
31]. The direct crash unit cost is adjusted by the Consumer Price Index (CPI) [
40], and the indirect crash cost is adjusted by median usual weekly earnings (MUWE) [
41]. Compared to CPI, which measures inflation, MUWE is an index to measure real income growth in constant (1982–1984) dollars [
41]. It is the consensus that VMR increases with real incomes, and hence MUWE is used to adjust VMR. The weighted crash unit cost can be calculated with the distribution of the crash severity in safety analysis [
28]. Because HSM does not provide the QALY value directly for the injury crash (which encompasses three injury types (i.e., A, B, and C) based on the KABCO scale), the weighted QALY unit cost for the injury crashes is calculated using the QALY cost for injury types A, B, and C, as well as the 2010 HSM crash-type weighting [
31]. The equation for calculating the severity weighted cost (SWC) for A/B/C type is expressed in Equation (1).
where:
SWC = severity-weighted cost for two or more severities;
C = crash unit cost or person-injury unit cost for a given severity;
N = number of crashes or person-injuries of given severity or group of severities.
2.3. Energy Equivalence of Crash Cost
The conversion between the energy and monetary values was in part inspired by the embodied energy used in other disciplines, such as ecology, manufacturing, and construction. Embodied energy—defined as the available energy that has been used to make an ecosystem component, either directly or indirectly—has been used for the management of ecosystem services as well as natural resources accounting. It captures the “value” of the ecosystem elements that cannot be easily evaluated using traditional monetary valuation methodologies. In manufacturing, embodied energy is the total energy embodied by a manufactured product (e.g., automobiles, buildings) and processes used in its manufacturing, maintenance, and disposal [
42,
43]. As an example, a portion of the energy spent for the production workers (eating food, traveling to work, maintaining a lifestyle, etc.) is to be allocated to the embodied energy tally for a product [
44].
In the food supply chain, a holistic view of the energy consumption concerning the upstream (production, transport, and processing) and downstream (distribution, transport, and consumption) aspects of food production was analyzed by referring to the embodied energy concept [
45,
46]. The energy consumption in the food supply chain is available in various data sets, including energy consumption for agriculture and aquaculture (Census of Agriculture [
47]), food manufacturing (the Manufacturing Energy Consumption Survey [
48] and the Annual Survey of Manufacturers [
49]), transportation modes (Commodity Flow Survey [
50]), food retail (Commercial Building Energy Consumption Survey [
51]), and final consumption (Commercial Building Energy Consumption Survey [
51]). To account for the embodied energy of the food supply chain, additional data sets were used for machinery, fertilizer, and pesticides (U.S. Department of Agriculture QuickStat [
52]), and food nutritional energy (Food Balance Sheets [
53]). In a similar fashion, this framework estimates embodied energy of the ecosystem (nationally) per unit of economic productivity, and then uses extensive economic impact studies to estimate the overall energy consequences of various types of crashes.
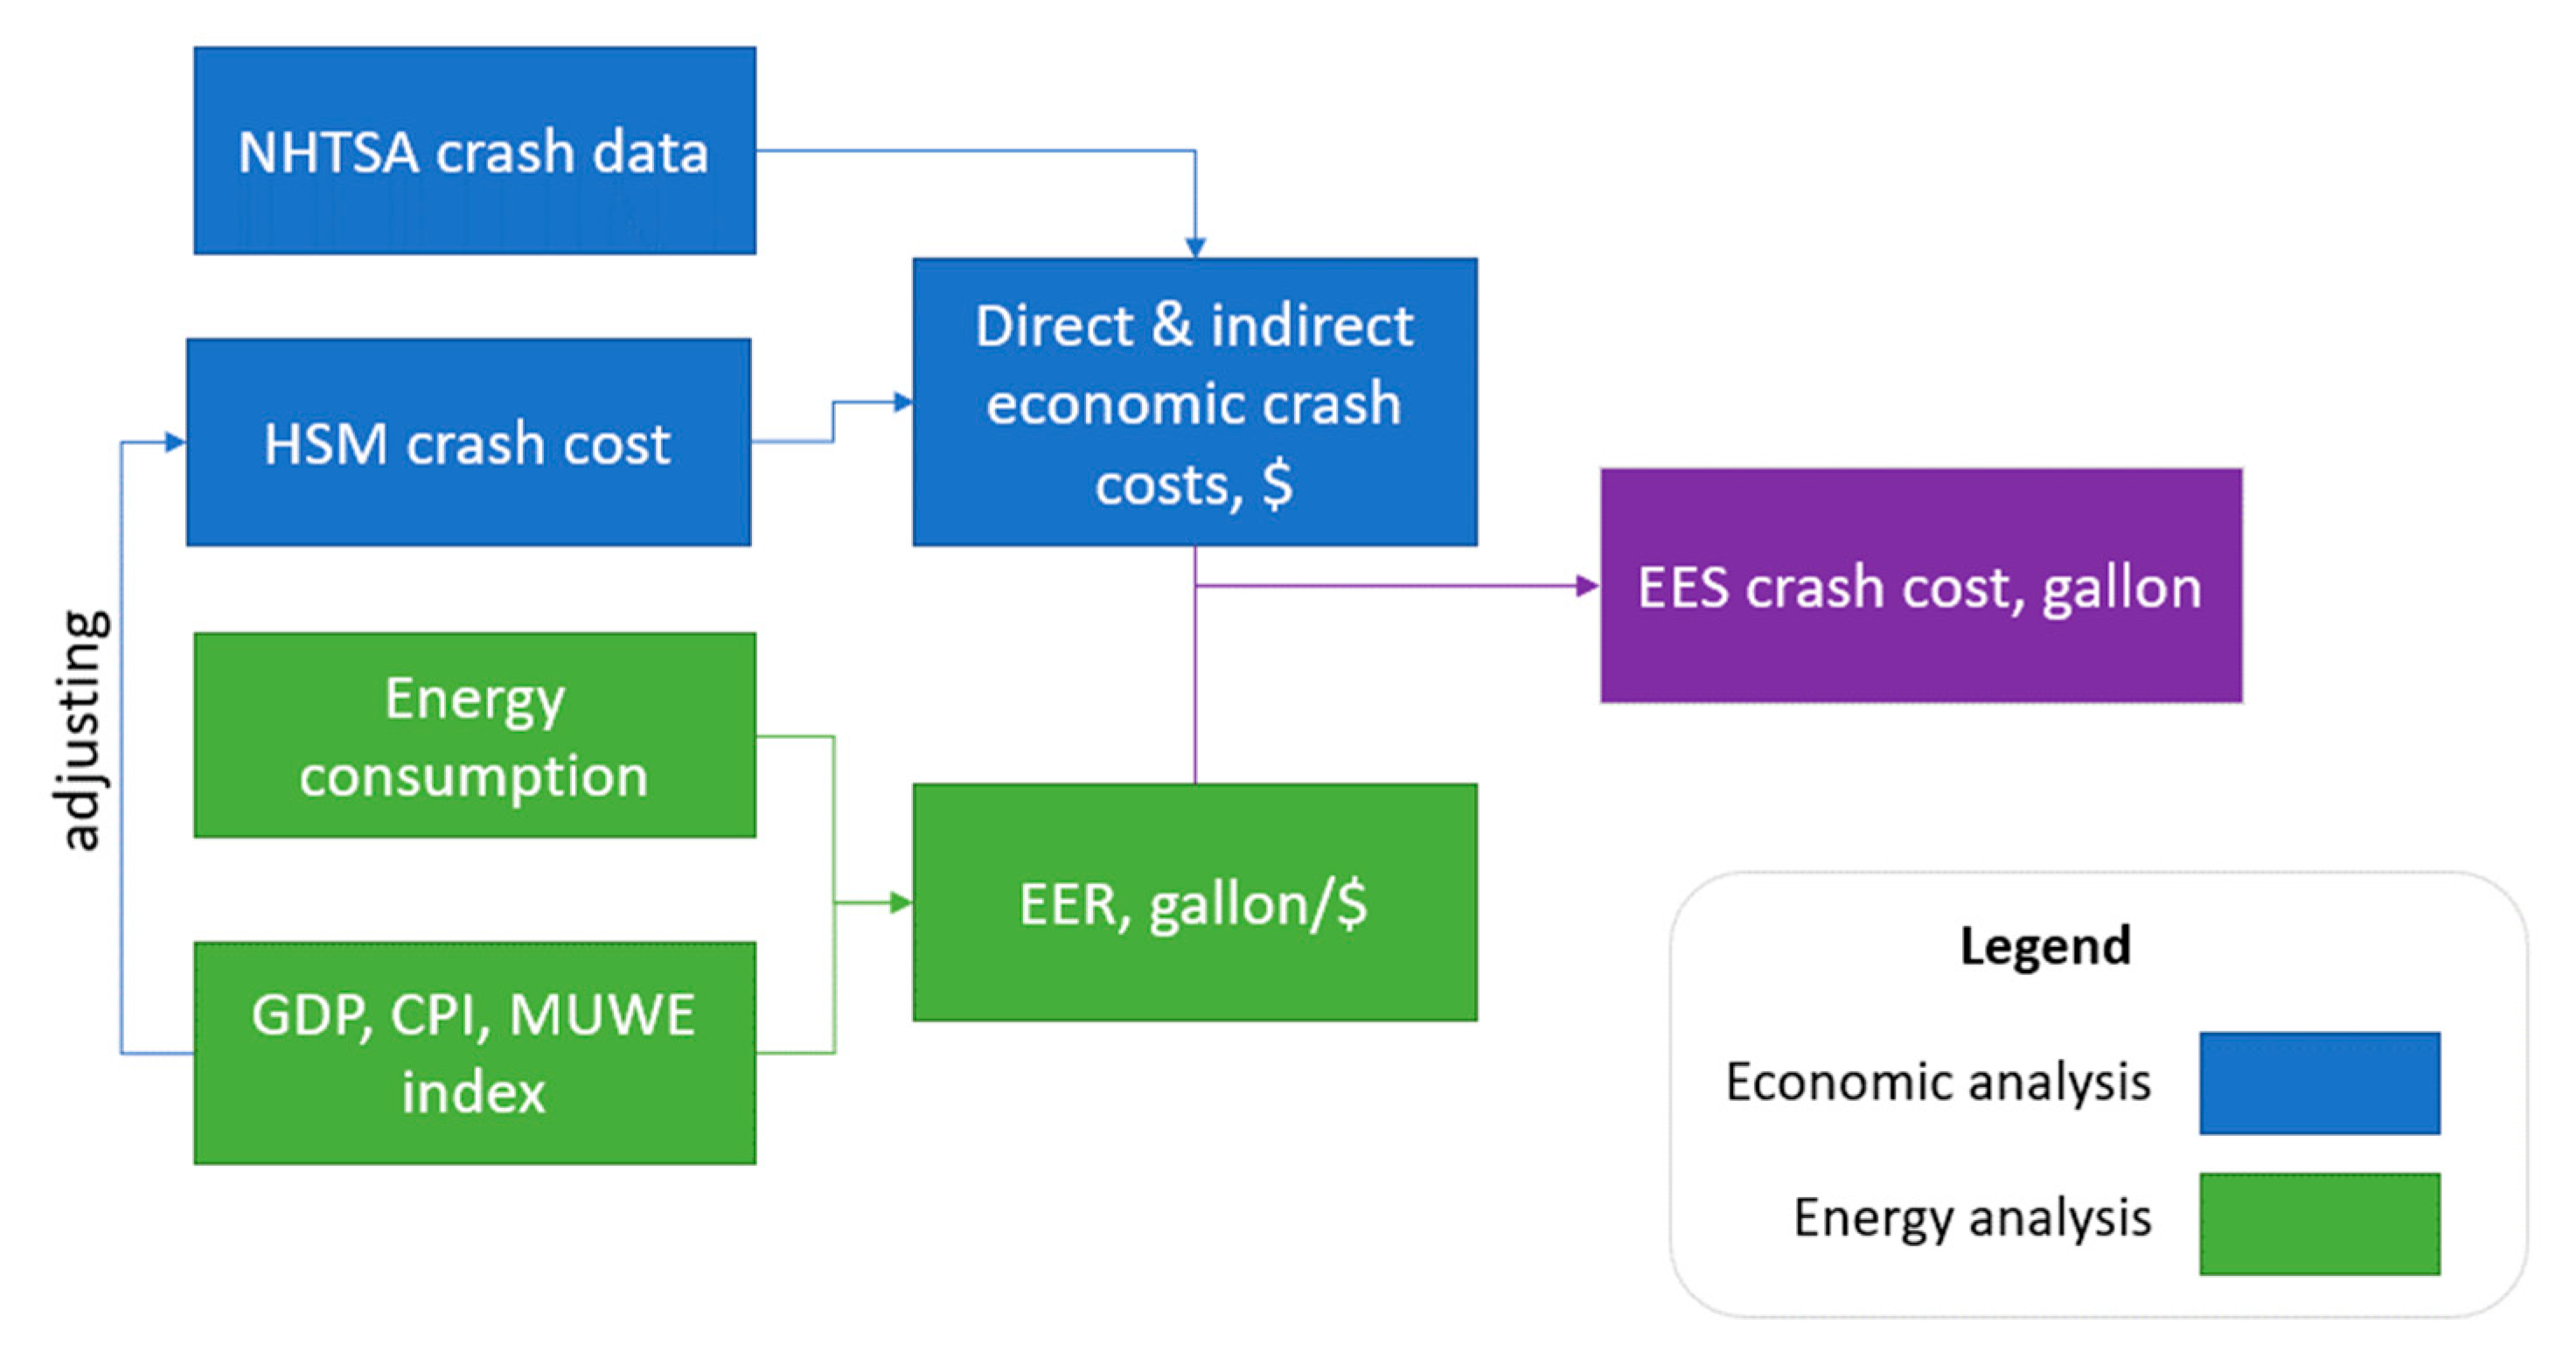
By the same token, the energy equivalence of crash cost comprises two parts: the direct energy cost and the indirect energy cost. The energy content of each is estimated using a gross domestic product to total national energy consumed ratio (as will be discussed later) to estimate total “embodied energy” of automotive crashes. Direct energy costs are estimated by the GDP-weighted energy equivalence of the direct economic costs. The indirect energy cost is converted from the indirect economic costs in the same manner. As with direct economic costs, several aspects of direct energy impacts are straightforward to estimate, with many precedents in the literature from which to draw. Many elements of the energy cost can be estimated in a straightforward manner, such as energy from induced congestion or energy from emergency response vehicles. However, other aspects are more difficult, such as rehabilitation activities or lost productivity of drivers due to induced congestion. The gross domestic product to total national energy consumed ratio is a convenient method to capture energy consequences if economic impacts are already known or estimated. The indirect energy cost is the energy equivalence of the cost that society is willing to pay to avoid the risk of injury and fatality crashes [
21,
28].
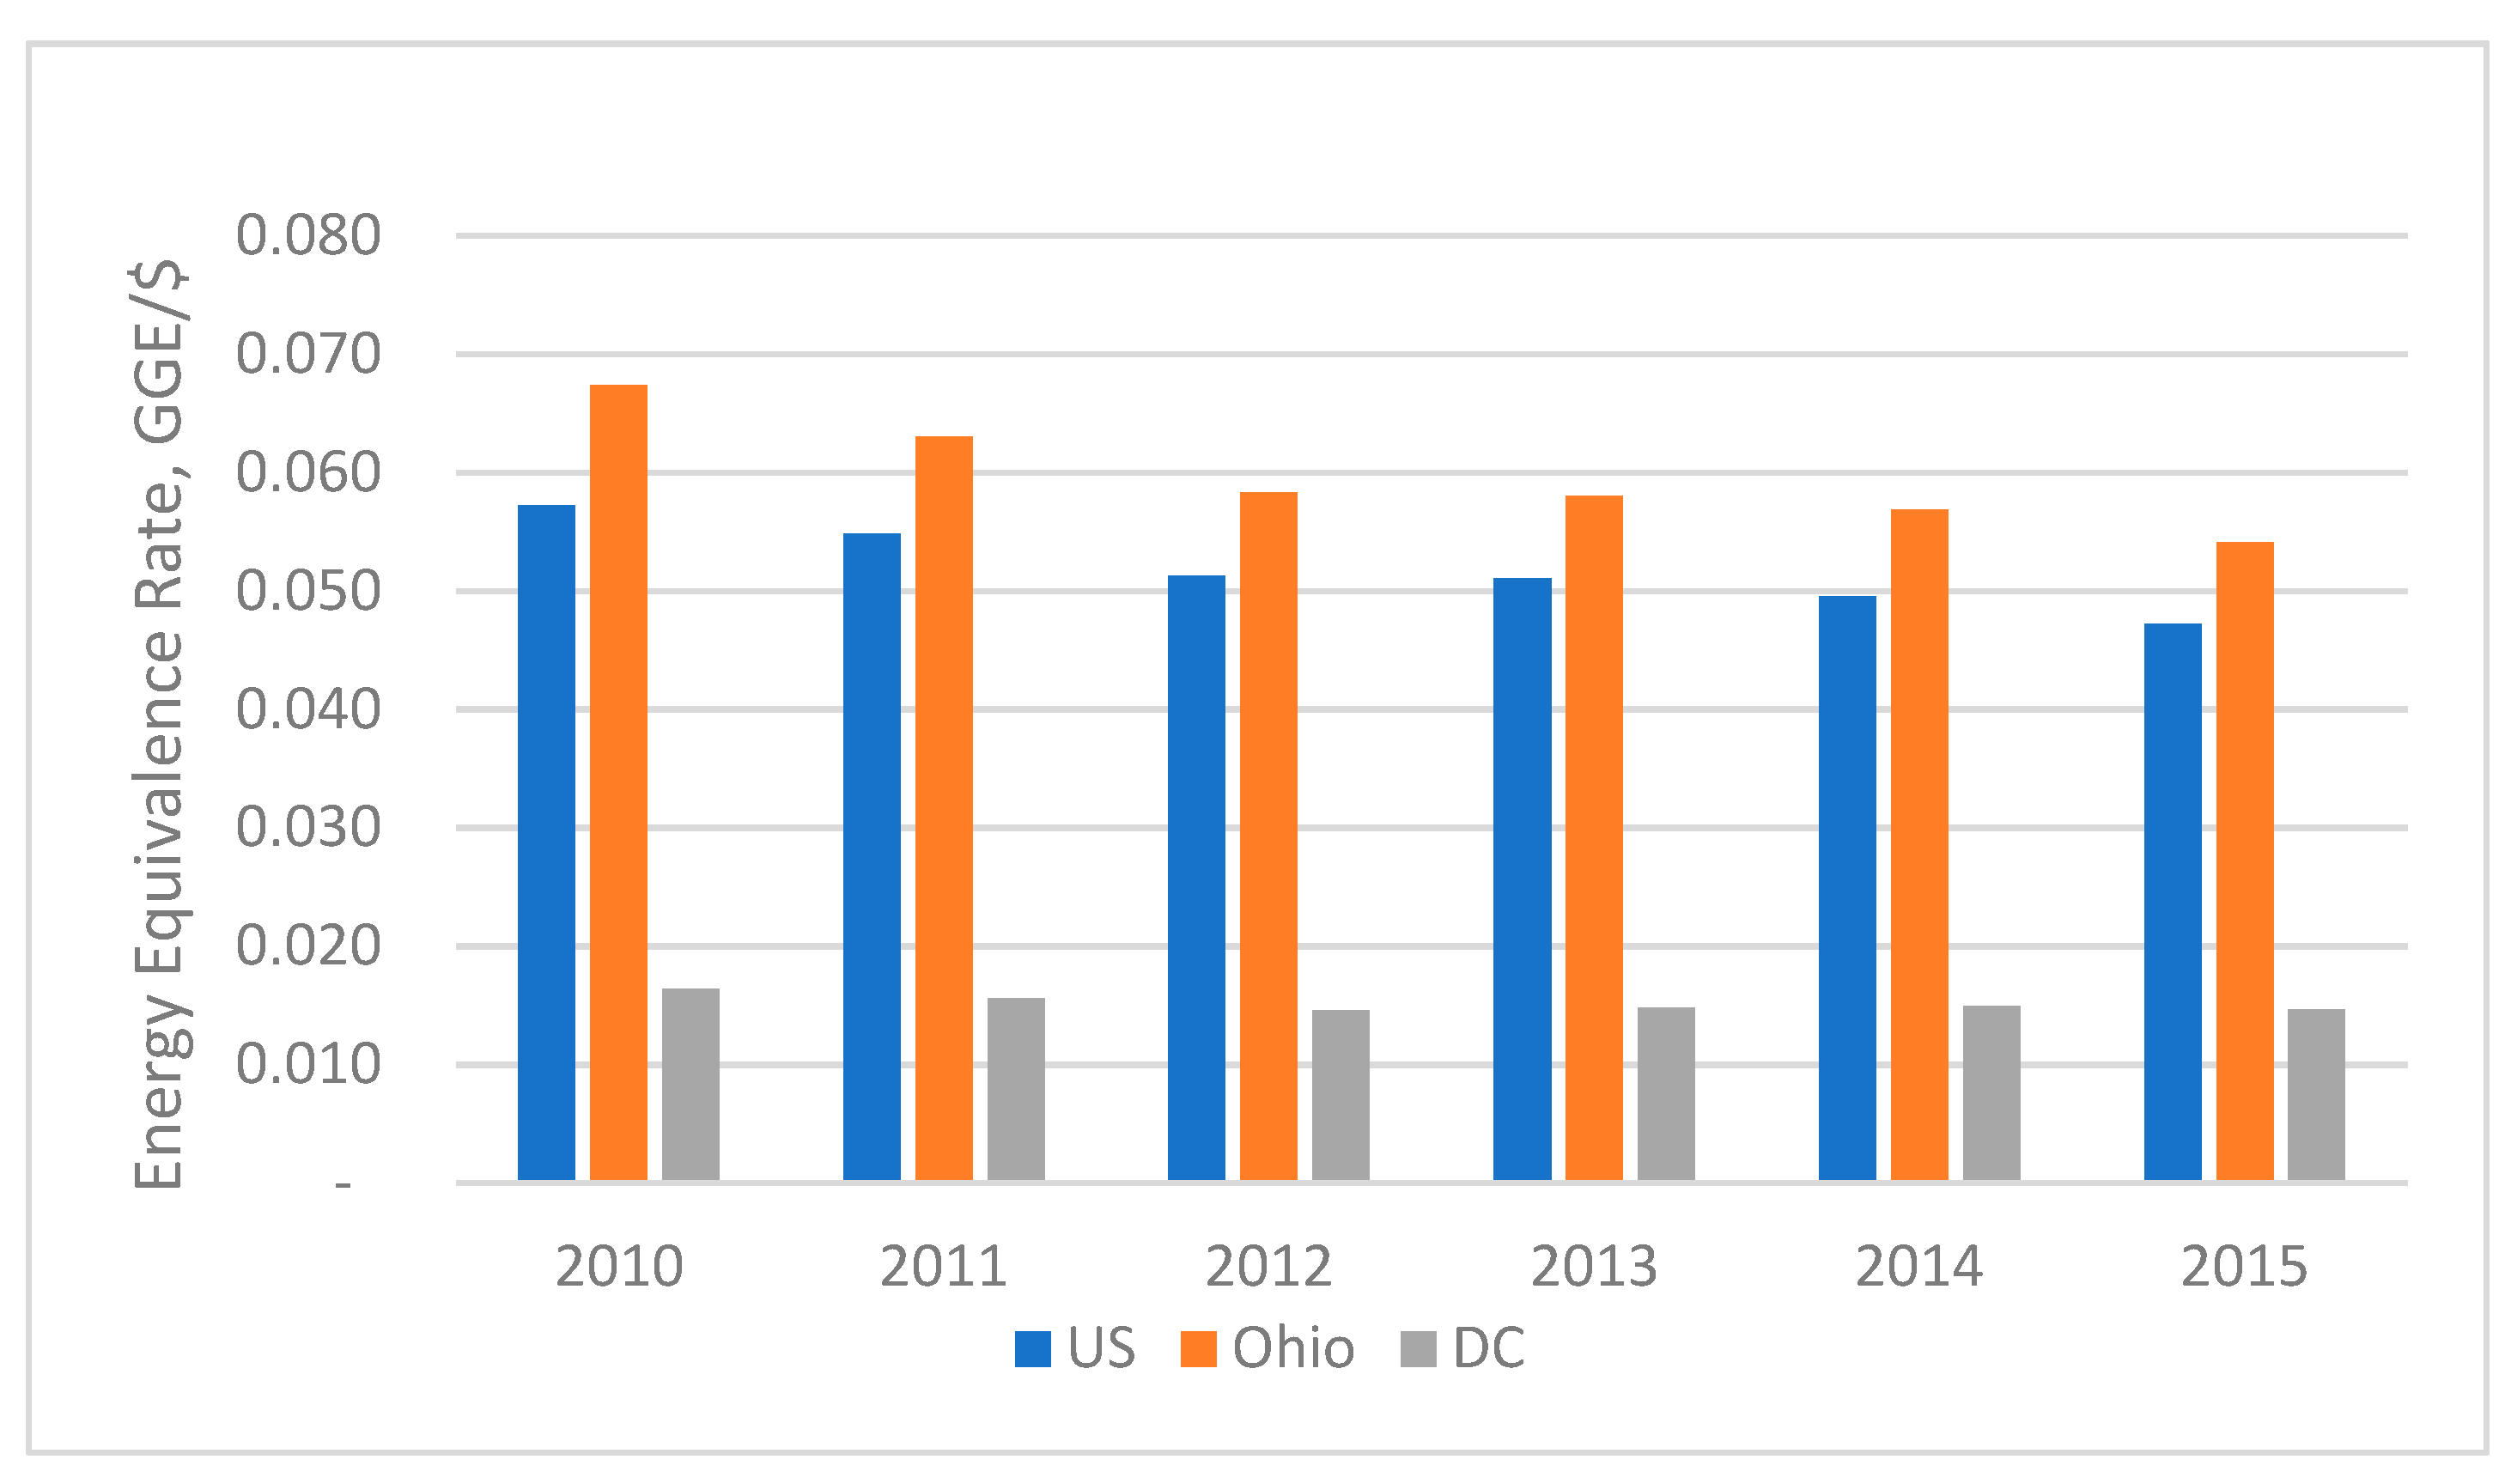
2.4. GDP-Weighted Energy Perspective
The energy consumption for all production sectors is estimated and expressed in British thermal units (BTUs) [
54] by the Energy Information Administration (EIA). The energy consumption in BTU can also be converted to gasoline gallon equivalent (GGE), which represents the amount of energy contained in one gallon of gasoline. The GGE conversion factor is 114,000 BTU/GGE [
55]. Using values of energy consumption and GDP of a specific year, the energy equivalence rate (EER) of the corresponding geographical area can be calculated. The higher the EER (expressed in BTU per dollar), the greater the amount of energy required to produce a unit value of GDP.
The framework hinges on an economic-to-energy-equivalence ratio in order to convert economic impacts to the equivalent energy impacts in terms of BTU or GGEs per crash type. The equivalency is determined at the national and state scale with estimated values of GDP (i.e., the value of all goods and services sold within the United States) and equivalent gross state product. If divided by population, the GPD can be apportioned on a per person basis. As of 2017, the GDP/person was USD 59,927, based on total GDP of USD 19.485 trillion dollars and a population of 325.7 million people [
56]. (Note that this compares to a U.S. median income of USD 61,136 [
57]).
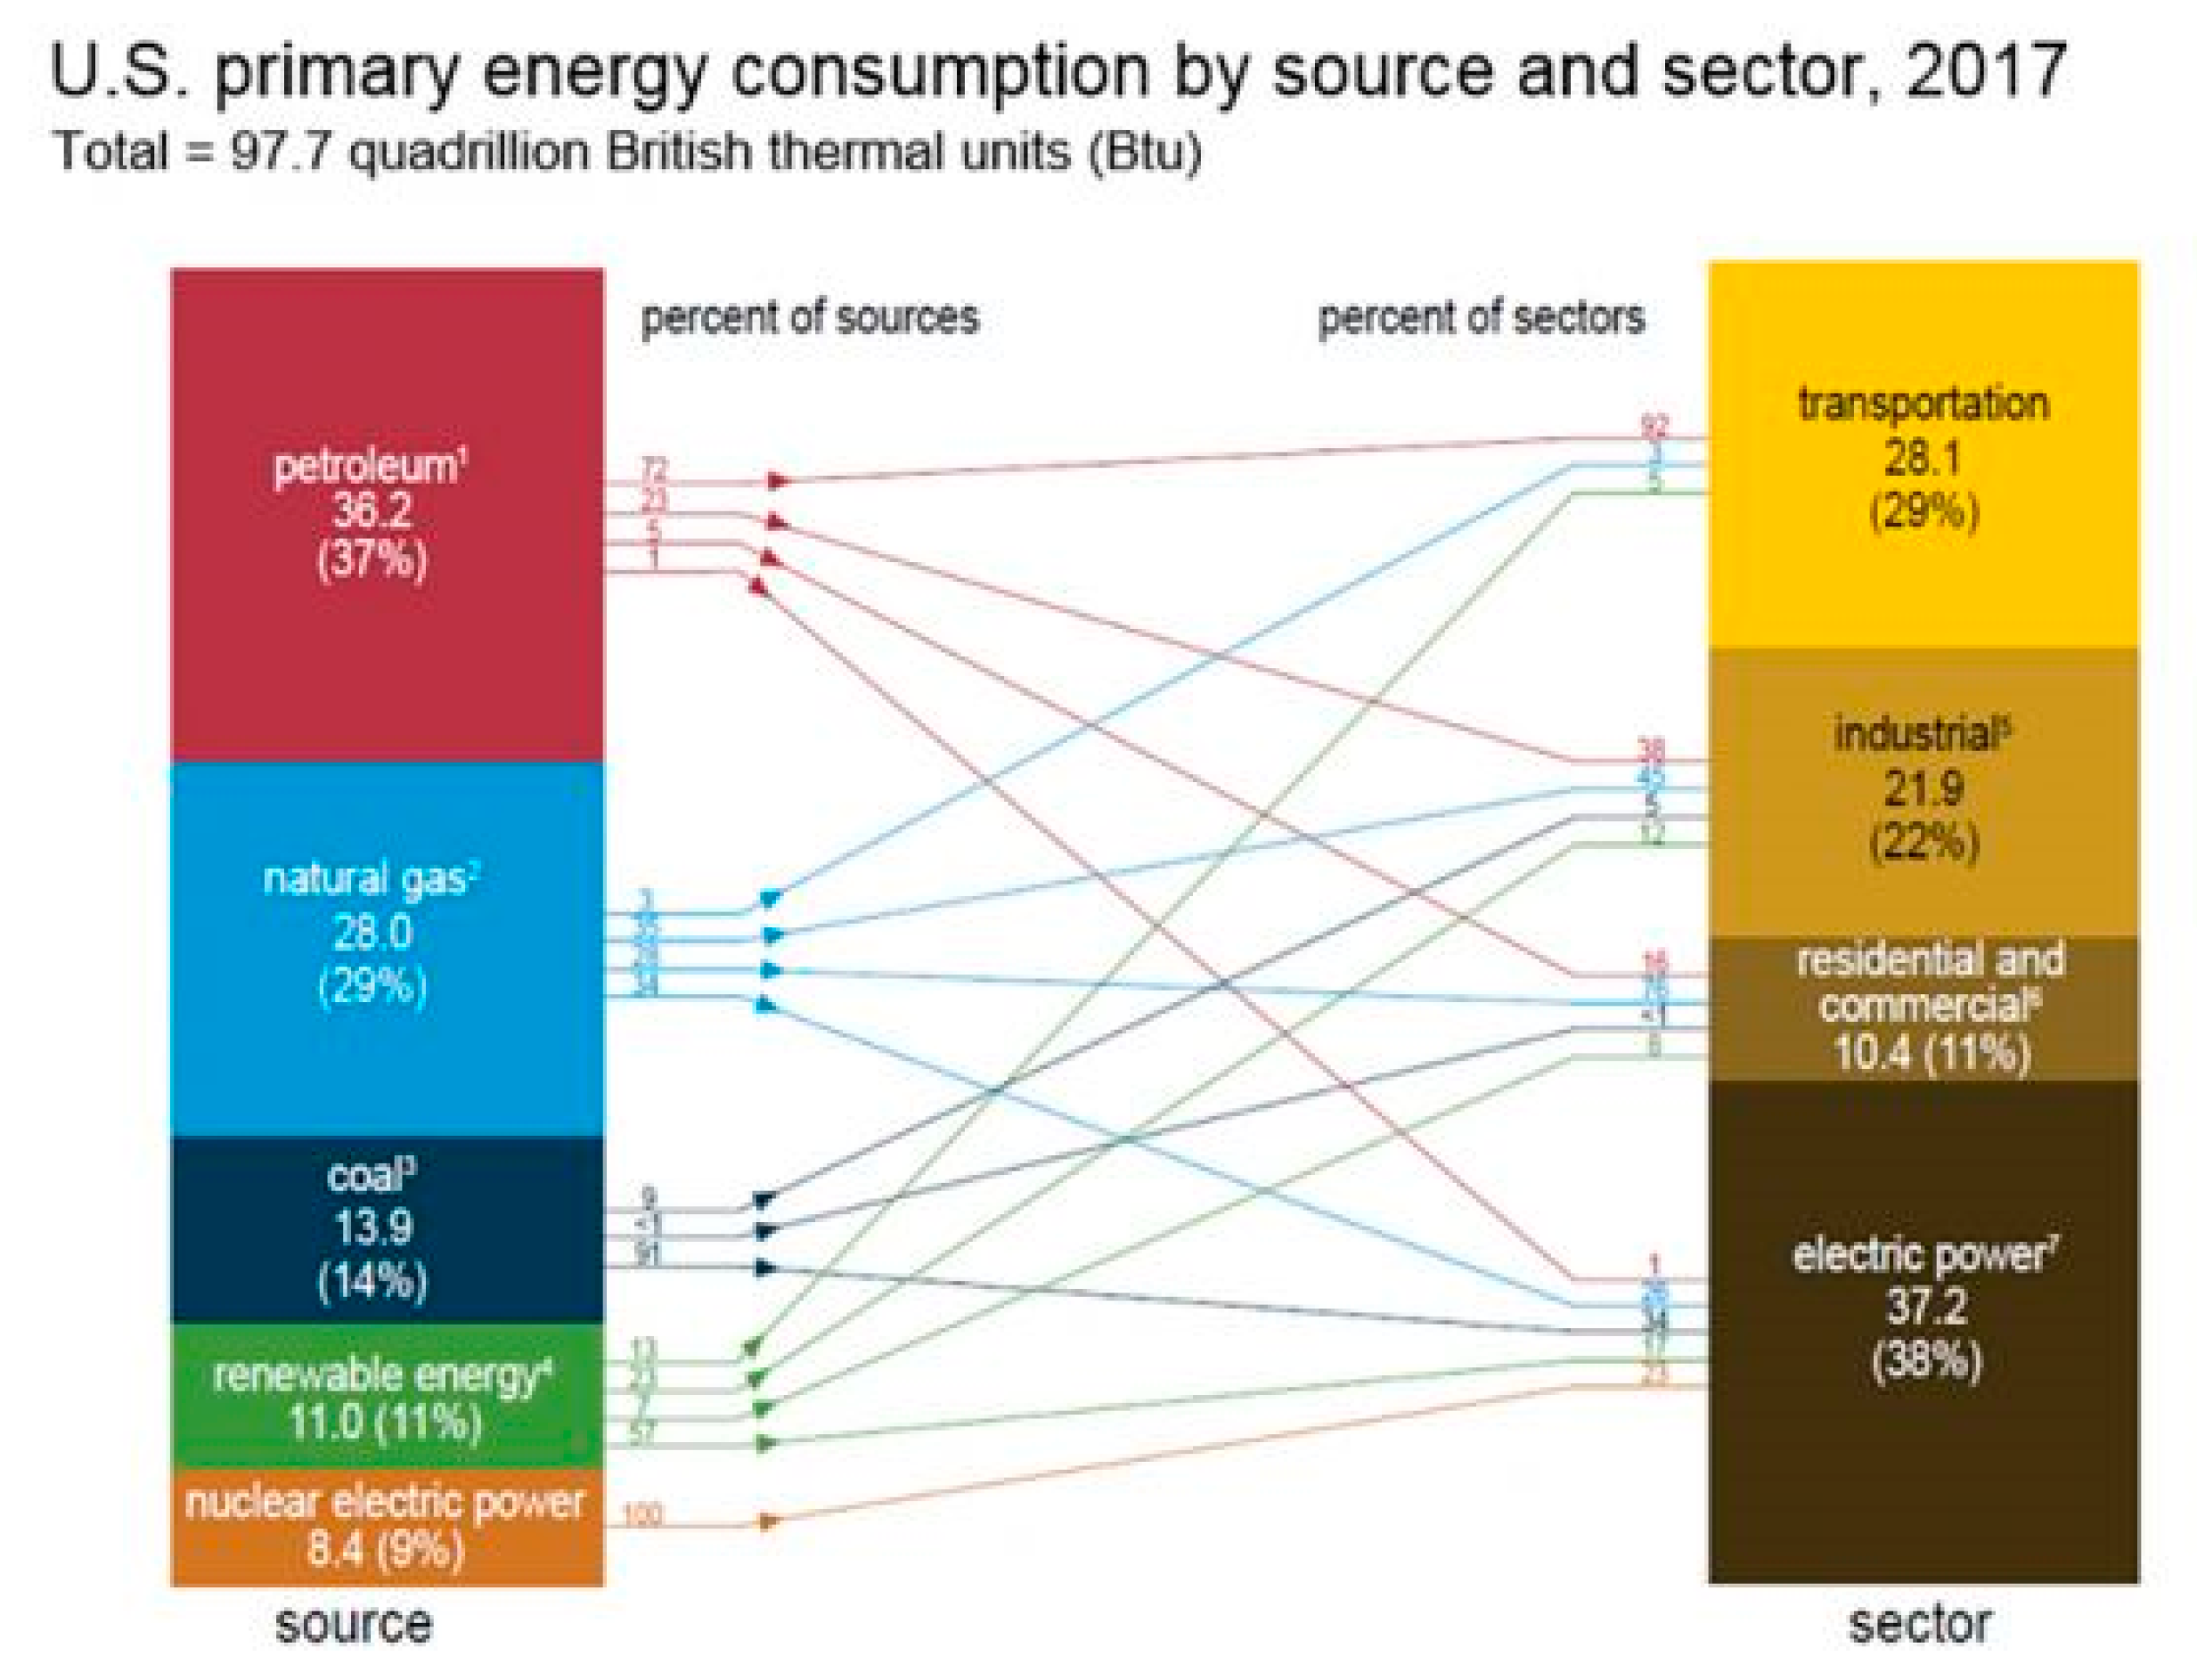
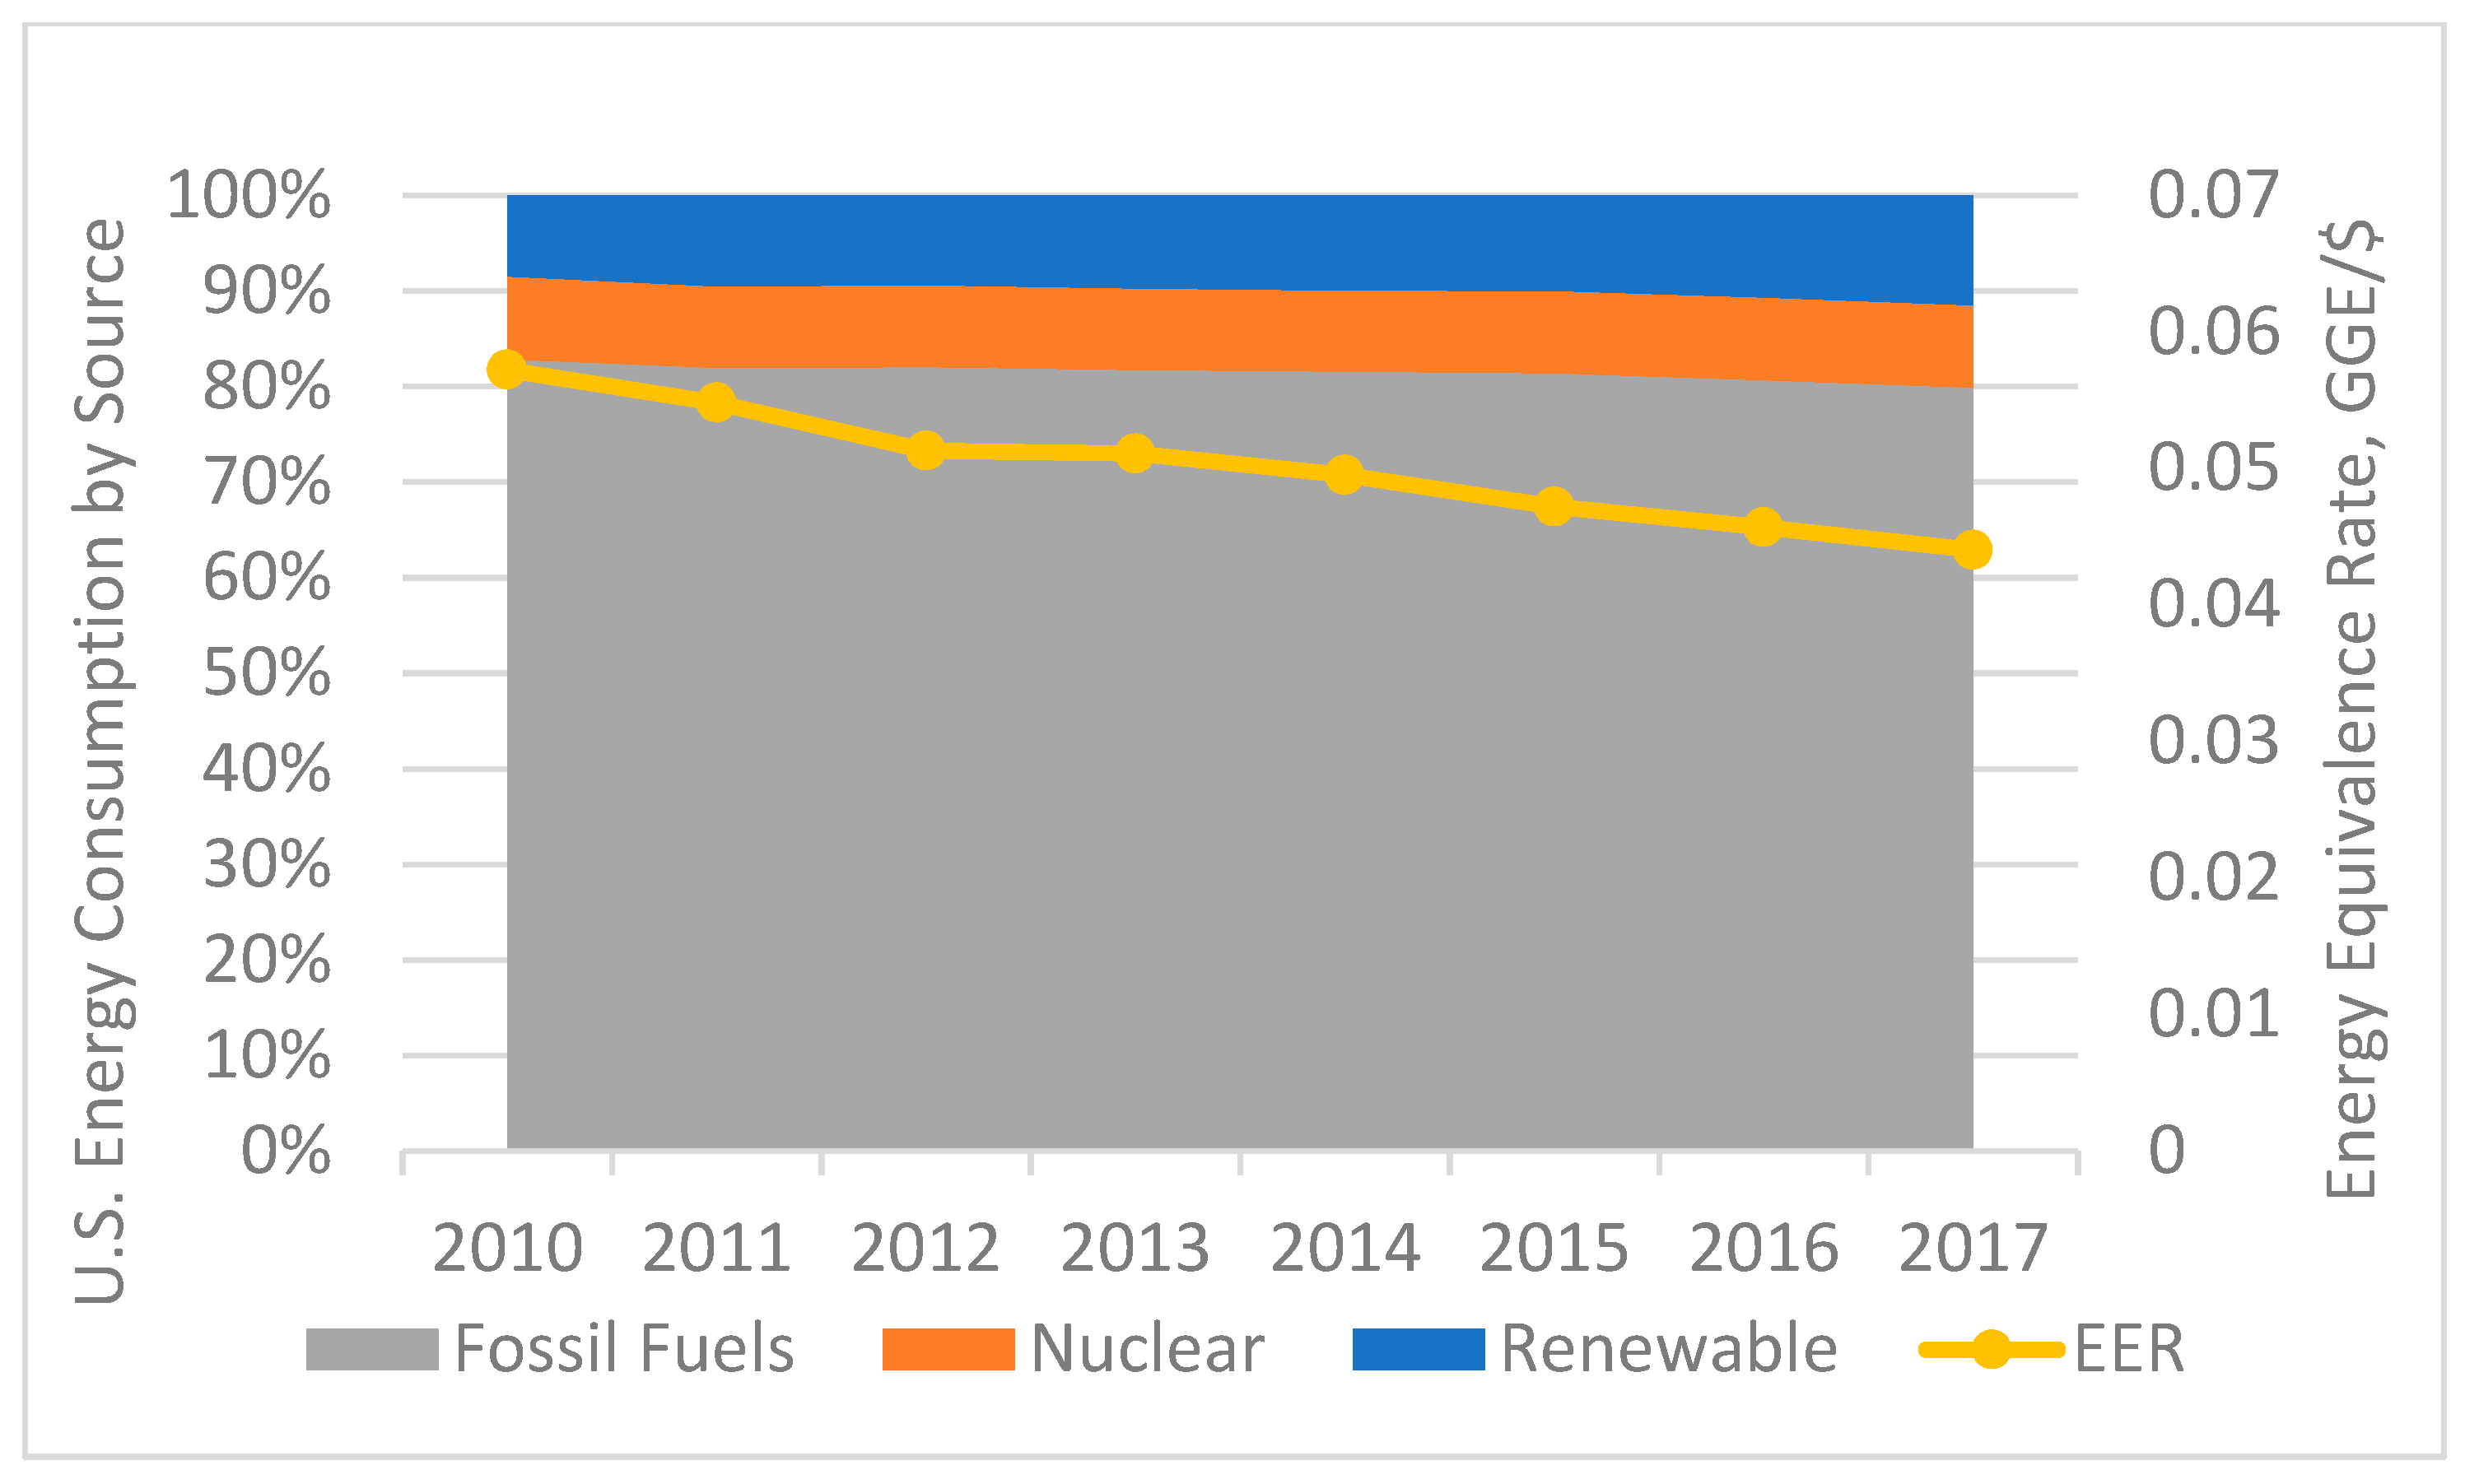
On the energy side, the consumption of petroleum, natural gas, and coal (for electricity use) are the primary sources of energy accounted for in the method, constituting 80% of energy consumed in 2017 in the United States, as illustrated in
Figure 3. Note that although solar, wind, nuclear, hydroelectric, geothermal, and other renewable/non-CO
2-contributing sources of energy accounted for 20%, they are omitted in the methodology (as they are renewable or non-CO
2 contributing), but they could be easily accounted for by factoring up appropriately [
58]. In 2017, 36.2 quadrillion BTUs (36.2 quads) of petroleum, 28.0 quads of natural gas, and 13.9 quads of coal (based on BTU equivalents of each source) contributed to the total U.S. expenditure of energy supporting the total of USD 19.39 trillion GPD. Likewise, each of these can be apportioned (averaged) to individuals.
The primary theoretical argument in the framework is that economic impacts can be translated confidently to energy impacts by using the energy to GPD ratio as outlined above. Similar efforts to quantify broader impacts in the view of comprehensive resources used have been reported from various fields. Sima et al. [
60] studied the energy intensity of labor for international trade in the European Union. In ecology, “emdollar” has been used as the economic equivalent of embodied energy, which is defined as the gross national product (GNP) equivalent to embodied energy contribution [
61]. The embodied energy, defined as the available energy that is used directly or indirectly to make an ecosystem component, has been used for environmental accounting and decision making [
62], such as for evaluating the natural capital for the U.S. National Forest System [
63] and reforestation alternatives in Puerto Rico [
64]. In construction, embodied energy is used to evaluate energy of production workers who eat food, travel to work, and maintain a lifestyle spending energy, part of which is allocated to their work [
65,
66]. Similar efforts can be done for quantifying the embodied energy in the operation, maintenance, and final demolition of the building.
When it comes to transportation, the economic impacts are not just vehicle efficiency or traffic dynamics efficiency (i.e., congestion). The larger impacts have to do with larger economic productivity aspects of the individual and the economy as a whole. Thus, in judging the broader, holistic impacts of crashes, we also have to take into account the energy intensity of the broad array of activities for which a crash impacts the economy. For example, in the case of a fatal crash, consider two impacts that can be measured economically but that are difficult to directly assert an energy measure. In a fatal crash, the deceased no longer contributes to the overall productivity of society. The investment in that person’s life in terms of resources to the point of their death is balanced against their productivity; that is, what each person invests back into society through their professional and personal lives.
Although a person’s worth cannot be wholly measured economically, economics is one area in which it can be measured and used as a mechanism to begin to understand energy consequences. A human begins to be highly economically productive after education and entering the workforce. All economic investment into the person can be considered an embedded or embodied resource. In the event of an untimely death, the investment of the embodied resources is lost, as well as the anticipated future productivity that the person would have contributed to society. Energy can be thought of in a similar fashion but is more difficult to quantify. Economics, however, through equivalencies described above, provides a surrogate method to estimate energy impacts related to embodied energy and its loss with respect to injury and death.
Similarly, “willingness to pay” is a concept in which economists assess the hazard premium that society as a whole puts on the value of risk associated with loss of life and injury. Similarly, this premium, which is based on VMR, has an energy equivalence in the broader term. Whether based on insurance premiums or the cost of increased safety features in cars (such as expensive anticollision features, crash safety design, or bigger/heavier vehicles to protect occupants), such willingness to pay has an economic impact that results in energy impacts (which are difficult to directly assess), which can be estimated by GDP-to-energy equivalencies.


