1. Introduction
Sustainable development of the energy sector of individual countries and regions is an important part of the overall sustainable development concept [
1,
2]. Activities related to the sustainable development of energy sector focus primarily on increasing the use of alternative, including renewable, energy sources in the energy mix [
3], improving energy efficiency [
4,
5], and reducing greenhouse gas and air pollutant emissions [
6,
7]. Occasionally, this subject also concerns the issue of improving the quality of life of citizens [
8]. However, society is considered to be the most significant part of this system. Therefore, it can be assumed that sustainable energy development affects the economy, environment and social welfare of given countries. The environmental impact of the energy sector is extremely significant due to the resources used for its production. It is considered to be the main source of greenhouse gas (GHG) emissions. In the case of the European Union (EU), nearly 80% of these gases are emitted from this sector [
9]. The main reason for this is the use of non-renewable fuels for energy production [
10,
11]. In order to reduce the emission of GHG and other harmful substances into the atmosphere of the environment, the EU has been taking measures to limit this process for years, and thus to protect the climate and counteract its negative, catastrophic effects. These activities are mainly focused on the energy sector and include improvement in energy supply, development of renewable energy (RE) and improvement of energy efficiency. Their goal, in line with the idea of sustainable development, is to ensure further economic development [
12].
For many years, all activities of the European community have been concentrated on a comprehensive and integrated approach to energy and climate policy with simultaneous satisfaction of social needs and economic competitiveness. With regard to the EU, one of the most important climate and energy goals in the context of environmental sustainability, sustainable consumption and production as well as the eradication of poverty is to ensure that all citizens have access to sources of stable, sustainable and modern energy at affordable prices. That is why, sustainable and modern energy in the EU should be understood as energy produced and used to the greatest possible extent from RES and nuclear energy, because such energy is practically zero emission [
13] and has no negative impact on the natural environment. The EU is a world pioneer in clean energy. It was the first to set ambitious targets for energy production while protecting the climate in 2009. These include the achievement, in 2020, of a 20% reduction in GHG emissions, a 20% increase in renewable energy and 20% energy efficiency [
14]. At the end of 2014, the European Council adopted and, in December 2018 revised, the targets, under which it undertook to achieve by 2030 a reduction of at least 40% of GHG emissions versus 1990 levels and an increase to 32% of the share of energy from renewable sources consumed in the entire European community, among other objectives [
15]. In November 2016, the European Commission published a set of eight pieces of legislation entitled “Clean Energy for All Europeans”, on updating the energy policy framework for 2020–2030 [
16], which is a continuation of the climate and energy package with targets until 2020 (Directive 2009/28/EC [
17]).
According to the assumptions of the climate strategy, known as the European Green Deal [
18], presented at the climate summit in December 2019 in Spain (Madrid), the economy of the EU-27 countries is to become “zero emission”, i.e., climate neutral, by 2050. The assumptions of this strategy are much more ambitious than those presented at the 2018 climate summit in Poland (Katowice) [
19]. On the other hand, during the European Council summit held on 10–11 December 2020, the EU-27 leaders agreed (increased) the CO
2 reduction target of 55% by 2030 [
20].
Also, in 2019, the European Parliament adopted the package of legal acts “Clean Energy for All Europeans” in the EU. The package proposes a number of measures to tackle energy poverty, which may affect up to 11% of the EU-27 population by improving energy efficiency and safeguarding against disconnection from heat and electricity [
21]. All activities undertaken by the EU-27 related to the climate and atmosphere are in line with the implementation of objectives 7 “Affordable and Clean Energy” and 13 “Climate Action” of the “2030 Agenda” adopted in 2015 by the UN General Assembly [
22].
These ambitious assumptions for the new climate and energy commitments mainly focus on the sustainable development of the energy sector. The ideal state of this sector is that energy should be produced and consumed only from clean energy sources (mainly renewable energy) [
23,
24,
25]. Therefore, the sustainable energy development of individual countries is necessary for the continued existence of the energy sector and crucial for the development of RES, economy, environment, and society [
26].
In the last 30 years, the EU-27 countries have reported a significant increase in the production and use of energy from renewable sources. Since the first activities in this area (2009), the production of energy from RES in the EU-27 has increased by nearly 43%, from 157.49 Mtoe to 233.93 Mtoe (data from 2018). At the same time, GHG emissions from the energy sector has decreased by around 9.7% (while total emissions have decreased by “only” 7.2%). The increase in the share of renewable energy in the total amount of energy produced, and consequently the reduction of GHG emissions, is the result of the implementation of the EU-27 climate and energy policy, which involves tools such as significant investment incentives in the renewable energy sector [
27]. Between 2009 and 2018, expenditure on the Research and Development (R&D) sector increased from 1.87% to 2.18% of the GDP (approx. EUR 87 286.787 million).
Despite such intensive measures, non-renewable (conventional) fuels are still the basis of the energy mix of the EU-27 countries. It should also be emphasized that there is a great diversity of the EU-27 in terms of the energy and environmental situation. It is mainly the result of the diversification of the economic level, the condition of energy systems, their structure, and social awareness. This applies to the share of non-renewable and alternative sources (zero-emission: renewable and nuclear) in the countries’ energy mixes, the amount of GHG and air pollutant emissions into the atmosphere, energy efficiency, and energy poverty. Despite the joint pro-ecological activities by the EU-27, there are large differences that have and may have a further impact on the achievement of the assumed energy policy objectives.
The economic development of EU-27 countries and their wealth measured by the GDP (economic potential) have the most significant impact on the effectiveness of the introduced changes. The demographic potential of individual countries is of great importance, as it determines social approach and awareness. Another important factor, especially in the field of renewable energy development, is also the geographical location and area of a country.
It seems that in order to assess the energy status of the EU countries in terms of sustainable energy development, it is necessary to take into account those factors that are easily quantifiable. It is much more difficult to assess the impact of political conditions on the formation and introduction of a sustainable development economy. Their influence is undoubtedly significant, but difficult to unambiguously evaluate.
The study, the results of which are presented in this paper, involved the assessment of the sustainable energy development of the EU-27 countries, based on the adopted indicators and in relation to the economic potential (GDP) and demographic potential of studied countries. In this regard, the Technique for Order Preference by Similarity to Ideal Solution (TOPSIS) method was utilized for the analysis, which allowed the authors to rank studied countries and assign them to one of four classes. At a later stage, the adopted indicators were used and compared to the GDP value and the number of inhabitants of individual countries. Then, studied countries were divided into similar groups. For this analysis, the Kohonen artificial neural network method was adopted. It allows for the division of the EU-27 countries into similar groups according to their similarity in terms of the profiles of the sustainable energy sector.
In order to carry out an objective assessment of the sustainable energy development of the EU countries, a group of indicators was first selected to describe the energy sector in its most important areas, namely energy, economic and environmental aspects (the so-called 3E model [
28]). Since the human factor is an inherent part of the concept of sustainable development, it was also necessary to describe this sector in the social (S) dimension, which was possible with the use of the 3E&S model (Energy, Environment, Economy and Society). The use of these four dimensions is fully justified from the point of view of the sustainable development economy, as it covers all most important elements (economy + people + environment). In order to look at the specificity and capabilities of individual countries, these indicators, which characterize the sustainable energy development of individual countries, were compared to their economic and demographic potential. As mentioned before, the value of GDP is still the most important indicator of the level of socio-economic development. In turn, the population factor is crucial when considering country development. As research shows, the size of the population may, for example, influence the emissions of greenhouse gases, the largest amounts of which come from the energy sector [
29,
30].
Thus, the TOPSIS measure, belonging to the group of pattern linear ordering methods of multidimensional objects, was used to assess the sustainable energy development of the EU-27 countries, while the Kohonen artificial neural networks method was used to identify similar countries.
The following two hypotheses were made in the study:
Hypothesis 1 (H1). The assessment of the level of sustainable energy development depends on the GDP value and population size of a given country.
Hypothesis 2 (H2). It is possible to distinguish groups of similar countries in terms of sustainable energy development, taking into account the GDP value and the number of inhabitants of these countries.
The aim of this research was to assess the level of sustainable energy development in the EU-27 countries and to identify similar countries groups in terms of the profiles of this development. The division of countries into similar groups makes it possible to identify countries that can cooperate in the field of sustainable energy development and those that can implement joint programs supporting this process. Due to the large fragmentation of the EU (as many as 27 countries), such cooperation is necessary and well-founded. This applies in particular to financial aid (e.g., the Just Transition Fund), the excessive fragmentation of which may result in ineffective use from the point of view of the entire EU-27. Thus, the division into similar groups is to indicate, if possible, which groups of countries should jointly conduct transition activities and to which of them funds for dedicated projects should be provided.
Although the rich literature devoted to the issue of sustainable energy development provides a lot of scientific information on the energy sector in the form of, for example, energy security [
31,
32], renewable energy [
24,
26], the impact of the energy sector on GHG and air pollutant emissions [
33,
34] or energy prices [
35], the study presented in this paper and its results provide a new look at the energy transition process in the EU. At the same time, due to their originality, they enrich knowledge in this field.
The first factor that makes this paper original is the selection of a set of as many as 13 indicators of sustainable energy development, taking into account the environmental, energy, economic and social dimensions and comparing the values of these indicators to the economic and demographic potential of individual EU-27 countries. Such a broad and comprehensive approach to this issue will enable the acquisition of additional knowledge that can be successfully used in practice.
The second factor concerns the use of the TOPSIS method to assess the level of sustainable energy development in the EU-27 countries. This is one of the most popular and reliable methods of multi-criteria decision making. Also, it is widely adopted in the analysis of economic multi-criteria problems [
36]. The use of this method in the presented analysis increases its scientific value and gives credibility to the obtained results.
Another factor that makes this work unique is the identification of the similarity of the EU-27 countries in terms of their sustainable energy development profiles and the use of the Kohonen artificial neural networks. These networks make it possible to divide the EU-27 countries into similar groups, which, as already mentioned, is to support their joint ventures. According to the authors, it is of key importance when considering the diversity of the EU-27 countries. The adoption of the economic and demographic potential makes this paper even more original.
It should also be mentioned that the EU-27 countries have already been the subject of many empirical studies of a comparative nature. However, this type of research usually boils down to the identification of disproportions between these countries, and not to the identification of similarities, which was done in this study.
2. Literature Review
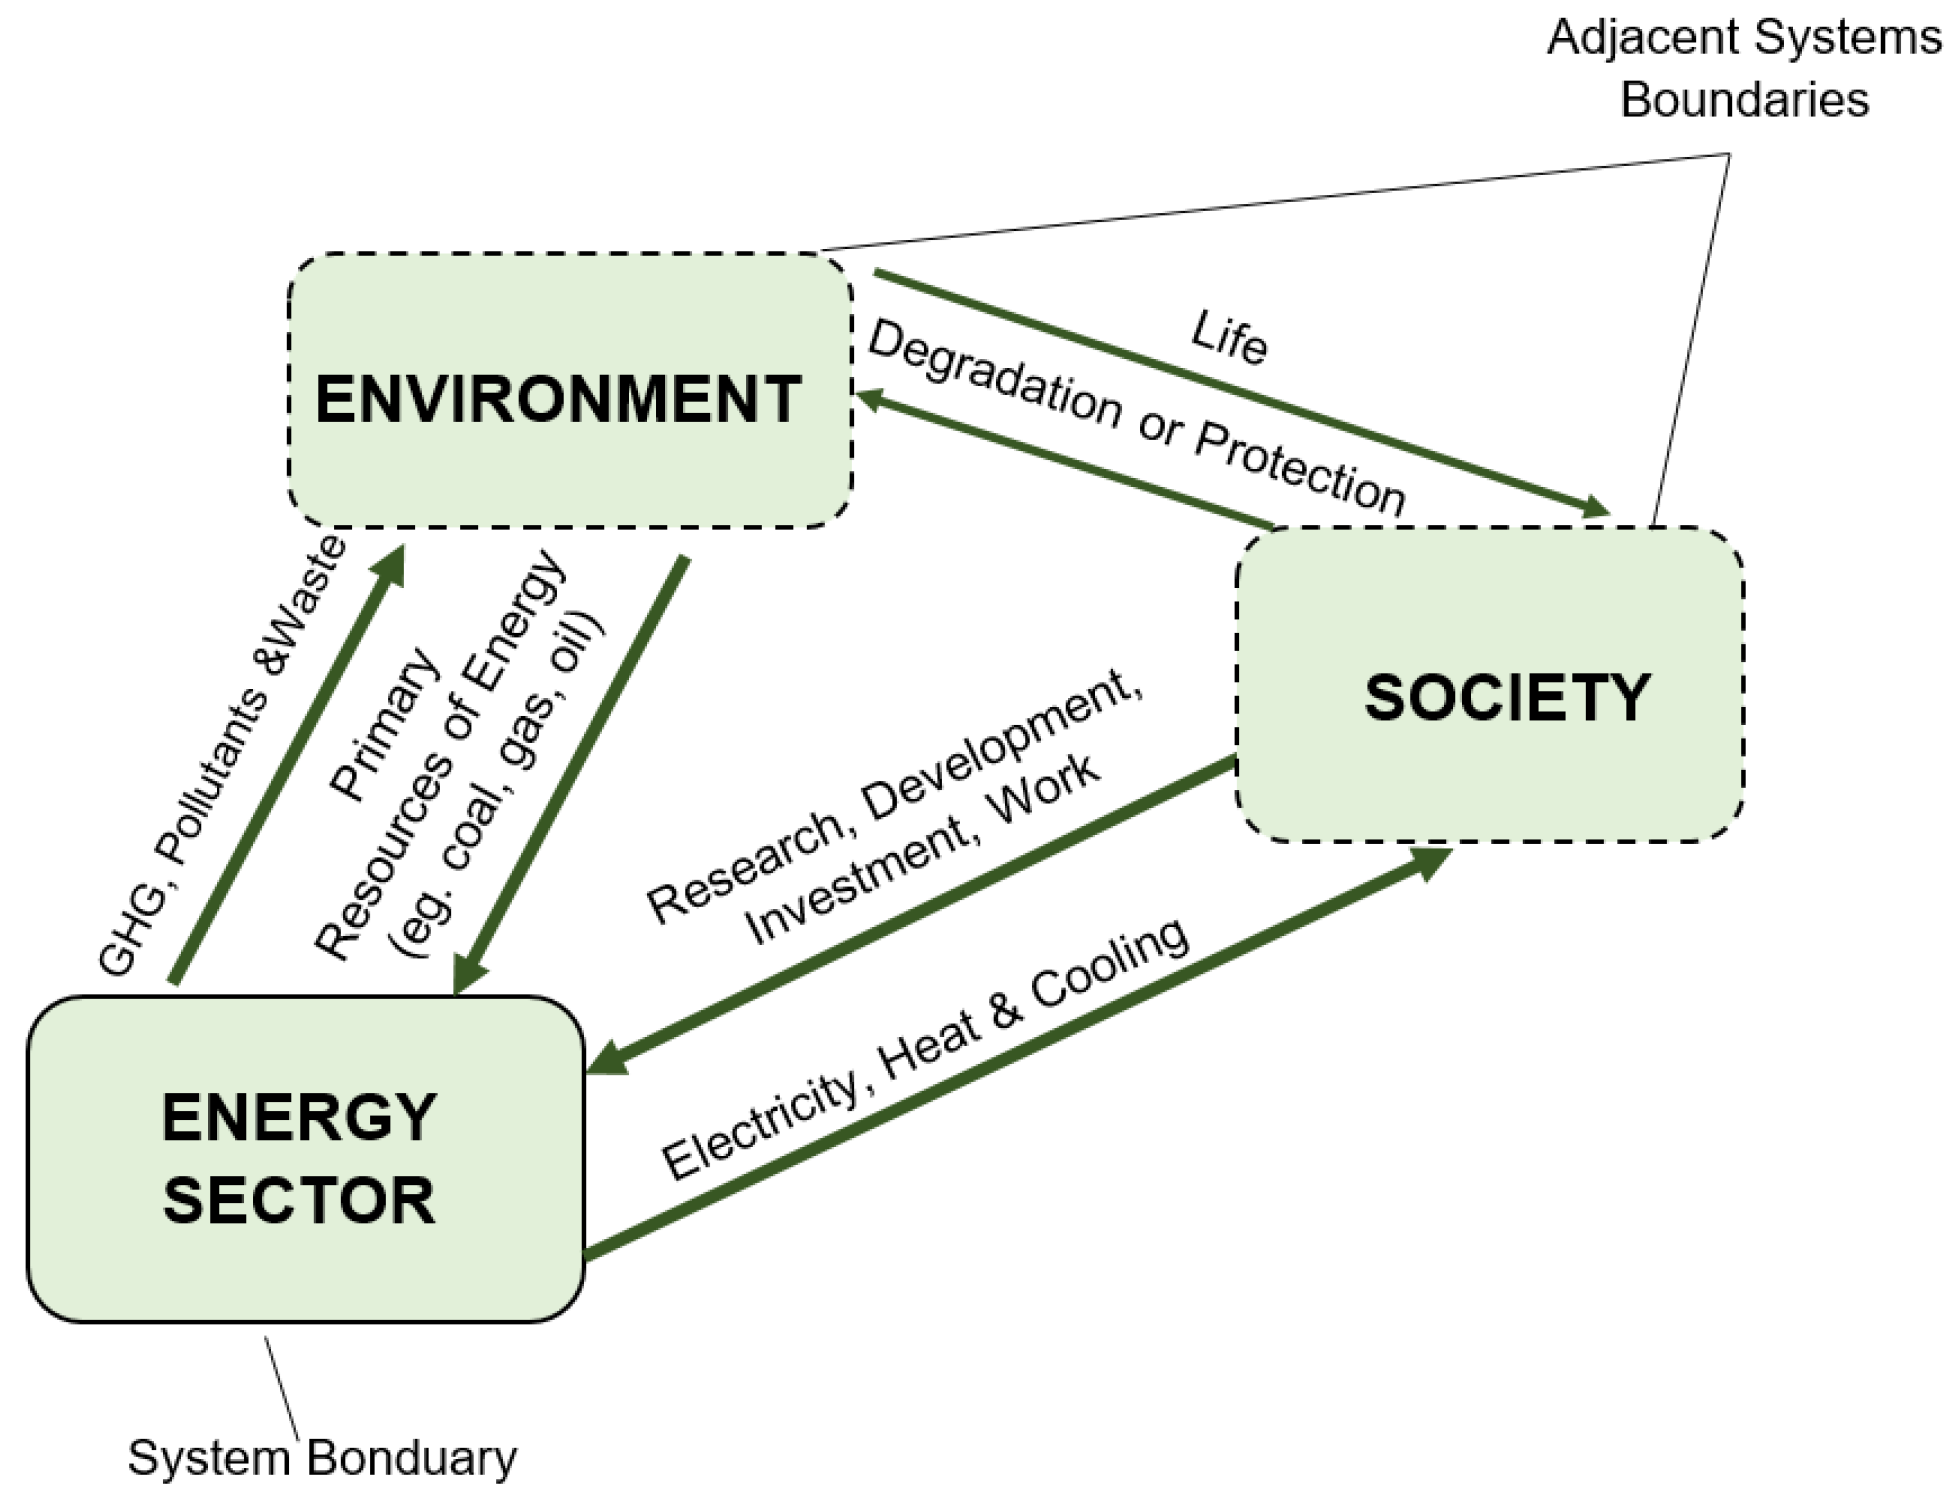
Based on literature review, many studies are found to be devoted to the research on sustainable energy development. The popularity of this subject is due to the fact that both obtaining and using energy is an extremely important factor in the concept of sustainable development. The implementation of the philosophy of this concept in the energy sector is carried out through various activities, including the development of technologies using RES or the development of the electricity and heat production sectors. However, it should be remembered that sustainable energy is not limited only to renewable and nuclear (zero-emission) energy sources. In fact, it is a much broader concept as it concerns all energy sources and their impact on the environment. Also, it is related to both economic and social aspects. Sustainable energy is to serve to improve the quality of life of citizens in a permanent manner. An efficient, reliable and, at the same time, ecological energy system fosters the creation of environmental, economic and social cohesion, and energy is extremely important in actions directed toward sustainable development (
Figure 1).
Actions for the sustainable development of energy systems include the reduction of GHG and air pollutant emissions, increased security of energy supply, the use of RES, as well as improved energy efficiency and life quality [
8]. On the one hand, energy has an impact on the environment, economic development and social well-being of the population, and on the other hand, its production also depends on population prosperity and size (
Figure 2).
Therefore, the energy sector is considered to have an immensely significant effect on sustainable economic development. Thus, it is necessary to monitor energy systems, which gives the opportunity to receive information about them, make analyses, comparisons, and, as a result, decisions aimed at implementing the sustainable development strategy in this sector. It is possible to monitor energy systems by using appropriately selected indicators. The main premise for the creation of indicators is the operationalization of the concept of sustainable energy development for the purposes of controlling the implemented objectives included in various EU documents and at national levels. In this context, selected indicators must be marked with comparability and formal correctness with the assumed goals, as well as substantive usefulness, namely a relational correlation with the described issue [
38].
In 2005, the International Atomic Energy Agency (IAEA) in cooperation with the United Nations Department of Economic and Social Affairs, the International Energy Agency (IEA), the Eurostat and the European Environment Agency, developed Energy indicators for sustainable development: both guidelines and methodologies [
39]. This paper presents a set of 30 indicators related to sustainable energy, which have been grouped into social, ecological and economic. They enable countries to track progress related to their sustainable development goals, including those in the energy sector. The set of these indicators is a proposal for a holistic approach to the problem of sustainable energy.
In the database of the European Statistical Office [
27], it is possible to track indicators related to the implementation of the 20-20-20 target. The Eurostat provides a set of 5 indicators such as GHG emissions, the share of renewable energy sources in gross final energy consumption, primary energy consumption, final energy consumption and GHG emissions in the Effort Sharing Decision sectors. A slightly larger set of indicators aggregated in the Eurostat database is related to the implementation of goal 7 of the 2030 Agenda—“Affordable and Clean Energy” [
22]. It consists of 8 indicators, partially overlapping with the target monitoring indicators 20-20-20 (i.e., primary energy consumption (1), final energy consumption (2), share of renewable energy in gross final energy consumption by sector (3), final energy consumption in households per capita (4), energy productivity (5), energy import dependency by products (6), GHG intensity of energy consumption population (7) and unable to keep home adequately warm by poverty status (8)).
Streimikiene and Šivickas in [
40] presented a framework of indicators for monitoring the implementation of the main EU directives and other policy documents on sustainable energy development. It was pointed out that the framework of indicators related to the EU priority areas and objectives toward achieving the Sustainable Energy Development Goals shows the relationship between these indicators. A study by Unander [
41] presents the importance of using disaggregated energy indicators when assessing the development of energy consumption and environmental consequences. In turn, Kemmler and Spreng in [
42] presented a set of energy indicators for tracking sustainable development in developing countries. Bolcárová and Kološta in [
43] showed a proposal to create an aggregated indicator of sustainable development from the set of all indicators for the EU countries based on the PCA analysis. This indicator provides an overview of each of the EU-27 countries in terms of sustainable development. On the other hand, García-Álvarez et al. in [
44] presented a set of indicators of sustainable energy policy, which they grouped into three dimensions: security of energy supply, competitive energy market and environmental protection. Evans et al. [
45] presents the assessment of sustainable development indicators for renewable energy technologies which were assessed on the basis of several key sustainability indicators of energy. Ahmad and Tahar [
46] developed a model for assessing sustainability from technical, economic, social and environmental points of view, using a multi-perspective approach based on a hierarchical analytical process. Yu et al. [
47] identified 22 indicators which, in their opinion, affect the sustainability of renewable energy. These indicators cover the energy, economic, environmental, technological and social dimensions. Cîrstea et al. [
48] developed a comprehensive renewable energy sustainability index that covers the economic, environmental and social dimensions. This index was used to evaluate the sustainability of energy sources in Europe.
The presented studies found that sustainable energy indicators are an important and current topic related to the concept of sustainable development. Indicator-based methods are oftentimes used for research and analysis of various aspects of energy status. All the selected and most important indicators of sustainable energy and their literature sources are presented in
Table 1.
It can be seen that among these indicators, only some refer to population size and none directly to the GDP. In fact, both factors have a significant impact on the total energy demand, which results from the demand generated by the population size and economic status of a given country. Economic opportunities and demographic potential also undoubtedly influence the shaping of the energy policy. Also, these analyses often fail to take into account the division into energy from renewable and non-renewable sources. Instead, only the indicator of renewable energy use or share in its total use is considered.
Various research methods are also shown in studies on sustainable energy development, including multivariate statistical methods and clustering or rank-based methods. A study by [
63] uses the Ward’s clustering methods to distinguish groups of countries in terms of the energy potential of RES in the so-called “New” EU Countries. The analysis concerned the comparison of 2004 and 2016. Taxonomic methods were also used in a study by [
64]. Here, the effectiveness of the use of crop residues in the production of renewable energy was examined based on agricultural regions in Ukraine. A study by [
65] uses the
k-means method to analyze the similarity of the EU-28 countries in terms of the structure and volume of renewable energy production. In turn, a study by [
66] uses the method of the Wrocław taxonomy to analyze the level of wind energy development.
The literature review shows that the studies failed to refer to the impact of the economic and demographic potential on the assessment of sustainable energy development of the EU-27 countries, which were not divided into similar groups. Moreover, the presented studies did not use the TOPSIS method, nor artificial neural networks, to identify groups of similar countries. Therefore, it can be assumed that the approach to the assessment of the level of sustainable energy development of the EU-27 countries and the analysis of their similarity presented in this paper, by taking into account their economic and demographic potential, can be considered pioneer and well-grounded. The methods used for this analysis should also be regarded as appropriate since they give the opportunity to acquire new knowledge in this field.
Based on the literature review, a set of indicators was selected to assess the level of sustainable energy development and to analyze the similarity of the EU-27 countries. It includes some of the indicators used in the 3E model and an indicator related to the social dimension. The inclusion of this indicator is also new when compared to the measures used so far. In order to take into account the diversity of the EU-27 countries, these indicators were compared to the value of GDP and population size of each country, which is undoubtedly also a novel approach in this type of analysis. Moreover, it is claimed that in order for the assessment of sustainable energy development of individual countries to be credible, parameters related to the most important areas of its activity should be used. The results of such a comprehensive analysis allow for this assessment to be made from various points of view, which is fully justified. Applying the concept of sustainable development to the energy sector is a difficult and complex task that requires an unconventional approach.
3. Materials and Methods
3.1. Area of Research
Since 2020, the EU has brought together 27 Member States (
Figure 3) and covers the area of 4.4 million km2 on the European continent. It is inhabited by about 437 million residents. In addition to many of the EU’s objectives, its task is also to promote sustainable development.
It is undisputable that the EU is the only economic and political union of this type, bringing together as many as 27 countries with diverse energy structure, employment, economic and social levels. The idea of creating the EU dates back to the period after the Second World War. The first steps in the integration of European countries consisted in improving economic cooperation in line with the principle that countries which trade with each other benefit from it and avoid conflicts. The result of this assumption was the creation in 1958 of the European Economic Community (EEC). Initially, economic cooperation covered six countries: Belgium, France, the Netherlands, Luxembourg, Germany, and Italy. Since then, 22 more countries have joined the EU and a huge single market for labor, capital and goods (the so-called internal market) has been created, which is constantly developing its potential. It should also be noted that on January 31st, 2020, Great Britain was the first country to leave the EU.
3.2. Data
In order to perform the analysis of the similarity of the EU-27 countries in terms of sustainable energy, data from the Eurostat database for 2018 (the latest available data) was used [
27]. The analysis was conducted for EU-27 countries that are currently the EU Member States (excluding the United Kingdom).
The starting point for this analysis was the selection of appropriate indicators. On the basis of the literature review, as mentioned earlier, a set of indicators in the field of sustainable energy was selected in the energy, environmental, economic (according to the 3E model) [
28] and social dimensions. As a result, a modified 3E + S model was created.
The indicators selected for the analysis had to be characterized by:
- -
postulate of adequacy to the objectives of the policy of sustainable energy development in the energy, environmental, economic, and social dimensions,
- -
simplicity in construction and ease of result interpretation,
- -
comparability at an international level,
- -
availability and quality of data, which is continuously documented and updated.
Each country was finally characterized by 13 diagnostic variables. These variables included: total primary energy supply, energy consumption, installed electricity capacity, energy efficiency, energy taxes, electricity prices by type of user, gross domestic expenditure on R&D by sector, greenhouse gas emissions from the energy sector, air pollution, population unable to keep home adequately warm by poverty status (
Table 2). The variables such as total primary energy supply, energy consumption, installed electricity capacity were considered separately as indicators compared to energy related to non-renewable sources and to alternative sources (renewable and nuclear). This is a new approach to the ratio analysis, as it allows for the determination of how much energy from non-renewable sources and alternative sources is in the total primary energy supply or final consumption. The R&D indicator is important not only from the point of view of accelerating economic growth, but also “greening the economy”, because in addition to increasing the innovation and competitiveness of the economy, it can support actions aimed at improving the efficiency of resource use in the economy or reducing the negative impact of human activity on the environment. The “energy tax” indicator was also included in the analysis as this tax potentially allows, apart from the harmonization of internal markets, the achievement of environmental protection objectives. On the one hand, it enables the internalization of external costs related to energy consumption, and, on the other hand, it provides an opportunity to differentiate energy prices, leaning toward, for example, less polluting fuels.
So far, the research on the problem of the sustainable energy sector has not included the energy poverty indicator. From the point of view of the general concept of sustainable development, which includes the development of the energy sector, this indicator is extremely supreme. This is because energy poverty is a situation where a household or a person is unable to obtain basic energy services (lighting, heating, cooling, mobility, and electricity) ensuring a decent standard of living, due to the combination of low income, high energy expenditure and low energy efficiency in households [
68]. The result of this state of affairs is a significant deterioration in the living conditions of such people, which is not in line with the idea of the EU.
All data used in the study are taken from the Eurostat database [
27] and were additionally compared to the GDP of a EU-27 country and the number of its inhabitants. The unit of electricity prices by type of user (medium size house) was the price per kilowatt-hour in Euro (Euro per kWh). This made it possible to conduct research in three variants.
3.3. Methods
3.3.1. TOPSIS Method
The TOPSIS (Technique for Order Preference by Similarity to Ideal Solution) measure was utilized for the multivariate analysis, which consists in comparing the vector of multi-criteria decision making (evaluation) values for a given object with the positive and negative ideal solution vectors. The positive ideal solution vector is a vector of the best values selected from the set of values available for each of the indicators in the entire set of examined objects. Analogically, the negative ideal solution vector is a vector of the worst values. In order to be able to evaluate a given object (EU country) and compare it with others, the distance in the Euclidean distance between the value vector determined for a given object and positive and negative ideal vectors should be measured. The most adequate object is the one for which its value vector shows the shortest distance from the positive ideal vector and the greatest distance from the negative ideal vector [
36,
69].
Therefore, the TOPSIS method aims at determining the distance of studied objects from the positive ideal (pattern) and negative ideal (anti-pattern) solutions. The final result of such analysis is a synthetic index creating a ranking of studied objects. The most adequate object is the one for which its value vector shows the shortest distance from the positive ideal vector and the greatest distance from the negative ideal vector.
The algorithm of TOPSIS is as follows:
The values of the TOPSIS measure fall within the <0–1> range. The higher the value of the synthetic measure, the higher the position of the object in the ranking. The synthetic indicator calculated for each country orders the units linearly and allows for classification only from the highest to the lowest level.
Since the classic TOPSIS method does not use a detailed classification of objects, the authors used two parameters of the taxonomic measure to classify the EU-27 countries in terms of their sustainable energy development, namely: arithmetic mean and standard deviation. In order to assess the level of sustainable development of the EU-27 countries in terms of sustainable energy development, the following class ranges were distinguished:
Class II—average high level:
Class III—average low level:
Class IV—low level:
where:
is the average value of
Pi and
is the standard deviation of
Pi.
3.3.2. The Kohonen Artificial Neural Networks
The Kohonen neural network (a self-organizing map (SOM)), consists of input layers and output layers (
Figure 4). It has no hidden layer (as other neural networks do). The model of this network, shown in
Figure 4, consists of 3 topological map nodes arranged in 3 rows and 3 columns. The input layer of the network is formed by the number of N input neurons. The SOM layer is a two-dimensional network where each output neuron is connected to all input neurons, but the output neurons are not connected to each other. Both input and output neurons have their own weight and a unique coordinate. The presented model (
Figure 4) shows 9 connections with each input neuron. The output neuron can only update its weight according to the input vector that feeds it [
70,
71,
72,
73,
74,
75,
76,
77].
The general procedure of using neural networks to group objects according to their similarity, defined by features, consists of the following stages [
77,
79]:
The size of the topological map was calculated as follows:
where:
c is the number of clusters,
n is the number of EU countries.
Initiate vector weights of all neurons in the network.
Randomly select the input vector from the initialized input vector weights and place it in the Kohonen network
Repeat step 3 for all neurons.
Determinate the Euclidean distance in order determinate similarity between the input vector and the weight vector of neurons according the Euclidean distance based on the following formula:
where:
I is the current input vector,
W is the weight vector of neurons and
n is the number of weights.
Find the overall Best Matching Unit, i.e., the node with the smallest Euclidean distance from all calculated ones
Determinate the radius of the neighborhood of the best matching unit from the following equation:
where:
t is the current iteration,
θ is the constant of time and
ω0 is the network radius.
Generally, the radius of the neighborhood of the best matching unit starts from a large value.
New weight value of a given neuron is computed iteratively based on the following formula (in the iteration process):
where:
(
t) is the distance from best matching unit,
L(
t) is the rate of learning of the current iteration
t.
The distance from best matching unit can be calculated from the following equation:
where:
L0 is the initial learning rate.
The rate of learning of the current iteration
t can be calculated from the following equation:
Customize all neurons in Kohonen network found within the radius of the best matching unit. The closer the distance between all neurons and the best matching unit is, the more the weight of the node is altered (according Equation (14))
Steps from 2 to 7 are repeated until the optimized Kohonen Neural Network is obtained.
A well-trained Kohonen network creates a topological map reflecting the mutual position of studied objects (i.e., EU countries) on the basis of the input data. Similar objects, i.e., EU-27 countries, will consistently correspond to the same or neighboring neurons, and groups of the EU-27 countries will be represented on the topological map as adjacent cluster centers. Thus, individual groups of the EU-27 countries that are close to each other on the topological map will be considered similar, and groups that are far away on the topological map will be considered different.
4. Results
The main objective of the study was to assess the sustainable energy development of the EU-27 countries in 4 dimensions: energy, economic, environmental and social, with additional consideration of a given country’s GDP (economic potential) and population size (demographic potential), as well as the identification of similar countries in terms of their sustainable development energy profiles.
In the first stage, the multi-criteria indicator analysis was performed using the TOPSIS method. The results of this analysis are summarized in
Table 3 and
Figure 5. For all studied countries (objects), their distances from the ideal and non-ideal solutions were determined, including the values of the synthetic measure
Pi, based on which the ranking of these countries was created to assign them to one of four classes.
The results show that in the first group of countries with the highest value of the synthetic measure Pi, 2 countries (France and Sweden) were identified, and the best result was achieved by France. By contrast, the last place (27) was taken by Italy with a very low rate of only 0.414. This proves that in terms of the absolute values of studied indicators characterizing sustainable energy development, this process is most efficient in France, while in Italy, it is considered most difficult.
In order to perform a more thorough assessment of the adaptation of energy systems to the economy of sustainable development, further analyses were conducted, taking into account two additional factors, namely prosperity (GDP) and population. It was assumed that the analysis of the absolute value of the adopted indicators did not fully reflect the specificity of studied countries. For these cases, the analysis of similarity between countries was also made, dividing them into similar groups.
4.1. Results of the Assessment of Sustainable Energy Development of Countries in Relation to Their GDP Value and the Identification of Groups of Similar Countries
In the initial, extended variant of the study, the EU-27 countries were assessed in terms of their sustainable energy development, taking into account the value of a country’s GDP. Sustainable energy development is described by the set of 13 selected indicators presented in chapter 3. It was assumed that the value of GDP is still the best measure of the wealth of a country. As shown in certain studies [
80,
81], the value of GDP is an important factor influencing sustainable development, including the energy sector. Therefore, it is reasonable to evaluate the EU-27 countries in terms of the level development of sustainable energy, also including economic potential. Then, the groups of the EU-27 countries similar to each other in terms of profiles (created by the set of indicators) and sustainable energy development were identified. This analysis is crucial particularly from a cognitive perspective, because it shows the similarity between countries not in terms of sustainable energy development in general, but in terms of similarity characterized by individual values of indicators that make up the sustainable development profile.
The results of calculating the distance of all EU-27 countries from the negative and positive ideal solutions, the value of the synthetic measure
Pi and their classification are presented in
Table 4.
Figure 6 presents the ranking of the EU-27 countries in terms of sustainable energy development, taking into account the GDP of these countries based on the TOPSIS method.
Based on the calculations, it can be concluded that the high level of diversified energy development, including the GDP value, was reported for Sweden, Finland and Austria, and the low level for Poland, Estonia, Bulgaria and Cyprus. In other countries, the energy development was found to be at average high and average low levels.
Then, on the basis of the analysis (with the use of the Kohonen artificial neural network), the compositions of groups of similar countries were determined in terms of the sustainable energy sector profiles. The composition of the clusters of similar countries is presented in
Table 5. The distribution of UE-27 countries in these clusters is shown in
Figure 7.
Based on the results of analysis, it can be concluded that the number of clusters is diversified. The least numerous are clusters 2 and 4, which are formed by 4 similar EU-27 countries in terms of sustainable energy development profiles. Cluster 2 includes countries with high (Sweden, Finland, Austria) and average high (Portugal) levels of sustainable energy development, while cluster 4 comprises countries with a low level of this development (Poland, Estonia and Cyprus). Clusters 1 and 3 are made up by countries with both average high and average low levels (based on TOPSIS analysis), which, as mentioned above, is due to the multidimensional similarity, i.e., the profile of sustainable energy development of the EU-27 countries. The EU-27 countries (
Table 5) located in the same cluster are most similar to each other in terms of their sustainable energy development profile, and at the same time different from the countries in other clusters. On the other hand, EU-27 countries in the same cluster show the greatest similarity to each other when they are as close to each other as possible. It should be emphasized that countries are assigned to individual clusters on the basis of similarity in terms of the sustainable energy development profiles, characterized by the values of indicators defining this sector in the energy, economic, environmental and social dimensions. Nevertheless, it does not mean that a given cluster includes only countries with either the highest or the lowest values of these indicators, but those which are characterized by the greatest homogeneity of profiles, created by studied indicators. This proves their multidimensional similarity.
To sum up, it can be stated that it is possible to distinguish one cluster of similar countries with an unfavorable state of sustainable energy development, two clusters of similar countries with an average situation of this development, and one cluster with a high level of sustainable energy development. The largest internal differentiation was shown by countries from cluster 4, i.e., Bulgaria, Estonia Poland and Cyprus (
Table 5 and
Figure 7).
The profiles of sustainable energy development characterized by the normalized values of indicators versus the GDP of the countries included in the created groups are presented in
Figure 8. In order to show the similarity between the countries within one cluster and the differences with other countries in the remaining clusters, the uniform scale was maintained on the Y axis. In the case of normalized values, the value of a single indicator characterizing the sustainable energy development of a given EU-27 country ranges from 0 to 1, where the value of indicator 0 (it does not appear in the profile) is considered unfavorable and 1 is considered ideal.
4.2. Results of the Assessment of the Sustainable Energy Development of Countries in Relation to Population Size and the Identification of Groups of Similar Countries
The second, extended variant of the analysis concerning the assessment of the EU-27 countries in terms of their sustainable energy development involved the population size of these countries. The aim was to check what impact the number of inhabitants of these countries had on this assessment. Currently, the demographic factor is of great importance for the economic development of the EU. Citizens are direct participants to and user of the energy sector, as well as taxpayers. Also, they form a group at risk of energy poverty. In addition, they are exposed to the negative impact of the sector on the environment due to greenhouse gas and air pollutant emissions and climate change.
Table 6 shows the results of calculating the distance of all studied objects (EU countries) from the ideal and non-ideal solutions, the value of the synthetic
Pi measure as well as the position in the ranking and allocation to a specific group.
Figure 9 shows the ranking of the EU-27 energy development, taking into account population size (number of inhabitants).
Based on the conducted calculations, a high level of diversified energy development, including population size, was found in Sweden, Finland, Austria and France, and a low level in Cyprus and Estonia. In other countries, the energy development was reported to be at average high and average low levels.
In the further stage of the analysis, the compositions of clusters of similar countries were determined in terms of the profiles of the sustainable energy sector, taking into account population size (using the Kohonen network). The composition of the clusters of similar countries is presented in
Table 7, and their distribution in the created clusters based on the activation value is presented on the topological map in
Figure 10.
The profiles of sustainable energy development characterized by the normalized values of indicators versus the population size of studied countries included in the created clusters is shown in
Figure 11.
When analyzing the distribution of the EU-27 countries on the map (
Figure 10) in the created clusters, the greatest internal similarity in terms of the sustainable energy development profiles was shown for countries from cluster 3 (Spain, Luxembourg, Italy, Poland, Slovenia, Slovakia) and 4 (Bulgaria, Greece, Croatia, Latvia, Lithuania, Hungary, Malta, Portugal, and Romania). In cluster 3, including Slovenia and Slovakia, the level of sustainable development was assessed as average high, and in the remaining countries as average low, taking into account the population size of these countries. In cluster 4 (Romania, Hungary and Latvia), however, the level of sustainable development was assessed as average high, and, in the remaining countries, as average low, when compared to their population size.
An interesting similarity was reported in cluster 1, which includes countries with a high level (Sweden, Finland, France and Austria) and with an average low level (Belgium, Denmark, Germany) of sustainable development. However, when analyzing the profiles of these countries, it can be noticed that they are characterized by a significant similarity in terms of the total available energy from non-renewable sources and the use of energy from non-renewable sources per capita. Also, in terms of installed electricity capacity for alternative sources (renewable and nuclear), the level of energy poverty, expenditure on R&D, the amount of energy tax, as well as GHG and air pollutant emissions from the energy sector per capita, they were reported to reach similar values.
5. Discussion
As a result of the conducted research, the level of sustainable energy development of the EU countries was evaluated. This process was carried out using two independent tools: the TOPSIS method for the multi-criteria ranking analysis and the Kohonen artificial neural networks to identify groups of similar EU-27 countries. The studies were based on the set of 13 selected indicators, which, according to the authors, characterized the most accurate energy profile of individual EU countries. Additionally, the values of these indicators were compared to the GDP value and the number of inhabitants of individual countries. This made it possible to perform this assessment in a very broad scope, taking into account many factors that characterize the diversity of studied countries. It should be emphasized that so far, no such approach to this analysis has been presented in the literature for any group of countries.
Therefore, determining the similarity of the EU-27 countries in terms of sustainable energy development profiles, based on the set of 13 indicators and in relation to the GDP value of a country and its population size, is a new approach to this issue.
Based on the research results, it can be concluded that in terms of assessing the level of sustainable energy development of countries in relation to the GDP value and population size, a high level of development was found for Sweden, Finland and Austria. With regard to the population size, France was reported to have a high level of energy development.
In turn, the countries with a low level of energy development versus the GDP value and population size included Estonia and Cyprus. In addition to these countries, a low level, taking into account the country’s economic potential, was also reported for Poland and Bulgaria.
Denmark, Germany, Ireland, Spain, Lithuania, Luxembourg, Malta, Netherlands, and Portugal are countries where the energy sector was shown to be at an average high level, when considering the economic potential, and at an average low level, when considering the demographic potential.
Belgium, France, Hungary, Poland, Romania, Slovenia and Slovakia, in turn, were shown to rank better in the ranking when taking into account the demographic potential than in terms of their economic potential.
The EU-27 countries that show unfavorable features in terms of sustainable energy development based on the GDP value (Cyprus, Estonia, Poland and Bulgaria) are the so-called countries of the “new Union”, i.e., those that joined it in 2004 and later. The legacy of national energy practices in most of these countries to this day constitutes an obstacle to the development of a modern and sustainable energy sector, which depends on the economic potential.
In the second variant of the analysis, only Estonia and Cyprus were reported to show unfavorable features. In these countries, the negative influence of the demographic factor is visible, which causes unfavorable relations between the energy development of these countries and population size. This is visible in terms of high GHG and air pollutant emissions per capita, large amounts of available and used energy from non-renewable sources, low energy efficiency, the presence of an energy tax, and in Cyprus, also low expenditure on R&D.
The conducted research also allowed the authors to identify similar EU-27 countries in terms of sustainable energy development, characterized by the set of indicators related to the value of GDP and population. All calculations in this regard were performed on the normalized values of the adopted indicators.
Based on the results, it can be stated that there are groups of countries similar in terms of the sustainable energy development profiles in four dimensions (economic, energy, environmental and social). However, the similarity is not the same in terms of their economic and demographic potential. The more similar countries are, the less they differ in terms of the values of all indicators included in the analysis.
When considering the economic potential of the EU-27, characterized by the value of GDP, 4 groups of similar countries can be identified in terms of their sustainable energy development profile expressed by similar values of indicators of this development in relation to the GDP value. These groups include:
- -
Cluster 1: Belgium, Denmark, Germany, Ireland, Spain, France, Italy, Luxembourg, Malta, Netherlands;
- -
Cluster 2: Austria, Portugal, Finland, Sweden;
- -
Cluster 3: Czech Republic, Greece, Croatia, Latvia, Lithuania, Hungary, Romania, Slovenia, Slovakia;
- -
Cluster 4: Bulgaria, Estonia, Poland, Cyprus.
When taking into account the demographic potential of the EU-27 countries, their similarity in terms of the sustainable energy development profile slightly changes. The composition of clusters in which similar countries were found is as follows:
- -
Cluster 1: Belgium, Denmark, Germany, France, Austria, Finland, Sweden;
- -
Cluster 2: Czech Republic, Estonia, Ireland, Cyprus, Netherlands;
- -
Cluster 3: Spain, Luxembourg, Italy, Poland, Slovenia, Slovakia;
- -
Cluster 4: Bulgaria, Greece, Croatia, Latvia, Lithuania, Hungary, Malta, Portugal, Romania.
In general, it can be stated that a significant part of the EU countries is similar to each other in terms of sustainable energy development, both in terms of their economic and demographic potential. These are the countries that, in the first and second variant of the analysis, co-created the same clusters (along with other countries). The countries that show similarities in sustainable energy development in terms of economic and demographic potential include:
- -
Belgium, Denmark, Germany, France;
- -
Sweden, Finland, Portugal and Austria;
- -
Spain, Luxembourg, Italy;
- -
Cyprus, Estonia;
- -
Slovenia, Slovakia;
- -
Netherlands, Ireland
- -
Greece, Croatia, Latvia, Lithuania, Hungary, Romania.
Countries that in the first and second variant of the analysis showed similarities to completely different countries were Belgium, Poland, Malta and Portugal. In the following sections, the groups of countries that achieved the best and the worst results in assessing sustainable energy development in the EU-27 are discussed in more detail.
5.1. Why do Sweden, Finland and Austria Score Best in Terms of Sustainable Energy Development, Given Their Economic and Demographic Potential?
The research results indicate that based on the economic and demographic potential, three EU countries were found to be undoubted leaders in the field of sustainable energy development. These include Sweden, Finland and Austria. Therefore, a more detailed analysis is presented below.
Sweden is a clear leader in terms of sustainable energy development characterized by the adopted set of indicators among the EU-27 countries. The transition of Sweden’s energy system began in the 1970s. At that time, Sweden decided to make changes in the energy sector, not because of global warming or sustainable development (these issues were almost unknown at the time), but because of financial benefits and the global oil crisis. Back then, crude oil was the source of over 75% of its energy mix [
82]. Today, it is less than 20%, mainly due to the declining consumption of crude oil used to heat homes. The Swedish energy transition allowed for a significant reduction in the prices of electricity and heat, thanks to which Swedish citizens currently pay about 25% less for energy than, for example, the citizens of Croatia, Poland or Slovakia, while earning an average of 3 times more [
83]. The energy used in Sweden comes mainly from RES. This is due to the fact that Sweden has been investing huge resources in the search for alternative energy sources for several decades [
84]. At the same time, this country, among the EU-27 countries, allocates the largest funds for R&D in relation to the GDP (%) and then per capita. The smallest financial outlays in this regard as a percentage of the GDP and per capita are reported in Romania, which obviously is reflected in the development of the energy sector in this country in the field of alternative energy sources. Sweden is a country where in the whole of the EU-27, in terms of the GDP, the smallest amount of available energy comes from conventional sources. It ranks second in terms of available energy from alternative sources (renewable and nuclear energy). With regard to available energy per capita from conventional sources, it is reported to be the smallest in the EU-27 as a whole and the largest when alternative sources are concerned. However, the Swedish economy is one of the economies of high energy consumption. Due to the significant use of energy in this country in relation to the GDP, the situation is unfavorable for the use of energy from conventional and alternative sources. In terms of using energy from conventional sources, based on the GDP value, the leaders in the EU-27 are Ireland, Malta, Denmark and then Sweden, and, in the use of alternative energy, Latvia, Finland, Bulgaria, Croatia, Romania, and Estonia. When taking into account the per capita consumption in terms of energy consumption from conventional sources, the situation is not favorable for Sweden, which is among the 6 EU-27 countries, where this consumption is at the highest level (higher consumption is reported only in Luxembourg, Finland, Belgium, Netherlands, Austria). On the other hand, with regard to energy consumption from alternative sources per capita, it ranks second—only Finland has better results. In terms of energy technological potential in the form of installed capacities in relation to the GDP, including conventional energy, Belgium, Austria, France and Luxembourg rank higher than Sweden, and, in, terms of alternative energy, Bulgaria.
Sweden is a clear leader in the EU-27 in terms of the lowest GHG emissions from the energy sector in relation to the GDP value. Also, air pollutant emissions from the energy sector in Sweden are among the lowest in terms of the GDP among the EU-27 countries. Sweden’s position as a leader among the EU-27 countries in the field of sustainable energy development is also caused by legislative activities and taxation of what is energetically ineffective [
85]. The principle of punishing what is “dirty and uneconomical” was applied. Therefore, additional fees are paid for the combustion of fossil fuels, unassembled installations, NO
x and SO
2 emissions.
Moreover, Sweden has a long tradition of creating an ambitious environmental policy and early implementation of the carbon (energy) tax, which is the main instrument of climate policy (since 1991). The CO
2 tax in Sweden is the highest in the world (currently € 120/t CO
2e) and applies to transport, construction (heating), industry, and agriculture. This tax accounts for around 1.6% of Sweden’s GDP and is one of the lowest in the EU-27. In turn, the amount of this tax per capita of Sweden is around EUR 743 (data for 2018) and ranks seventh in the EU-27. Higher numbers per capita are reported only for Luxembourg, Denmark, Netherlands, Finland, Belgium, and Italy. The carbon tax, in combination with other instruments and measures, has helped to reduce CO
2 emissions by around 24% between 1990 and 2015 [
86] and has also slightly reduced energy consumption.
It should also be emphasized that few countries use more energy per capita than Sweden (only Luxembourg and Finland) and in relation to the GDP. Despite this, the country’s carbon dioxide emissions are low when compared to other countries. This is sure influenced by the energy sources used. According to data published by the International Energy Agency (IEA), the average Swedish citizen annually emits 4.25 tons of CO
2; into the atmosphere, while the average for the EU-27 is 6.91 tons, and for the USA 16.15 tons. Sweden has found a way, in the form of a carbon tax, to cut emissions, especially in those sectors that have to pay the full tax rate. At the same time, low emissions of harmful substances are accompanied by the country’s economic growth. As a result, the problem of energy poverty in Sweden is very small [
87]. Per 1 million Euro of GDP, there is 0.5 people who are not able to provide adequate heating of the house. The country’s population affected by it amounts to 2.3%. The situation is similar in Finland, where 0.4 people fall per EUR 1 million GDP (Austria and Luxembourg rank higher), and the percentage of the population affected by this problem is 1.7%, being one of the lowest in the EU-27 (it is better only in Austria—1.6%).
Apart from Sweden, Finland also achieves the highest level of sustainable energy development, taking into account the economic potential (GDP) and demographic potential (number of inhabitants). This country has developed a hybrid energy structure that allows for a high degree of diversification of primary energy sources. Four types of fuel have a share of over 15% in Finland’s energy balance: crude oil, renewable energy, nuclear energy, and hard coal [
88]. Finland is the third country in the EU (after Belgium and Sweden) in terms of total available energy from alternative energy sources per capita of the country, and the second—per 1 million Euro of GDP (after Latvia).
At the same time, Finland is one of the highest electricity consumers not only in Europe but also in the world. In terms of the share of renewable energy in the final consumption of energy from alternative sources, it is the leader in terms of its use per capita, and the runner-up in terms of the use per GDP (after Sweden). The country also uses a huge amount of energy per capita from non-renewable energy sources—3.35 tons of oil equivalent (TOE). In this respect, only Luxembourg is found to have a much worse result, where there is statically 5.9 tons of oil equivalent (TOE) per capita of energy from non-renewable sources. The electricity price in Finland is similar to the electricity price in Sweden. With regard to salaries, it is considered cheap since some of the energy comes from Finnish nuclear reactors, which means that it is perceived as a factor facilitating the economic development of the country, increasing the competitiveness of Finnish industry and employment security for Finnish workers [
89]. The number of energy poor inhabitants versus the country’s GDP is one of the three lowest in the EU-27—less than half of an energy poor inhabitant per 1 million GDP, and the percentage of the country’s population living in energy poverty is 1.7% (lower percentage is reported only in Austria—1.6%).
Total GHG emissions from the energy sector in 2018 amounted to over 36.4 million tons of carbon dioxide equivalent in Finland. Per one citizen of this country, there is 0.008 thousand tons of greenhouse gas emissions in CO2 equivalent, and per EUR 1 million GDP—0.18. Finland produces much less greenhouse gases from the energy sector per capita than Luxembourg, Estonia, Czechia, Netherlands, Poland, Germany, i.e., countries that largely base their energy system on conventional sources. Although Finland is one of the countries with the cleanest air, the amount of this emission from the energy sector per capita makes this country the fourth largest emitter in the EU-27 (only Estonia, Cyprus and Poland report worse). A more favorable situation can be noted when the amount of pollutants emitted is compared to the country’s GDP. In this respect, Finland is found to belong to the 8 EU-27 countries with the lowest emissions in relation to the GDP value.
Austria is also among the countries distinguished by sustainable energy development. In the 1970s, it began to shift its energy sector toward hydropower, biomass and geothermal energy, replacing coal and nuclear power plants with them. Currently, the share of oil and gas in primary energy consumption in this country is 7% and 5%, respectively, while the share of coal does not even reach 1%. Renewable energy plays an important role in Austria in reducing the country’s dependence on imported fossil fuels and helping to reduce GHG emissions [
90].
Austrian energy is mainly based on hydropower. Hydroelectric power plants are responsible for the production of over three-quarters (76.5%) of clean electricity used in this country. Although it is a relatively small country, Austria is the fourth largest producer of hydropower in Europe. The installed electricity capacity per capita is in the forefront in terms of size among the EU-27 countries (only Sweden and Luxembourg rank higher). When taking into account the country’s GDP, the results are less favorable. On the other hand, the ratio of installed capacity for non-renewable sources in relation to the GDP is reported to be favorable—it is one of the smallest in the EU-27.
Despite its small size, Austria’s energy demand is quite high in relation to the GDP and population size. Energy efficiency versus the GDP is one of the lowest in the EU-27, but when taking into account the number of citizens—this ratio is slightly less favorable. Austria is considered to achieve very good rates of energy use from alternative sources per capita (4th result in the EU, after Finland, Sweden, Latvia). The situation looks slightly less negative in the case of using energy from conventional sources—this ratio is quite high.
The level of greenhouse gas emissions versus the GDP in Austria is one of the lowest in the EU, but when considering the number of citizens, this result is slightly worse. In terms of air pollutant emissions from the energy sector, Austria ranks in the half rate of the EU countries, both in terms of emissions compared to the GDP and the number of citizens.
An important element of Austrian energy policy is the financial support of scientific organizations. Austria has more than tripled its public funding for energy research, development and demonstration (R&D) since 2007. In terms of expenditure on the R&D sector, Austria ranks second in the EU in terms of the GDP (just after Sweden) and third in terms of these funds per capita (after Denmark and Sweden). The publicly funded R&D sector has a strict strategy, also in terms of improving the structure of the energy sector [
91]. When compared to other research areas, energy research occupies a special position due to its significant impact on environmental goals as well as social goals (e.g., energy availability).
The problem of energy poverty in Austria is the lowest in Europe in terms of the percentage of the country’s population (only Luxembourg has a better result).
5.2. Why Do Estonia and Cyprus Fail in Terms of Sustainable Energy Development Given Their Economic and Demographic Potential?
The research results show that the worst situation in terms of sustainable energy development, related to the GDP value and the number of inhabitants, was shown in Estonia and Cyprus. In order to find out the reasons for this, a more detailed analysis of the situation in these countries was carried out.
Estonia is one of the most energy-independent countries in the EU-27 [
92]. The main raw material used for energy production in this country is high-emission oil shale (shale, which is sedimentary rocks, produces not only energy but also oil and gas) [
93,
94]. In 2018, about 72% of the total energy and as much as 76% of electricity was produced from shale [
27]. Estonia also has large resources of biomass, being the second largest primary energy source. The share of energy from RES only in 2018 was found to be nearly 30%. Estonia’s 2020 target in this regard was 25%, which means that it was achieved with a surplus ahead of time. On the other hand, due to the dominant share of shale in energy production, the energy sector is also considered to be the largest source of GHG emissions in Estonia [
95]. In 2018, it was responsible for 87.15% of the total GHG emissions [
27] Despite the drastic reduction in greenhouse gas emissions, these levels remain high versus the 1990 levels. Estonia and Poland have one of the highest carbon dioxide emissions per capita in Europe [
96]. Additionally, the extraction of oil shale is a highly ineffective process, which puts Estonia in the second position in terms of energy consumption in the economy in Europe [
96].
Estonia’s GDP is the third lowest in the EU, with the population size among the 4 smallest countries [
97]. On the other hand, the shale industry generates approx. 4–5% of the GDP and provides around 15,000 jobs. [
98].
The transition to a low-carbon economy envisaged by Estonia will require the reorganization of the energy system. The modification of this system is at the heart of the Estonian Sustainable Energy Development Strategy, as set out in the National Energy and Climate Plan 2030. In order to achieve the EU’s long-term climate and energy goals, the Estonian government assumes that electricity production from oil shale must transit from direct combustion to the co-production of shale oil and electricity. It is estimated that the share of renewable energy in the gross final energy consumption in 2030 should be at the level of 42%. A significant increase in the share of RES in heating is also expected—up to about 80% (38.4% in 2020). Achieving these goals is associated with a significant reduction in the share of shale in the Estonian energy sector. This transition is mainly the result of the rising CO2 price in the EU Emissions Trading Systems (ETS).
Therefore, the main reasons for the unfavorable assessment of the sustainable development of the energy sector in Estonia include the high share of fossil fuels in the production of electricity and district heating, in particular bituminous shale with high conversion losses. It determines low energy efficiency, a high share of energy-intensive industries with a low share of industrial innovations and advanced technologies with a low level of the country’s GDP. This, in turn, contributes to very high GHG and air pollutant emissions.
Cyprus is the second country that show unfavorable results. The economy and population size of this country are one of the smallest in the EU, hence the unfavorable relationship between the indicators of sustainable development of the energy sector and the economic and demographic potential of this country.
The Cypriot energy system is currently dependent on imported petroleum products, while the share of renewable energy does not exceed 10%. According to the targets set by the EU, this share should increase to 13% in 2020 and 23% in 2030 [
99].
Cyprus has a very good geographical position, resulting in favorable weather conditions. The country has one of the largest exposures to solar radiation in Europe, which provides the island with excellent conditions for the development of photovoltaics and obtaining energy from biomass and wind. However, the barrier limiting the development of new technologies and the introduction of innovations in the energy sector are low expenditures on R&D, which are among the lowest in Europe (only Romania ranks lower).
Cyprus has no electricity or gas connections with other countries and thus has an isolated energy system. Therefore, it is the last European Member State in energy isolation. Efforts are now being made to break this isolation through the EuroAsia interconnection and the EastMed gas pipeline, following recent discoveries of natural gas deposits in the south of the Island [
100].
Over 90% of Cyprus’ total annual energy production comes from oil-fired thermal power plants. This results in high environmental pollution and an ineffective and costly energy system. Emission of air pollutants from the energy sector per capita is one of the highest in the EU (it is worse only in Estonia). The situation is similar in terms of emissions related to the GDP value of Cyprus (only Estonia, Poland and Bulgaria rank lower). On the other hand, the revenues from the energy tax in Cyprus as a percentage of the GDP and per capita are among the highest in the EU.
Another important issue is the problem of energy poverty. It affects almost 22% of the population (4th worst result in the EU) with 9 energy poor inhabitants per EUR 1 million of the GDP.
Under the current circumstances, Cyprus should introduce a new economic model in which the energy sector should play a greater role. However, it requires a lot of financial resources as well as structural changes and a different social approach.
6. Conclusions
Access to cheap energy is one of the main goals set by individual countries and groups of relinquished countries around the world. If this access also ensures energy independence, then this is considered to be an ideal situation. For many decades, this state was achieved by countries with large resources of energy resources (oil, hard coal, lignite, gas), in which the energy production process was mainly based on the combustion of these raw materials. However, such energy, present for many decades and based on conventional energy sources, has caused huge disturbances in the ecosystem. The greenhouse effect and a number of other unfavorable phenomena made economic plans increasingly take into account the environmental factor. It has also become obvious that further economic development based on energy produced from conventional sources may lead to enormous changes in the natural environment, including its destruction. The increase in social awareness of environmental protection along with the dynamic technical development has created a chance to change this trend. New technologies make it possible to obtain energy from other sources, especially renewable ones, and often by countries that did not have any conventional energy resources. At the same time, countries, the economy of which have been based on these raw materials, are increasingly forced (most often economically) to transform their energy systems. The concept of a sustainable development economy is the best example of this process. In this regard, it is also worth mentioning the idea of a circular economy or the idea of the European Green Deal introduced in the EU. These initiatives are met with increasing public approval and are in line with the global trend of limiting the destruction of the natural environment. However, their introduction must be well prepared in order to avoid an economic collapse.
The presented article fits into the area of the economic preparation of the EU-27 countries to such changes. The EU was the first organization in the world to take such decisive steps to implement the idea of sustainable development. Many EU-27 countries, with a very different economic level, cultural background, wealth, number of inhabitants, location and various energy structures, need to develop an energy policy adequate to this diversity. On the one hand, this policy should be very coherent and uniform, and on the other hand, it should take into account the differences between individual countries. The research, the results of which are presented in this paper, are in line with this topic. Their aim was to show that over the last several decades, many positive changes in the implementation of the idea of sustainable energy development have taken place in the EU countries.
Based on the diagnosis of the current state of this sector, with the use of a modern tool for multi-criteria analyses like the TOPSIS algorithm, the EU-27 countries were classified in terms of their sustainable energy development. The set of 13 indicators for this purpose were used, taking into account the energy, economic, environmental and social dimensions. The selection of these indicators was necessary for the assessment of the development level of the energy sector, which cannot be described only in terms of the volume of energy production from RES and its share in the gross final energy consumption. This indicator does not reflect the contemporary area significance of the idea of sustainable development in the energy sector.
Then, the values of these indicators were compared to the economic and demographic potential of individual EU-27 countries to make adequate classifications. These analyses showed how individual countries implement the idea of sustainable energy development.
In the next stage, the analysis of similarity between the EU-27 countries in terms of sustainable energy development was performed. The division of countries into similar groups was made on the basis of the adopted indicators versus the GDP value and the number of citizens of individual countries, with the use of the Kohonen artificial neural networks.
The results seem to be crucial in terms of the future cooperation between the EU-27 countries and the development of energy policy. This mainly concerns the method of financing energy transitions in individual countries. The effectiveness of this financing and its dedication to specific groups of similar countries that can jointly implement specific projects may decide about the success of these activities.
It is obvious that not all countries will be able to deal with the problems of energy transition on their own. On the other hand, joint, well-thought-out undertakings adequate to economic opportunities, traditions, geographic location, wealth and social awareness, as well as the demographic potential of individual countries, have a great chance of being successful.
In order to achieve the assumed goals, i.e., to reduce the negative impact of energy on the natural environment, ensure sustainable economic development of the region and limit the phenomenon of energy exclusion, it is necessary to act in solidarity and thoughtfulness based on knowledge, which this work has provided. In the entire transformation process, energy security should also be remembered as the basic task of the entire system.
The obtained results fully confirm the adopted theses.

 ,
, 


