Article

Response of Drone Electronic Systems to a Standardized Lightning Pulse

Department of Electrical and Computer Engineering Fundamentals, Rzeszow University of Technology, ul. W. Pola, 35-959 Rzeszów, Poland
*
Author to whom correspondence should be addressed.
Energies 2021, 14(20), 6547; https://doi.org/10.3390/en14206547
Submission received: 3 September 2021 / Revised: 7 October 2021 / Accepted: 8 October 2021 / Published: 12 October 2021

Abstract

:
This paper presents the results of experimental tests of the impulse response of selected, essential components of a drone. A standardized lightning pulse that is often used during immunity tests of electronic devices in the aviation industry was applied. A single-stroke voltage impulse generator, MIG0618SS, was capable of producing the desired pulses. The input voltage was injected into selected electronic circuits of the drone system and pulses were observed in different parts of the machine. This allowed us to build a model based on the transmittance of the circuits most exposed to lightning overvoltages. The conducted tests were supported by impedance measurements carried out with an LCR-8110G meter. The obtained results made possible the development of a preliminary drone simulation model, allowing us to determine the size of the disturbances arising in individual circuits during nearby lightning. A discussion of the influence of close lightning discharges on expected induced overvoltages in a drone electronics system is also conducted in the paper.

1. Introduction

The use of drone-type unmanned aerial vehicles is gaining more and more importance not only for military purposes, but also in civil applications such as, for example, cinematography, geodesy, security, and entertainment [1]. By enriching the drone’s equipment with various sensors, such as dust sensors, it is possible to use these devices to monitor air quality. The use of thermal imaging cameras makes it possible to search for people under the rubble of collapsed buildings. Properly adapted unmanned aerial vehicles are able to lift and transport relatively heavy loads, which enables the transport of parcels, stretching pilot ropes in the power industry or saving drowning people. There are many other application examples. The purpose for which this device is used determines the conditions under which it is operated [2]. In many cases, such as delivering parcels or saving drowning people, these machines will often work in poor weather conditions [3]. Apart from strong winds or frosts, an additional, real threat to drones is lightning [4]. Lightning is accompanied by a very high electric current that reaches tens to hundreds of kiloamperes at its peak [5,6]. Rapidly varying lightning currents generate the lightning electromagnetic impulse (LEMP), which is the source of induced overvoltages in electronic systems. In small-sized systems, the fast time-varying magnetic component of the electromagnetic field is particularly dangerous. The impact of this interaction can be reduced by shielding [7]. In the case of low-weight flying machines (e.g., drones), the use of additional shielding is problematic. Due to the additional weight, it is necessary to use larger motors, which results in higher energy consumption. This, in turn, either shortens the flight time or necessitates the installation of additional batteries. This in turn causes the unit to gain weight. For this reason, in practice, no shielding is used for small structures. These machines are therefore very susceptible to LEMP [8] disturbances.
In this paper, the issue of the threat of the magnetic component of the lightning electromagnetic impulse LEMP generated by close lightning discharges is discussed. It was decided to investigate the nature of pulse propagation in various circuits of small unmanned aerial vehicles (drones). For this purpose, an impulse generator was used to test the resistance of avionics to lightning effects. The MIG0618SS generator was set to produce a single-stroke voltage impulse with the waveshape of 6.4/69 µs for open circuit condition. This pulse waveshape is defined in the international standard for lightning protection DO-160, which is used in the aviation industry [9,10,11]. A series of tests were carried out on all the key circuits of the drone, these tests are described in detail in the following sections of this paper. This enabled us to determine the transmittance of individual circuits. Finally, the threat of drone electronic system malfunction was assessed and the most exposed circuits to LEMP were identified.

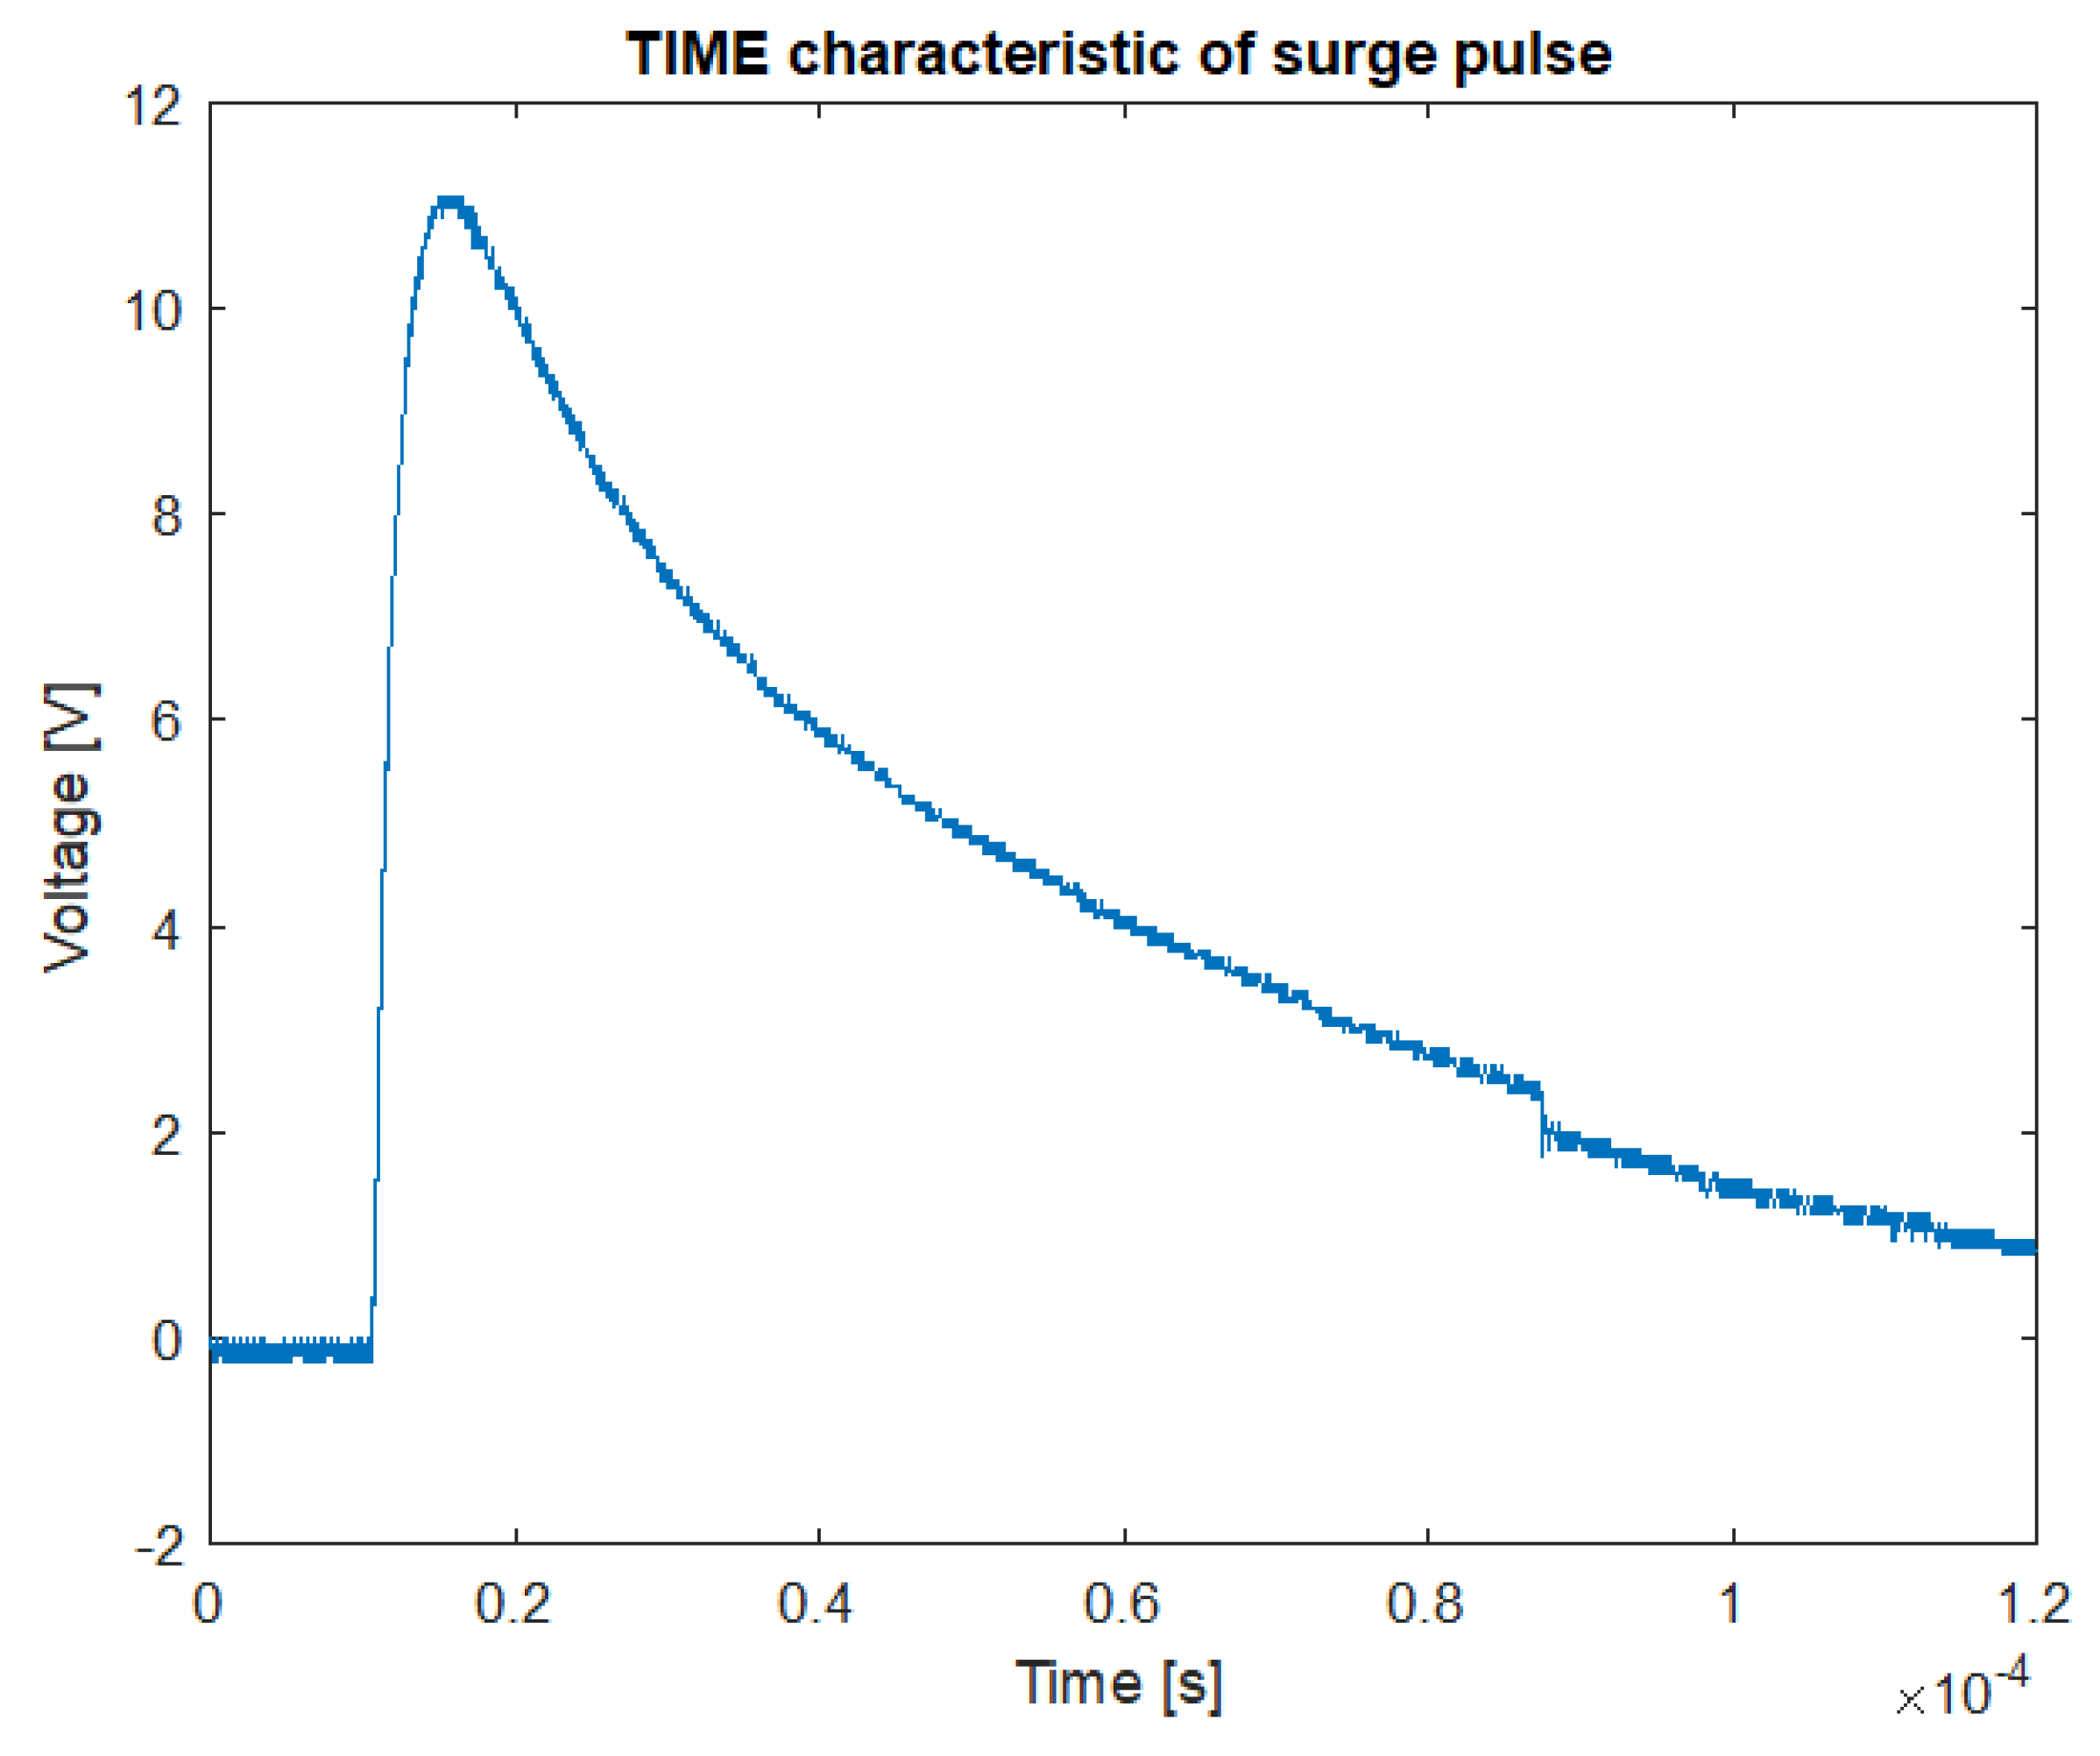
2. Lightning Electromagnetic Field

Lightning carries various threats, such as mechanical and thermal damages, as well as the destruction of electrical and electronic devices as a result of direct and indirect lightning overvoltage [12,13]. Direct lightning to a small flying object is unlikely. Moreover, due to the predicted total destruction of the unit, such an event can be ignored when analyzing the effects of lightning [14]. The most common threat to devices such as drones is the electromagnetic field from cloud-to-ground (CG) lightning. Damage to electronic systems caused by intracloud lightning cannot be excluded either. The mechanism of the occurrence of CG lightning has been described in detail in many publications (e.g., [15,16]). There are generally four types of these atmospheric discharges: downward negative, upward negative, downward positive and upward positive lightning. In most cases, lightning currents consist of several return strokes, that is, the first return stroke and the subsequent return strokes. According to published statistics, negative lightning constitutes up to 90% of all CG lightning, and its parameters are consistent with the probability distributions obtained from observations [15,16]. However, the 10–90% ratios for positive and negative lightning can be different [17]. The maximum values of the parameters characterizing the lightning current for specific lightning protection levels (LPL) were adopted in the PN-EN 62305 standard. It should be noted that the typical parameters of the so-called subsequent return stroke and continuing current are usually characterized by much lower values.
Civil aviation standards, such as RTCA/DO-160 and EUROCAE [9,18,19], contain recommendations for testing the resistance of avionics to lightning electromagnetic disturbances. These standards define the current and voltage pulse shapes that are applicable in aircraft electric and electronic parts tests [20].
The starting point for developing the waveforms that determine the equipment transient susceptibility level (ETSL) was to determine the normalized A (initial strike or first return stroke), B (intermediate current), C (continuing current) and D (restrike or the subsequent return stroke) components of the CG lightning current and the type H waveform for intracloud (IC) lightning [9,21,22].
When simulating indirect lightning effects, components B and C are often not considered because they do not cause significant overvoltages in avionics systems. The waveforms (WF) adopted for physical simulations of indirect effects approximate, to some extent, most of the phenomena observed in the aircraft installation [13,23]. For example, the WF1 current waveform 6.4/69 µs simulates the current induction effect occurring in closed wire loops as a result of penetrating deep into the airframe of the lightning magnetic field. This effect corresponds to the A component of the lightning current in Figure 1. Similarly, induced voltages in open loops are represented by the WF2 voltage waveform 0.1/6.4 µs, the shape of which corresponds to the nature of the component A derivative. Type WF4 of voltage waveform, shown in Figure 2, with a shape identical to the WF1 waveform, represents the effects of lightning current when the airframe resistance is mainly taken into account [21,24].
The processes of diffusion and redistribution of the electromagnetic field observed in the case of insufficient shielding of cables, e.g., when the airframe is made of carbon fiber-reinforced composite (CFC), are simulated with WF5A voltage/current waveforms 40/120 µs or WF5B current waveform 50/500 µs. The above-mentioned standardized voltage/current waveforms are used in immunity tests of avionics to isolate single lightning pulses. Based on RTCA/DO-160 and EUROCAE standards, it is also recommended to test the effects of multiple pulses. The first type of multiburst defined in aviation standard DO-160 corresponds to the IC lightning occurring near the aircraft, when the lightning channel is relatively short compared to the CG lightning. RTCA and EUROCAE define this waveform as 24 groups (bundles) of 20 pulses occurring at intervals of 10–200 μs. Each elementary pulse is a so-called H-waveform, with an amplitude of 10 kA. The second type of repetitive pulses corresponds to lightning with multiple return strokes. In this case, the RTCA and EUROCAE define a series of 24 pulses; the first D-type pulse corresponds to the first return stroke, and the remaining 23 pulses at twice the smaller peak values represent the subsequent return strokes occurring in the same lightning discharge. The time interval between individual pulses can be adjusted in the range of 10–200 ms. Those pulses with the appropriate time parameters are presented in Figure 3. They can be injected directly into the terminals of the tested device (pin injection method), or act on cable bundles using the phenomenon of induction, using a specially constructed coupling transformer (cable bundle induction method).
For simulation purposes, several mathematical models describing the lightning current and the charge density that is deposited along the channel have been proposed. These models can be divided into two groups: LCS (Lumped Current Source) and DCS (Distributed Current Source) models [25,26]. In LCS models, the current source is located at the channel base near the ground surface. It generates a current surge flowing upwards, neutralizing the charge distributed in the corona sheath during the leader stage. DCS models are characterized by the so-called “traveling current-source”. In this case, the current in the channel is generated as a result of the neutralization of the charge distributed in the lightning corona sheath. This process takes place successively from the ground towards the cloud. The current at the base of the lightning channel i(0, t) in the case of LCS and DCS models is often represented by a combination of Heidler approximation [10,27,28].
i 0 ( t ) = I 01 η 1 ( t τ 11 ) 1 + ( t τ 11 ) n 1 e ( t τ 21 ) + I 02 η 2 ( t τ 12 ) 1 + ( t τ 12 ) n 2 e ( t τ 22 )
η 1 = exp [ ( τ 11 τ 21 ) ( n 1 τ 21 τ 11 ) 1 n 1 ] , η 2 = exp [ ( τ 12 τ 22 ) ( n 2 τ 22 τ 21 ) 1 n 2 ]
where: τ11, τ12—front time constants, τ21, τ22—decay time constants, η1, η2—amplitude correction of I01 and I02, n1, n2—exponent (2…10).
The typical lightning subsequent return-stroke current can be described by Equation (1) with the parameters given in Table 1.

3. Main Components of Unmanned Aerial Vehicles

The design of drones may vary depending on where and for what purposes they are used. They can feature four or more motors (e.g., a quadrocopter is equipped with four motors, a hexacopter with six motors, and an octocopter with eight motors), different sizes and flying ranges. Drones can be equipped with cameras, various sensors and even weapons. A construction diagram of a typical drone is presented in Figure 4 [29,30].
The range of unmanned aerial vehicles depends on the density of the energy that can be accumulated and stored in their batteries. The size and weight of the battery in turn depends on the technology and materials from which it is made. For civil applications, lithium-ion (Li-Ion) or lithium-polymer (Li-PO) batteries are used to power drones. The supply voltage varies depending on the manufacturer and even the model and ranges from 3.7 V (most commonly found in small devices) to 15.2 V and over for large units. The energy density of these batteries ranges from 100 Wh/kg to 265 Wh/kg and more for their varieties (for example the Li-SOCl2 battery’s energy density is about 600 to 700 Wh/kg). Notably, all the drone components depicted in Figure 4 may be damaged during a storm with lightning discharges. Therefore, experimental tests and simulations that allow the determination of the resistance of these elements in difficult weather conditions are important.

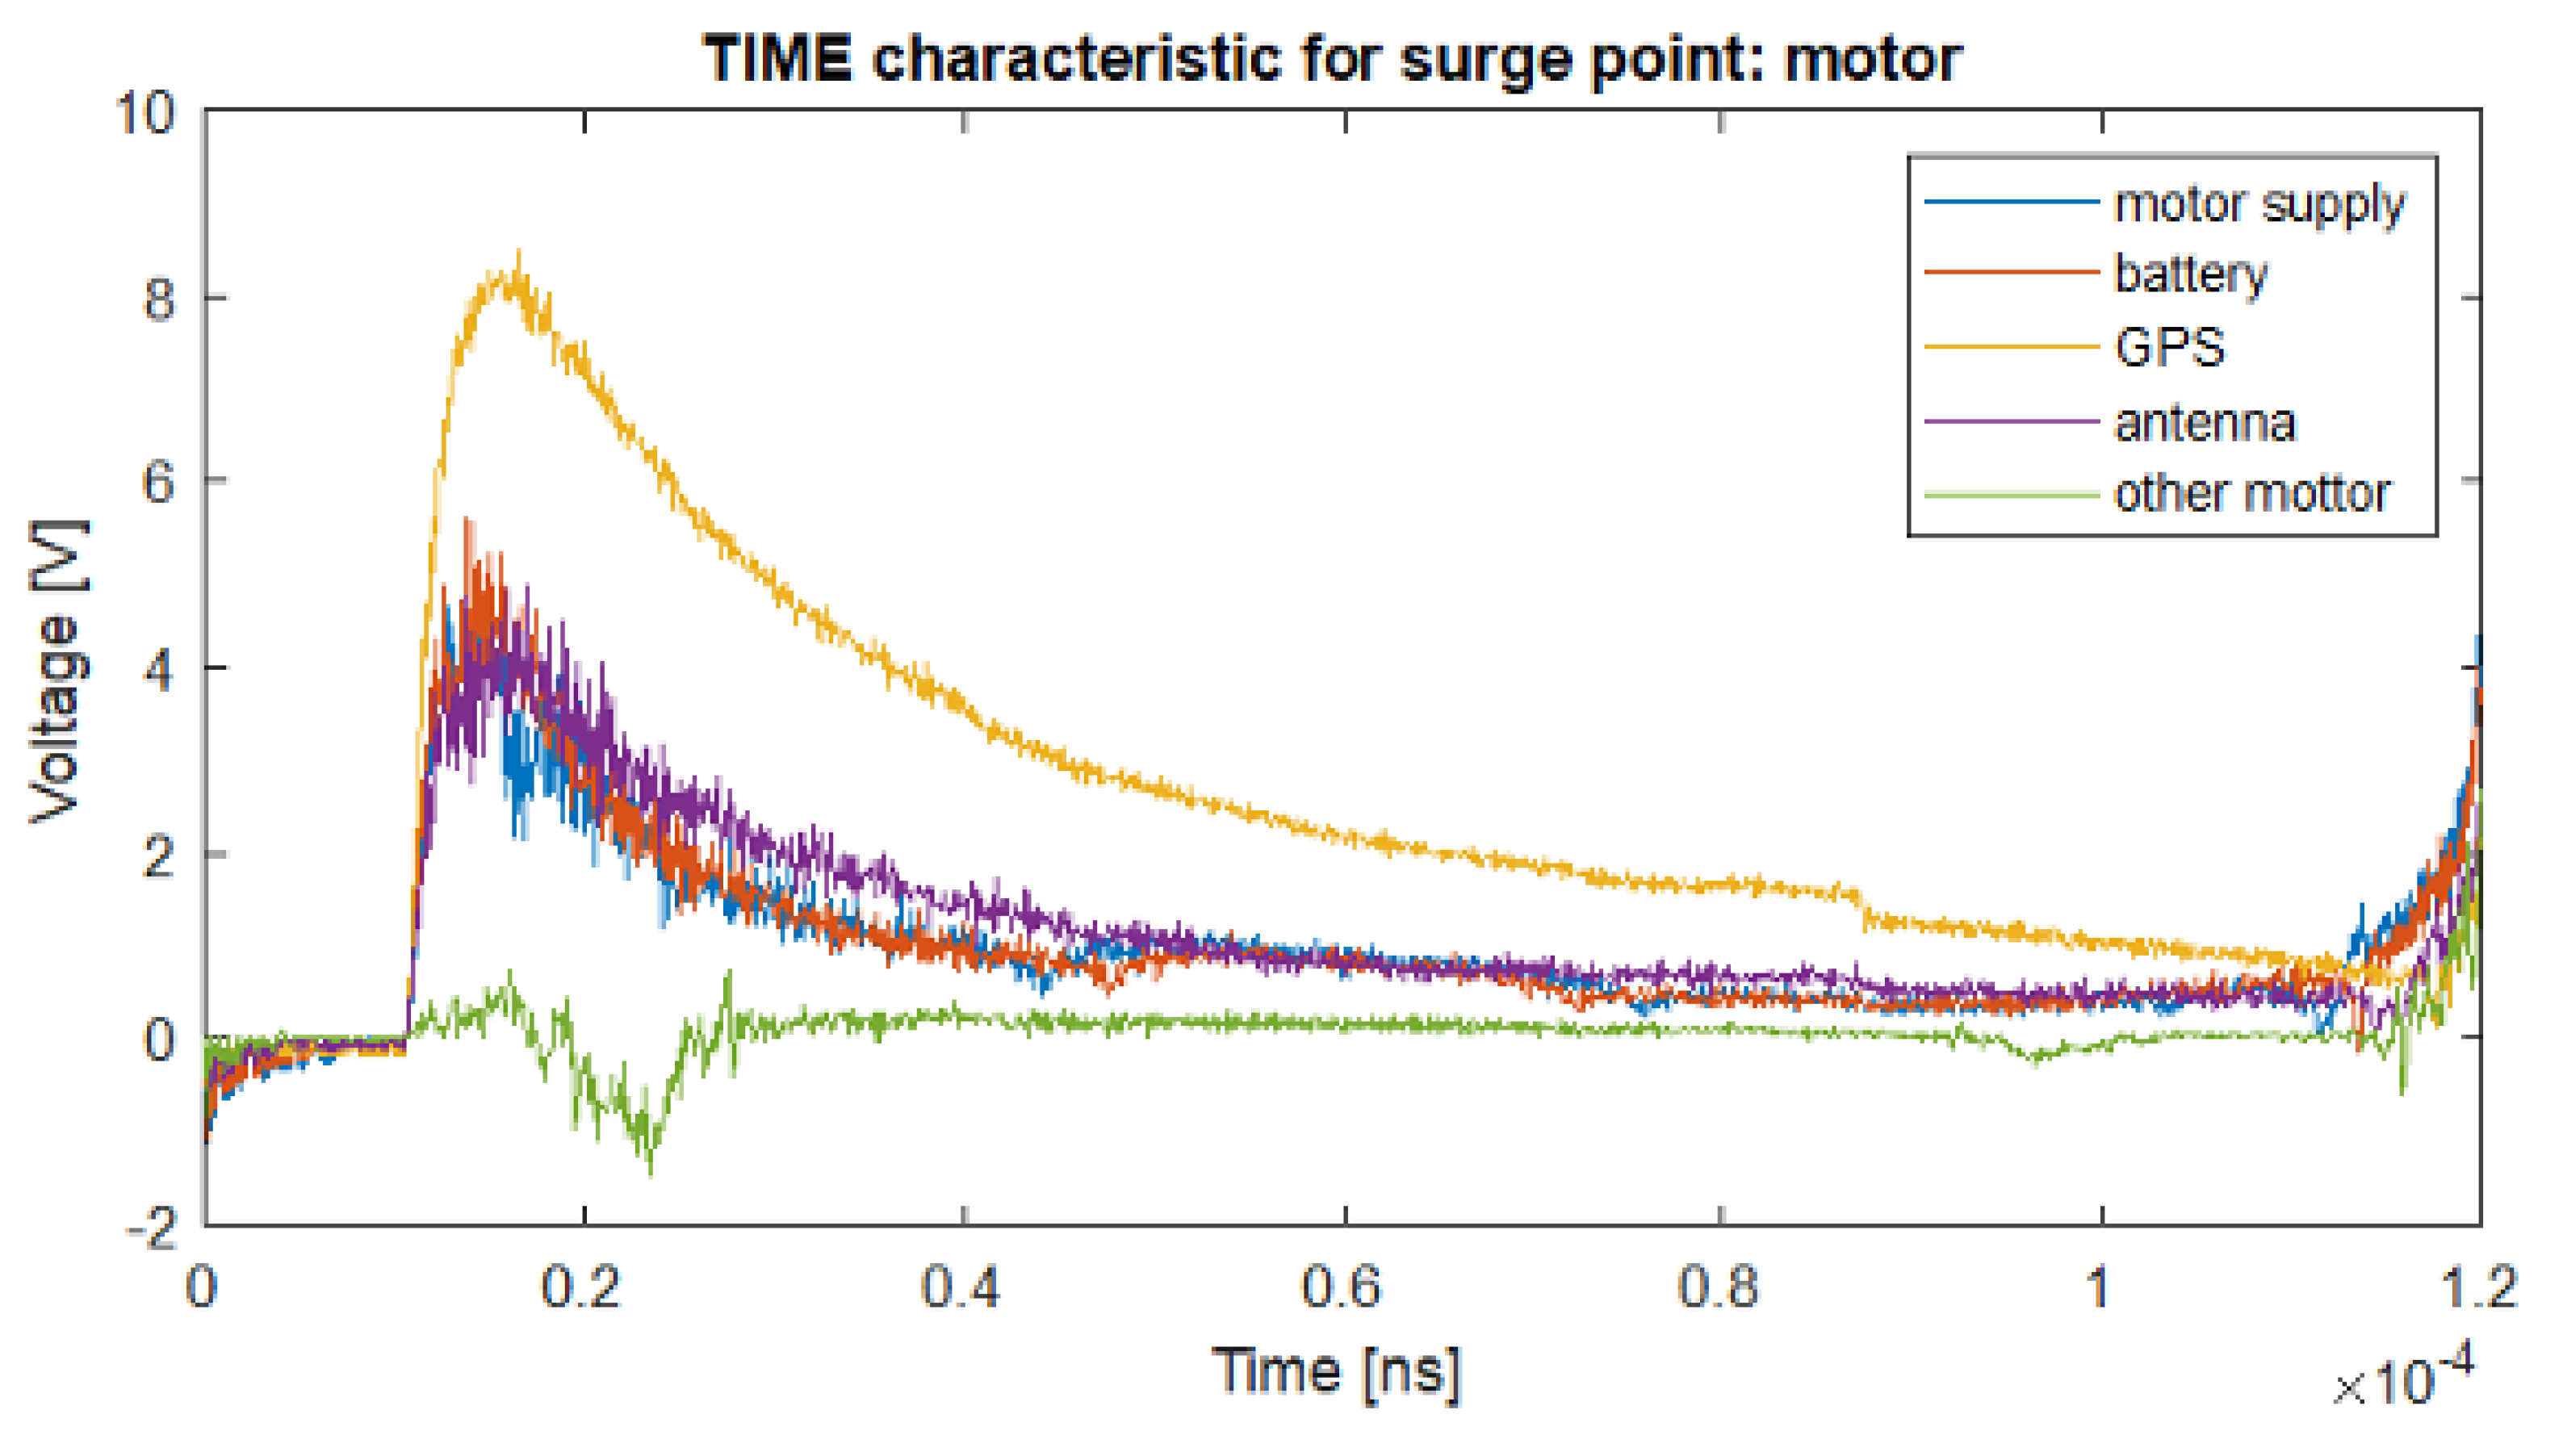
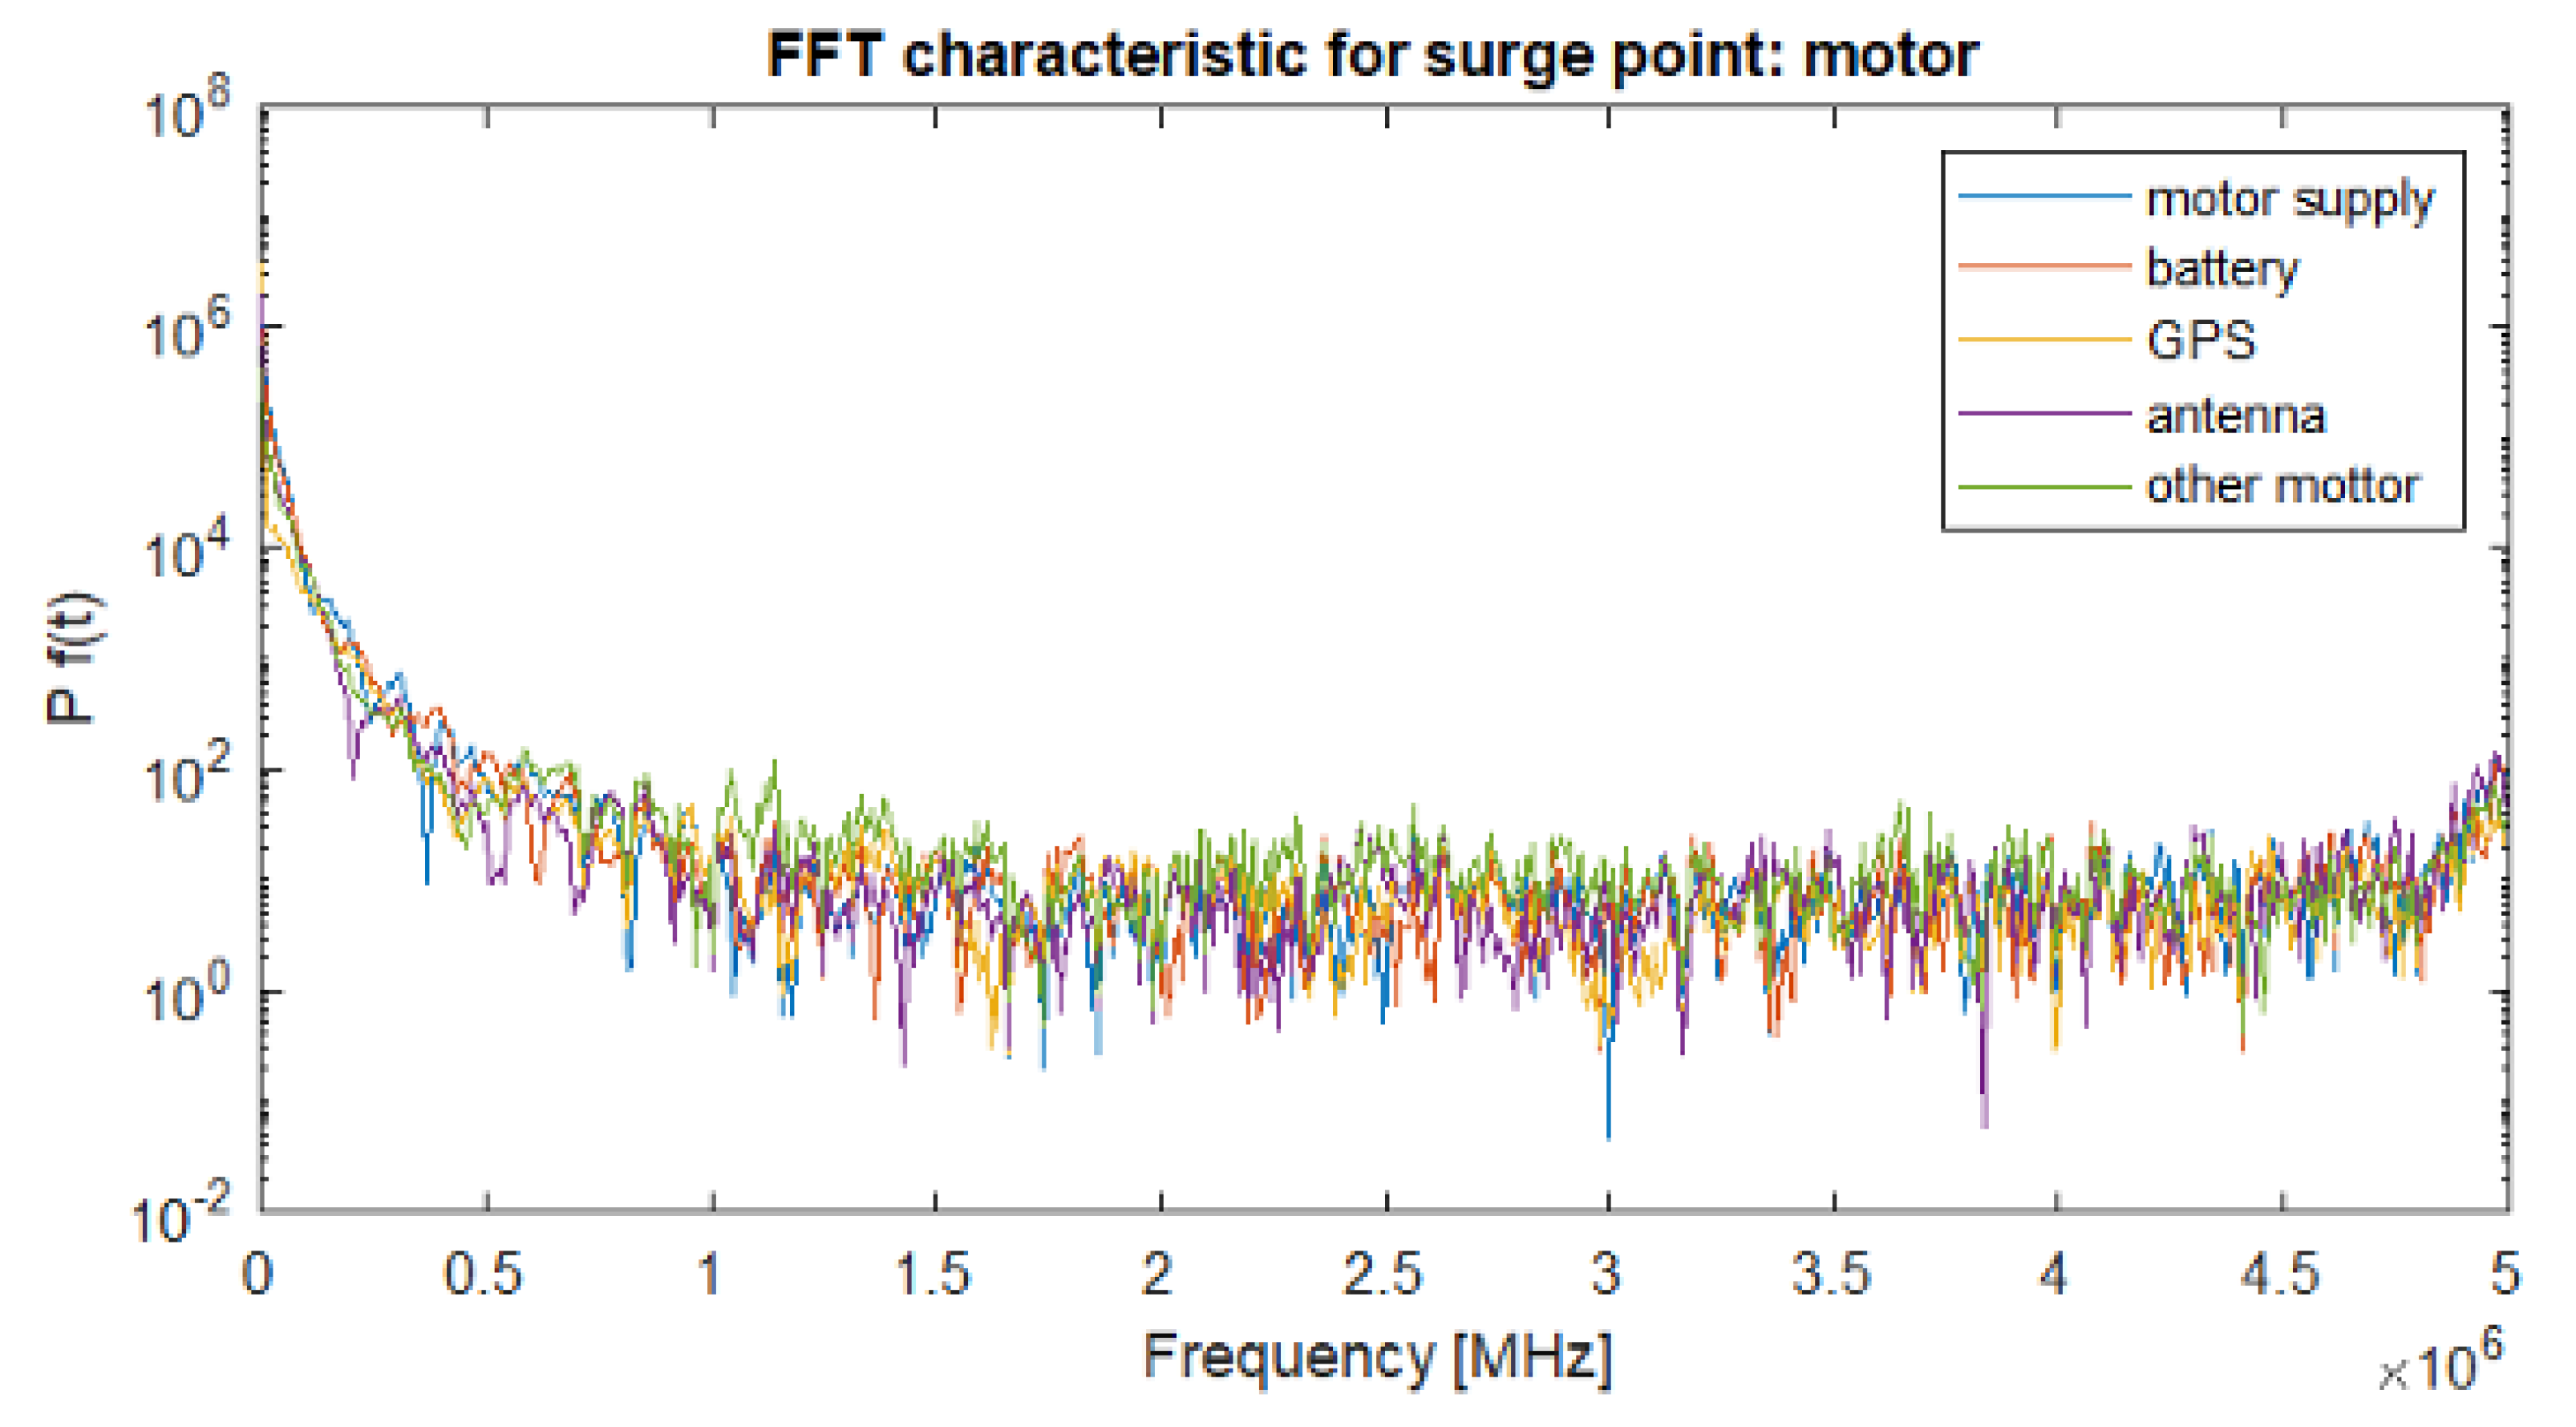
4. Response of Selected Drone Components to Standardized Lightning Pulses

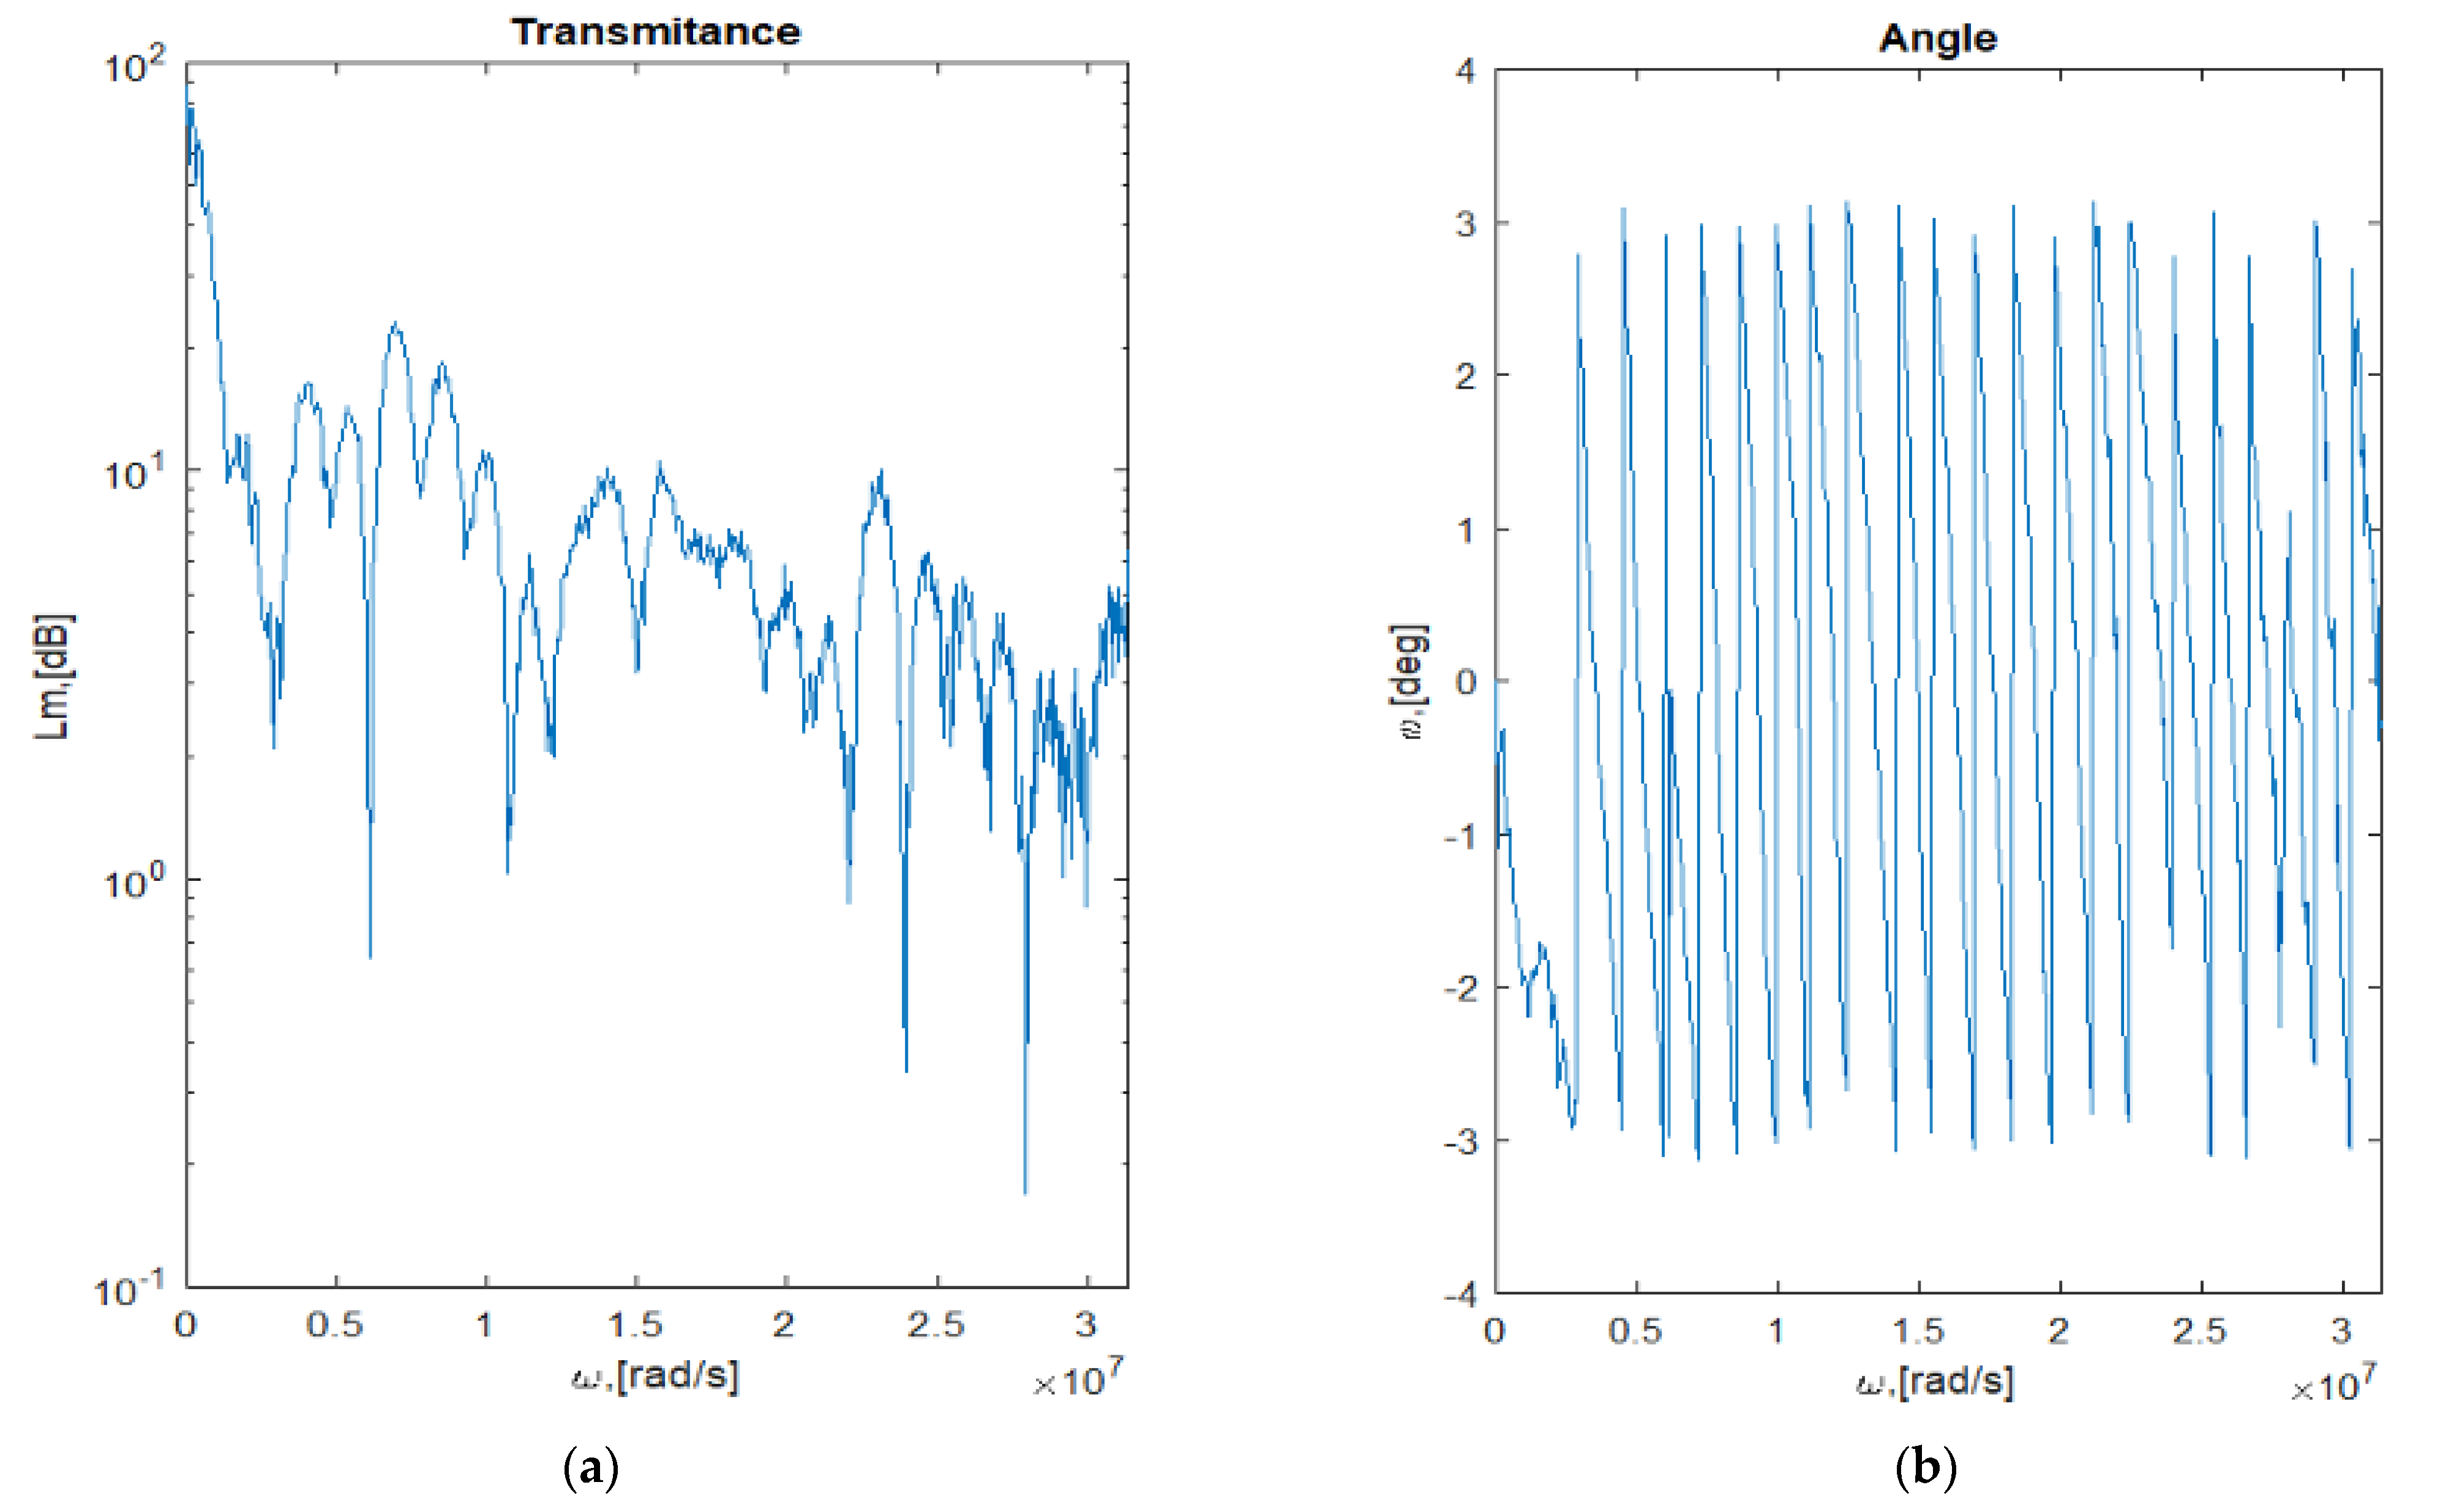
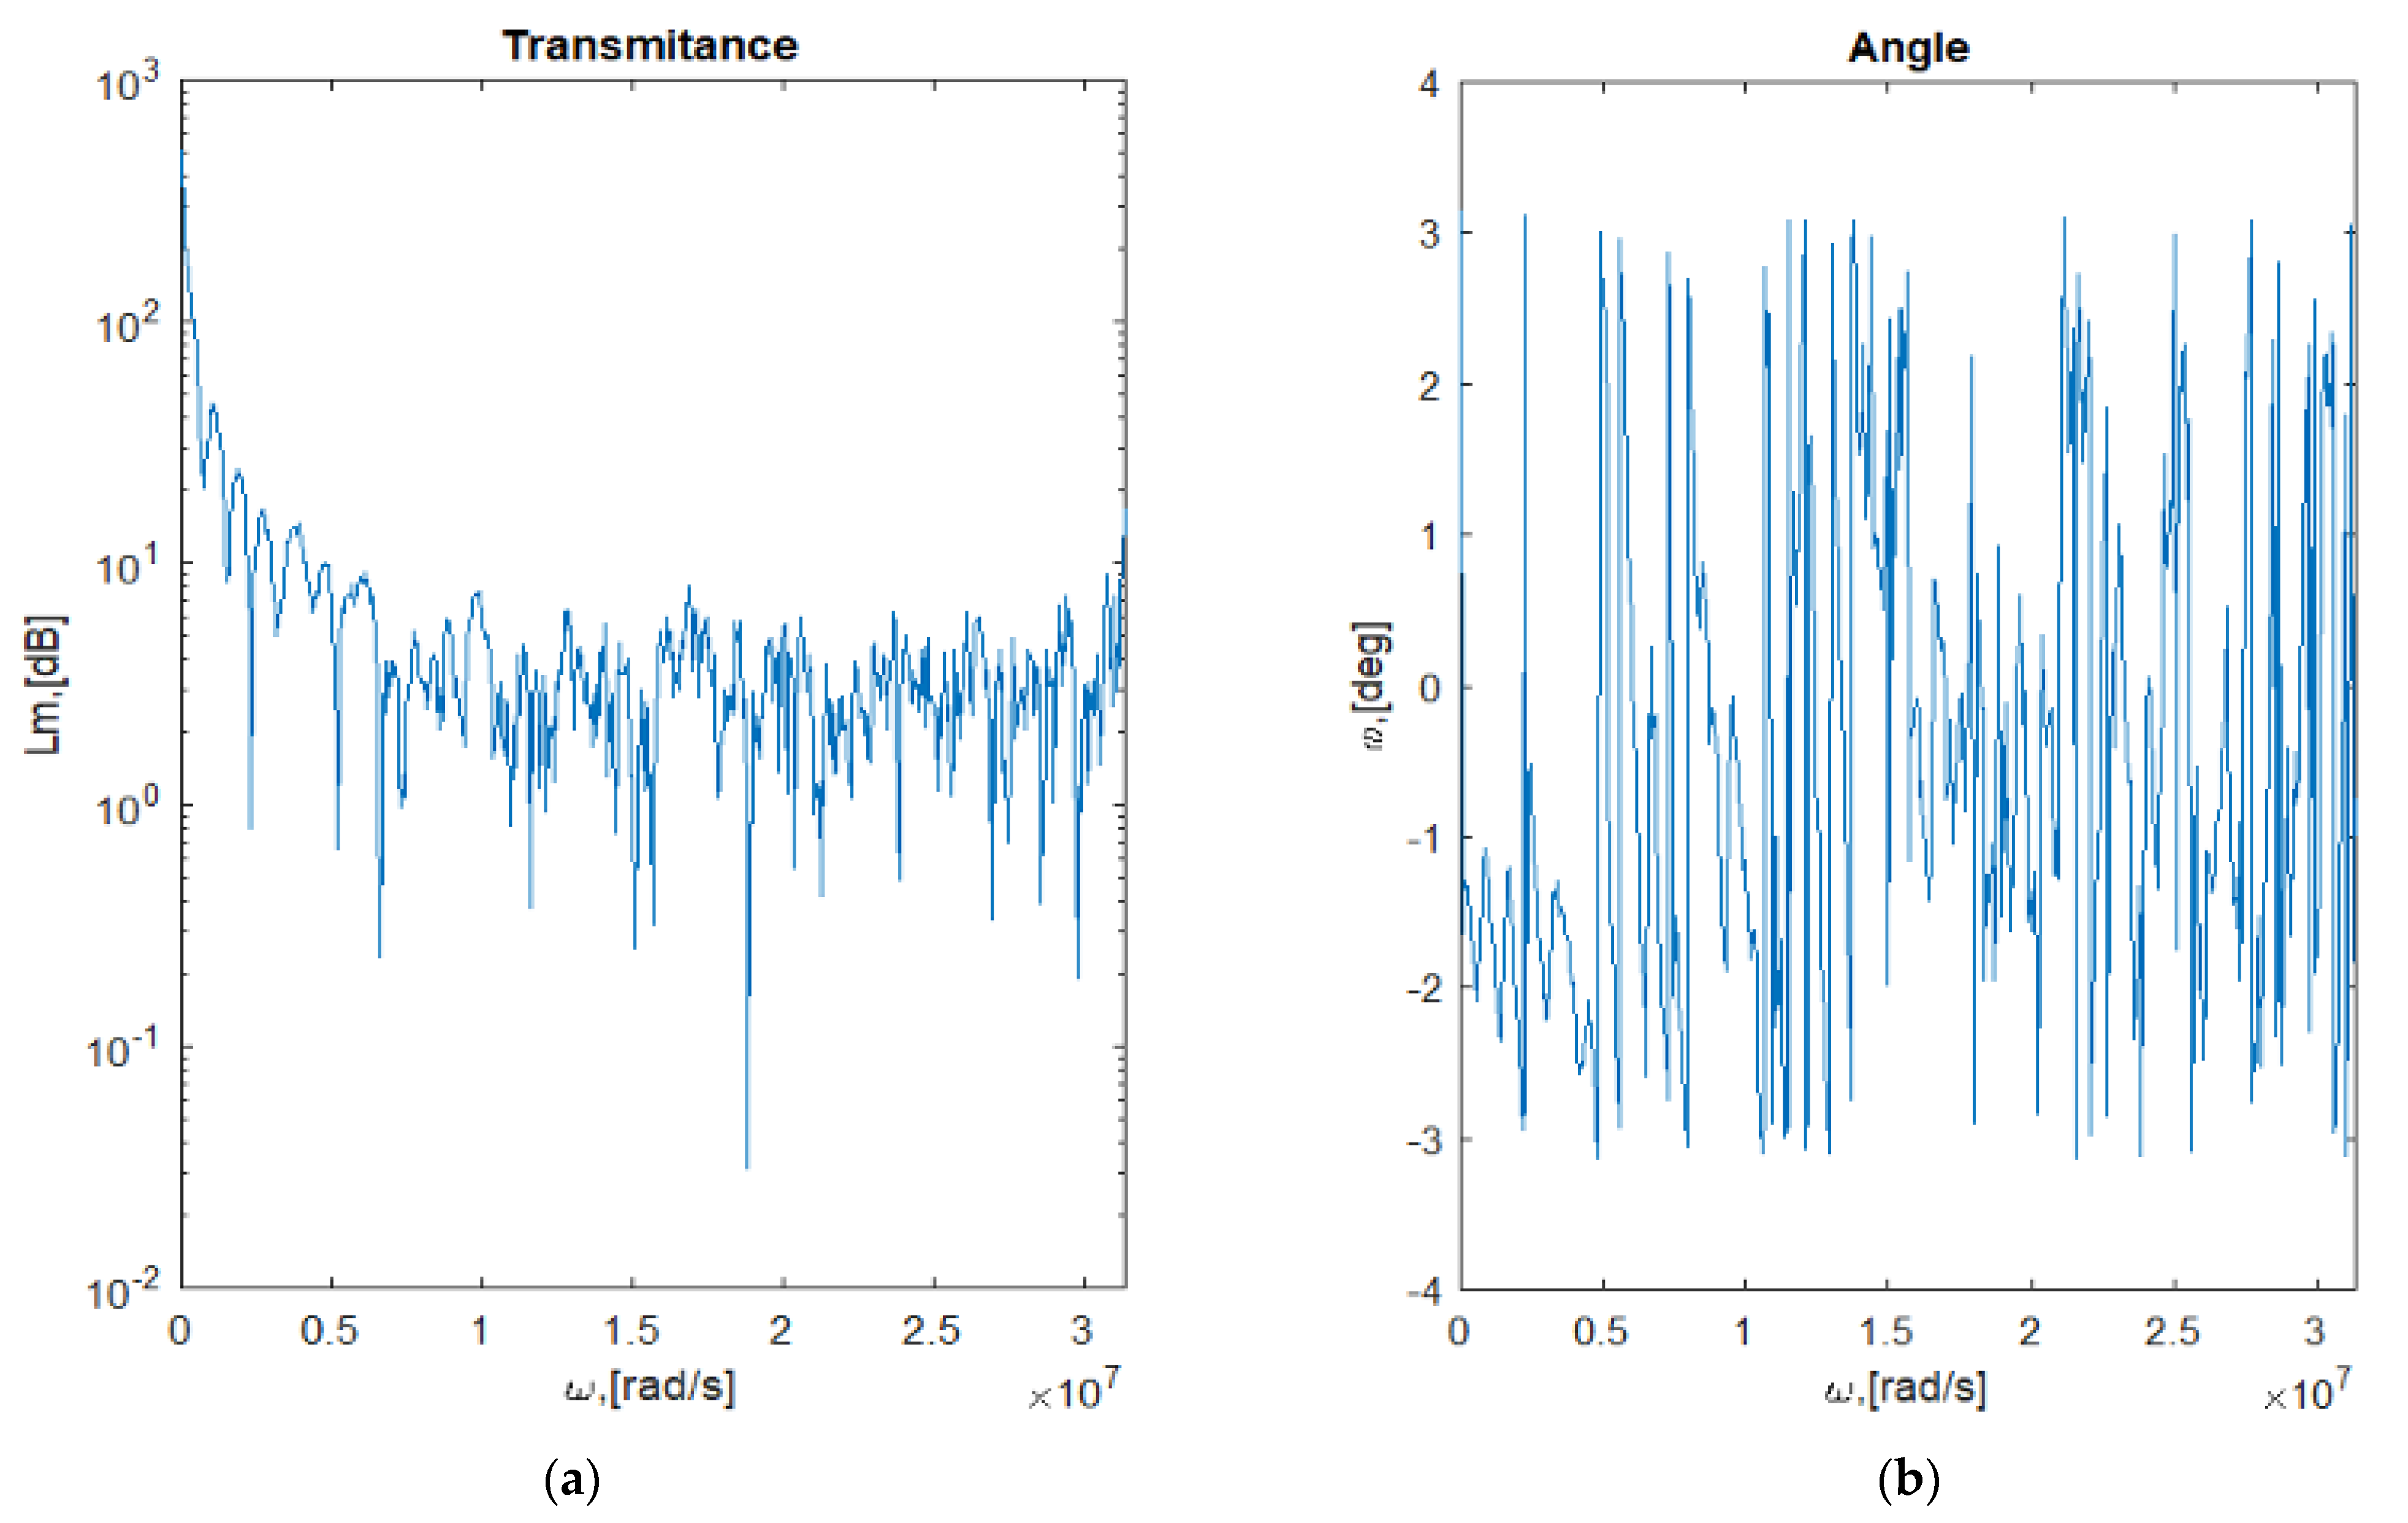
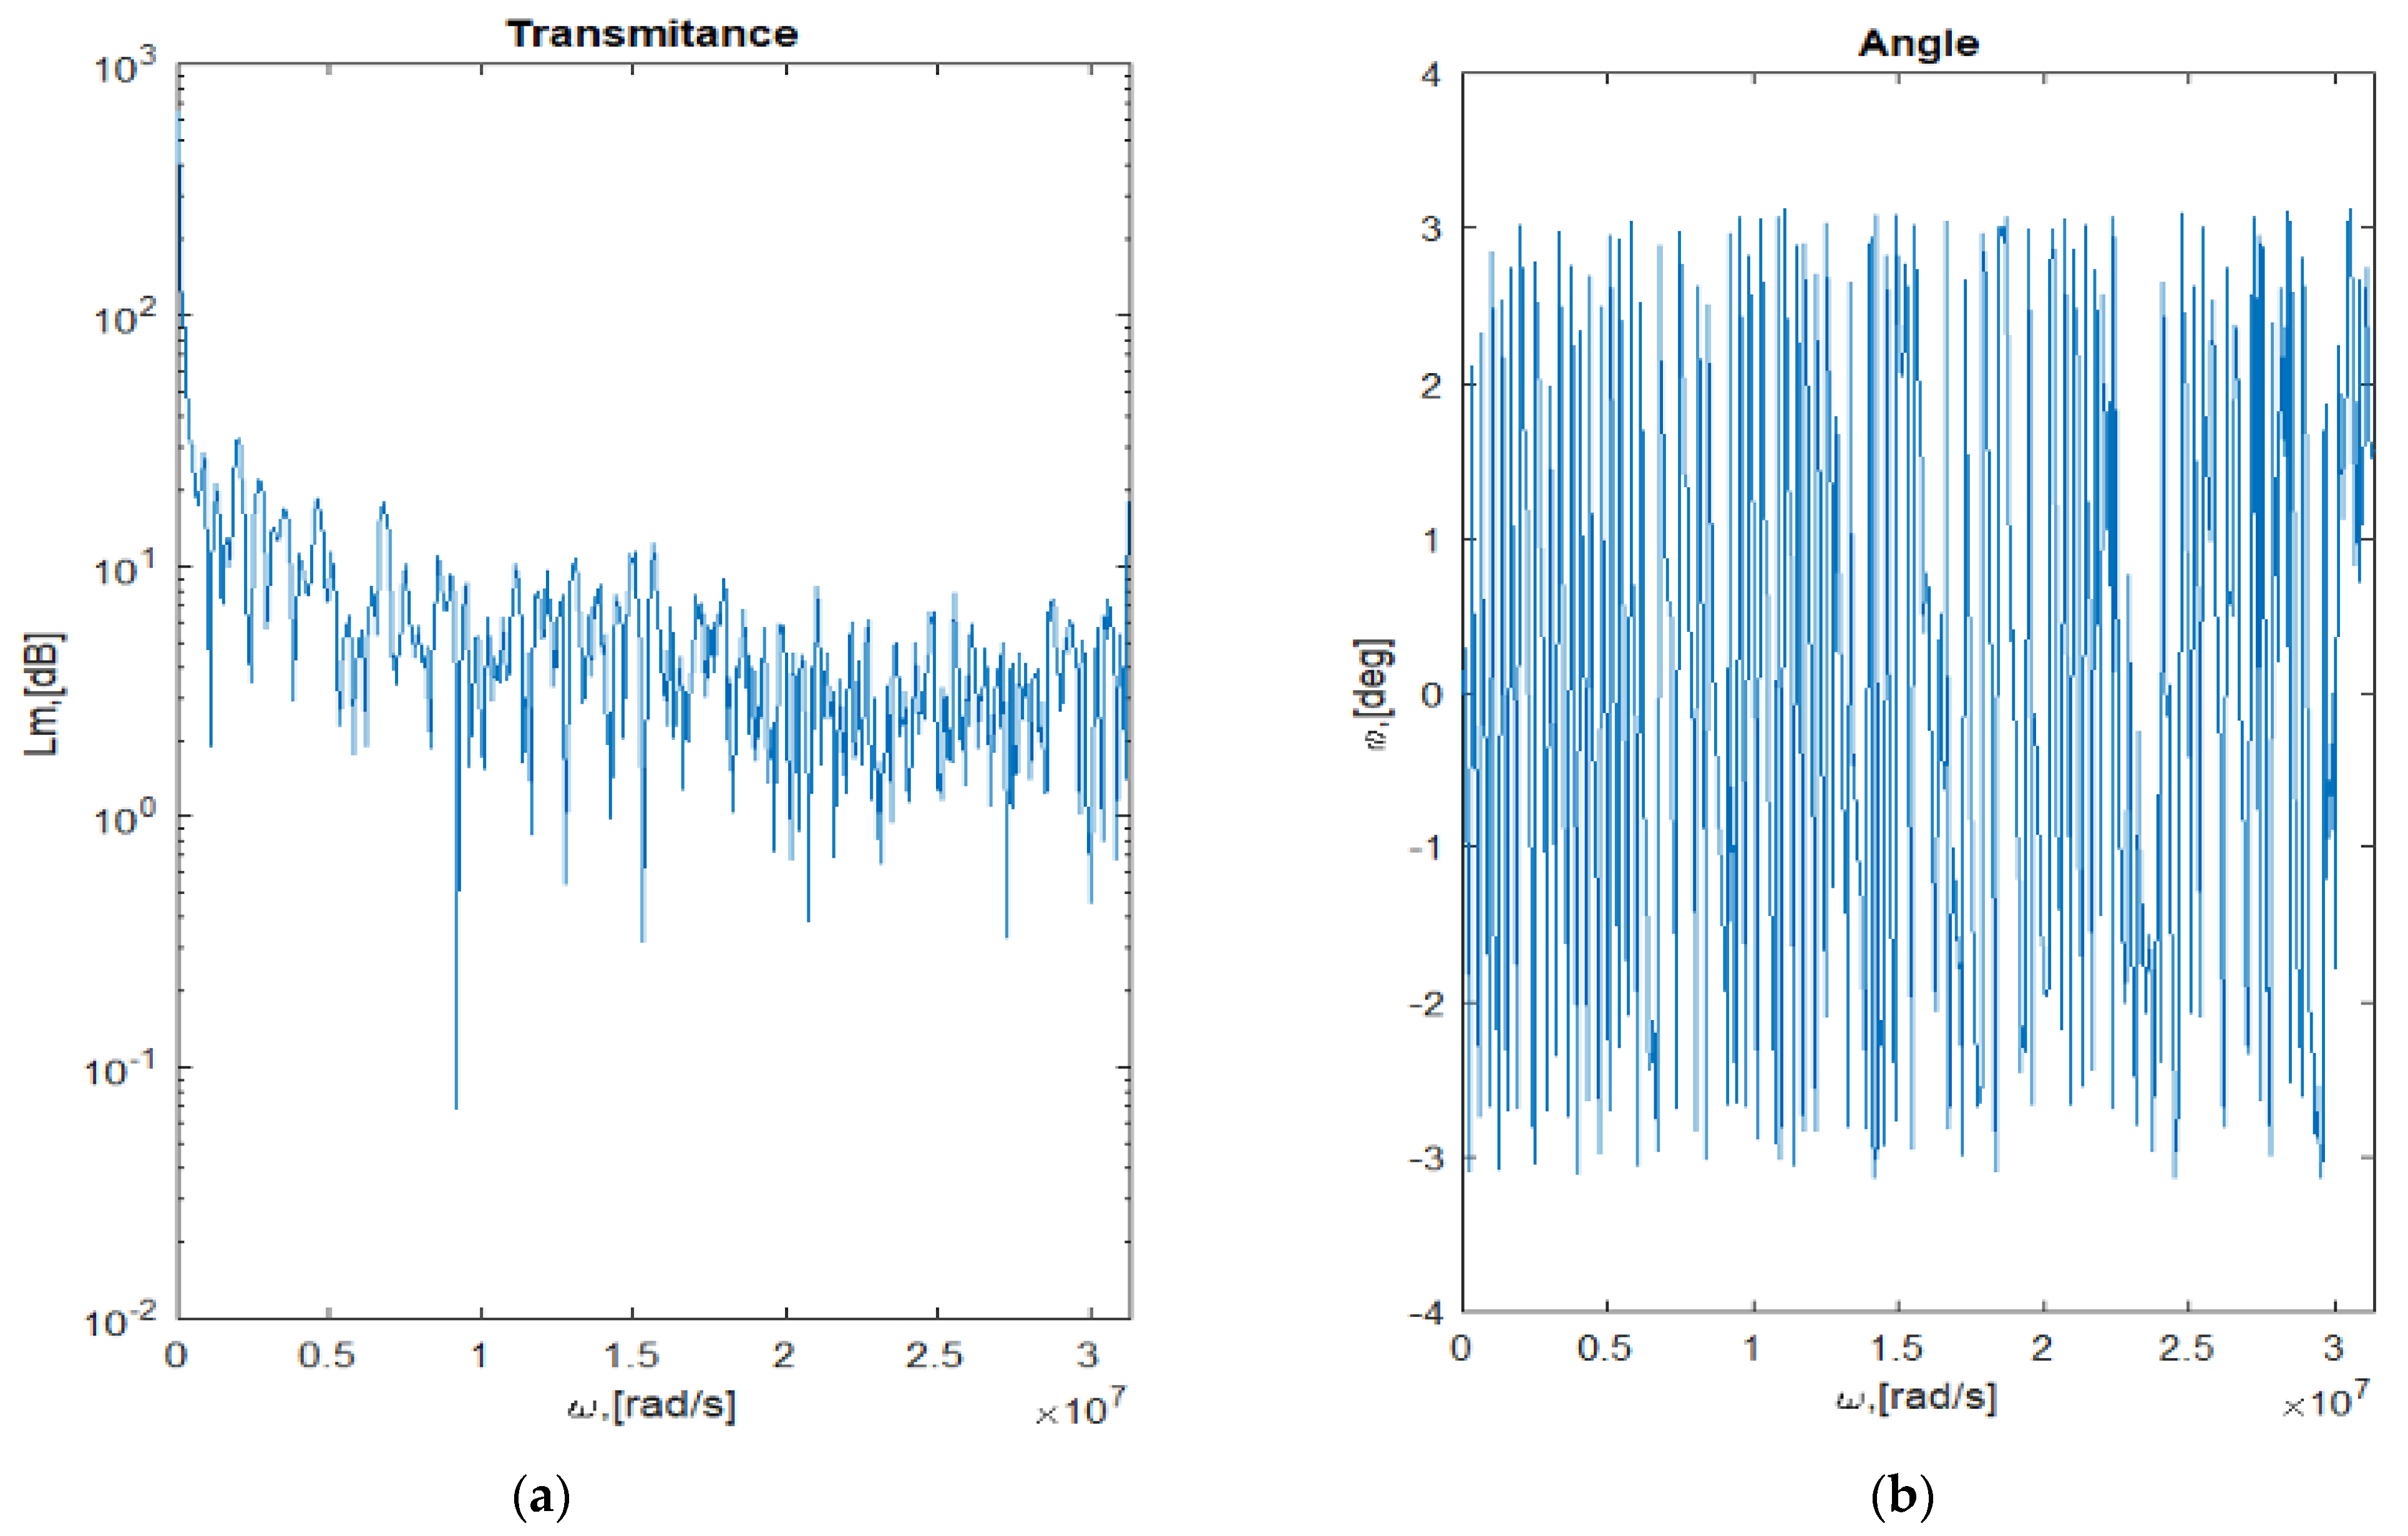
4.1. Transfer Function of the Analyzed System

In order to determine the transfer functions of individual drone circuits, it is necessary to examine how the impulse signals corresponding to the lightning effects propagate in these circuits. Our tests, conducted in a high-voltage laboratory, allowed the observation of the circuit responses to the input transient current induced by the magnetic field generated by CG lightning. For the tests, the WF4 (6.4/69 µs, 125 V) double exponential voltage waveform was used (Figure 2). This waveform is recommended by DO-160 for airborne equipment that may be subjected to lightning-induced magnetic fields coupled onto their wiring. The waveform 4 was favored because it contains more energy per event, and is thus more likely to induce damage than WF3 Damped sinusoid (which also is recommended by DO-160, for pin injection testing).
A simplified measurement scheme is shown in Figure 5.
During the experimental tests, we selected the most important electric systems for the communication and proper functioning of the drone (EUD), that is, (1) a power supply system, (2) a receiving antenna, (3) a brushless direct-current (BLDC) motors, and (4) a motor control system (Figure 6).
The voltage waveform WF4 input from the generator and the output signals of the tested system were observed and recorded on the digital oscilloscope for further analysis [31]. The tests were carried out at the same level of generated surges. The MIG0618SS generator was set to produce a single stroke in the form of impulse voltage with a rise time 6.4 µs and a 69 µs half—peak for open circuit conditions. Its level of peak value was 125 V divided by Voltage Coupling Transformer (HF Transformer) to a voltage peak value 8 V. The final peak value of the current pulse depended on total impedance of the analyzed system and, for all of the series, it remained constant at about 110 A. The output of the step-down divider was directly connected to a digital oscilloscope with a coaxial cable. The influence of the setup configuration and the measuring equipment settings, such as the configuration of the connections to the system, the length of the cable and the oscilloscope’s time resolution, were also examined. During the pin injection mode small distortions and noise were noticed, mainly on the rising slope of those waveforms that were caused by internal switching processes in the generator and the capacitive and inductive coupling between the cables [32,33].
In order to smoothe the waveform and remove the noise, the “smoothdata” function build in Matlab software was used. The operation of this procedure is based on the so-called “loess” regression, which is a nonparametric technique using local weighted regression to fit a smooth curve through points obtained from measurements. The final processed waveforms demonstrating the impulse signals at the input and output of the analyzed drone components are presented in Figure 7, Figure 8, Figure 9 and Figure 10.
In order to obtain the transmittance of the individual selected circuits, the Fourier Transform of the measured input and output signals was determined. The next step was to divide the output signal (Fourier transform) by the input signal (Fourier transform). Thus, the frequency characteristics of these circuits were obtained (Figure 11, Figure 12, Figure 13 and Figure 14).
Another potentially applicable method is computer simulation [34,35]. It enables 2D and 3D modeling of the same object many times without changing the parameters [36,37,38]. However, a mathematical model is necessary. It can be created by measuring the voltages or/and currents values tested in a laboratory, and then determining the transmittance of individual paths.
The analysis of the impulse voltage measurements at the input and output of the tested circuit fragment allowed for the development of transmittance as well as frequency and phase characteristics. The study of transmittance for individual parts of the drone allowed the analysis of the propagation of overvoltages throughout the machine. For each determined transmittance, an approximation was made, using the least squares method, in accordance with formula 3, to the polynomial function of one variable. If we limit the search to polynomials, then polynomial regression or polynomial approximation are applicable [39]. This allows a mathematical description of the characteristics of individual circuits (based on the measurements outlined above) and further simulation using numerical methods. The selected transmittance patterns and their coefficient of determination R2, which determines the convergence, are presented in Table 2. Using the least squares method, we adjusted the coefficients of the polynomial {a0, a1, …, an} (formula (3)) so that the obtained polynomial reflected the best data measurements. Since the coefficients of the polynomial are numbers, solving this problem boils down to solving the algebraic equation [40,41]:
f ( x ) = W n ( x ) = a n x n + a n 1 x n 1 + + a 1 x 1 + a 0 x 0
where f (x)—searched function which will best approximate the input data, an—the unknown coefficients of the polynomial we want to find and n—degree of the polynomial.
The development of the smallest possible approximation is a difficult task due to the nature of the tested impulse and its disturbances. The transmittance approximation for the radio communication system certainly did not qualify for further analyses, because the coefficient of determination of 55% was definitely too low.
Both the transmittance and the phase modules differ depending on the drone circuit being tested. This is due to their different structures. Interpreting these results is very difficult because the systems are made up of so many elements. Therefore, it is very difficult to model them appropriately without carrying out measurements such as those on the actual machine. The common feature is a greater low-frequency response. The range up to 5 MHz was tested with a resolution of 4 kHz. This allowed the determination of the full spectrum of frequencies that may occur during an atmospheric discharge. Single shock pulses in accordance with the DO-160 standard have a frequency of approx. 300 kHz. However, actual multiple discharges can reach frequencies of up to several megahertz. With the full range of frequencies and responses of individual circuits to shock pulses, a mathematical model can be developed to analyze the flow of overvoltage inside the drone.

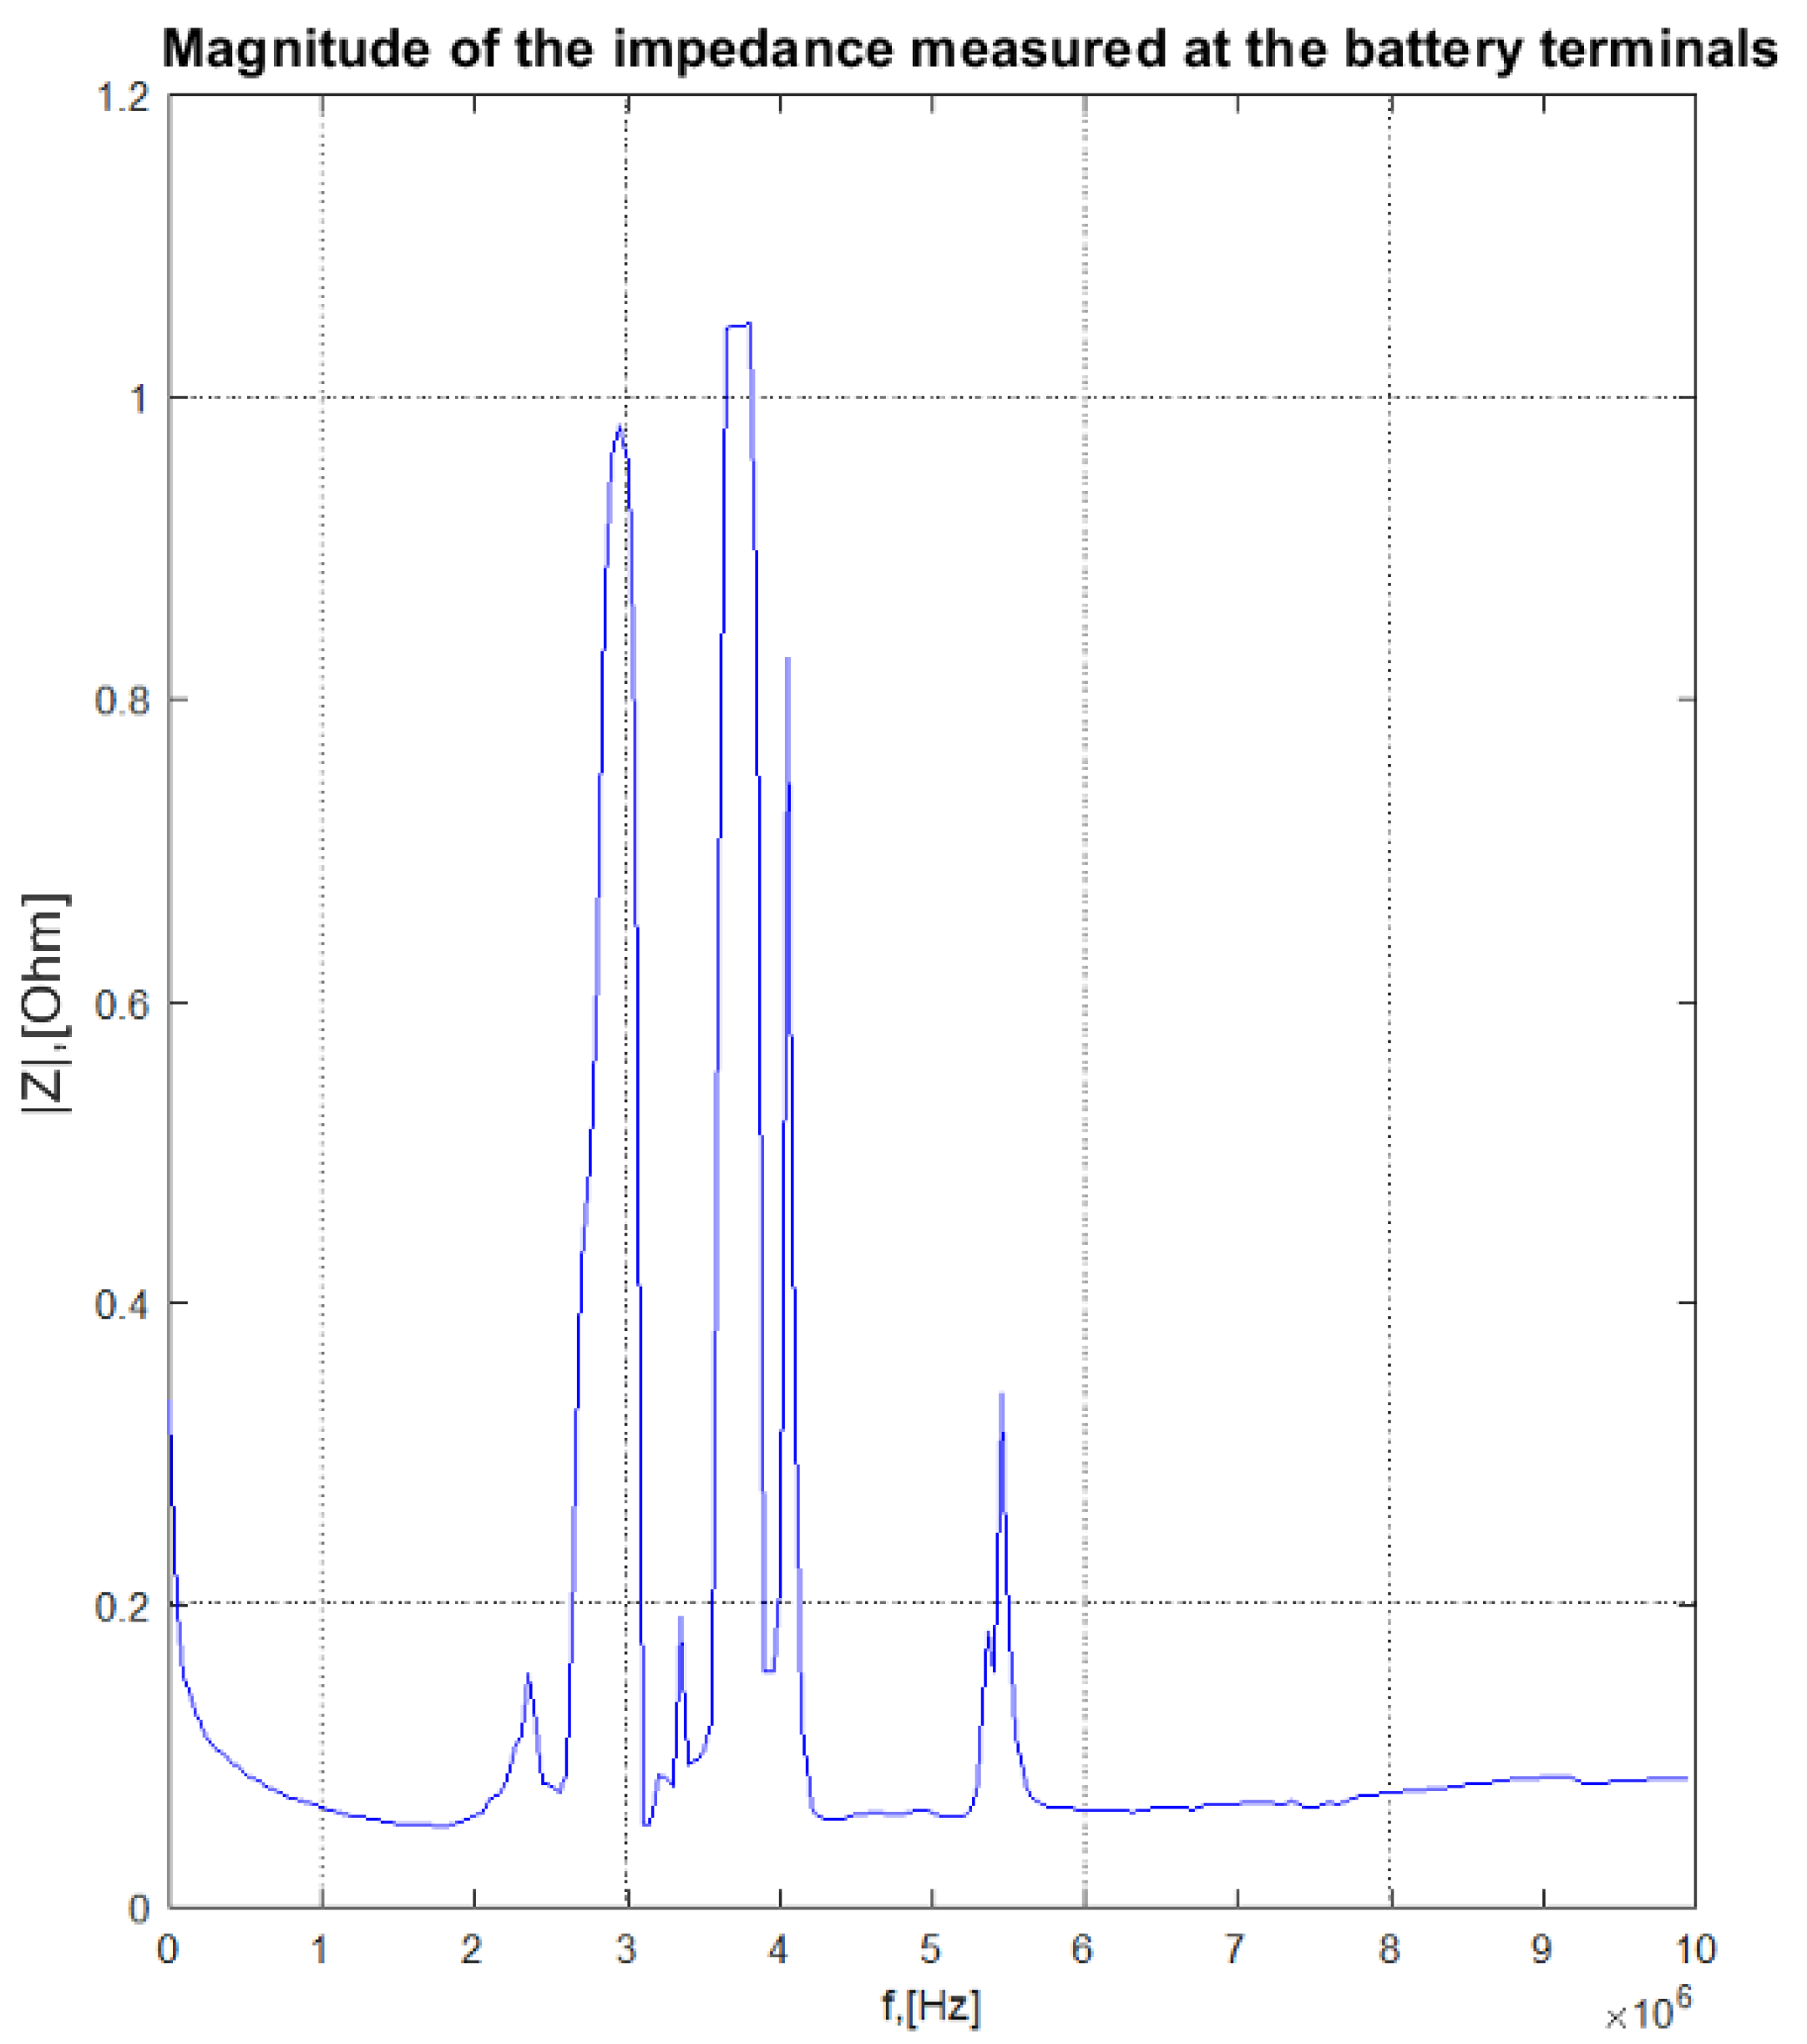
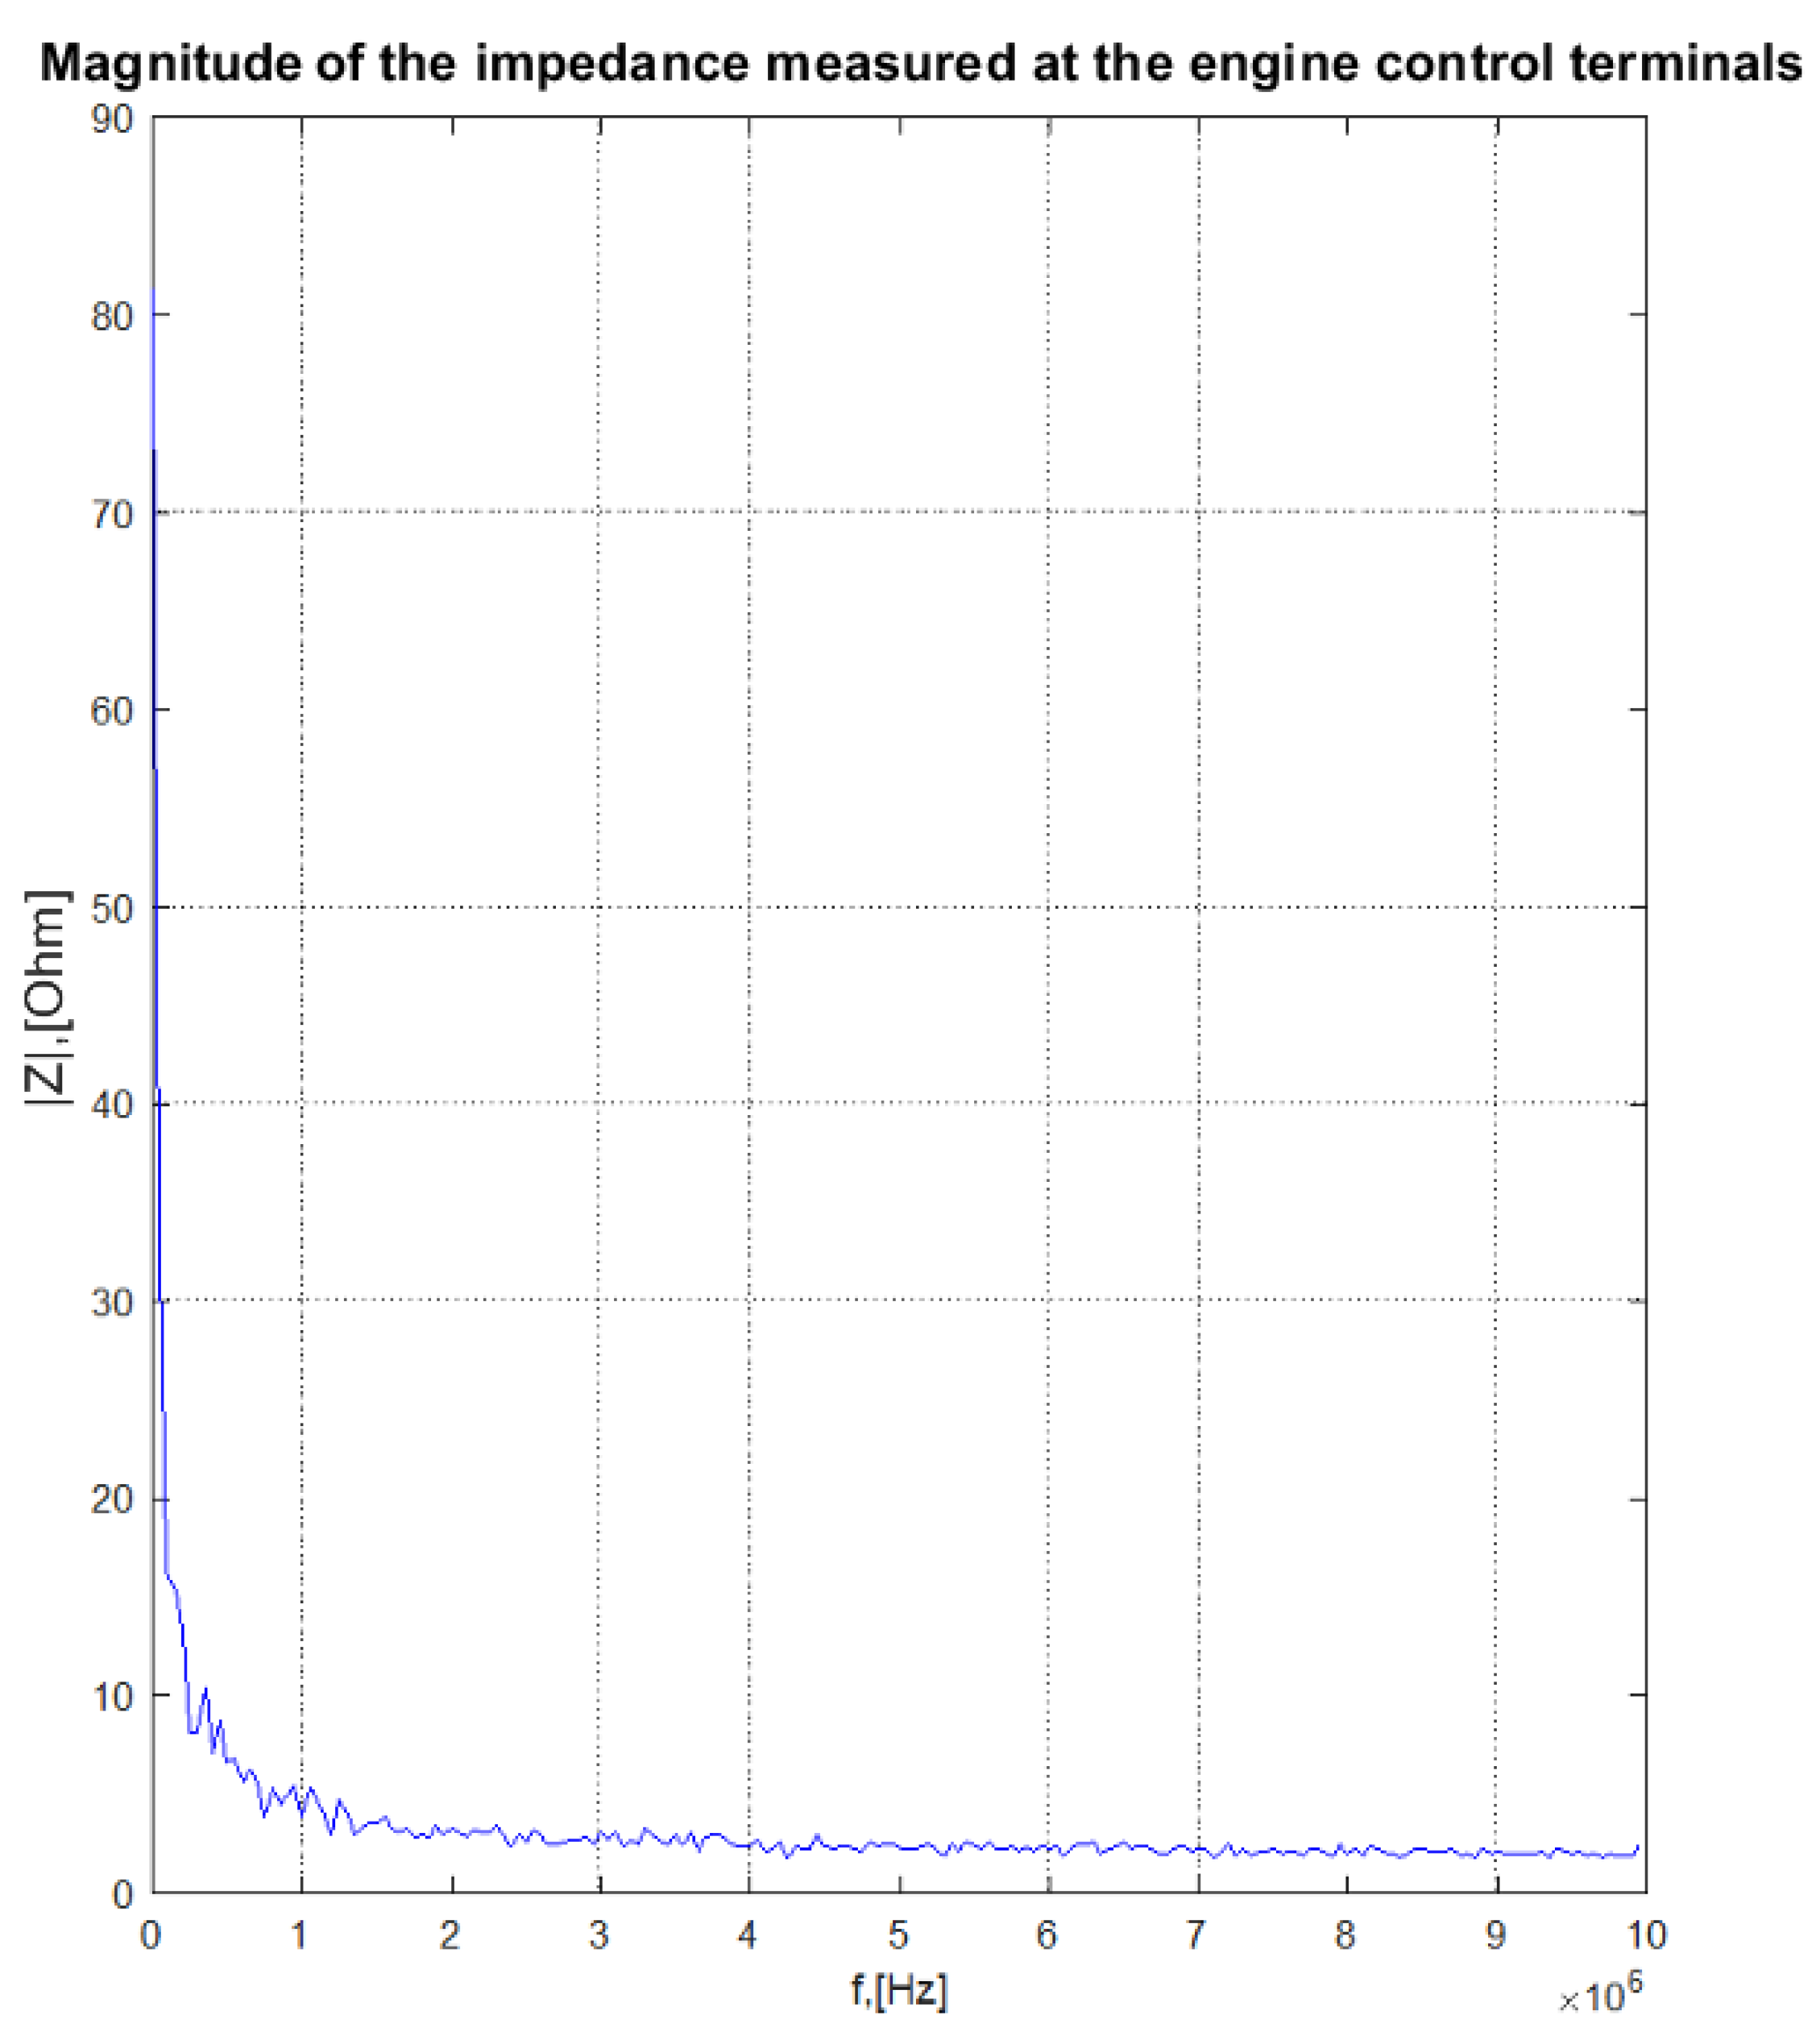
4.2. Selected Circuits Impedance

Having obtained the transmittance of the circuits, it was possible to estimate how the impulse propagates through the various elements of the machine. However, to determine the level of overvoltages resulting from the drone’s exposure to an electromagnetic pulse, the source of which is nearby lightning discharge, it is necessary to know the impedance of individual drone systems.
To determine the impedance of the selected drone electronic systems, a precision LCR-8110G meter was used. Data from the meter were downloaded in real time to a personal computer via RS232 port. The LCR-8110G meter produced a 1 V amplitude sine wave. The frequency was adjusted automatically within the range from 20 Hz to 10 MHz. Before the start of the measurements of each new configuration of the examined device (to reduce an influence of inductance and capacitance of Kelvin clips probe), we calibrated of the LCR meter’s probes, shorted and open. The selected electronic systems for this study were the same as in previous tests. The characteristics of the impedance as a function of frequency are shown in Figure 15, Figure 16, Figure 17, Figure 18, Figure 19 and Figure 20.
The impedance characteristics of the individual circuits differed from each other. As in the case of the transmittance determination, in this case, they were the result of the different internal structures of these systems (different components, different application). This meant that the levels of noise propagation were different depending on the chosen path. There was also a difference in the frequency of the surge pulse, as shown in Figure 15, Figure 16, Figure 17, Figure 18, Figure 19 and Figure 20; the variation in impedance versus frequency was significant. For normalized pulses, the frequency of 300 kHz should be taken into account. However, as mentioned earlier, a pulse of higher frequency may occur during the actual discharge.

4.3. Transient Impulse Flow Model

Based on the measurements of transmittance of the individual drone circuits, a simulation model in MATLAB was developed. The model was developed on the basis of the transmittance of the individual circuits determined during the tests (Section 4.1). Next, they were all aggregated into one model. This enabled the analysis of the emerging voltage pulses in various circuits (at the same time), while inducing an overvoltage in another part (not all—only measured in Section 4.1). The model shows how the transient voltages spread through the electrical installation of the machine. It was possible to define the influence of the overvoltage and its potential effect on the operation of particular peripheral devices. The simulation results for the voltage induced in the motor are shown in Figure 21 and Figure 22.
To generate the above data, the disturbing impulse shown in Figure 23 was used (generator stroke—Section 4.1). It was developed on the basis of previous measurements and corresponded to the impulse generated on the motor windings. The model shows that the most vulnerable part of the drone was the GPS module data line. This meant that the entire bus was vulnerable, as well as, possibly, other low-voltage connections between the drone’s peripheral systems.
Based on the frequency diagram, it can be seen that the lowest frequencies (up to 300 KHz) had the greatest share. This corresponded to the WF-4 shock pulse frequency (shape 6.4/69 µs) described in the previous chapters. It should also be remembered that despite exceeding the momentary permissible voltage values for electronic systems, it did not damage them. The pulse is very short and may not cause permanent damage [42,43]. The situation can be quite different with multiple discharges. Subsequent strokes have lower energy than first strokes, but their frequency may lead to damage. Figure 21 also shows that the overvoltage was the smallest in the other motor. The engine windings and the battery are the most resistant elements of the drone to lightning electromagnetic pulses.

5. Conclusions

The place most exposed to overvoltage induction due to LEMP is the motor winding. The pulse can propagate to the rest of the machine circuits through the power line and drivers. As shown by research, low-voltage communication lines are the most vulnerable. Surge voltages in the drone’s circuits may disrupt its operation or damage individual components. This is directly determined by the distance to the lightning channel. Continuing current discharges do not pose a threat to devices of this type. In turn, the direct flow of the lightning charge through the drone leaves no opportunity for its further operation [43,44,45]. As part of the research described in this article, a mathematical description of the transmittance of selected fragments of circuits of an unmanned aircraft was developed. This made it possible to determine the method of propagation of the overvoltage. The impedance of individual circuits was also tested in relation to variable pulses with a frequency of 20 Hz to 10 MHz. This allowed us to determine how these circuits behave for strokes of different durations. The tests were carried out with the use of shock pulses, in accordance with the standards applicable in aviation (DO-160). The most important achievements included:
  • The development of the dependence of the impedance of individual drone circuits depending on the signal frequency
  • The development of the transmittance of these circuits
  • The determination of polynomial transmittance formulas for the mathematical description of the studied dependencies
  • A preliminary model illustrating the flow of overvoltage inside the drone’s electronics for a given disturbing impulse
The work of an unmanned aerial vehicle during a storm is very risky, because it is not possible to precisely define the zone of lightning occurrence. The defined safety distance is therefore very difficult to maintain in practice. This study shows that it is possible for a drone to work in unfavorable conditions and can be used to determine the probability of its correct operation in such a situation.

Author Contributions

Conceptualization, P.S. and T.K.; data curation, P.S. and T.K.; formal analysis, P.S. and T.K.; methodology, P.S. and T.K.; project administration, P.S.; resources, P.S. and T.K.; software, P.S. and T.K.; visualization, T.K.; writing—original draft, P.S. and T.K.; writing—review and editing, P.S. and T.K. All authors have read and agreed to the published version of the manuscript.

Funding

Minister of Science and Higher Education of the Republic of Poland: Maintain the research potential of the discipline of automation, electronics and electrical engineering.

Institutional Review Board Statement

Not applicable.

Informed Consent Statement

Not applicable.

Data Availability Statement

Not applicable.

Conflicts of Interest

The authors declare no conflict of interest.

References

  1. Divya, J. Exploring the Latest Drone Technology for Commercial, Industrial and Military Drone Uses. 2017. Available online: https://www.businessinsider.com/drone-technology-uses-2017-7?IR=T (accessed on 5 April 2021).
  2. Barr, L.C.; Ancel, E.; Foster, J.V.; Klyde, D.; Evans, J.; Belcastro, C.M.; Newman, R.L. Preliminary Risk Assessment for Small Unmanned Aircraft Systems. In Proceedings of the 17th AIAA Aviation Technology, Integration, and Operations Conference, Denver, CO, USA, 5–9 June 2017. [Google Scholar]
  3. Poelman, D.R.; Schulz, W.; Diendorfer, G.; Bernardi, M. The European lightning location system EUCLID—Part 2: Observations. Nat. Hazards Earth Syst. Sci. 2016, 16, 607–616. [Google Scholar] [CrossRef] [Green Version]
  4. Gaynutdinov, R.R.; Chermoshentsev, S.F. Study of Lightning Strike Impact on Unmanned Aerial Vehicle. In Proceedings of the 2016 17th International Conference of Young Specialists on Micro/Nanotechnologies and Electron Devices (EDM), Erlagol, Russia, 30 June–4 July 2016. [Google Scholar]
  5. Masłowski, G.; Wyderka, S. Układ probierczo-pomiarowy do poligonowych badań narażeń piorunowych. Prz. Elektrotech. 2012, 88, 67–72. [Google Scholar]
  6. Masłowski, G. Analysis and Modeling of Lightning Discharges for Overvoltage Protection; Publisher AGH: Kraków, Poland, 2010. [Google Scholar]
  7. Bogucki, J.; Chudziński, A.; Połujan, J. Emisja Elektromagnetyczna Urządzeń w Praktyce, Telekomunikacja i Techniki Informacyjne 1–2; Instytut Łączności — Państwowy Instytut Badawczy: Warsaw, Poland, 2007; pp. 85–95. [Google Scholar]
  8. Lin, T.; Uman, M.A.; Tiller, J.A.; Brantley, R.D.; Krider, E.P.; Weidman, C.D. Characteryzation of lightning return stroke electric and magnetic fiels form simultaneous two-station measurements. J. Geophys. Res. 1979, 84, 6307–6314. [Google Scholar] [CrossRef]
  9. RTCA DO-160. Environmental Conditions and Test Procedures for Airborne Equipment; Radio Technical Commission for Aeronautics: Washington, DC, USA, 2010. [Google Scholar]
  10. PN-EN 62305-1:2011. Lightning Protection—Part 1; BSI Standards Publication: London, UK, 2011. [Google Scholar]
  11. PN-EN 61000-4-5:2014-10. Electromagnetic Compability (EMC)—Part 4–5: Methods of Research and Measurement—Shock Resistance Test; International Electrotechnical Commission: Geneva, Switzerland, 2014. [Google Scholar]
  12. Gaynutdinov, R.R.; Chermoshentsev, S.F. Electromagnetic Stability of an Unmanned Aerial Vehicle at the Indirect Effect of a Lightning Discharge. In Proceedings of the 2017 International Multi-Conference on Engineering, Computer and Information Sciences (SIBIRCON), Novosibirsk, Russia, 18–22 September 2017. [Google Scholar]
  13. Filik, K.; Hajder, S.; Masłowski, G. Multi-Stroke Lightning Interaction with Wiring Harness: Experimental Tests and Modelling. Energies 2021, 14, 2106. [Google Scholar] [CrossRef]
  14. Altman, S.S.; Vulfin, V.; Leibovich, H.; Heinrich, R.; Ianconescu, R. Lighting Strike Analysis for Drones. In Proceedings of the 2017 IEEE International Conference on Microwaves; Antennas, Communications and Electronic Systems (COMCAS), Tel-Aviv, Israel, 13–15 November 2017. [Google Scholar]
  15. Rakov, V.A.; Uman, M.A. Lightning Physics and Effects; Cambridge University Press: Cambridge, UK, 2003. [Google Scholar]
  16. Masłowski, G. Analiza i Modelowanie Wyładowań Atmosferycznych na Potrzeby Ochrony Przed Przepięciami; Monografia, Wydawnictwa AGH: Kraków, Poland, 2010. [Google Scholar]
  17. Horvath, T. Supposed Undistorted Original Distribution of Lightning Currents. In Proceedings of the 20th Interna-Tional Conference on Lightning Protection, Interlaken, Switzerland, 24–28 September 1990. [Google Scholar]
  18. Environmental Conditions and Test Procedures for Aircraft Systems, Wersja D, Rozdział 22 i 23; Washington, DC, USA, 2006.
  19. MIL-STD-461 F. Department of Defense Interface Standard Requirements for the Control of Electromagnetic Interference Characteristics of Subsystems and Equipment; Department of Defense: Washington, DC, USA, 2007. [Google Scholar]
  20. Aircraft Lightning Environment and Related Test Waveforms; Revision A; SAE International: Warrendale, PE, USA, 2005; Available online: https://www.sae.org/standards/content/arp5412a/ (accessed on 6 April 2021).
  21. Fisher, F.A.; Plumer, J.A.; Perala, R.A. Aircraft Lightning Protection Handbook, DOT/FAA/CT-89/22; September 1989; Available online: https://weatherguardaero.com/wp-content/uploads/2020/04/1989-DOTFAACT-8922.pdf (accessed on 6 April 2021).
  22. NO-16-A002:2006. Wojskowe Statki Powietrzne. Ochrona Przed Skutkami Wyładowania Atmosferycznego; Wymagania Ogólne; 2006. [Google Scholar]
  23. Filik, K. Badanie odporności zespołów awioniki statków powietrznych na narażenia LEMP. Prz. Elektrotech. 2014, 10, 60–63. [Google Scholar] [CrossRef]
  24. West, L. Allocating Indirect Lightning to Cables & Boxes at Program Inception. Application of Ohm’s Law, Kirchhoff’s Laws, Faraday’s Law & Scaling by Geometric, Electrical, & Spectral Parameters, Interaction Note 617. 2011. Available online: http://www.ece.unm.edu/summa/notes/In/IN617.pdf (accessed on 5 July 2021).
  25. Masłowski, G.; Rakov, V.A. New Insights into Lightning Return-Stroke Models with Specified Longitudinal Current Distribution. IEEE Trans. Electromagn. Compat. 2009, 51, 471–478. [Google Scholar] [CrossRef] [Green Version]
  26. Masłowski, G.; Rakov, V.A. Equivalency of lightning return stroke models employing lumped and distributed current sources. IEEE Trans. Electromagn. Compat. 2007, 49, 123–133. [Google Scholar] [CrossRef]
  27. Nucci, C.; Diendorfer, G.; Uman, M.; Rachidi, F.; Ianoz, M.; Mazzetti, C. Lightning Return Stroke Current Models with Specified Channel-Base Current: A Review and Comparison. J. Geophys. Res. 1990, 95, 20395–20408. [Google Scholar] [CrossRef]
  28. Heidler, F. Traveling Current Source Model for LEMP Calculations. In Proceedings of the 6th STEEC, Zurich, Switzerland, 1985; pp. 157–162. [Google Scholar]
  29. Chamayou, G. A Theory of the Drone; The New Press: New York, NY, USA, 2015. [Google Scholar]
  30. Quads for Fun. Available online: https://quadsforfun.wixsite.com/quadsforfun/typical-quad-circuit (accessed on 6 April 2021).
  31. Pittalà, F.; Stone, C.; Clark, D.; Kuschnerov, M.; Xie, C.; Haddad, A. Laboratory Measurements of SOP Transients due to Lightningstrikes on OPGW Cables. In Proceedings of the Optical Fiber Communication Conference, San Diego, CA, USA, 11–15 March 2018; Optical Society of America: Washington, DC, USA, 2018; p. M4B-5. [Google Scholar]
  32. Uglešíc, I.; Franc, B.; Stipetíc, N. Lightning Stroke Measurements, Data Verification and Application in Power Systems. In Proceedings of the VI Russian Conference on Lightning Protection, Saint Petersburg, Russia, 17–19 April 2018; pp. 1–22. [Google Scholar]
  33. Kossowski; Tomasz; Matuszewski, Ł. Non-Real-Time Wireless System for Lightning Effect Measurements. Appl. Sci. 2021, 11, 4204. [Google Scholar] [CrossRef]
  34. Yang, Y.; Chen, G.; Chen, P. The probability prediction method of domino effect triggered by lightning in chemical tank farm. Process. Saf. Environ. Prot. 2018, 116, 106–114. [Google Scholar] [CrossRef]
  35. Tóth, Z.; Kiss, I.; Németh, B. Problems of the simulation and modeling the lightning protection of high structures. Pollack Period. 2019, 14, 223–234. [Google Scholar] [CrossRef]
  36. Visacro, S.; Soares, A., Jr.; Schroeder, M.A.O.; Cherchiglia, L.C.; de Sousa, V.J. Statistical analysis of lightning current parameters:Measurements at Morro do Cachimbo station. J. Geophys. Res. Atmos. 2004, 109. [Google Scholar] [CrossRef]
  37. Trkulja, B.; Drandíc, A.; Milardíc, V.; Župan, T.; Žiger, I.; Filipovíc-Grˇcíc, D. Lightning impulse voltage distribution over voltagetransformer windings—Simulation and measurement. Electr. Power Syst. Res. 2017, 147, 185–191. [Google Scholar] [CrossRef]
  38. Prácser, E.; Bozóki, T.; Sátori, G.; Williams, E.; Guha, A.; Yu, H. Reconstruction of global lightning activity based on Schumannresonance measurements: Model description and synthetic tests. Radio Sci. 2019, 54, 254–267. [Google Scholar] [CrossRef]
  39. CALCULLA. Available online: https://calculla.pl/ (accessed on 6 April 2021).
  40. Otto, B. Linear Algebra with Applications, 3rd ed.; Prentice Hall: Upper Saddle River, NJ, USA, 1995. [Google Scholar]
  41. Stephen, S.M. Gauss and the Invention of Least Squares. Ann. Stat. 1981, 9, 465–474. [Google Scholar] [CrossRef]
  42. Tomasz, K.; Szczupak, P. Analysis of the influence of strong magnetic field on unmanned aircrafts, using Helmholtz coil. Prz. Elektrotech. 2020, 96. [Google Scholar] [CrossRef]
  43. Tomasz, K.; Filik, K. Lightning tests of unmanned aircrafts with impulse generator. Prz. Elektrotech. 2020, 96, 67–70. [Google Scholar]
  44. Sehrawat, A.; Choudhury, T.A.; Raj, G. Surveillance Drone for Disaster Management and Military Security. In Proceedings of the IEEE 2017 International Conference on Computing, Communication and Automation (ICCCA), Greater Noida, India, 5–6 May 2017. [Google Scholar]
  45. Bartlett, E. Drone vs. Lightning, The University of Manchester. 2017. Available online: http://www.mub.eps.manchester.ac.uk/scienceengineering/2017/04/10/drone-vs-lightning/ (accessed on 6 April 2021).
Figure 1. Lightning current waveform defined in [8].
Energies 14 06547 g001
Figure 2. Idealized WF4 voltage waveform (6.4/69 µs) [9].
Energies 14 06547 g002
Figure 3. Repetitive current pulses used to test the immunity of avionics, according to the DO-160 aviation standard [9,18].
Energies 14 06547 g003
Figure 4. Main components of a typical drone [29,30].
Energies 14 06547 g004
Figure 5. Simplified measurement scheme of drone components.
Energies 14 06547 g005
Figure 6. Tested drone electronic systems.
Energies 14 06547 g006
Figure 7. (a) Input—Voltage measured at the A and B pins of the first motor windings; (b) Output—Voltage measured at the A and B pins of the second motor windings A and B.
Energies 14 06547 g007
Figure 8. (a) Input—Voltage measured at the A and B pins of the first motor windings; (b) Output—Voltage measured at the terminals of the engine control system.
Energies 14 06547 g008
Figure 9. (a) Input—Voltage measured at the A and B pins of the first motor windings; (b) Output—Voltage measured at the GPS terminals.
Energies 14 06547 g009
Figure 10. (a) Input—Voltage measured at the antenna terminals; (b) Output—Voltage measured at the power supply terminals.
Energies 14 06547 g010
Figure 11. (a) Transmittance between pins A and B of the first motor and the other motor; (b) Angle of transmittance between pins A and B of the first motor and the other motor.
Energies 14 06547 g011
Figure 12. (a) Transmittance between pins A and B of the first motor and the engine control system terminals; (b) Angle of transmittance between pins A and B of the first motor and the engine control system terminals.
Energies 14 06547 g012
Figure 13. (a) Transmittance between pins A and B of the first motor and the GPS terminals; (b) Angle of transmittance between pins A and B of the first motor and the GPS terminals.
Energies 14 06547 g013
Figure 14. (a) Transmittance between the antenna output terminals and the power supply terminals; (b) Angle of transmittance between the antenna output terminals and the power supply terminals.
Energies 14 06547 g014
Figure 15. Linear characteristics of the impedance of the battery input pins as a function of frequency.
Energies 14 06547 g015
Figure 16. Linear characteristics of the impedance of the engine control terminals side as a function of frequency.
Energies 14 06547 g016
Figure 17. Linear characteristics of the impedance of the output of the “A” and “B” motor windings as a function of frequency.
Energies 14 06547 g017
Figure 18. Linear characteristics of the impedance of the output of the antenna as a function of frequency.
Energies 14 06547 g018
Figure 19. Linear characteristics of the impedance of the GPS data output terminals as a function of frequency.
Energies 14 06547 g019
Figure 20. Linear characteristics of the impedance of the accelerometer data output terminals as a function of frequency.
Energies 14 06547 g020
Figure 21. The flow of shock pulses inside the drone (example)—time characteristics based on the developed model.
Energies 14 06547 g021
Figure 22. The flow of shock pulses inside the drone (example)—frequency characteristics based on the developed model.
Energies 14 06547 g022
Figure 23. The shock pulse used in the model (the same as the recorded pulse from the generator shown in Section 4.1).
Energies 14 06547 g023
Table 1. Typical waveform parameters for lightning subsequent return-stroke current at the channel base used in Equation (1).
I01 [kA]I02 [kA]τ11 [ms]τ12 [ms]τ21 [ms]τ22 [ms]n1n2
10.76.50.252.12.523022
Table 2. Approximation of the transmittance of selected drone circuits, together with the coefficient of determination.
InputOutputTransmittanceDetermination
Pins A and B first motor coilPins A and B other motor coil1.358 × 10−7 x4 − 9.25 × 10−5 x3 + 2 × 10−2 x2 − 1.8 x + 5972%
Pins A and B first motor coilEngine control unit4.8 × 10−8 x4 − 5.8 × 10−6 x3 + 2.47 × 10−3 x2 − 0.42 x + 28.6272%
Pins A and B first motor coilGPS module1.82 × 10−8 x4 − 1.58 × 10−5 x3 + 4.75 × 10−3 x2 − 0.5768 x + 28.9679%
RF antennaPower supply terminals−3.37 × 10−6 x3 + 1.86 × 10−3 x2 − 0.33 x + 26.355%
Publisher’s Note: MDPI stays neutral with regard to jurisdictional claims in published maps and institutional affiliations.

