
An Overview on Electric-Stress Degradation Empirical Models for Electrochemical Devices in Smart Grids

 ,
,  and
and 
Abstract
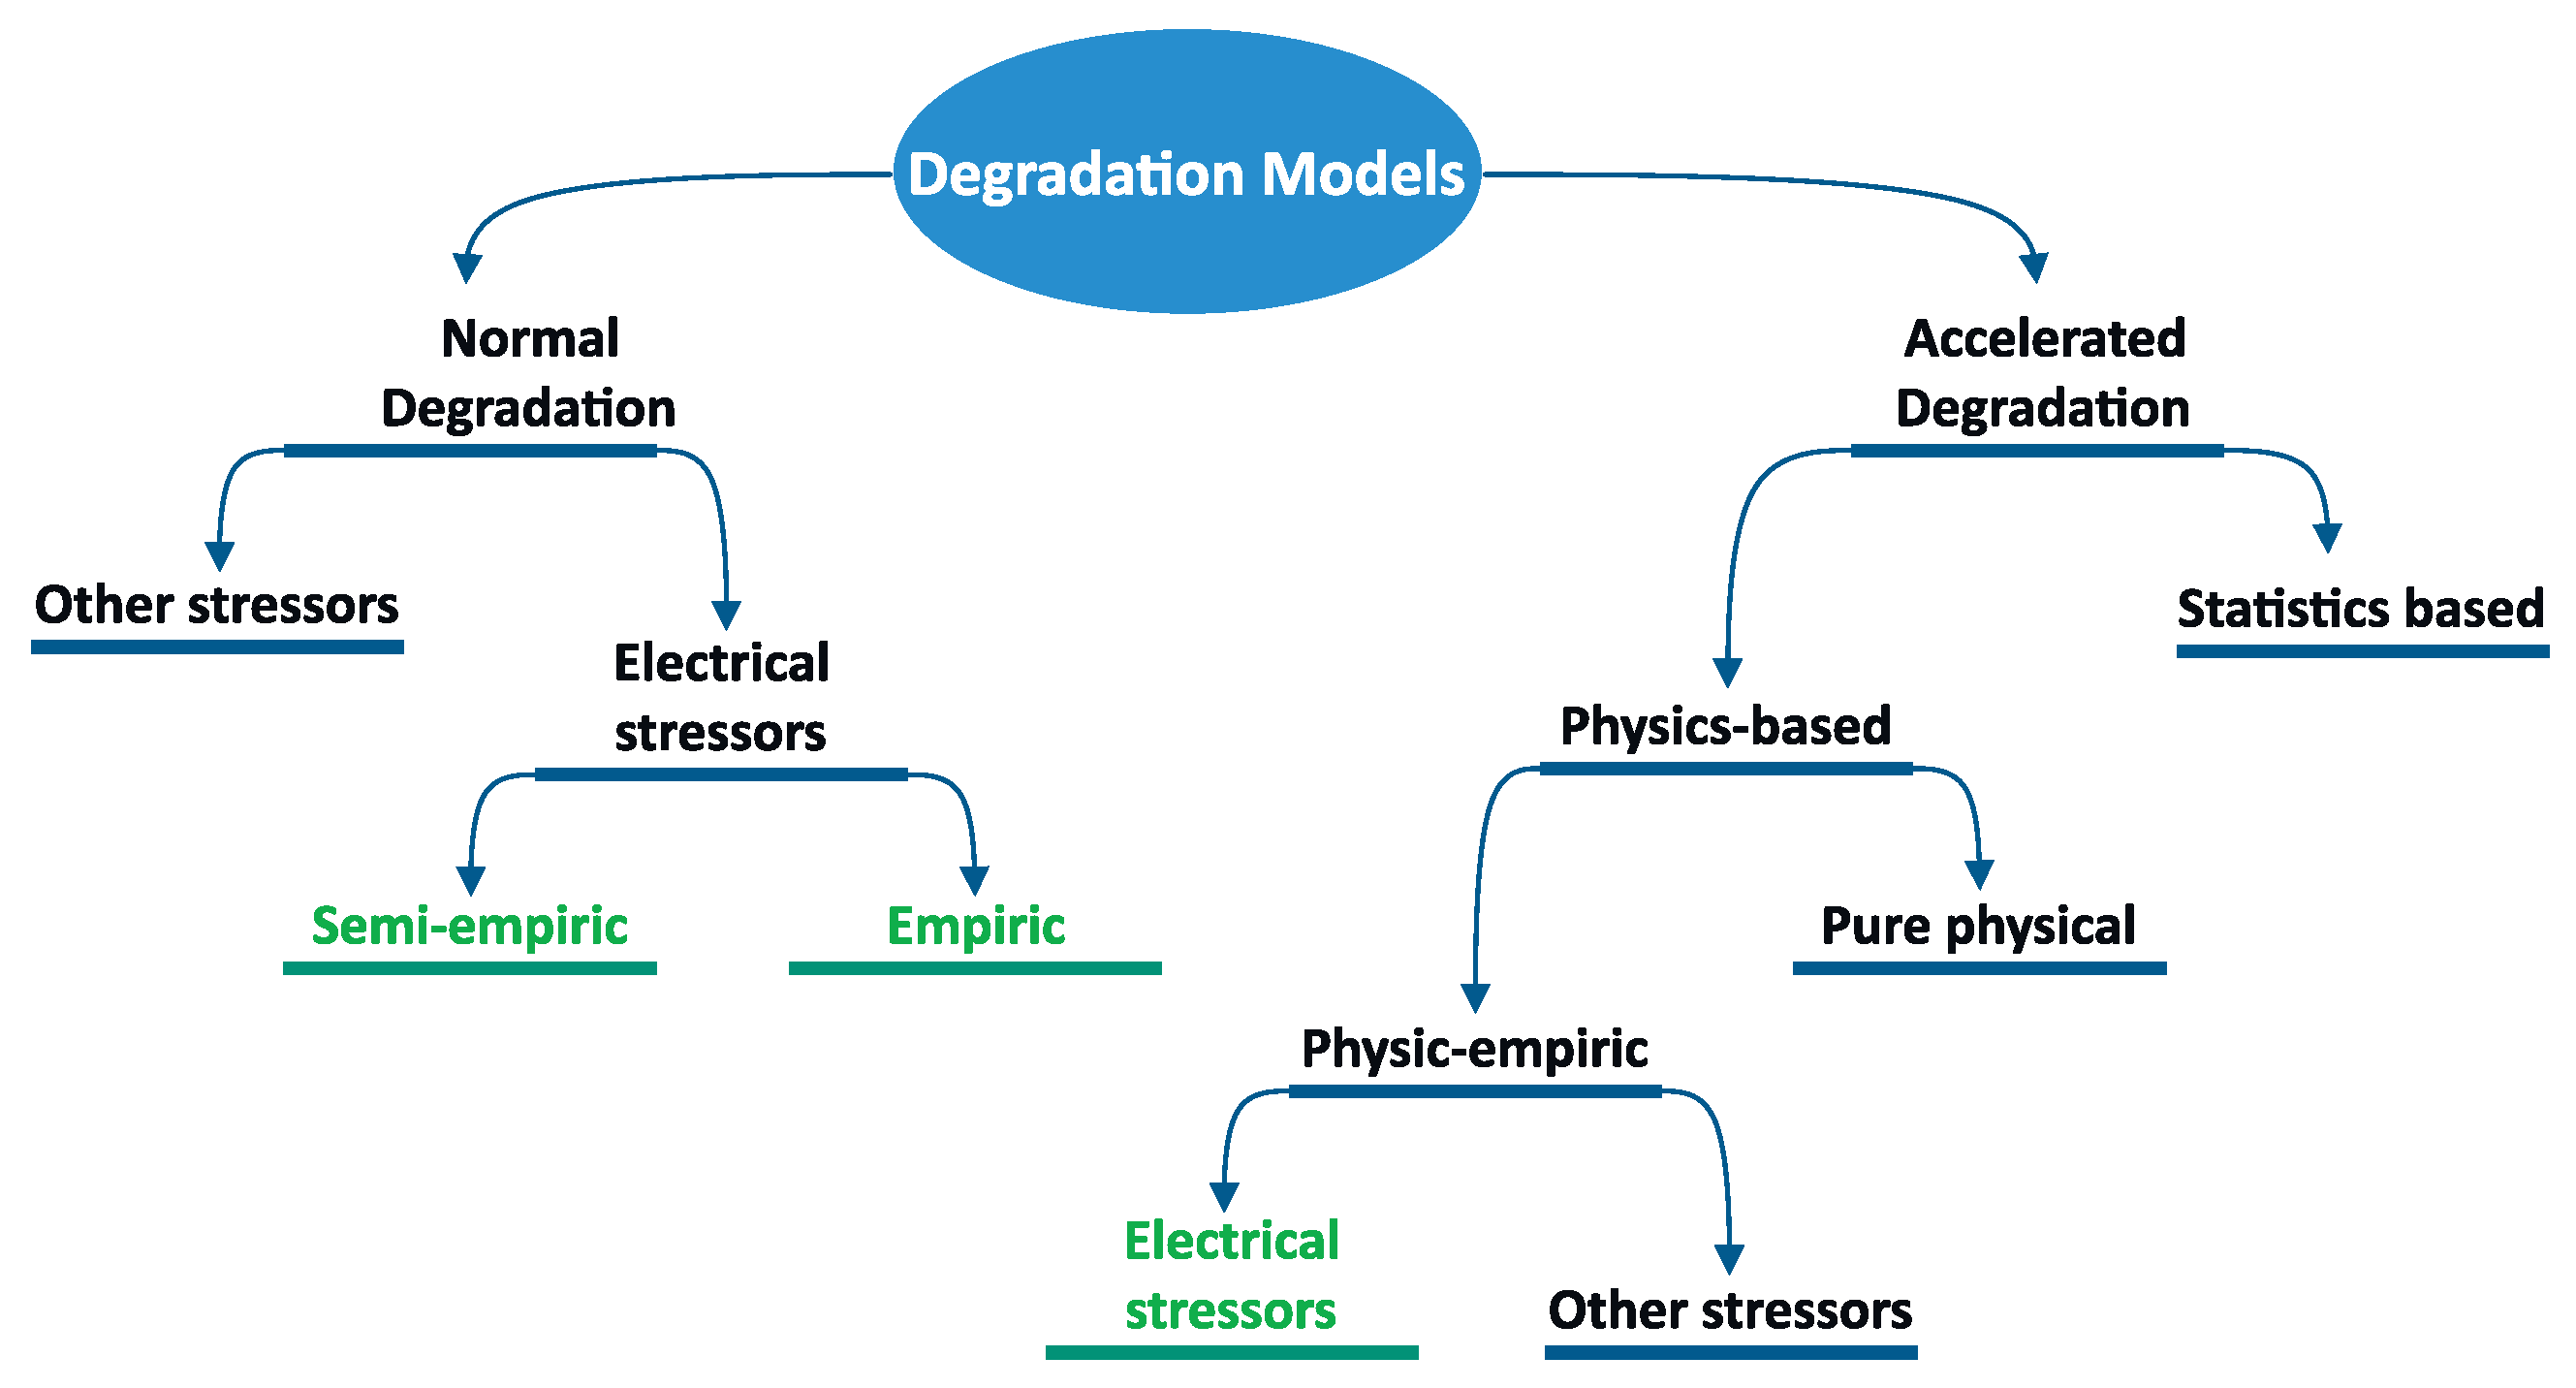
:1. Introduction
- Empirical and semi-empirical models should be extended to consider stressors of electrical nature and include non-electrochemical devices.
- Studies about the electrical-nature stressors on batteries, photovoltaic module/panels (PVMs), fuel cells, super/ultra-capacitors (SCs), and interconnected devices are needed. Indeed, many of the empirical models need validation experiments and in-depth analysis.
- Combined degradation models can generate generalized smart grid models, but studies for determining major stressors are needed. This can help perform in-depth analyses on smart grid resilience and reliability, increasing confidence in this technology.
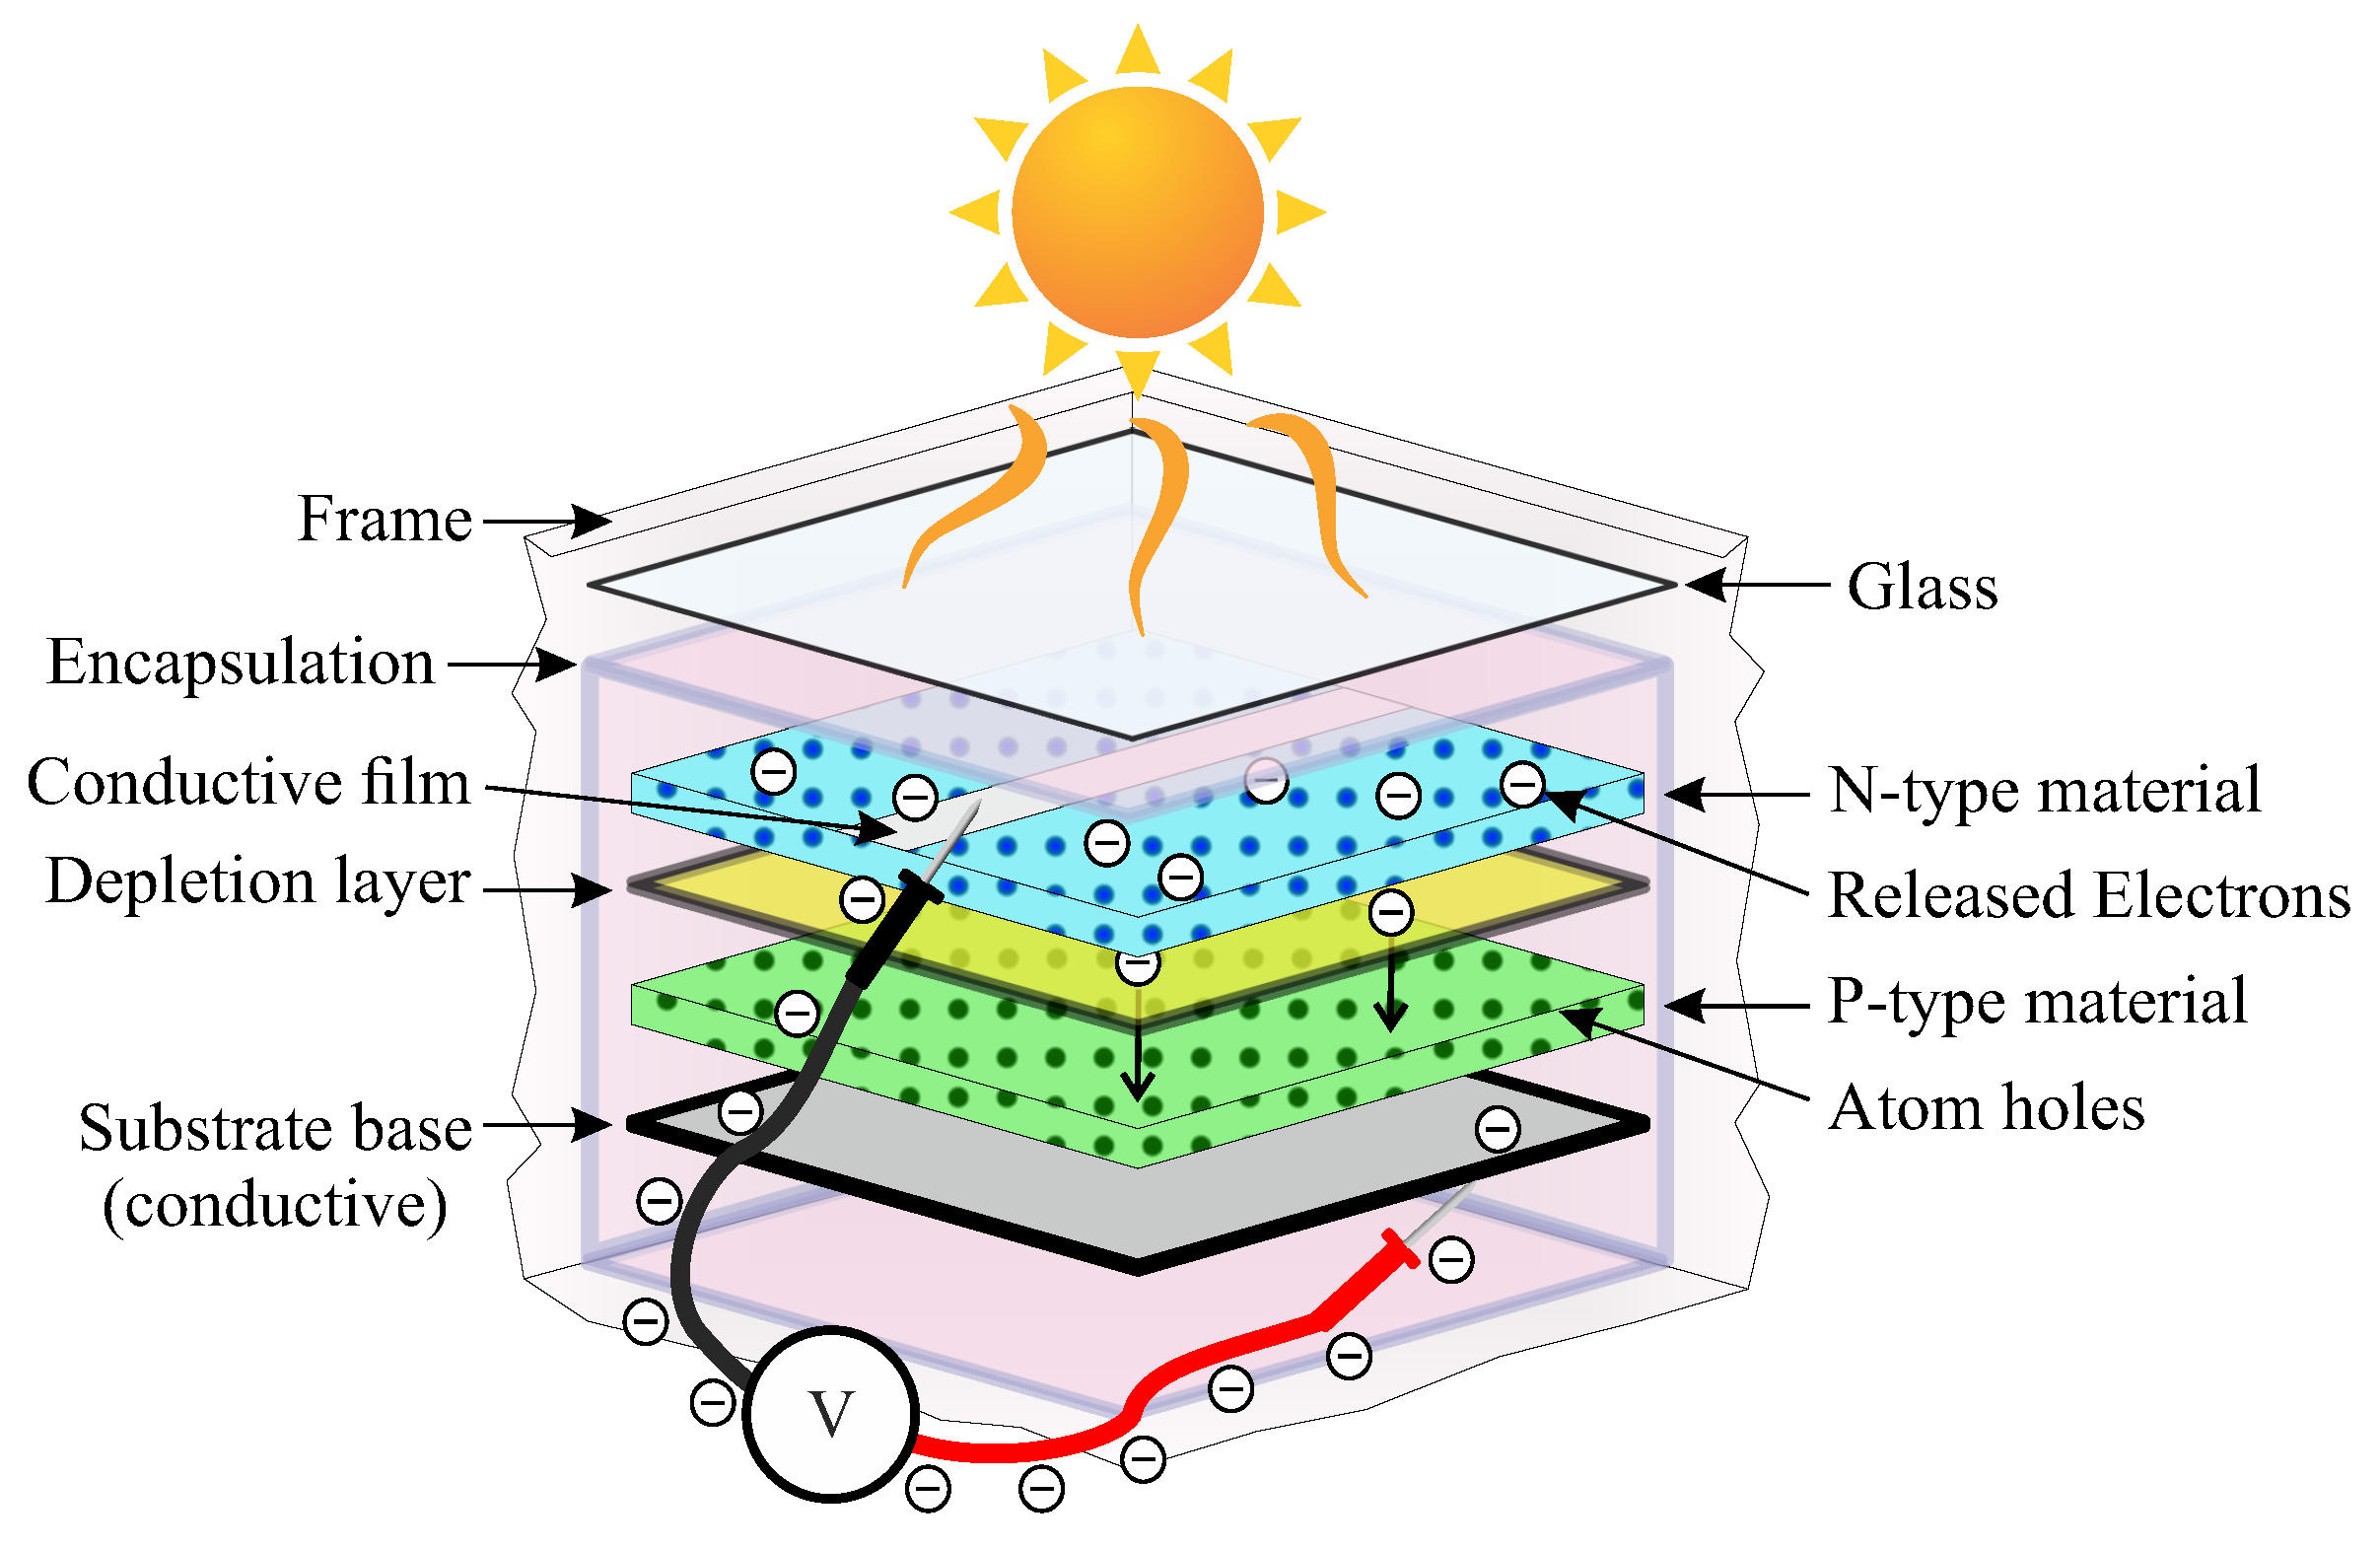
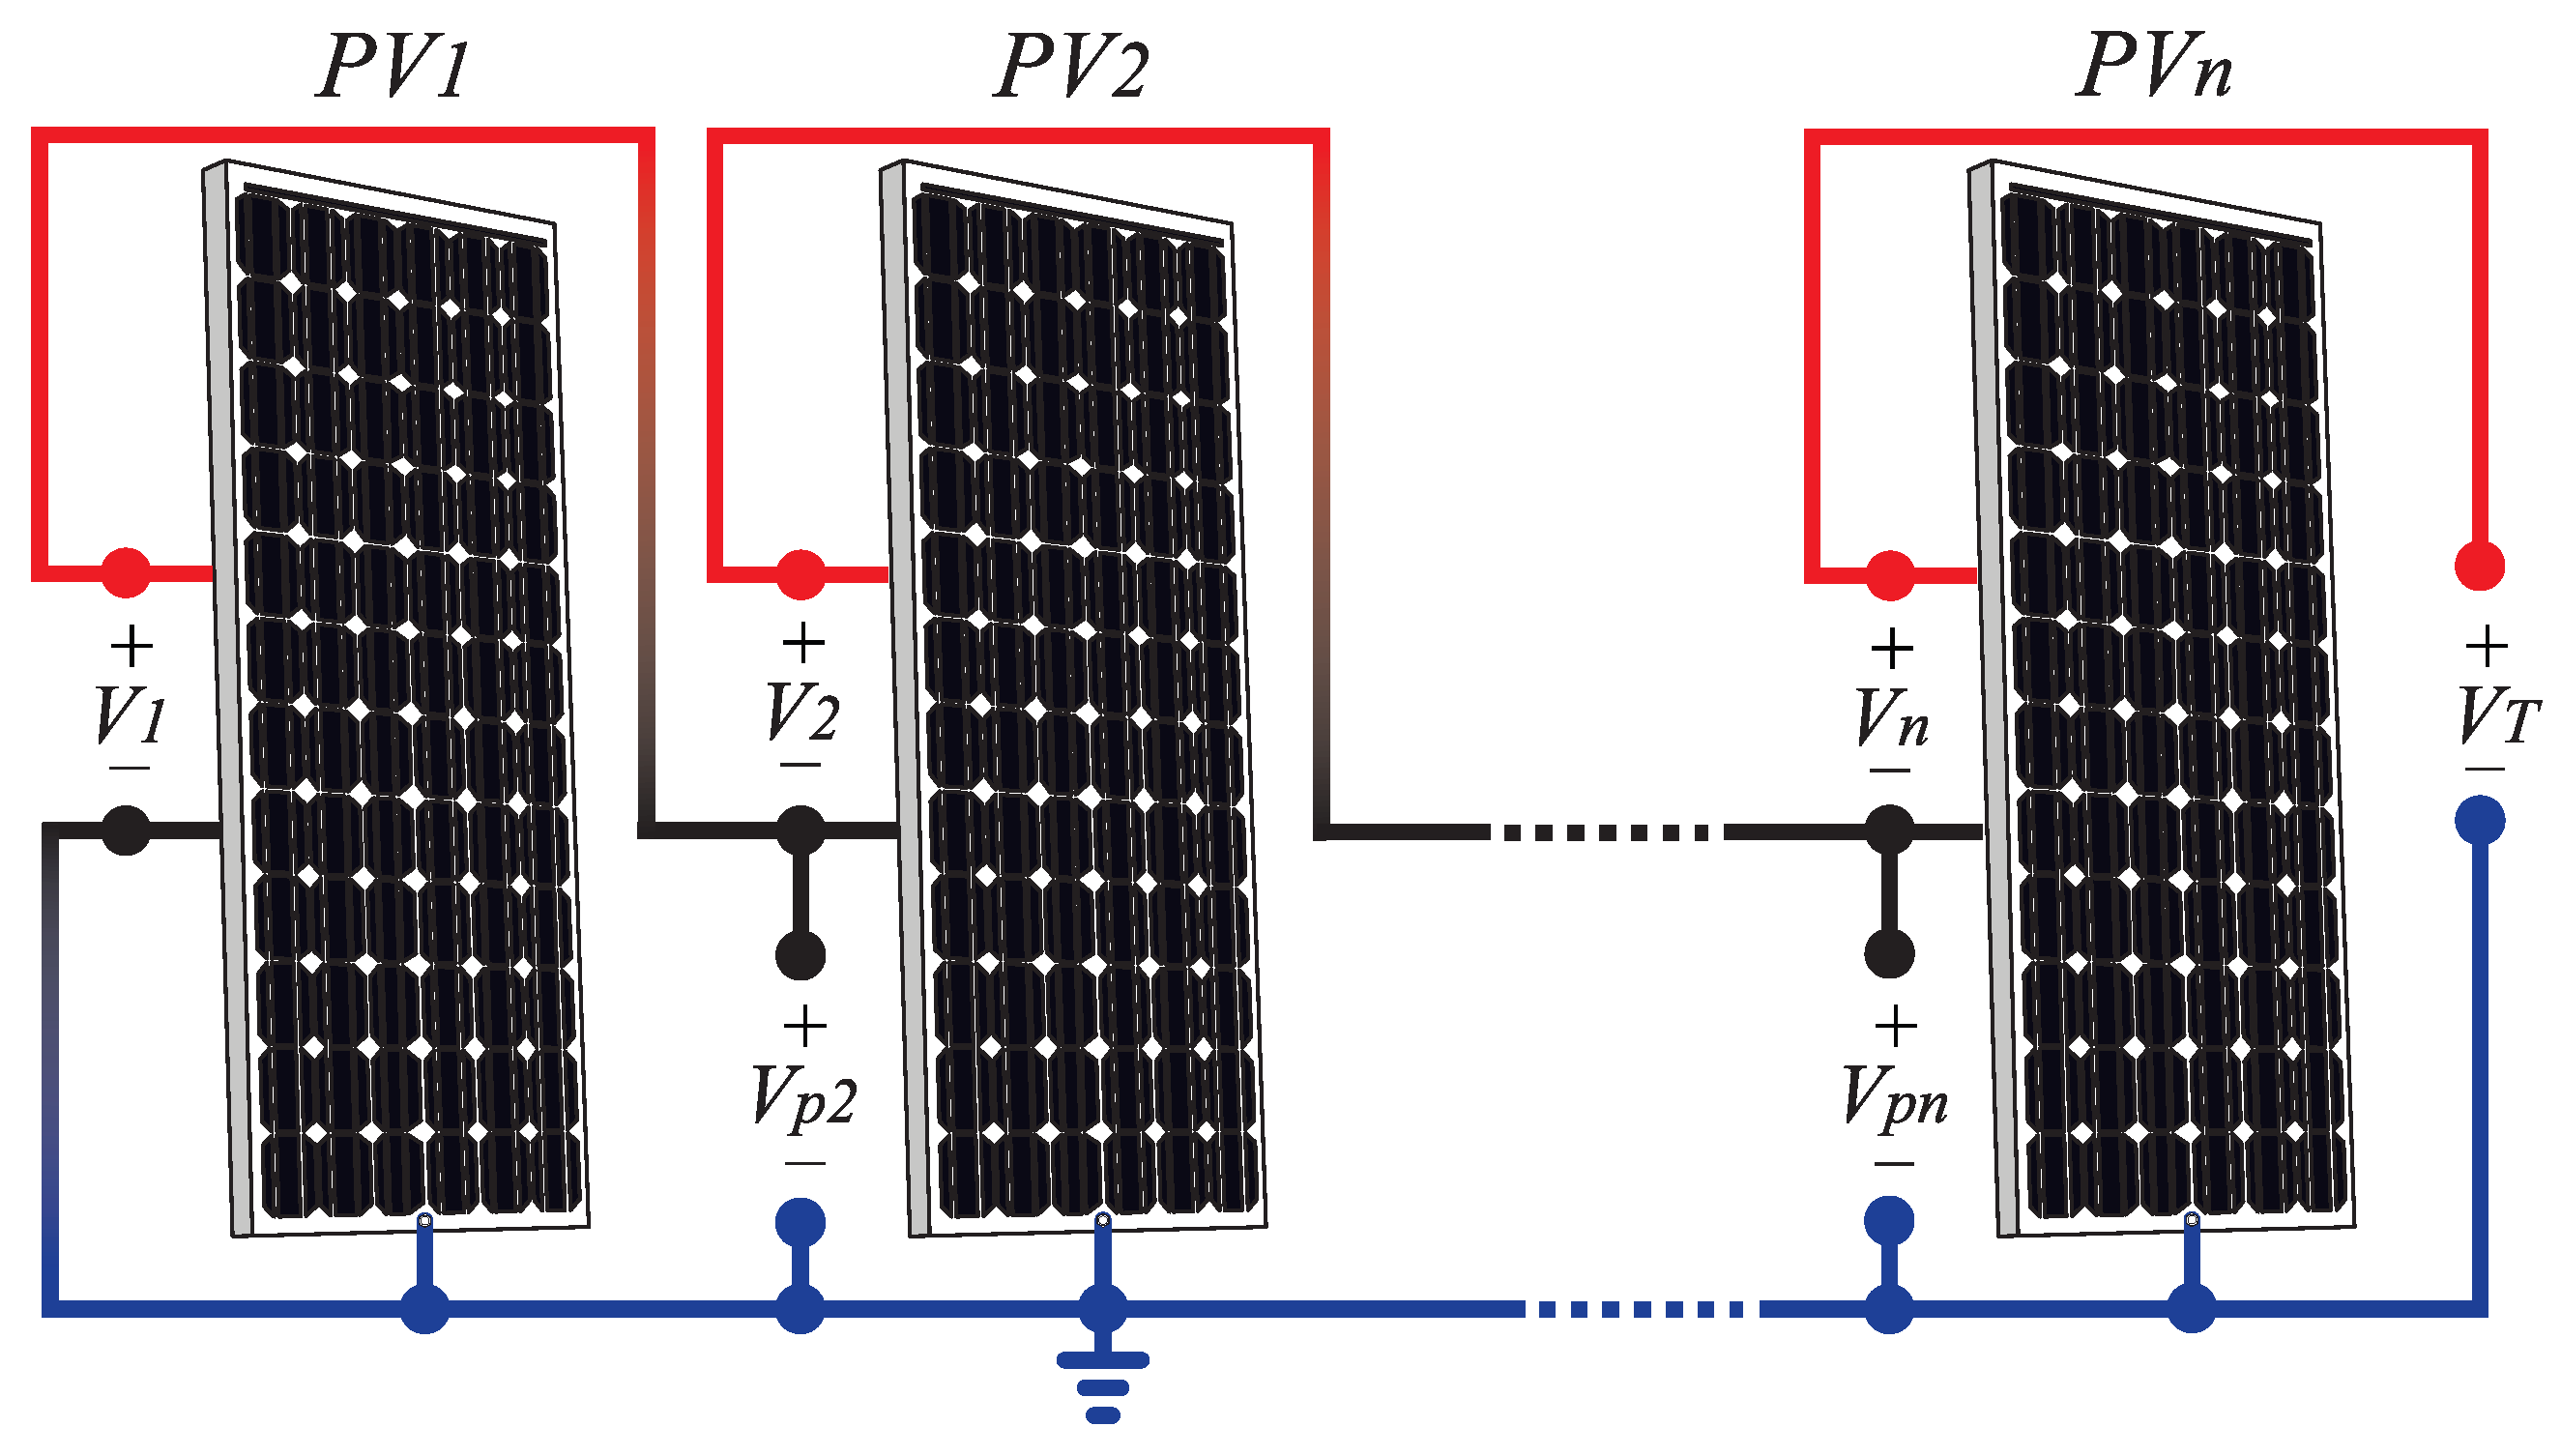
2. Photovoltaic Panel Degradation
2.1. Potential Induced Degradation
2.2. Reverse Current Degradation
2.3. Summary
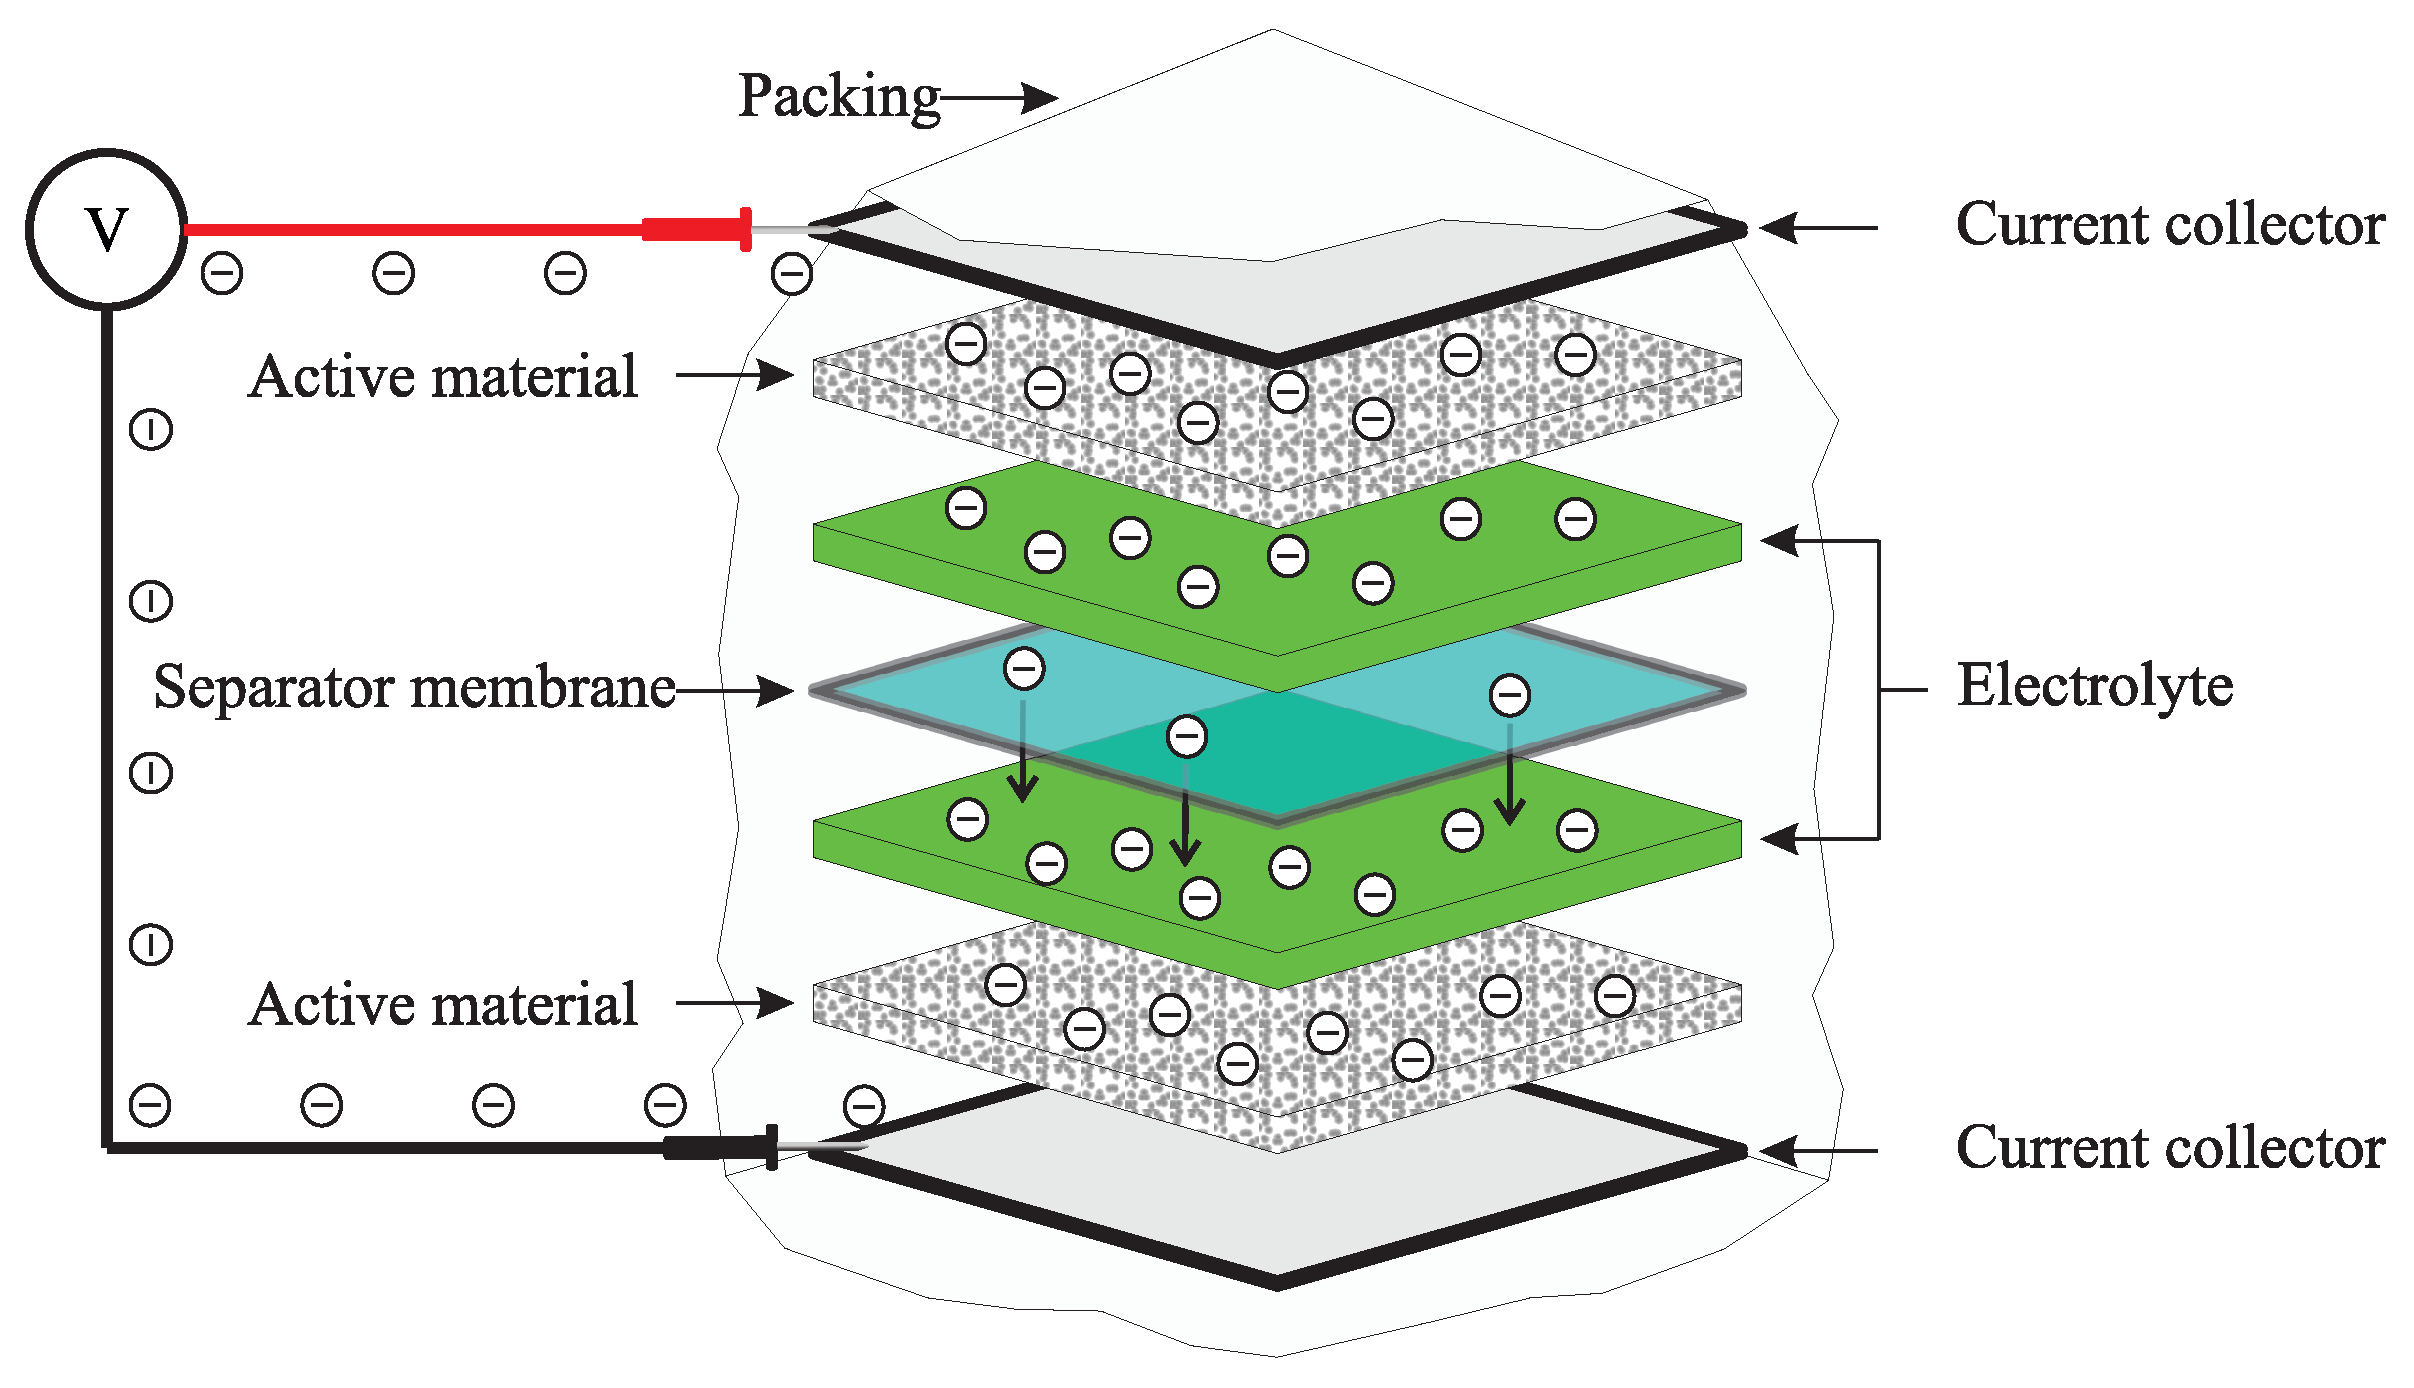
3. Battery Degradation
3.1. Capacity-Fade-Type Degradation
3.2. Power-Fade-Type Degradation
3.3. State of Health
3.4. Summary
4. Fuel Cell Degradation
4.1. Catalyst Surface Degradation
4.2. Degradation by Voltage Oscillations
4.3. Ohmic Overvoltage Degradation
4.4. Activation Overvoltage Degradation
4.5. Degradation Rate
4.6. Summary
5. Supercapacitor/Ultracapacitor Degradation
5.1. Overvoltage Degradation
5.2. Summary
6. Degradation in Eolic, Tidal, and Other Generators and Energy Conversion Systems
7. Conclusions and Additional Opportunity Areas
Author Contributions
Funding
Institutional Review Board Statement
Informed Consent Statement
Acknowledgments
Conflicts of Interest
References
- White, D.; James, W. Digital computer simulation for prediction and analysis of electromagnetic interference. IRE Trans. Commun. Syst. 1961, 9, 148–159. [Google Scholar] [CrossRef]
- Sapolsky, R.M. Stress, the Aging Brain, and the Mechanisms of Neuron Death; The MIT Press: Cambridge, MA, USA, 1992. [Google Scholar]
- Meeker, W.Q.; Escobar, L.A. A review of recent research and current issues in accelerated testing. Int. Stat. Rev./Rev. Int. Stat. 1993, 61, 147–168. [Google Scholar] [CrossRef]
- Gorjian, N.; Ma, L.; Mittinty, M.; Yarlagadda, P.; Sun, Y. A review on degradation models in reliability analysis. In Engineering Asset Lifecycle Management; Springer-Verlag: London, UK, 2010; pp. 369–384. [Google Scholar]
- Konstantinou, C. Towards a Secure and Resilient All-Renewable Energy Grid for Smart Cities. arXiv 2021, arXiv:2101.10570. [Google Scholar]
- Li, Q.; Wang, T.; Li, S.; Chen, W.; Liu, H.; Breaz, E.; Gao, F. Online extremum seeking-based optimized energy management strategy for hybrid electric tram considering fuel cell degradation. Appl. Energy 2021, 285, 116505. [Google Scholar] [CrossRef]
- Zhang, Z.; Guan, C.; Liu, Z. Real-time optimization energy management strategy for fuel cell hybrid ships considering power sources degradation. IEEE Access 2020, 8, 87046–87059. [Google Scholar] [CrossRef]
- Zhu, D. Energy Management of the Embedded Hydride Tanks Considering Efficiency Degradation and Life Span on Fuel Cell Vehicles. Ph.D. Thesis, Bourgogne Franche-Comté, Bourgogne, France, 2020. [Google Scholar]
- Aghdam, F.H.; Kalantari, N.T.; Mohammadi-Ivatloo, B. A chance-constrained energy management in multi-microgrid systems considering degradation cost of energy storage elements. J. Energy Storage 2020, 29, 101416. [Google Scholar] [CrossRef]
- Guo, N.; Zhang, X.; Zou, Y.; Guo, L.; Du, G. Real-time predictive energy management of plug-in hybrid electric vehicles for coordination of fuel economy and battery degradation. Energy 2020, 214, 119070. [Google Scholar] [CrossRef]
- De Pascali, L.; Biral, F.; Onori, S. Aging-aware optimal energy management control for a parallel hybrid vehicle based on electrochemical-degradation dynamics. IEEE Trans. Veh. Technol. 2020, 69, 10868–10878. [Google Scholar] [CrossRef]
- Li, F.; Cañizares, C.; Lin, Z. Energy management system for dc microgrids considering battery degradation. In Proceedings of the 2020 IEEE Power & Energy Society General Meeting (PESGM), Montreal, QC, Canada, 3–6 August 2020; pp. 1–5. [Google Scholar]
- Collath, N.; Englberger, S.; Jossen, A.; Hesse, H. Reduction of Battery Energy Storage Degradation in Peak Shaving Operation through Load Forecast Dependent Energy Management. In Proceedings of the NEIS 2020, Conference on Sustainable Energy Supply and Energy Storage Systems, VDE, Hamburg, Germany, 14–15 September 2020; pp. 1–6. [Google Scholar]
- Datta, J.; Das, D. Stochastic Energy Management of grid-connected microgrid considering battery degradation cost and renewables penetration. In Proceedings of the 2020 IEEE International Conference on Power Systems Technology (POWERCON), Bangalore, India, 14–16 September 2020; pp. 1–6. [Google Scholar]
- Woody, M.; Arbabzadeh, M.; Lewis, G.M.; Keoleian, G.A.; Stefanopoulou, A. Strategies to limit degradation and maximize Li-ion battery service lifetime-Critical review and guidance for stakeholders. J. Energy Storage 2020, 28, 101231. [Google Scholar] [CrossRef]
- Prokop, M.; Drakselova, M.; Bouzek, K. Review of the experimental study and prediction of Pt-based catalyst degradation during PEM fuel cell operation. Curr. Opin. Electrochem. 2020, 20, 20–27. [Google Scholar] [CrossRef]
- Sorrentino, A.; Sundmacher, K.; Vidakovic-Koch, T. Polymer Electrolyte Fuel Cell Degradation Mechanisms and Their Diagnosis by Frequency Response Analysis Methods: A Review. Energies 2020, 13, 5825. [Google Scholar] [CrossRef]
- Xu, K.; Zhao, X.; Hu, X.; Guo, Z.; Ye, Q.; Li, L.; Song, J.; Song, P. The review of the degradation mechanism of the catalyst layer of membrane electrode assembly in the proton exchange membrane fuel cell. In IOP Conference Series: Earth and Environmental Science; IOP Publishing: Dalian, China, 2020; Volume 558, p. 052041. [Google Scholar]
- Lindig, S.; Kaaya, I.; Weiß, K.A.; Moser, D.; Topic, M. Review of statistical and analytical degradation models for photovoltaic modules and systems as well as related improvements. IEEE J. Photovolt. 2018, 8, 1773–1786. [Google Scholar] [CrossRef]
- Jamil, W.J.; Rahman, H.A.; Shaari, S.; Salam, Z. Performance degradation of photovoltaic power system: Review on mitigation methods. Renew. Sustain. Energy Rev. 2017, 67, 876–891. [Google Scholar] [CrossRef]
- Kaaya, I. Photovoltaic Lifetime Forecast: Models for Long-Term Photovoltaic Degradation Prediction and Forecast. Ph.D. Thesis, University of Malaga, Malaga, Spain, 2020. [Google Scholar]
- Kumar, M.; Kumar, A. Performance assessment and degradation analysis of solar photovoltaic technologies: A review. Renew. Sustain. Energy Rev. 2017, 78, 554–587. [Google Scholar] [CrossRef]
- Miranda, H.F.B.; da Costa, L.P.; Soares, S.O.; da Silva, J.V. Potential induced degradation (PID): Review. In Proceedings of the 2020 IEEE PES Transmission & Distribution Conference and Exhibition-Latin America (T&D LA), Montevideo, Uruguay, 28 September–2 October 2020; pp. 1–6. [Google Scholar]
- Sun, G.; Tu, X.; Wang, R. Research on the potential-induced degradation (PID) of PV modules running in two typical climate regions. Clean Energy 2019, 3, 222–226. [Google Scholar] [CrossRef] [Green Version]
- Annigoni, E.; Virtuani, A.; Sculati-Meillaud, F.; Ballif, C. Modeling Potential-Induced Degradation (PID) of Field-Exposed Crystalline Silicon Solar PV Modules: Focus on a Regeneration Term. In Proceedings of the 2017 IEEE 44th Photovoltaic Specialist Conference (PVSC), Washington, DC, USA, 25–30 June 2017; pp. 2794–2798. [Google Scholar]
- Hattendorf, J.; Loew, R.; Gnehr, W.; Wulff, L.; Koekten, M.; Koshnicharov, D.; Blauaermel, A.; Esquivel, J. Potential induced degradation in mono-crystalline silicon based modules: An acceleration model. In Proceedings of the 27th European PV Solar Energy Conference, Frankfurt, Germany, 24–28 September 2012; pp. 3405–3410. [Google Scholar]
- Braisaz, B.; Duchayne, C.; Van Iseghem, M.; Radouane, K. PV aging model applied to several meteorological conditions. In Proceedings of the 29th European Photovoltaic Solar Energy Conference and Exhibition (EUPVSEC), Amsterdam, The Netherlands, 22–26 September 2014; pp. 22–26. [Google Scholar]
- Taubitz, C.; Schütze, M.; Kröber, M.; Koentopp, M.B. Potential induced degradation: Model calculations and correlation between laboratory tests and outdoor occurrence. In Proceedings of the 29th European Photovoltaic Solar Energy Conference and Exhibition, Amsterdam, The Netherlands, 22–26 September 2014; pp. 2490–2494. [Google Scholar]
- Hocine, L.; Samira, K.M.; Tarek, M.; Salah, N.; Samia, K. Automatic detection of faults in a photovoltaic power plant based on the observation of degradation indicators. Renew. Energy 2021, 164, 603–617. [Google Scholar] [CrossRef]
- Liu, J. Degradation & Partial Shading Study of Photovoltaic Modules in the Field: Enabled by Time-Series Current-Voltage & Power Analysis. Ph.D. Thesis, Case Western Reserve University, Cleveland, OH, USA, 2020. [Google Scholar]
- Ospina, B.; Parra, J.S.; Franco, E.; Orozco-Gutierrez, M.L.; Bastidas-Rodríguez, J.D. Quantification of Photovoltaic Modules Degradation in a String Using Model Based Indicators. In Proceedings of the 2018 IEEE International Conference on Environment and Electrical Engineering and 2018 IEEE Industrial and Commercial Power Systems Europe (EEEIC/I&CPS Europe), Palermo, Italy, 12–15 June 2018; pp. 1–5. [Google Scholar]
- Kichou, S.; Silvestre, S.; Nofuentes, G.; Torres-Ramírez, M.; Chouder, A.; Guasch, D. Characterization of degradation and evaluation of model parameters of amorphous silicon photovoltaic modules under outdoor long term exposure. Energy 2016, 96, 231–241. [Google Scholar] [CrossRef]
- Bastidas-Rodriguez, J.D.; Franco, E.; Petrone, G.; Ramos-Paja, C.A.; Spagnuolo, G. Quantification of photovoltaic module degradation using model based indicators. Math. Comput. Simul. 2017, 131, 101–113. [Google Scholar] [CrossRef]
- Herrmann, W.; Wiesner, W.; Vaassen, W. Hot spot investigations on PV modules-new concepts for a test standard and consequences for module design with respect to bypass diodes. In Proceedings of the Conference Record of the Twenty Sixth IEEE Photovoltaic Specialists Conference-1997, Anaheim, CA, USA, 29 September–3 October 1997; pp. 1129–1132. [Google Scholar]
- Herrmann, W.; Adrian, M.; Wiesner, W.; Rheinland, T. Operational behaviour of commercial solar cells under reverse biased conditions. In Proceedings of the Second World Conference on Photovoltaic Solar Energy Conversion. Citeseer, Vienna, Austria, 6–10 July 1998; pp. 2357–2359. [Google Scholar]
- Sidawi, J.; Habchi, R.; Abboud, N.; Jaafar, A.; Al Allouch, F.; Moussa, G.E.H.; Aillerie, M.; Petit, P.; Zegaoui, A.; Salame, C. The effect of reverse current on the dark properties of photovoltaic solar modules. Energy Procedia 2011, 6, 743–749. [Google Scholar] [CrossRef]
- Sidawi, J.; Zaraket, C.; Habchi, R.; Bassil, N.; Salame, C.; Aillerie, M.; Charles, J.P. Evolution of photovoltaic solar modules dark properties after exposition to electrical reverse stress current inducing thermal effect. Microelectron. Int. 2014, 31, 90–98. [Google Scholar] [CrossRef]
- Zhang, X.; Zhu, L.; Zhang, J.; Bao, F.; Wang, W.; Wang, F. Discussion on the necessity of anti-reverse current diode in photovoltaic lightning protective combined box. Low Volt. Appar. 2013, 8, 36–38. [Google Scholar]
- Jung, T.H.; Kang, G.H.; Ahn, H.K. Optimal Design of PV Module with Bypass Diode to Reduce Degradation due to Reverse Excess Current. Trans. Electr. Electron. Mater. 2014, 15, 279–283. [Google Scholar] [CrossRef] [Green Version]
- Spotnitz, R. Simulation of capacity fade in lithium-ion batteries. J. Power Sources 2003, 113, 72–80. [Google Scholar] [CrossRef]
- Zhang, J.; Lee, J. A review on prognostics and health monitoring of Li-ion battery. J. Power Sources 2011, 196, 6007–6014. [Google Scholar] [CrossRef]
- Cherry, J.; Merichko, T. Battery Durability in Electrified Vehicle Applications: A Review of Degradation Mechanisms and Durability Testing; Prepared for Environmental Protection Agency: Ann Arbor, MI, USA, 2015. [Google Scholar]
- Marquis, S.G.; Sulzer, V.; Timms, R.; Please, C.P.; Chapman, S.J. An asymptotic derivation of a single particle model with electrolyte. J. Electrochem. Soc. 2019, 166, A3693. [Google Scholar] [CrossRef] [Green Version]
- Dingrando, L.; Barr, L. Chemistry: Matter and Change; McGraw-Hill Glencoe: New York, NY, USA, 2005. [Google Scholar]
- Hamedi, A.S.; Rajabi-Ghahnavieh, A. Explicit degradation modelling in optimal lead–acid battery use for photovoltaic systems. IET Gener. Transm. Distrib. 2016, 10, 1098–1106. [Google Scholar] [CrossRef]
- Schiffer, J.; Sauer, D.U.; Bindner, H.; Cronin, T.; Lundsager, P.; Kaiser, R. Model prediction for ranking lead-acid batteries according to expected lifetime in renewable energy systems and autonomous power-supply systems. J. Power Sources 2007, 168, 66–78. [Google Scholar] [CrossRef]
- Wang, J.; Liu, P.; Hicks-Garner, J.; Sherman, E.; Soukiazian, S.; Verbrugge, M.; Tataria, H.; Musser, J.; Finamore, P. Cycle-life model for graphite-LiFePO4 cells. J. Power Sources 2011, 196, 3942–3948. [Google Scholar] [CrossRef]
- Wang, J.; Purewal, J.; Liu, P.; Hicks-Garner, J.; Soukazian, S.; Sherman, E.; Sorenson, A.; Vu, L.; Tataria, H.; Verbrugge, M.W. Degradation of lithium ion batteries employing graphite negatives and nickel–cobalt–manganese oxide+ spinel manganese oxide positives: Part 1, aging mechanisms and life estimation. J. Power Sources 2014, 269, 937–948. [Google Scholar] [CrossRef]
- Sarasketa-Zabala, E.; Gandiaga, I.; Martinez-Laserna, E.; Rodriguez-Martinez, L.; Villarreal, I. Cycle ageing analysis of a LiFePO4/graphite cell with dynamic model validations: Towards realistic lifetime predictions. J. Power Sources 2015, 275, 573–587. [Google Scholar] [CrossRef]
- Todeschini, F.; Onori, S.; Rizzoni, G. An experimentally validated capacity degradation model for Li-ion batteries in PHEVs applications. IFAC Proc. Vol. 2012, 45, 456–461. [Google Scholar] [CrossRef]
- Ecker, M.; Gerschler, J.B.; Vogel, J.; Käbitz, S.; Hust, F.; Dechent, P.; Sauer, D.U. Development of a lifetime prediction model for lithium-ion batteries based on extended accelerated aging test data. J. Power Sources 2012, 215, 248–257. [Google Scholar] [CrossRef]
- Lunz, B.; Yan, Z.; Gerschler, J.B.; Sauer, D.U. Influence of plug-in hybrid electric vehicle charging strategies on charging and battery degradation costs. Energy Policy 2012, 46, 511–519. [Google Scholar] [CrossRef]
- Yang, Q.; Li, J.; Cao, W.; Li, S.; Lin, J.; Huo, D.; He, H. An improved vehicle to the grid method with battery longevity management in a microgrid application. Energy 2020, 198, 117374. [Google Scholar] [CrossRef]
- Hoke, A.; Brissette, A.; Maksimović, D.; Pratt, A.; Smith, K. Electric vehicle charge optimization including effects of lithium-ion battery degradation. In Proceedings of the 2011 IEEE Vehicle Power and Propulsion Conference, Chicago, IL, USA, 6–9 September 2011; pp. 1–8. [Google Scholar]
- Omar, N.; Monem, M.A.; Firouz, Y.; Salminen, J.; Smekens, J.; Hegazy, O.; Gaulous, H.; Mulder, G.; Van den Bossche, P.; Coosemans, T.; et al. Lithium iron phosphate based battery–Assessment of the aging parameters and development of cycle life model. Appl. Energy 2014, 113, 1575–1585. [Google Scholar] [CrossRef]
- Xu, B.; Oudalov, A.; Ulbig, A.; Andersson, G.; Kirschen, D.S. Modeling of lithium-ion battery degradation for cell life assessment. IEEE Trans. Smart Grid 2016, 9, 1131–1140. [Google Scholar] [CrossRef]
- Ahmed, R.; El Sayed, M.; Arasaratnam, I.; Tjong, J.; Habibi, S. Reduced-order electrochemical model parameters identification and soc estimation for healthy and aged li-ion batteries part i: Parameterization model development for healthy batteries. IEEE J. Emerg. Sel. Top. Power Electron. 2014, 2, 659–677. [Google Scholar] [CrossRef]
- Ahmed, R.; El Sayed, M.; Arasaratnam, I.; Tjong, J.; Habibi, S. Reduced-order electrochemical model parameters identification and state of charge estimation for healthy and aged Li-ion batteries—Part II: Aged battery model and state of charge estimation. IEEE J. Emerg. Sel. Top. Power Electron. 2014, 2, 678–690. [Google Scholar] [CrossRef]
- Prada, E.; Di Domenico, D.; Creff, Y.; Bernard, J.; Sauvant-Moynot, V.; Huet, F. A simplified electrochemical and thermal aging model of LiFePO4-graphite Li-ion batteries: Power and capacity fade simulations. J. Electrochem. Soc. 2013, 160, A616. [Google Scholar] [CrossRef] [Green Version]
- Guo, J.; Yang, J.; Lin, Z.; Serrano, C.; Cortes, A.M. Impact Analysis of V2G Services on EV Battery Degradation—A Review. In Proceedings of the 2019 IEEE Milan PowerTech, Milan, Italy, 23–27 June 2019; pp. 1–6. [Google Scholar]
- Cordoba-Arenas, A.; Onori, S.; Guezennec, Y.; Rizzoni, G. Capacity and power fade cycle-life model for plug-in hybrid electric vehicle lithium-ion battery cells containing blended spinel and layered-oxide positive electrodes. J. Power Sources 2015, 278, 473–483. [Google Scholar] [CrossRef] [Green Version]
- Li, Y.; Zhong, S.; Zhong, Q.; Shi, K. Lithium-ion battery state of health monitoring based on ensemble learning. IEEE Access 2019, 7, 8754–8762. [Google Scholar] [CrossRef]
- Weng, C.; Sun, J.; Peng, H. A unified open-circuit-voltage model of lithium-ion batteries for state-of-charge estimation and state-of-health monitoring. J. Power Sources 2014, 258, 228–237. [Google Scholar] [CrossRef]
- Sajfar, I.; Malaric, M.; Bullough, R. Sealed batteries in transient limiting distribution networks-methods of measuring their internal resistance. In Proceedings of the IEEE 12th International Conference on Telecommunications Energy, Orlando, FL, USA, 22–25 October 1990; pp. 458–463. [Google Scholar]
- Wang, K.; Gao, F.; Zhu, Y.; Liu, H.; Qi, C.; Yang, K.; Jiao, Q. Internal resistance and heat generation of soft package Li4Ti5O12 battery during charge and discharge. Energy 2018, 149, 364–374. [Google Scholar] [CrossRef]
- Dubarry, M.; Svoboda, V.; Hwu, R.; Liaw, B.Y. Incremental capacity analysis and close-to-equilibrium OCV measurements to quantify capacity fade in commercial rechargeable lithium batteries. Electrochem. Solid State Lett. 2006, 9, A454. [Google Scholar] [CrossRef]
- Weng, C.; Feng, X.; Sun, J.; Peng, H. State-of-health monitoring of lithium-ion battery modules and packs via incremental capacity peak tracking. Appl. Energy 2016, 180, 360–368. [Google Scholar] [CrossRef] [Green Version]
- Pang, X.; Huang, R.; Wen, J.; Shi, Y.; Jia, J.; Zeng, J. A lithium-ion battery RUL prediction method considering the capacity regeneration phenomenon. Energies 2019, 12, 2247. [Google Scholar] [CrossRef] [Green Version]
- Liu, D.; Pang, J.; Zhou, J.; Peng, Y.; Pecht, M. Prognostics for state of health estimation of lithium-ion batteries based on combination Gaussian process functional regression. Microelectron. Reliab. 2013, 53, 832–839. [Google Scholar] [CrossRef]
- Olivares, B.E.; Cerda Munoz, M.A.; Orchard, M.E.; Silva, J.F. Particle-Filtering-Based Prognosis Framework for Energy Storage Devices With a Statistical Characterization of State-of-Health Regeneration Phenomena. IEEE Trans. Instrum. Meas. 2013, 62, 364–376. [Google Scholar] [CrossRef]
- Shi, Y. Modeling, Real-Time Degradation Identification, and Remediation of Lead-Acid Battries. Ph.D. Thesis, The Pennsylvania State University, State College, PA, USA, 2013. [Google Scholar]
- Hawkes, A.; Brett, D.; Brandon, N. Fuel cell micro-CHP techno-economics: Part 2–Model application to consider the economic and environmental impact of stack degradation. Int. J. Hydrogen Energy 2009, 34, 9558–9569. [Google Scholar] [CrossRef]
- Thangavelautham, J.; Dubowsky, S. On the Catalytic Degradation in Fuel Cell Power Supplies for Long-Life Mobile Field Sensors. Fuel Cells 2013, 13, 181–195. [Google Scholar] [CrossRef]
- Thangavelautham, J.; Strawser, D.D.; Dubowsky, S. The design of long-life, high-efficiency PEM fuel cell power supplies for low power sensor networks. Int. J. Hydrogen Energy 2017, 42, 20277–20296. [Google Scholar] [CrossRef] [Green Version]
- Lu, L.; Ouyang, M.; Huang, H.; Pei, P.; Yang, F. A semi-empirical voltage degradation model for a low-pressure proton exchange membrane fuel cell stack under bus city driving cycles. J. Power Sources 2007, 164, 306–314. [Google Scholar] [CrossRef]
- Kianimanesh, A.; Yang, Q.; Park, S.; Xue, D.; Freiheit, T. Model for the Degradation Performance of a Single-Cell Direct Methanol Fuel Cell under Varying Operational Conditions. Fuel Cells 2013, 13, 1005–1017. [Google Scholar] [CrossRef]
- Zhang, H.; Williams, M.C. Model for evaluating degradation of high-temperature fuel cell heat engine systems. Int. J. Hydrogen Energy 2016, 41, 14230–14238. [Google Scholar] [CrossRef]
- Cayan, F.; Pakalapati, S.; Celik, I.; Xu, C.; Zondlo, J. A degradation model for solid oxide fuel cell anodes due to impurities in coal syngas: Part i theory and validation. Fuel Cells 2012, 12, 464–473. [Google Scholar] [CrossRef]
- Verda, V.; von Spakovsky, M.R. Development of a detailed planar solid oxide fuel cell computational fluid dynamics model for analyzing cell performance degradation. J. Fuel Cell Sci. Technol. 2009, 6. [Google Scholar] [CrossRef]
- Zaccaria, V.; Traverso, A.; Tucker, D. A real-time degradation model for hardware in the loop simulation of fuel cell gas turbine hybrid systems. In Proceedings of the ASME Turbo Expo 2015, Montreal, QC, Canada, 15–19 June 2015. [Google Scholar]
- Bueno, P.R. Nanoscale origins of super-capacitance phenomena. J. Power Sources 2019, 414, 420–434. [Google Scholar] [CrossRef]
- Gulzar, U.; Goriparti, S.; Miele, E.; Li, T.; Maidecchi, G.; Toma, A.; De Angelis, F.; Capiglia, C.; Zaccaria, R.P. Next-generation textiles: From embedded supercapacitors to lithium ion batteries. J. Mater. Chem. A 2016, 4, 16771–16800. [Google Scholar] [CrossRef]
- Sedlakova, V.; Sikula, J.; Majzner, J.; Sedlak, P.; Kuparowitz, T.; Buergler, B.; Vasina, P. Supercapacitor degradation assesment by power cycling and calendar life tests. Metrol. Meas. Syst. 2016, 23. [Google Scholar] [CrossRef] [Green Version]
- Kuparowitz, T.; Sedlakova, V.; Sikula, J.; Majzner, J.; Sedlak, P. Supercapacitor degradation and reliability. In Proceedings of the 1st PCNS Passive Components Networking Days, Brno, Czech Republic, 12–15 September 2017; pp. 63–68. [Google Scholar]
- Williard, N.; Baek, D.; Park, J.W.; Choi, B.O.; Osterman, M.; Pecht, M. A life model for supercapacitors. IEEE Trans. Device Mater. Reliab. 2015, 15, 519–528. [Google Scholar] [CrossRef]
- Enisz, K.; Kohlrusz, G.; Fodor, D.; Kovacs, L.; Marschalko, R. Degradation Analysis of DC-Link Aluminium Electrolytic Capacitors Operating in PWM Power Converters. Adv. Electr. Electron. Eng. 2020. [Google Scholar] [CrossRef]
- Florkowska, B.; Florkowski, M.; Roehrich, J.; Zydron, P. The influence of PWM stresses on degradation processes in electrical insulation systems. In Proceedings of the IEEE 2010 Annual Report Conference on Electrical Insulation and Dielectic Phenomena, West Lafayette, IN, USA, 17–20 October 2010; pp. 1–4. [Google Scholar]
- Castillo, S.J.; Balog, R.S.; Enjeti, P. Predicting capacitor reliability in a module-integrated photovoltaic inverter using stress factors from an environmental usage model. In Proceedings of the IEEE North American Power Symposium 2010, Arlington, TX, USA, 26–28 September 2010; pp. 1–6. [Google Scholar]
- Sato, K.; Navarro, D.; Sekizaki, S.; Zoka, Y.; Yorino, N.; Mattausch, H.J.; Miura-Mattausch, M. Prediction of DC-AC Converter Efficiency Degradation due to Device Aging Using a Compact MOSFET-Aging Model. IEICE Trans. Electron. 2019. [Google Scholar] [CrossRef]
- De Barros, R.C.; da Silveira Brito, E.M.; do Couto Boaventura, W.; Pereira, H.A.; Cupertino, A.F. Methodology for bondwire lifetime evaluation of multifunctional PV inverter during harmonic current compensation. Int. J. Electr. Power Energy Syst. 2021, 128, 106711. [Google Scholar] [CrossRef]
- De Barros, R.; Brito, E.; Rodrigues, G.G.; Mendes, V.; Cupertino, A.F.; Pereira, H.A. Lifetime evaluation of a multifunctional PV single-phase inverter during harmonic current compensation. Microelectron. Reliab. 2018, 88, 1071–1076. [Google Scholar] [CrossRef]
- Roy, S.; Hanif, A.; Khan, F. Degradation Detection of Power Switches in a Live Three Phase Inverter using SSTDR Signal Embedded PWM Sequence. In Proceedings of the 2020 IEEE International Reliability Physics Symposium (IRPS), Dallas, TX, USA, 28 April–30 May 2020; pp. 1–7. [Google Scholar]
- Chen, C.; Xie, G.; Tang, C.; Sheng, K. Investigation of Gate Degradation Characteristics of AlGaN/GaN HEMTs under PWM Stress. Adv. Mater. Res. 2013, 732, 1255–1260. [Google Scholar] [CrossRef]
- Fischer, K.; Stalin, T.; Ramberg, H.; Wenske, J.; Wetter, G.; Karlsson, R.; Thiringer, T. Field-experience based root-cause analysis of power-converter failure in wind turbines. IEEE Trans. Power Electron. 2014, 30, 2481–2492. [Google Scholar] [CrossRef]
- Fischer, K.; Pelka, K.; Bartschat, A.; Tegtmeier, B.; Coronado, D.; Broer, C.; Wenske, J. Reliability of power converters in wind turbines: Exploratory analysis of failure and operating data from a worldwide turbine fleet. IEEE Trans. Power Electron. 2018, 34, 6332–6344. [Google Scholar] [CrossRef]
- Ma, K.; Liserre, M.; Blaabjerg, F.; Kerekes, T. Thermal loading and lifetime estimation for power device considering mission profiles in wind power converter. IEEE Trans. Power Electron. 2014, 30, 590–602. [Google Scholar] [CrossRef]
- Yang, Z.; Chai, Y. A survey of fault diagnosis for onshore grid-connected converter in wind energy conversion systems. Renew. Sustain. Energy Rev. 2016, 66, 345–359. [Google Scholar] [CrossRef]
- Yang, B.B.; Armijo, K.M.; Harrison, R.K.; Thomas, K.E.; Johnson, J.; Taylor, J.M.; Sorensen, N.R. Arc fault risk assessment and degradation model development for photovoltaic connectors. In Proceedings of the 2014 IEEE 40th Photovoltaic Specialist Conference (PVSC), Denver, CO, USA, 8–13 June 2014; pp. 3549–3555. [Google Scholar]
- Yang, B.B.; Sorensen, N.R.; Burton, P.D.; Taylor, J.M.; Kilgo, A.C.; Robinson, D.G.; Granata, J.E. Reliability model development for photovoltaic connector lifetime prediction capabilities. In Proceedings of the 2013 IEEE 39th Photovoltaic Specialists Conference (PVSC), Tampa, FL, USA, 16–21 June 2013; pp. 0139–0144. [Google Scholar]
- Venkatesh, P.S.; Chandran, V.; Anil, S. Study of Flywheel Energy Storage in a Pure EV Powertrain in a Parallel Hybrid Setup and Development of a Novel Flywheel Design for Regeneration Efficiency Improvement; Technical Report; SAE Technical Paper: New York, NY, USA, 2021. [Google Scholar]
- Pullen, K.R. The status and future of flywheel energy storage. Joule 2019, 3, 1394–1399. [Google Scholar] [CrossRef]
- Hutchinson, A.; Gladwin, D.T. Optimisation of a wind power site through utilisation of flywheel energy storage technology. Energy Rep. 2020, 6, 259–265. [Google Scholar] [CrossRef]


| Symbol | Description | Units |
|---|---|---|
| P | Actual attainable power | W |
| Rated power | W | |
| Shunt resistance | ||
| Frame voltage, respect to ground | V |
| Reference | Degradation | Regeneration | PRM | Variables | Complexity |
|---|---|---|---|---|---|
| [25] | Yes | Yes | 4 | Low | |
| [26] | Yes | No | 9 | Medium | |
| [27] | Yes | No | 7 | Medium | |
| [28] | Yes | Yes | 9 | Medium |
| Symbol | Description | Units |
|---|---|---|
| Ampere-hour throughput | ||
| Cycling percentage capacity-deficit | % | |
| Capacity degradation | % | |
| Cycle-average depth of discharge | % | |
| Cycle state of charge variation | % | |
| Depth of discharge | % | |
| Discharge rate | ||
| Current pulse | A | |
| Capacity fade degradation | % | |
| n | Actual charge/discharge cycle | |
| Cycles before 20% degradation | ||
| Open circuit voltage | V | |
| Q | Battery capacity | |
| Capacity loss | % | |
| Internal series-resistance | ||
| Cycle-average state of charge | % | |
| State of charge | % | |
| Time for charge-depleting/charge-sustaining | s | |
| Absolute cell temperature | ||
| V | Actual voltage | V |
| Data-sheet rated cycles | ||
| Weighted number of cycles |
| Reference | Type | PRM | Variables | Error | Complexity |
|---|---|---|---|---|---|
| [45,46] | CFD | 3 | - | Low | |
| [47] | CFD | 4 | - | Medium | |
| [48] | CFD | 8 | 5% | High | |
| [49] | CFD | 6 | RMS | Low | |
| [50] | CFD | 3 | RMS | Low | |
| [51] | CFD | 6 | - | Medium | |
| [54] | CFD | 2 | - | Low | |
| [55] | CFD | 4 | 5.4% | Low | |
| [56] | CFD | 2 | 14% | Low | |
| [56] | CFD | 3 | 14% | Low | |
| [61] | PFD | 7 | RMS | Low | |
| [63] | SOH | 11 | 1.01% | High | |
| [67] | SOH | 11 | - | High |
| Symbol | Description | Units |
|---|---|---|
| Airflow rate | CFM | |
| Tafel slope | V | |
| Voltage drop | V | |
| Fuel utilization | % | |
| Exchange current density | ||
| History index for the airflow rate | ||
| History index for the methanol concentration | ||
| Actual current density | ||
| History index for the methanol flow rate | ||
| History index for the inner temperature | ||
| Voltage oscillation amplitude | V | |
| Degradation rate | % | |
| S | Catalyst’s EC active surface area | |
| Remaining life | year | |
| Activation overvoltage | V | |
| Actual output voltage | V | |
| Ohmic overvoltage loss | V | |
| Open circuit voltage before any degradation | V | |
| Voltage at the maximum power output voltage | V | |
| Cell voltage | V |
| Reference | Fuel Cell | PRM | Variables | Error | Complexity |
|---|---|---|---|---|---|
| [73] | PEMFC | 4 | 4% | High | |
| [74] | PEMFC | 7 | - | Medium | |
| [75] | PEMFC | 4 | - | Medium | |
| [76] | DMFC | 5 | High | ||
| [76] | DMFC | 5 | High | ||
| [75] | PEMFC | 8 | - | High | |
| [77,78,79] | SOFC | 1 | - | Medium | |
| [80] | SOFC | 5 | - | High |
| Symbol | Description | Units |
|---|---|---|
| Expected operating life | h | |
| Rated life | h | |
| Core temperature | ||
| Temperature for the rated life | ||
| Actual operational voltage | V | |
| Rated voltage | V |
| Reference | Brand | PRM | Variables | Error | Complexity |
|---|---|---|---|---|---|
| [85] | LS Mtron | 2 | h | Low |
| Device | Cycling | Overvoltage | Overcurrent | V/I Rate | Reverse V/I | Amp. (Osc.) | Freq. (Osc.) | ||
|---|---|---|---|---|---|---|---|---|---|
| Battery | [42], | [52,56], | [42], | [42,65,67], | [42,57,58,59], | [47,48,49,50,51,52], | [68,69,70,71]. | ||
| [49,50,51,52], | [61,63,67], | [45,46,47], | [66]. | [59,64]. | [55], | ||||
| [54,55,56]. | [66]. | [50,52], | [57,58,59], | ||||||
| [53], | [61,64]. | ||||||||
| [56,57,58,59]. | |||||||||
| Fuel cell | N/A | N/A | [72]. | [72,73,74]. | [72,73], | [73]. | [74]. | ||
| [75,76,77,78,79,80]. | |||||||||
| PVM | N/A | N/A | N/A | [29,30,31]. | [29,30,31]. | [30]. | [23,24,25,26,27,28], | ||
| [34,35,36,37,38,39]. | |||||||||
| Supercapacitor | [83,84]. | [83,84]. | [83,84,85]. | [83,84]. | |||||
| Converter | N/A | N/A | [89] | [90,91]. | |||||
| Power switch | N/A | N/A | [92,93]. | ||||||
| Capacitor | [86]. | ||||||||
| Wiring | N/A | N/A | N/A | [87]. |
Publisher’s Note: MDPI stays neutral with regard to jurisdictional claims in published maps and institutional affiliations. |
© 2021 by the authors. Licensee MDPI, Basel, Switzerland. This article is an open access article distributed under the terms and conditions of the Creative Commons Attribution (CC BY) license (https://creativecommons.org/licenses/by/4.0/).
Share and Cite
Rodríguez Licea, M.A.; Pérez Pinal, F.J.; Soriano Sánchez, A.G. An Overview on Electric-Stress Degradation Empirical Models for Electrochemical Devices in Smart Grids. Energies 2021, 14, 2117. https://doi.org/10.3390/en14082117
Rodríguez Licea MA, Pérez Pinal FJ, Soriano Sánchez AG. An Overview on Electric-Stress Degradation Empirical Models for Electrochemical Devices in Smart Grids. Energies. 2021; 14(8):2117. https://doi.org/10.3390/en14082117
Chicago/Turabian StyleRodríguez Licea, Martín Antonio, Francisco Javier Pérez Pinal, and Allan Giovanni Soriano Sánchez. 2021. "An Overview on Electric-Stress Degradation Empirical Models for Electrochemical Devices in Smart Grids" Energies 14, no. 8: 2117. https://doi.org/10.3390/en14082117