1. Introduction
Lithium-ion batteries (LIB) are today the most important technology for stationary electricity storage. The success of LIB technology is owed to continuously decreasing cell prices and growing energy densities [
1]. The market for stationary batteries can be roughly divided into home storage systems (up to 30 kWh energy capacity, typically used in combination with a rooftop photovoltaic system), industrial storage systems (30 kWh to 1 MWh), and large storage systems (over 1 MWh, typically used for grid services). The main growth market today is in photovoltaic home storage systems, with an installed energy capacity in Germany of ca. 930 MWh by the end of 2018 [
2] and ca. 1500 MWh by the end of 2020 [
3]. The capacity of industrial storage systems in Germany accumulated to 110 MWh, and that of large storage systems to 550 MWh by the end of 2020 [
3]. The costs of stationary lithium-ion battery systems dropped by around 50% between 2013 and 2020 [
4]. By 2040, stationary storage requirement is expected to rise to almost 3 TWh due to the rapid further increase of renewable energy sources [
5].
Despite this economic success, one of the main technical challenges is the uncertain lifetime of LIBs. There is currently no field experience older than ten years, because this technology essentially did not exist before 2013. Published empirical studies are scarce and usually refer only to systems consisting of a single or a few cells representative of the real energy storage system [
6,
7]. In the case of field data, studies are often concerned with the aging of electric vehicle batteries with relatively small single-cell capacity [
8]. To our knowledge, empirical aging data of commercial LIBs in a full-scale commercial stationary storage system has not yet been presented in the literature.
In contrast to battery-level data, there have been many studies of aging and lifetime at the single-cell level using dedicated laboratory experiments [
9,
10,
11,
12,
13,
14,
15]. Data are available for different cell types (chemistries and cell geometries) and cycling conditions (temperature, C-rate). The main conclusion that can be drawn from these studies is that aging is a highly complex and nonlinear phenomenon, depending strongly on operation conditions, mainly temperature, cycle depth, current rate, and resting times. The reader is referred to review articles [
16,
17,
18,
19] for further reading. Physicochemical models have been used to support the understanding of this behavior [
20,
21,
22].
The goal of the present study is to investigate cell and battery aging under realistic but well-controlled operating conditions. Here and in the following, we distinguish between the cell level (single prismatic lithium-ion battery cell), the battery level (commercial battery systems consisting of multiple cells, inverters, housing, etc.), and the microgrid level (local grids with batteries, photovoltaic panels, controllable sinks and a grid connection). The present study combines all these three scales, therefore providing a comprehensive insight.
Within the battery, the type of connection of cells in serial and/or parallel arrangements is referred to as
cell configuration. Both serial configurations and parallel configurations have individual properties, strengths and weaknesses. These are summarized in
Table 1. The general tendency today is to use serial cell configurations to increase the voltage to a level well-suited for DC/AC inverters (for grid-coupled applications) or for high-voltage DC systems (i.e., battery-powered electric vehicles). In the case of serial cell configuration, cell-to-cell capacity variations can influence overall stack performance. The cell with lowest capacity and/or highest internal resistance (IR) can dominate the overall stack behavior by reaching end of charge or end of discharge cut-off voltage much earlier than the other cells. To avoid this problem, elaborate cell-balancing strategies are required, which add cost and complexity to the battery. Even then, the weakest cell is forced into deeper cycles than the other cells, therefore accelerating aging.
Parallel cell configuration has a key advantage in this regard: cell balancing occurs passively as electrical energy is transferred from cell to cell via the parallel connection. Therefore, this configuration is robust to cell-to-cell capacity variations, and there is no need for cell-balancing components. Furthermore, the weakest cell is not necessarily forced into deeper cycles than the other cells, therefore accelerating aging. As a result, it can be expected that cell cost can be reduced by enabling the use of cells of different batches and/or histories together. However, higher ohmic losses occur due to high current through all components (e.g., cables, connectors, sensors, switches), which may increase the overall material cost of the battery. Furthermore, additional safety devices may be needed to rule out possible risks that can be caused by high passive balancing currents between inhomogeneously charged cells.
In the present study, we compare the operation and aging characteristics of two different battery architectures, a standard architecture with 14s1p serial configuration using a single inverter, and a novel architecture with parallel configuration, consisting of two 1s7p strings with individual inverters.
Section 2 describes the experimental methodology.
Section 3 presents the results. A discussion with focus on battery architecture is provided in
Section 4. Finally, conclusions are drawn in
Section 5.
2. Experimental Methodology
We apply a combined experimental methodology on three levels: the single-cell level, the battery level, and the system (microgrid) level, the details of which are described in the following subsections.
2.1. Cell Level
Lithium-ion battery cells with a lithium iron phosphate (LFP) positive electrode and a graphite negative electrode are among the most used chemistries for stationary storage applications due to their high cyclic lifetime and higher safety, compared to chemistries such as nickel manganese cobalt oxide (NMC) [
23,
24]. Throughout the present experiments, 180 Ah commercial LFP/graphite prismatic LIB cells (Shenzhen Sinopoly Battery Co., Ltd., Shenzhen, China, model SP-LFP180AhA) were used. The operating voltage range and nominal voltage are given by the manufacturer as 2.8–3.8 V and 3.2 V, respectively. A detailed electrical, structural and chemical analysis of the single cells is given elsewhere [
25]. According to the data sheet, the electrolyte consists of lithium hexafluorophosphate salt in ethylene carbonate (EC), dimethyl carbonate (DMC), diethyl carbonate (DEC) and ethyl acetate (EA) solvents. The current collectors are made of copper for the negative and aluminum for the positive electrode [
25].
A total of 30 cells were received as a single shipment. All cells underwent an initial characterization under well-defined laboratory conditions, which consisted of capacity tests and internal resistance (IR) measurements (Basytec XCTS) performed at 20 °C ambient temperature (CTS T-40/200 LI climate chamber). Capacity measurements were performed at 0.25 C (45 A) current rate with constant-current (CC) constant-voltage (CV) charge (CV phase cut-off current 0.02 C, 3.6 A) and CC discharge. IR measurements were performed at each 10% state of charge (SOC) from 90% SOC to 10% SOC. These SOCs were set based on the measured real capacity of each individual cell. IR was measured by applying a lower 0.026 C (4.8 A) current pulse for 10 s during a 0.26 C (48 A) continuous CC discharge. From the voltage response, IR was calculated according to
by taking
. As part of this protocol, when the SOC reached 50% and before the IR measurement was carried out, an electrochemical impedance spectrum was recorded (results not shown).
Additionally, for all checkups we also determined the IR from the CC charge/discharge curves as
where
is the average charge voltage between 10% and 90% SOC and
the average discharge voltage between 90% and 10% SOC. In this calculation we must consider the thermodynamic voltage hysteresis known from LFP [
26], which we quantified experimentally for our cell to
.
After initial characterization, 28 selected cells were integrated into two commercial battery systems. The battery-level operation (next section) was interrupted in regular time intervals for single-cell checkups to monitor changes in cell parameters due to system operation. These checkups were carried out after disassembling the battery and performing capacity and IR measurements (Biologic VMP3, Basytec XCTS) under controlled laboratory conditions in the climate chambers set to 20 °C. These measurements were performed with identical protocols as the initial characterization measurements. For this reason, the initial characterization measurements are termed as “Checkup 0”.
The two remaining cells were electrically characterized in detail, and the results were published [
25]. To assess aging under laboratory conditions, they were then subjected to continuous cycling consisting of 0.83 C (150 A) CCCV charge (0.05 C cut-off current) and CC discharge at 20 °C ambient temperature in a climate chamber. One cell was opened after 897 cycles for internal structural and morphological characterization [
25]. The other cell continued to be cycled for 5900 cycles.
2.2. Battery Level
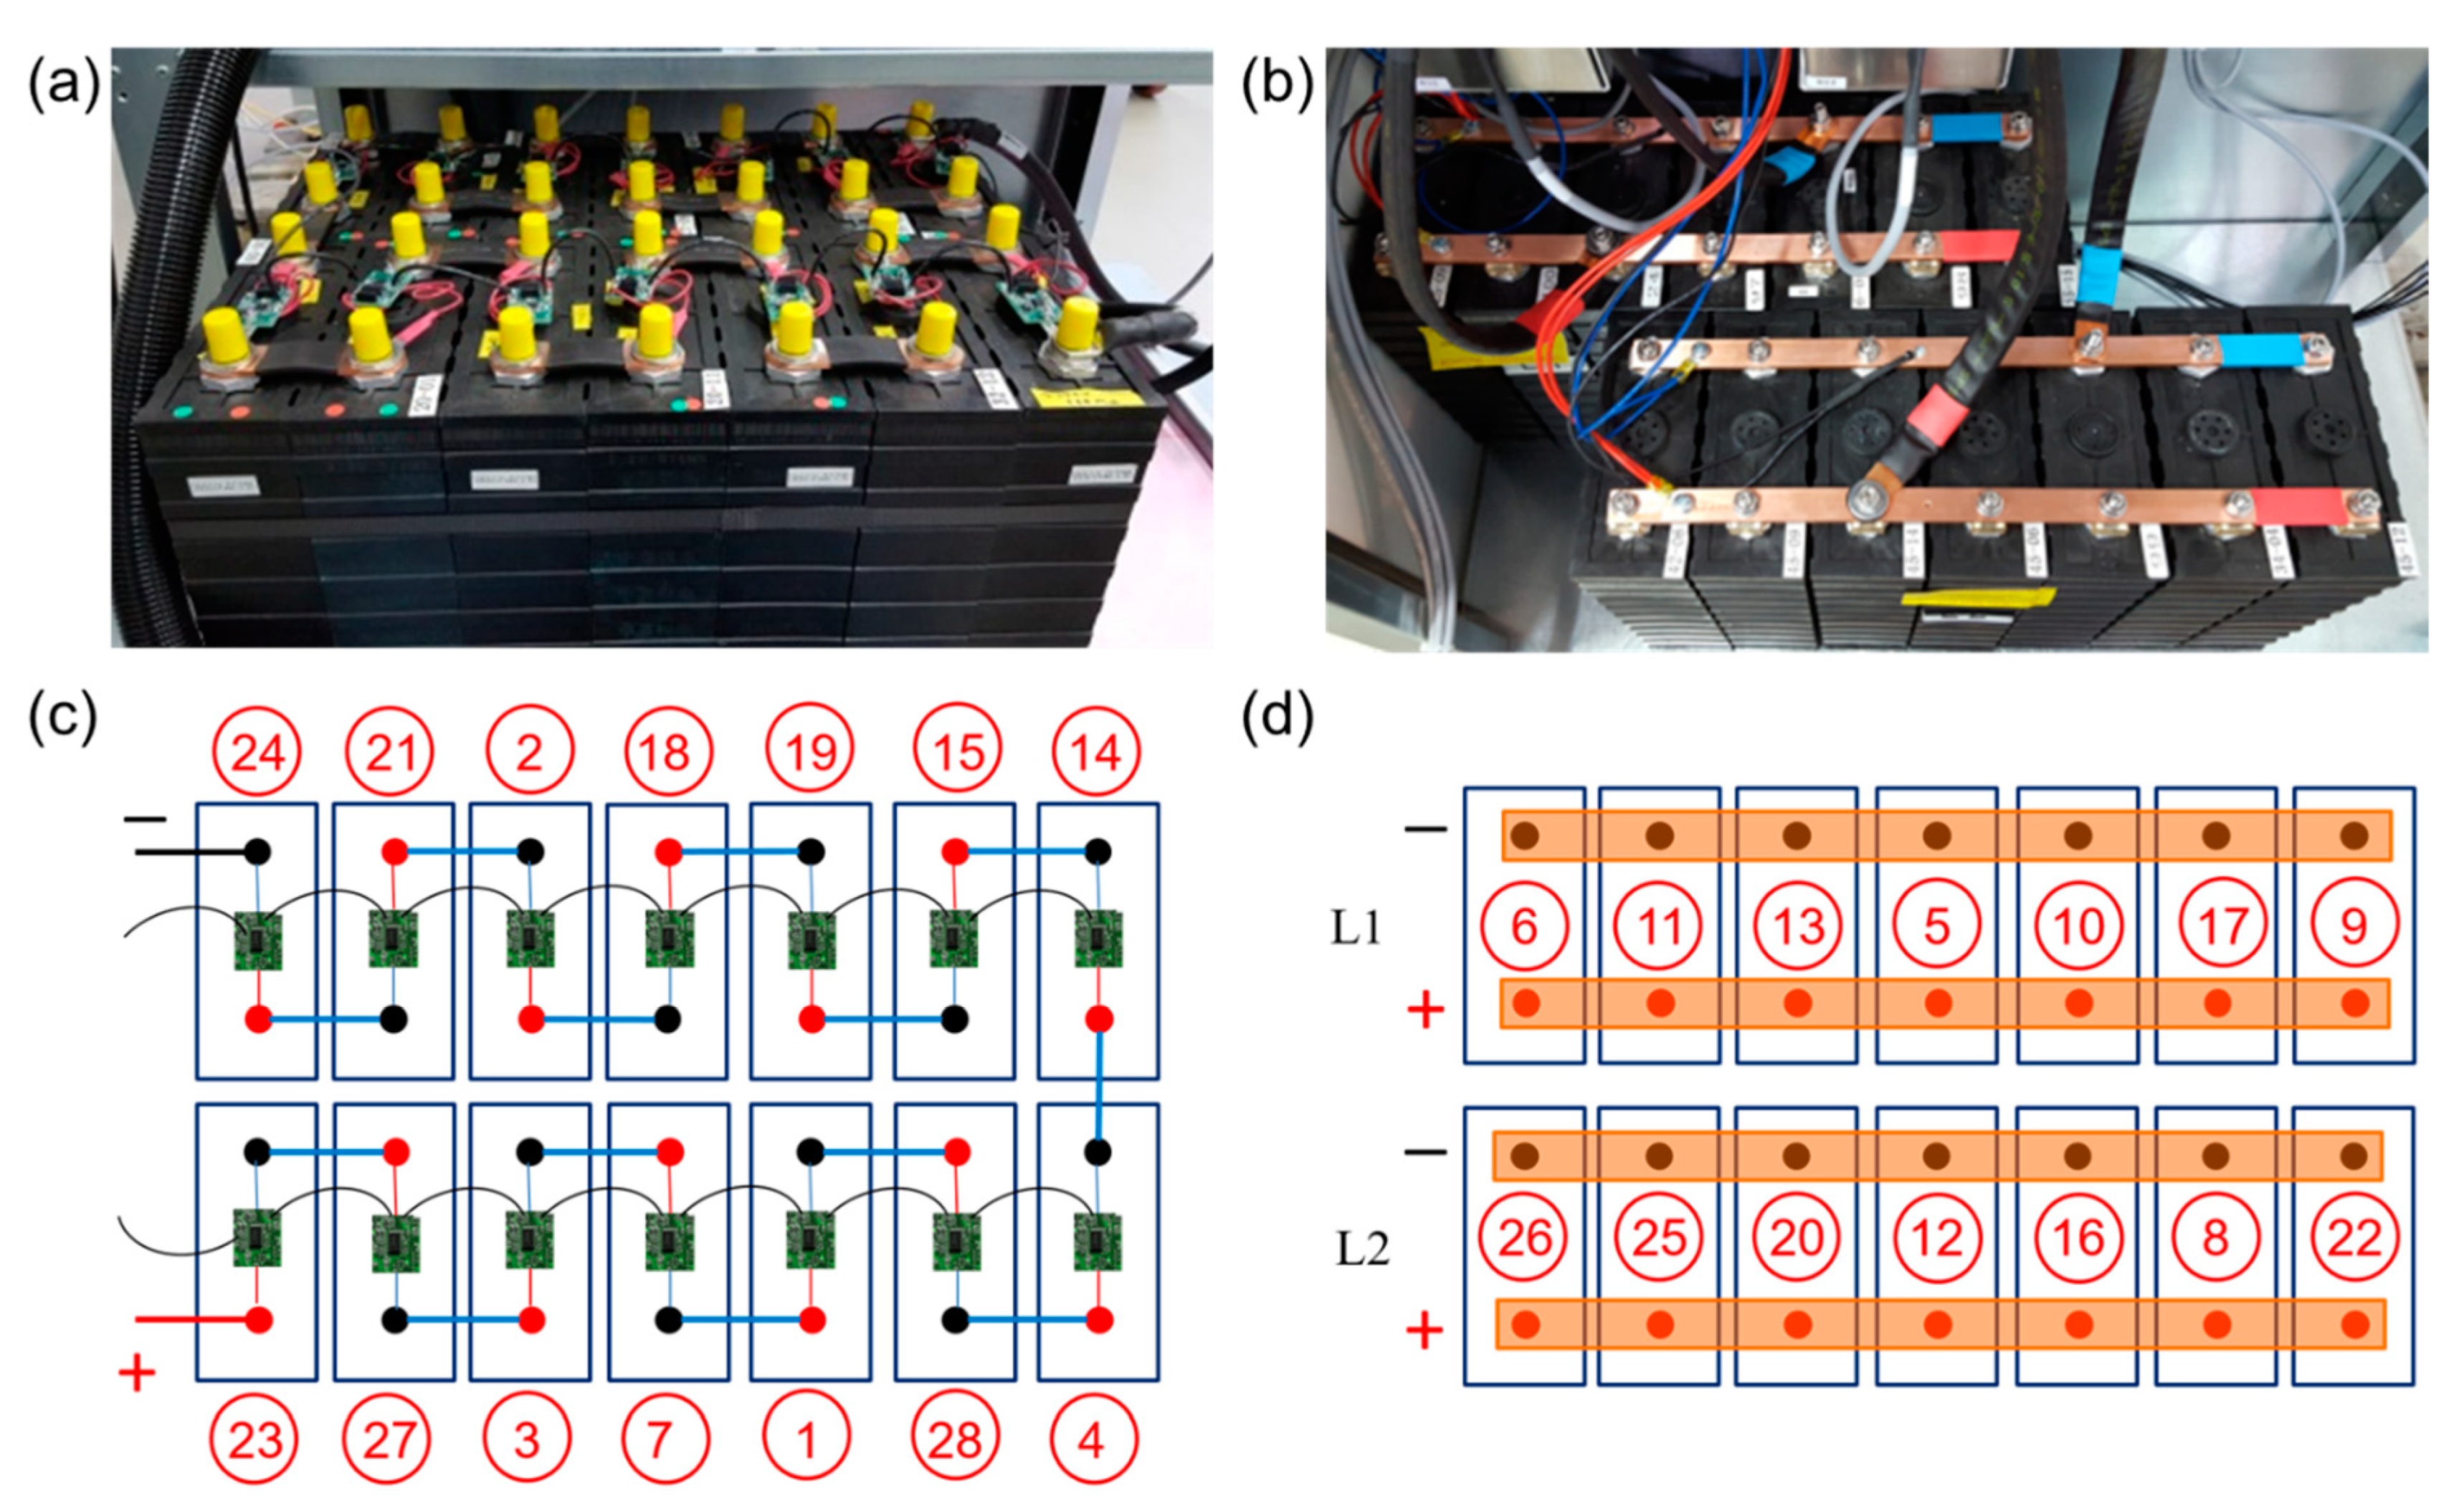
Two commercial stationary energy storage battery systems (ASD Automatic Storage Device GmbH, Umkirch, Germany) with different battery architectures were used for battery-level tests. The two cell configurations are shown in
Figure 1. Each battery has a total of 14 single cells packed closely inside the respective battery cabinets. A standard configuration, in the following referred to as
serial battery architecture, is built by serial connection of 14 cells in 14s1p configuration, and operated by a single DC/AC inverter. A novel configuration, in the following referred to as
parallel battery architecture, consists of two strings of seven parallel-connected cells in 1s7p configuration, each string operated by an individual DC/AC inverter. The serial configuration requires microelectronics for cell balancing, as visible in
Figure 1a, while the parallel configuration does not. Here, the individual cell terminals are connected in parallel with current-collection rails made from copper. The two systems feature two different inverters. The serial system has a 48 V (DC)–220 V (AC) 2.4 kW inverter (Studer, Xtender XTM 2600-48). The parallel system features two 4 V (DC)–220 V (AC) inverters (ASD, Pacadu).
The battery systems do not have a dedicated temperature control. There are no active cooling components or fans present in serial system cabinet. The cabinet of the parallel system has two fans (Sunon, DP200A, ca. 160 m3/h). Thus, the laboratory temperature has a strong influence on the cell temperature. The microgrid laboratory, in turn, has no active cooling system and the room temperature is subject to strong seasonal fluctuations. For the present investigations, no additional active cooling systems were installed inside the battery systems or in the laboratory to keep the operating conditions close to real customer usage. The outside air temperature was measured by the weather station of Offenburg University of Applied Sciences mounted on the rooftop of a university building. For each cell stack, the temperature was measured using a temperature sensor (Pt 100) located between two cells.
The single cells were transferred between the battery systems and single-cell testing facilities described in the previous section by disassembling the systems, both for initial characterization and for a total of three checkups over almost three years.
2.3. Microgrid Level
The two battery systems, as delivered by the manufacturer, were integrated into a three-phase microgrid that was developed and set up at the Institute of Sustainable Energy Systems (INES) at Offenburg University of Applied Sciences (Offenburg, Germany) [
27]. The setup is shown in
Figure 2. The microgrid consists of a photovoltaic generator with 6.5 kW nominal power including three inverters (one for each phase, SMA, Sunny Boy 2000 HF, 2 kW), a small wind turbine (BRAUN Windturbinen GmbH, ANTARIS SW5.5 Generator CK 7.5, 4.5 kW), the two battery storage systems (as described above), three controllable loads (one per phase, Chroma Ate Inc., Taoyuan City, Taiwan, 63803 Programmable AC&DC Electronic Load, 3.6 kW), as well as the institute office tract and a battery electric vehicle as consumers. The microgrid can be operated both alone and in connection with the external grid. The central system components are three network managers (one for each phase, Studer XTM 4000-48) (
Figure 2c), which can form an island network and include battery charging and inverter functionality. All components are fully controlled via a programmable logic controller (PLC) (Beckhoff, CX2040). To avoid possible interactions between the investigated battery systems and the inverters of the network managers, the batteries were placed outside the actual microgrid. However, the control and the operating modes were carried out as if they were parts of the microgrid.
For the present study, the two battery systems were operated strictly synchronously. The systems were controlled by the central PLC of the microgrid, which provided time-dependent AC power setpoints to the battery systems that were either given by the user or by an optimization algorithm (cf. below). The charge and discharge currents were continuously monitored and limited (depending on SOC) by the internal energy management of the battery systems. One goal of the present investigations was to study the influence of cell configuration on aging behavior. To obtain reliable results from the long-term cycling test, it had to be ensured that the cells in the two battery systems are subjected to identical loads. The different capacities of the battery systems, which were due to the deviations of the individual cell capacities from their nominal value as discussed in the next section, were compensated for by SOC-controlled charging and discharging, i.e., charging or discharging over a given SOC range in the same period of time. The difference in the AC power required for this was not only due to the difference in cell capacity, but also due to the different system efficiencies resulting from internal energy consumption of power electronics and control of the two systems.
The battery systems were run in two different operating modes. The first mode, referred to as full-cycle mode, was applied with the intention of provoking fast aging. The battery systems were operated in continuous charging (0.15 C) and discharging (0.25 C) between 30% SOC and 100% SOC. One charge–discharge cycle took around 8.5 h. Higher power and thus higher C rates were not possible due to restrictions of the power electronics of the battery systems. The power required during charge was taken from the external grid. The power released during discharge was dissipated by the electronic loads.
Additionally, for a period of 80 days, the systems were operated in a
solar-storage mode, where the batteries were charged from the PV system during the day and discharged into the building during the night. Specifically, this mode was controlled by applying an optimization algorithm developed earlier [
28,
29]. In the present study, two optimization goals were combined: on the one hand, the reduction of load peaks when feeding and drawing energy into the public power grid, and on the other hand the prevention of cell states that are known to cause accelerated aging. The optimization algorithm was realized based on a model-predictive controller (MPC), which includes weather and load forecasts. The reader is referred to [
29] for details. The resulting load profiles are qualitatively similar to what would be expected from a standard controller. It is, therefore, expected that the use of the MPC algorithm does not change the overall conclusions of the present work on battery aging.
4. Discussion
In the previous sections, we presented the aging characteristics of a total of 28 cells operated in two battery systems with different cell configurations. The observed overall capacity loss of ca. 20% after ca. 2.5 years and ca. 850 EFC of operation is rather high for stationary applications, where lifetimes of >5000 EFC (corresponding to ca. 17 years of operation at 300 EFC per year [
30]) are expected. Surprisingly, the single cell tested under laboratory conditions showed significantly lower capacity loss. Several potential reasons can be discussed as the origin of stronger aging of cells under system operation as opposed to cells under laboratory operation: (i) the influence of checkup experiments, (ii) the influence of current rate and cycling depth, (iii) the influence of inverters, (iv) the influence of cell balancing, (v) the influence of temperature. We believe that the influence of checkup tests can be neglected, as each checkup contributed only three full cycles to the total of 810 (serial) and 881 (parallel) equivalent full cycles.
Both a high cycling depth (depth of discharge, DOD) and high currents have been observed to accelerate capacity loss in lithium-ion battery cells [
9,
10,
12]. During microgrid operation, the system cells undergo 70% depth of discharge (DOD) between 100% and 30% SOC during full-cycle mode. In the serial system, throughout full-cycle mode the maximum current is lower than 0.25C (45 A), on average 0.12C (22.1 A) at charge and 0.21C (38.5 A) at discharge. In the parallel system, single-cell currents are not measured separately but, for the sake of comparison, maximum charge and discharge currents can be assumed to be distributed equally to each cell. The maximum charge and discharge currents are calculated as a result of this assumption as 0.16 C (28.6 A) and 0.28 C (51.1 A), respectively. The single cycling cell, on the other hand, was subjected to full cycles (100% DOD) at much higher current (150 A). Therefore, the cycling conditions in the system are significantly softer than those for the single cell. This is opposite to the observation shown in
Figure 10 and therefore cannot explain the difference.
Power electronics, in particular DC–AC inverters, are essential for the integration of stationary storage systems into the AC grid. During inverter operation, the batteries are subjected to fast (typically, 50 Hz) voltage fluctuations, referred to as ripples. These ripples result from incomplete suppression of high-frequency AC harmonics during AC–DC rectification or from electrical noise generated by internal electronic switching operations of the power electronics [
31]. Research performed on various lithium-ion battery types and different waveforms has demonstrated that there is not enough evidence to prove that ripples have an effect on lithium-ion battery aging [
32,
33,
34,
35]. It has been suggested that the electrochemical double-layer capacitance acts as a filter against AC harmonics, thus limiting their effect on cell aging [
33,
35]. On the other hand, it was recently shown that low-frequency harmonics below the corner frequency of the double-layer capacitance causes accelerated aging on NMC cells [
36]. As a result, the effect of the inverters on the aging of the cells under investigation should be further investigated. This is, however, beyond the scope of the present study.
In the serial system, the cells had individual balancing circuits. These circuits induce additional currents and/or microcycles on the cells. The influence of these currents on aging has not been investigated so far, to the best of our knowledge. The parallel system does not have a balancing system; still, it can be expected that passive balancing currents occur between the cells during rest phases, corresponding to additional microcycles. The magnitude of the active or passive balancing currents is expected to be much smaller than the absolute charge and discharge currents. It is, therefore, unlikely that they are at the origin of the strong aging of the systems. Moreover, in the case of parallel configuration, the magnitude of passive balancing currents is expected to be higher in outlier cells, i.e., cells with highest and lowest capacities. However, the comparison of the capacity loss of cells depending on their initial capacities (
Figure 9a) does not show accelerated aging of outlier cells.
The influence of temperature on cell aging has been observed in several studies of LFP cells [
10,
11,
37,
38,
39]. The cylindrical 2.3 Ah cells investigated by Omar et al. showed ca. 15% decreased cycle life when increasing ambient temperature from 25 °C to 40 °C [
10]. In calendaric aging tests of cylindrical 2.3 Ah cells by Sarasketa-Zabal et al., capacity decreased almost three times as fast at 50 °C compared to 30 °C [
11]. Grolleau et al. investigated calendaric aging of 15 Ah cells and measured around 50% capacity loss after 450 days at 60 °C, compared to less than 5% capacity loss at 30 °C [
38]. Safari and Delacourt measured 38% capacity loss of a 2.3 Ah cylindrical cell under cyclic aging at 45 °C, compared to only 11% at 25 °C [
37]. Therefore, it is well established from previous studies that the higher the temperature, the faster the capacity loss. As already shown and discussed above (
Figure 5), the temperatures in the systems show a significant seasonal variation. Additionally, the system cells are closely packed (
Figure 1), which hinders heat transfer out of the cells. As consequence, measured cell-surface temperatures are quite high (up to 40 °C in summer) with strong temporal variation. The single cell was operated at constant 20 °C ambient temperature under strong convection in the climate chamber, and surface temperatures measured by a thermocouple during cycling were constant at 25 °C. Grolleau et al. give a thermal activation energy of 52.1 kJ/mol for the SOC-independent term of their aging model [
38]. Kupper et al. used a thermal activation energy of 55.5 kJ/mol for the aging reaction implemented in their model [
20]. Using a value of 53 kJ/mol, the Arrhenius equation yields a factor of two when increasing temperature from 25 °C (assumed single-cell temperature) to 35 °C (assumed average system-cell temperature). This agrees very well with the observations shown in
Figure 10.
From this discussion, we tentatively conclude that the observed faster capacity loss of the cells operated in the system, as compared to the single-cell cycling experiment, is due to a difference in cell temperatures.
The temperature of individual cells in a battery system depends on the position within the stack. According to the discussion above, this should also affect aging behavior. The capacity losses as a function of the spatial position of the cells is shown in
Figure 11. Indeed, the cells with the lowest capacity loss, in both battery architectures, are the ones at the sides of the stacks where convective heat losses to the ambient atmosphere is possible. Otherwise, for the serial system, there is no clear dependence of aging on cell position. For the parallel system, however, the strongest aging occurs towards the center of the two stacks. This might be associated with the position of the main cables, which are located close to the center of the current collector rails (
Figure 1). Therefore, the rails show the highest currents towards the stack center, which may be associated with highest ohmic heating (which is proportional to current squared) of the rails, higher temperatures of the cells in the center, and therefore stronger aging. The results thus show that the spatial position of cells within the stack does have a clear, albeit weak, influence on aging, and underline the need for a homogeneous thermal design of the battery system. Please note that we did not measure the actual temperature distribution of the stacks.
Assessing the difference in aging between serial and parallel cell configurations was an overall goal of the present investigation. Therefore, the two battery systems were operated strictly synchronously and under same ambient temperature conditions. As a consequence of the different system designs, this still resulted in different current loads and temperatures for the individual battery cells. Still, the difference between average capacity loss of two systems at the end of experiment was only 2.8%, which is within the capacity loss variation of the cells of both systems. We therefore conclude that, despite minor differences, there is no dominant configuration-specific influence on cell aging. The slightly higher capacity losses of the cells in the parallel system are probably due to higher temperature of the cells, as already discussed above. This possibly results from ohmic heating of the current-collection rails and the connection cables. Furthermore, the large initial cell-to-cell capacity variation of up to 30.3 Ah can lead to passive balancing currents between the cells during rest phases, which may cause additional microcycles and additional heat losses.


